big-ip secure web gateway and splunk templates summary · big-ip secure web gateway and splunk...
TRANSCRIPT
BIG-IP Secure Web Gateway and Splunk templates
Summary BIG-IP Secure Web Gateway (SWG) provides 26 specific reports that were created to
ease the integration of F5 BIG-IP SWG logs and the Splunk reporting system. Eleven are
in advanced view report format and fifteen are in a saved search report format. Customers
can use these reports as-is or as templates to create their own customized reports.
Fourteen of the reports can be displayed in graphical form on the BIG-IP SWG Dashboard
with graphical representation. The reports are grouped into four search categories: URLs
and Categories, Users, IP, and Security.
Prerequisites By default, a Splunk server must be installed and configured to receive syslog entries on
UDP port 514. BIG-IP SWG-specific logs are automatically grouped into sourcetype –
“swg_log.” BIG-IP SWG Splunk templates are specifically looking for syslog entries that
contain sourcetype=“swg_log.” Instructions on how to set up BIG-IP SWG logging may be
found at the following link: http://support.f5.com/kb/en-us/products/big-
ip_apm/manuals/product/apm-secure-web-gateway-implementations-11-5-0/7.html
To view Combined Reports in Splunk, you need to enable logging of the session.user.* and
session.client.* session variables in the access policy. Refer to http://support.f5.com/kb/en-
us/solutions/public/11000/200/sol11253.html for details. Note: You can set up the BIG-IP system to send log entries to different ports or to use a different protocol. Then, you need to change the [source::udp:514] line in the $SPLUNK_DIR/etc/apps/SplunkforF5AccessSWG/default/props.conf and inputs.conf files Refer to http://docs.splunk.com/Documentation/Splunk/6.1.1/Data/Monitornetworkports for additional information.
Note: To distinguish from multiple BIG-IP SWG syslog sources, you can add a qualifier to the search command. For example, host=“192.168.1.15” sourcetype=“swg_log” and so on.
These reports were developed and tested using BIG-IP version 11.5.0.
Customization F5 Networks SWG dashboard and saved search reports are placed in your Splunk
installation server’s $SPLUNK_DIR/etc/apps/SplunkforF5AccessSWG/default directory in
XML format. You can add or remove search groups in the
$SPLUNK_DIR/etc/apps/SplunkforF5AccessSWG/default/data/ui/nav/default.xml file. You
can add or remove graphical reports in the
$SPLUNK_DIR/etc/apps/SplunkforF5AccessSWG/default/data/view/SWG_dashboard.xml
file. You can add or remove saved search reports in the
$SPLUNK_DIR/etc/apps/SplunkforF5AccessSWG/default/savedsearch.conf file. Please
refer to http://docs.splunk.com/Documentation/Splunk for detailed customization
instructions.
Advanced Search
Eleven advanced view search reports, URLs requested from category, URLs requested
from hostname, URLs requested by user, URLs requested by user by category, URLs
requested by user by hostname, User’s IP addresses, URLs requested by IP, URLs
requested by IP by category, URLs requested by IP by hostname, URLs requested by user
from Security categories and URLs requested by IP from Security categories can be found
under the $SPLUNK_DIR/etc/apps/SplunkforF5AccessSWG/default/data/ui/views
directory. The files are named category_url.xml, host_url.xml, user_url.xml,
user_category.xml, user_hostname, user_ip.xml, ip_url.xml, ip_category.xml,
ip_hostname, security_user.xml, and security_ip.xml. You can find instructions about how
to build advanced form searches on a Splunk server at
http://docs.splunk.com/Documentation/Splunk/latest/AdvancedDev/AdvancedIntro.
All of these reports use subsearches to retrieve entries from logs and place them into the
main request. The subsearches have time ranges that are hardcoded in the report files.
You can change this time range or even remove it. You can do it by changing or removing
<param name=“earliest”>…</param> from “MultiSelect”.
Security Categories
Some of the reports show the count of blocked requests for URLs and are categorized as
Security. The Security category includes sub-categories such as “Malicious Web Sites,”
“Spyware,” “Advanced Malware Payloads,” and so on. To avoid hardcoding all these
categories in the reports, the
$SPLUNK_DIR/etc/apps/SplunkforF5AccessSWG/securityCategories/catlist file was
created. The SplunkforF5 application created a monitor for this file, so if you want to add a
new security category you can just add a new line at beginning of the file. Or you can
replace this file, specify the categories that you are interested in, and create another
report. For example, you can include a counter that shows how many requests were made
to Entertainment, Facebook, and Twitter URLs in the last 24 hours. Actually, you can view
“Security stats” and “Security blocks” reports from the
$SPLUNK_DIR/etc/apps/SplunkforF5AccessSWG/default/savedsearches.conf file and
monitor definitions in the
$SPLUNK_DIR/etc/apps/SplunkforF5AccessSWG/default/input.conf file to create your own
similar reports.
Alerts
Splunk has the ability to generate alerts based on collected statistics. Alerts occur as a
result of reports that are run regularly. When the alerts trigger, different actions can take
place, such as sending of an email with the results of the triggering search to a predefined
list of people. Four examples of possible alerts can be found in the
$SPLUNK_DIR/etc/apps/SplunkforF5AccessSWG/default/savedsearches.conf file. For
them to work, you need to change “action.emai.to” to the recipient email address and set
“enableSched” to 1.
Please refer to http://docs.splunk.com/Documentation/Splunk/6.1.1/Alert/Aboutalerts for
detailed information.
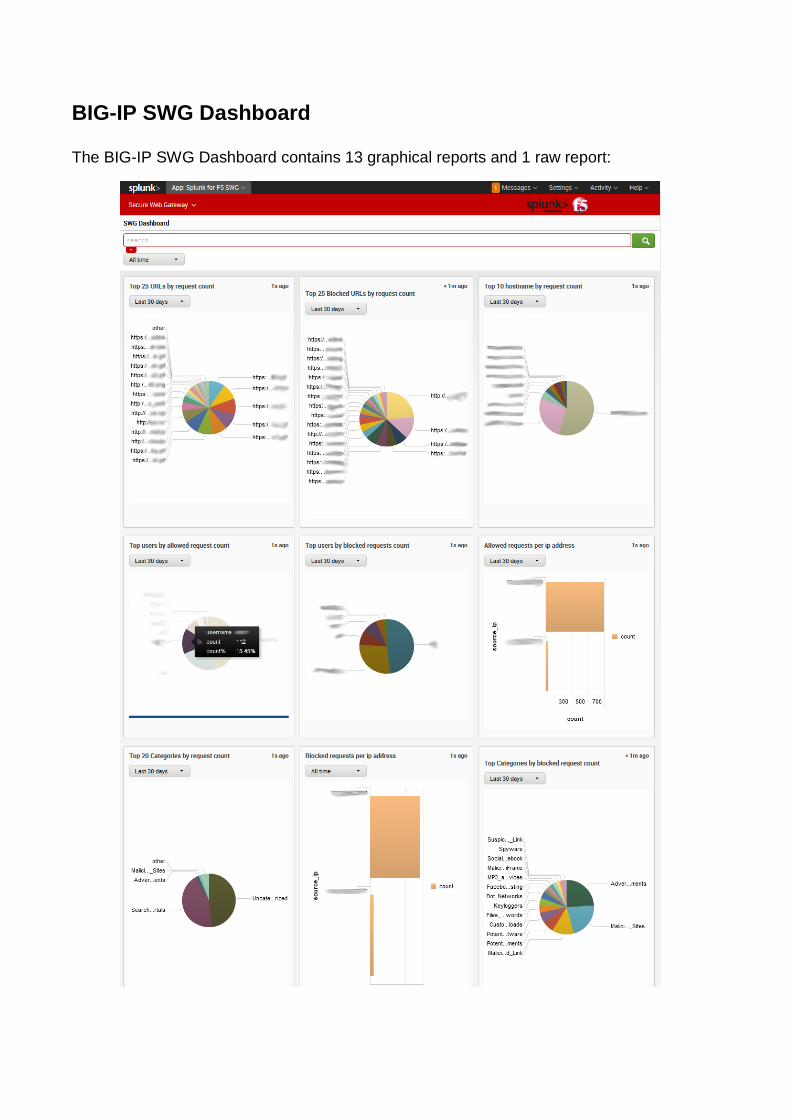
BIG-IP SWG Dashboard
The BIG-IP SWG Dashboard contains 13 graphical reports and 1 raw report:
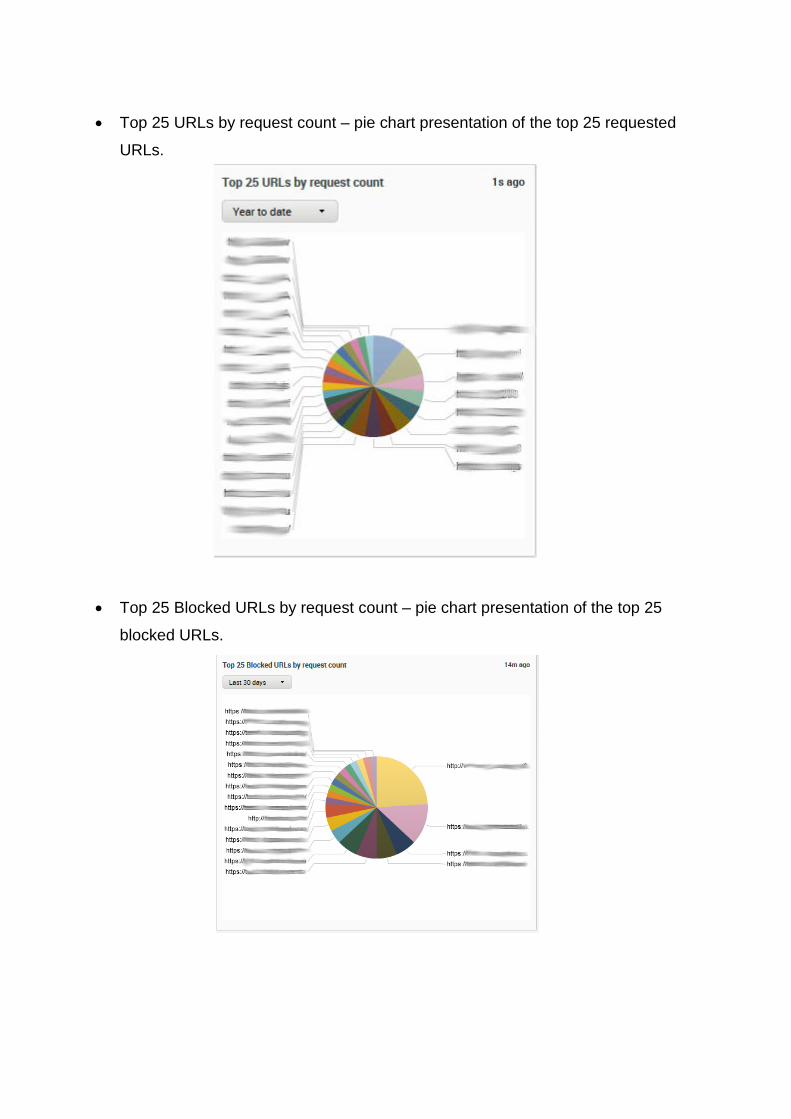
• Top 25 URLs by request count – pie chart presentation of the top 25 requested
URLs.
• Top 25 Blocked URLs by request count – pie chart presentation of the top 25
blocked URLs.

• Top 10 hostname by request count – pie chart presentation of the top 10 requested
hostnames.
• Top users by allowed request count – pie chart presentation of the top 20 users by
allowed request count.

• Top user by blocked requests count – pie chart presentation of the top 20 users by
blocked request count.
• Allowed requests per IP address – bar chart presentation of allowed request count
per IP address.

• Top 20 Categories by request count – pie chart presentation of the 20 most
requested categories.
• Blocked requests per IP address – bar chart presentation of the blocked request
count per IP address.

• Top Categories by blocked request count – pie chart presentation of the top 20
categories by blocked request count.
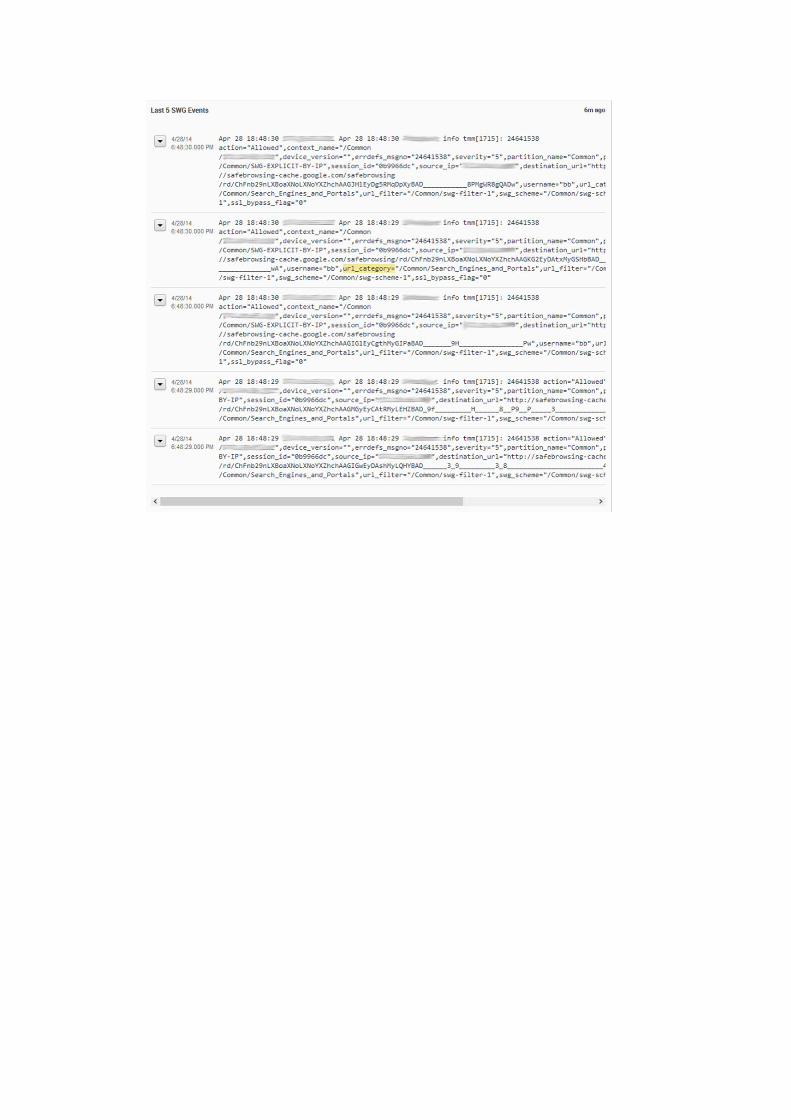
• Last 5 SWG Events – raw syslog entry presentation of the last 5 BIG-IP SWG
events.

• HTTP/HTTPS request count – column chart presentation of the HTTP and HTTPS
request count.
• Recent 5 active sessions – table that shows information about 5 recent active
sessions.

• Unique client IP-addresses count – counter that shows how many unique client
source IP addresses appear in logs.
• Security blocked requests count last 24 hours – counter that shows how many requests were blocked because of security categories.
Note: Most widgets on the dashboard have own TimeRangePicker. One of the options it provides is All time. By default, this option searches through all events on the Splunk server. This behavior may be unacceptable if there is a large amount of data on the server. So, you can change the search range by deleting comments in savedsearches.conf on all lines that contain “dispatch.*_time” and setting a more limited time period. Or, you can disable the All time option by creating a file called times.conf that contains the following lines:
[all_time]
disabled = 1 You may want to switch one type of chart presentation to another. You can do it changing <param name=“chart”>…</param> of “HiddenChartFormatter” related to report you want to change in SWG_dashboard.xml file located in the $SPLUNK_DIR/etc/apps/SplunkforF5AccessSWG/default/data/ui/views directory.

Details on Splunk BIG-IP SWG Reports
Top URL requested – Report
This report searches for swg_log entries and chart count by destination_url. Then it sorts
by count and takes the first 25.
Actual search command: search = sourcetype=”swg_log” | chart count by destination_url | sort limit=25 – count.

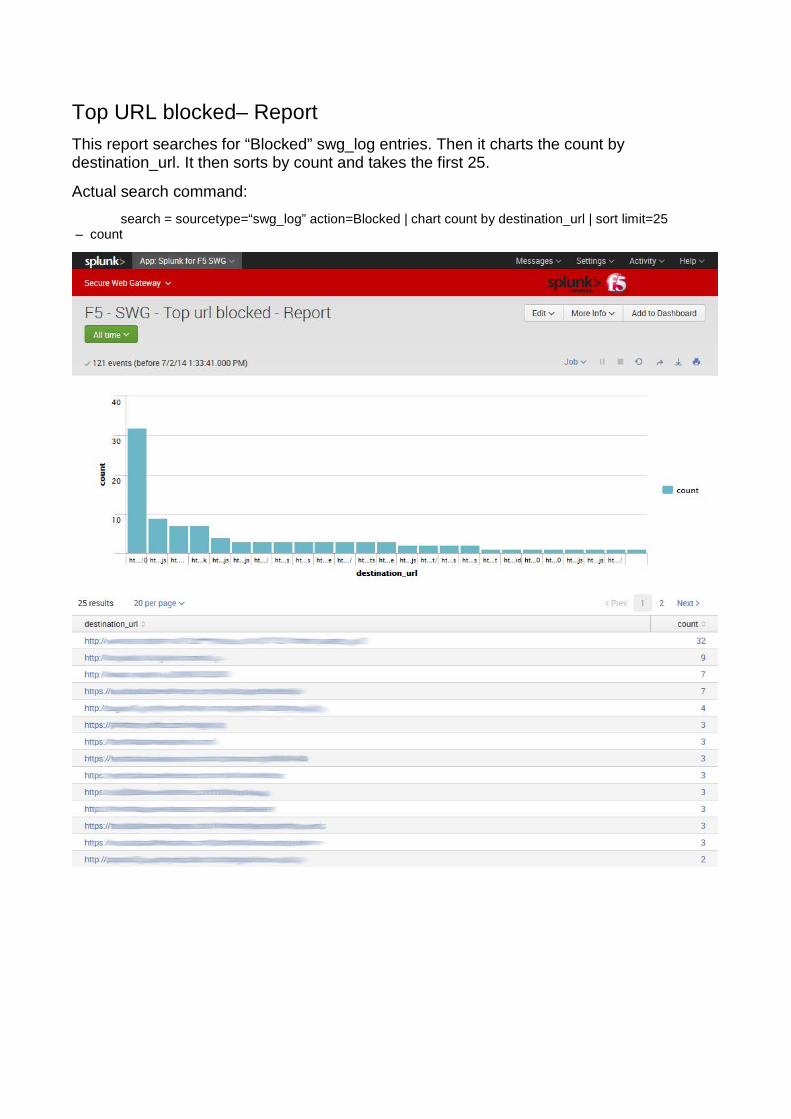
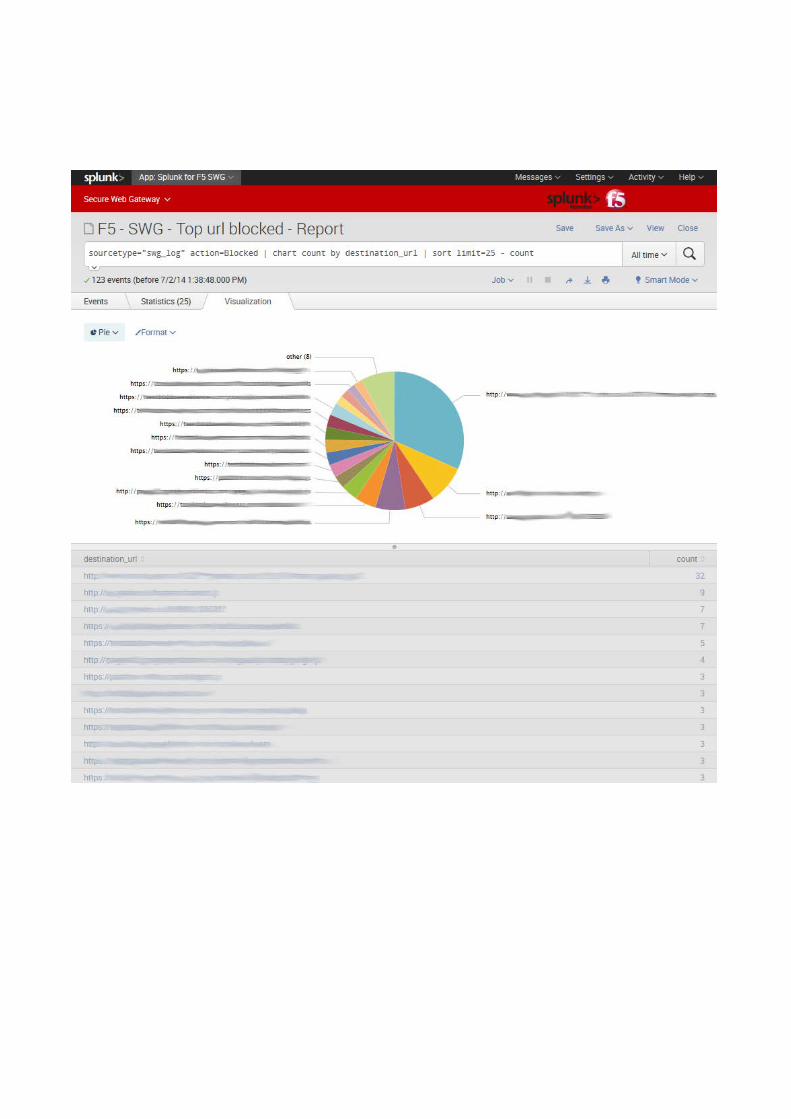
Top URL blocked– Report This report searches for “Blocked” swg_log entries. Then it charts the count by destination_url. It then sorts by count and takes the first 25.
Actual search command: search = sourcetype=“swg_log” action=Blocked | chart count by destination_url | sort limit=25 – count

Top 10 hostname requested – Report This report searches for swg_log entries. It extracts hostname from the destination_url field, then charts the count by hostname. It sorts by count and displays the first 10.
Actual search command:search = sourcetype=“swg_log”| rex field=destination_url “[?:http|https]://(?hostname[^/]*)” | chart count by hostname| sort limit=10 – count
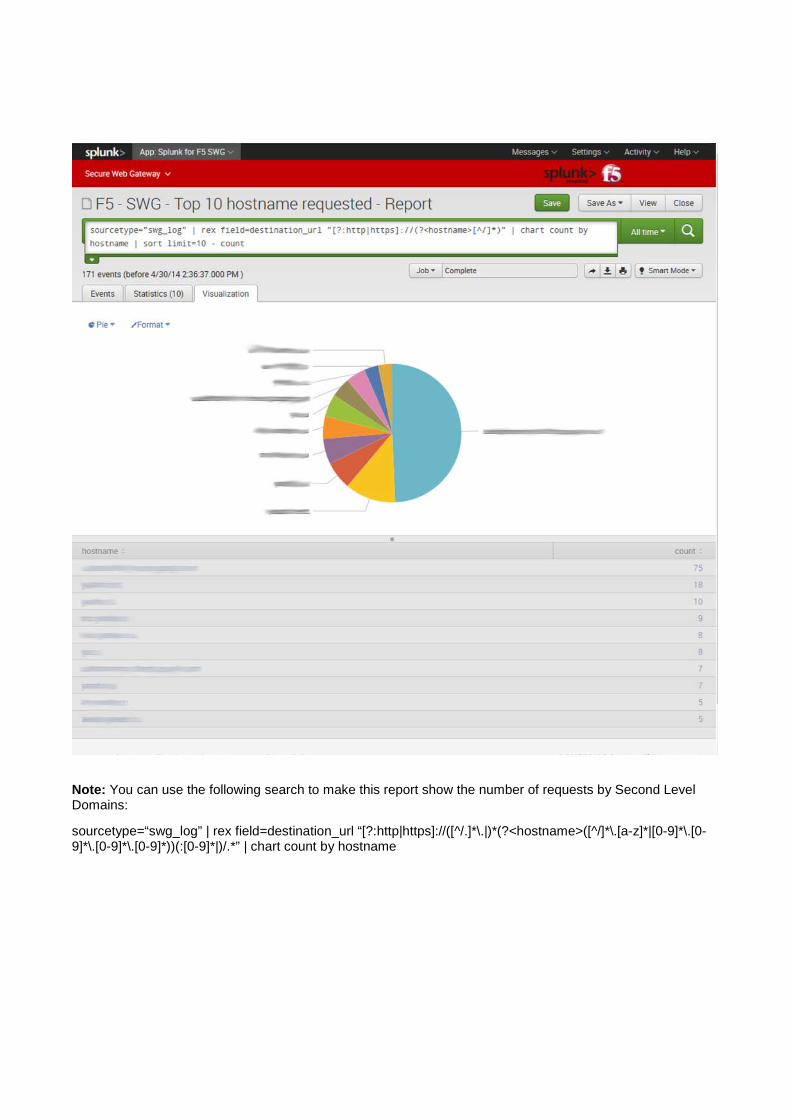
Note: You can use the following search to make this report show the number of requests by Second Level Domains:
sourcetype=“swg_log” | rex field=destination_url “[?:http|https]://([^/.]*\.|)*(?<hostname>([^/]*\.[a-z]*|[0-9]*\.[0-9]*\.[0-9]*\.[0-9]*))(:[0-9]*|)/.*” | chart count by hostname
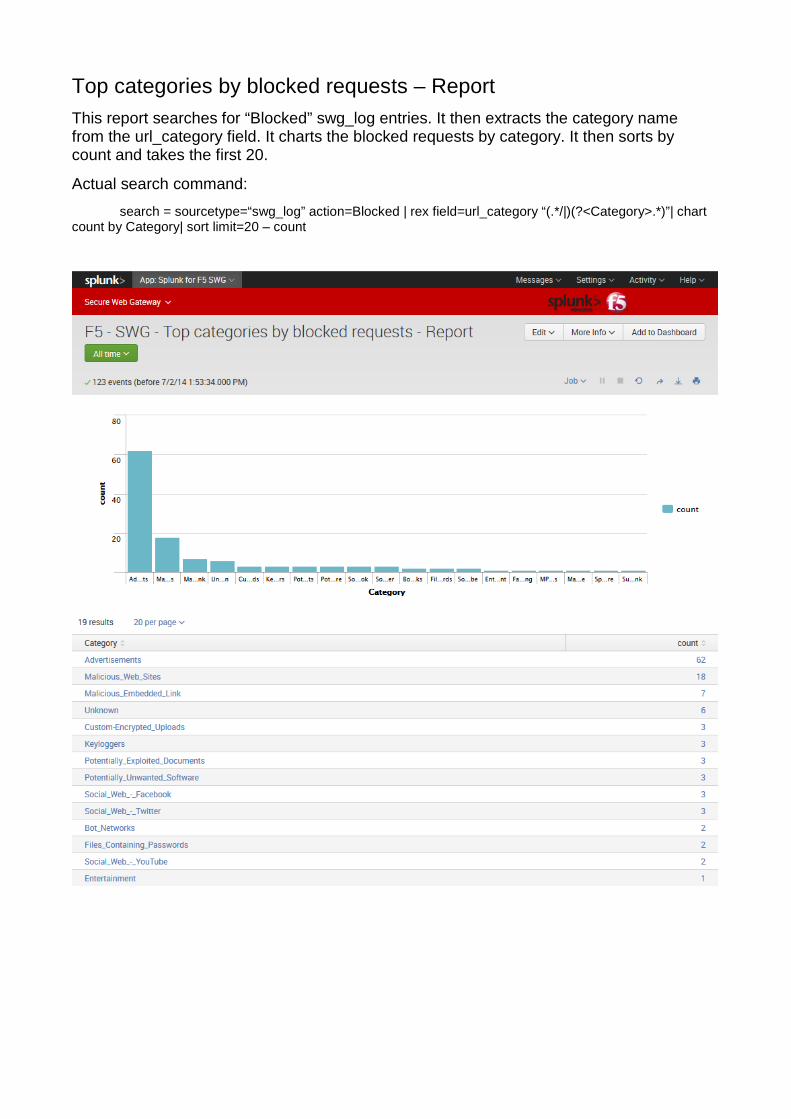
Top categories by blocked requests – Report This report searches for “Blocked” swg_log entries. It then extracts the category name from the url_category field. It charts the blocked requests by category. It then sorts by count and takes the first 20.
Actual search command:
search = sourcetype=“swg_log” action=Blocked | rex field=url_category “(.*/|)(?<Category>.*)”| chart count by Category| sort limit=20 – count

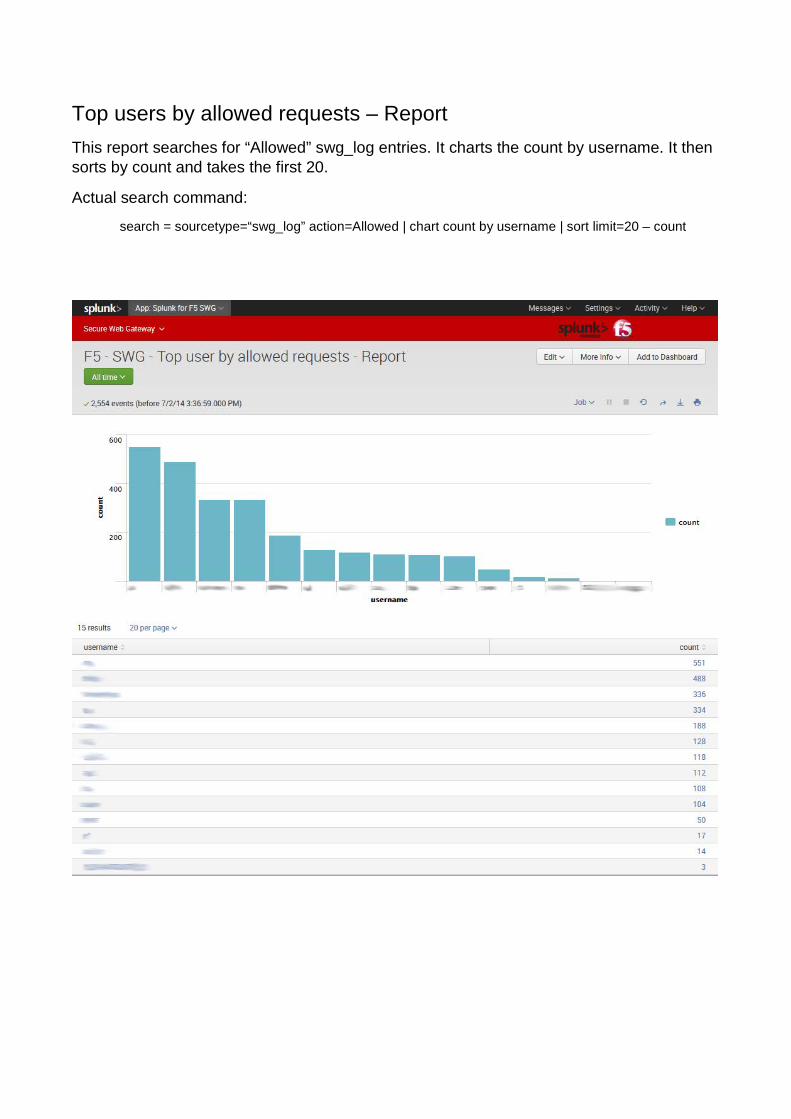
Top users by allowed requests – Report This report searches for “Allowed” swg_log entries. It charts the count by username. It then sorts by count and takes the first 20.
Actual search command:
search = sourcetype=“swg_log” action=Allowed | chart count by username | sort limit=20 – count


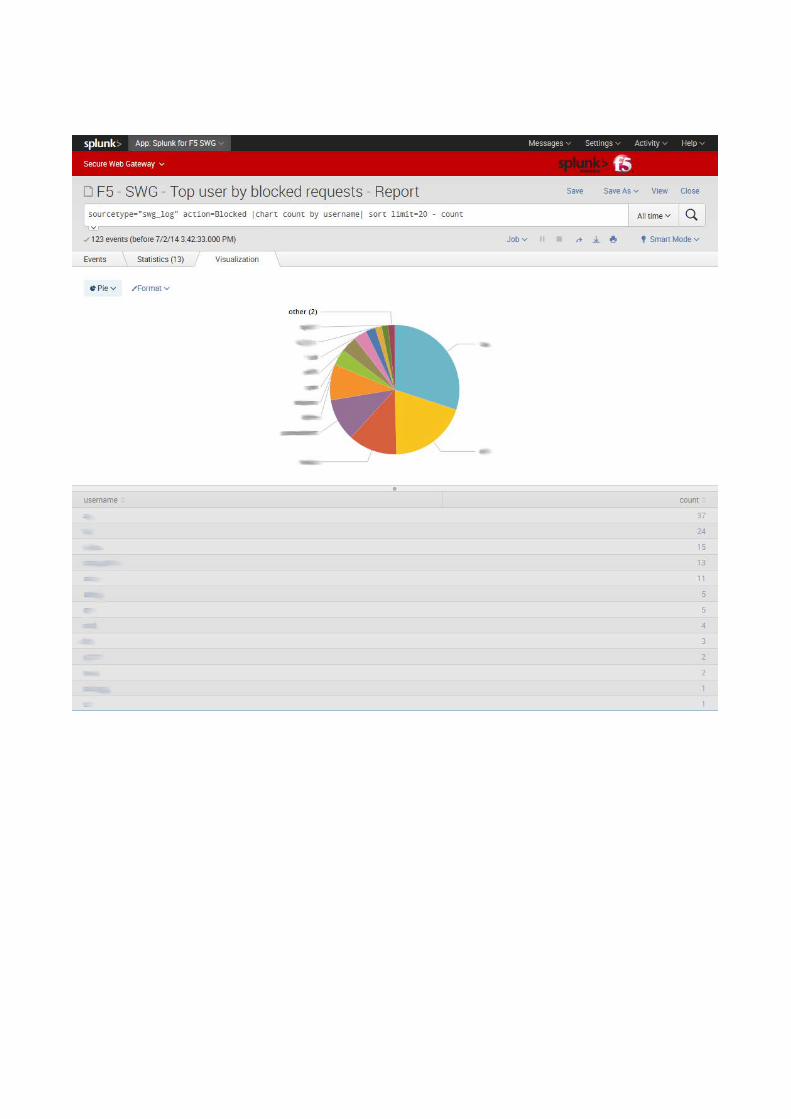
Top users by blocked requests – Report This report searches for “Blocked” swg_log entries. It charts the count by username. It sorts by the count and takes the first 20.
Actual search command:
search = sourcetype=“swg_log” action=Blocked | chart count by username | sort limit=20 - count

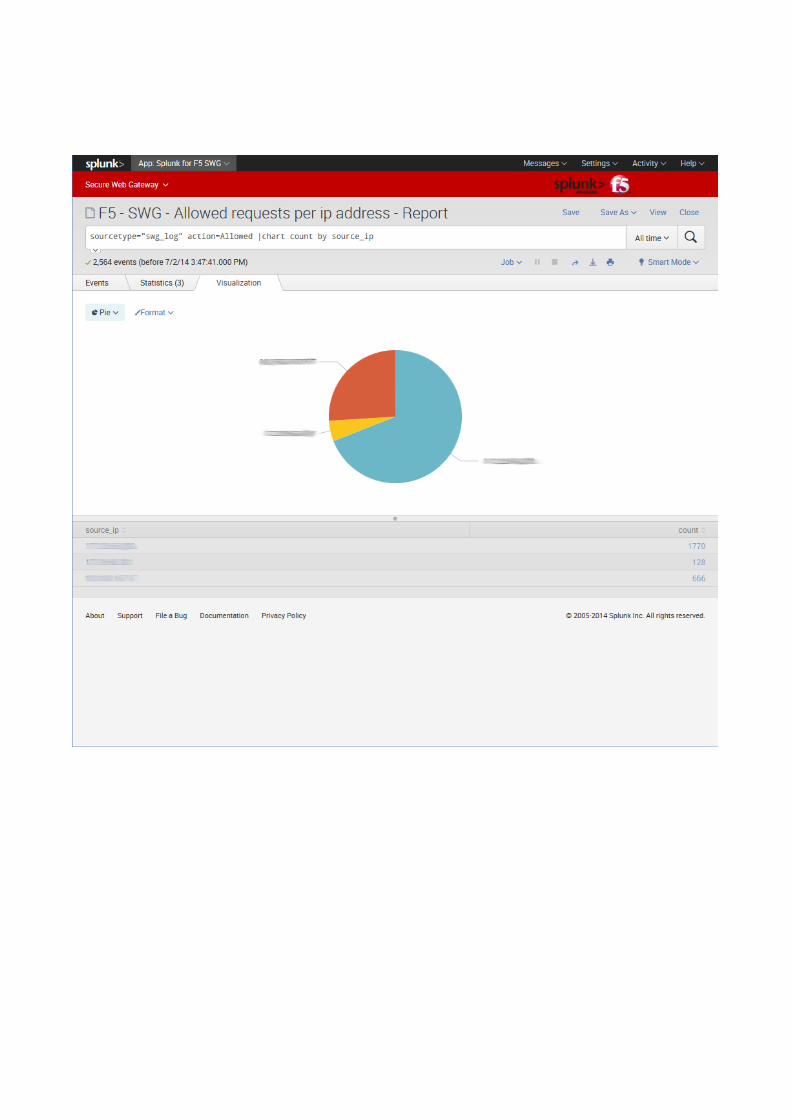
Allowed requests per IP address – Report This report searches for “Allowed” swg_log entries. It charts the count by source IP address.
Actual search command:
search = sourcetype=“swg_log” action=Allowed | chart count by source_ip
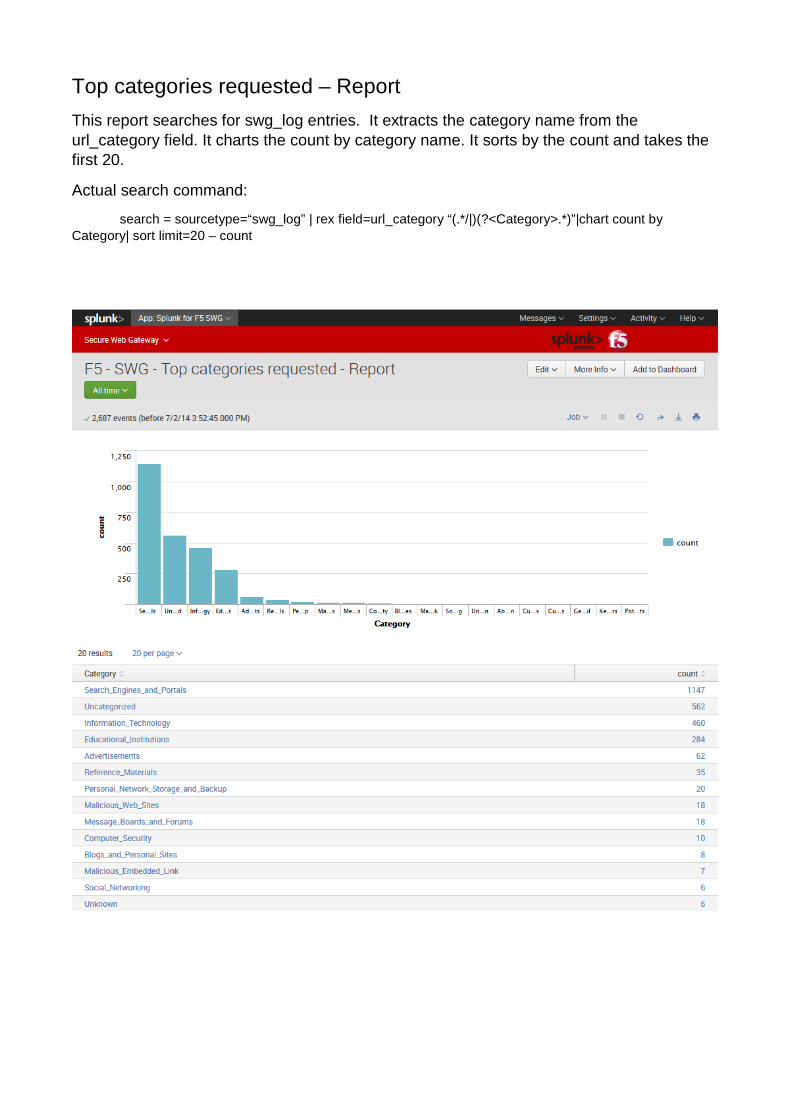
Top categories requested – Report This report searches for swg_log entries. It extracts the category name from the url_category field. It charts the count by category name. It sorts by the count and takes the first 20.
Actual search command:
search = sourcetype=“swg_log” | rex field=url_category “(.*/|)(?<Category>.*)”|chart count by Category| sort limit=20 – count

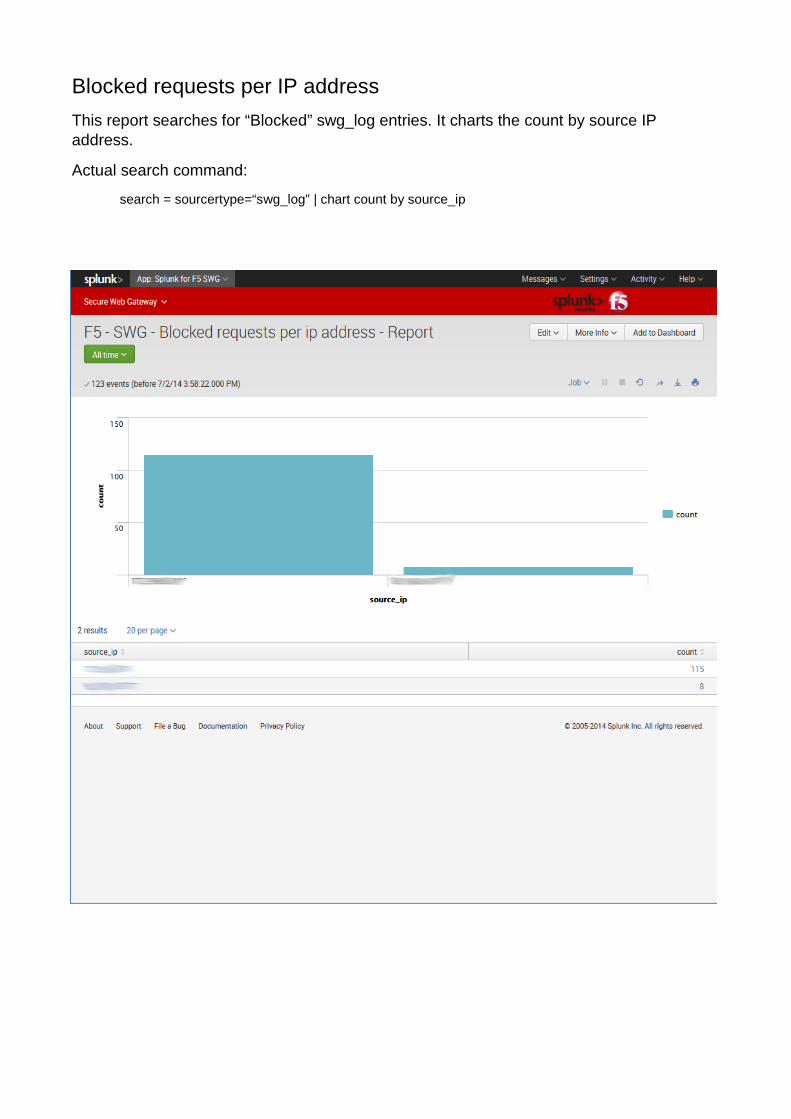
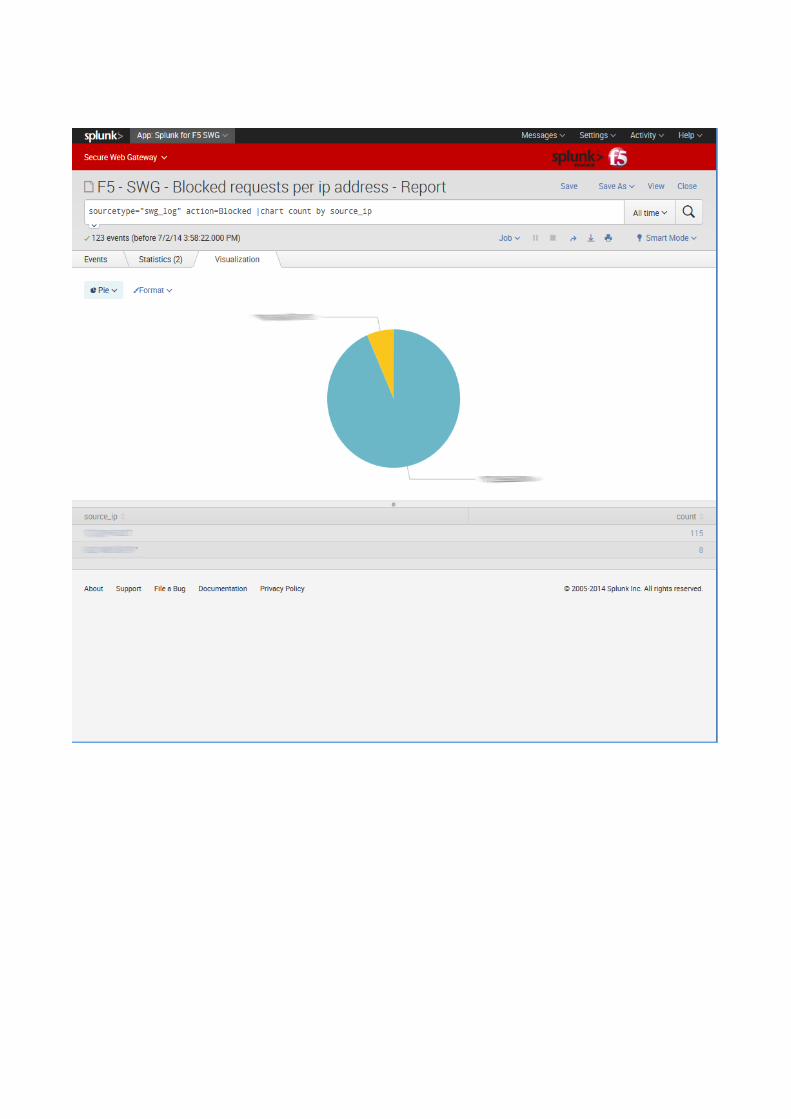
Blocked requests per IP address This report searches for “Blocked” swg_log entries. It charts the count by source IP address.
Actual search command:
search = sourcertype=“swg_log” | chart count by source_ip

HTTP/HTTPS request count This report searches for swg_log entries. It charts destination URLs that match “https://.*” or “http://.*” and displays them by host.
Actual search command:
search = sourcetype=“swg_log” | chart count(eval(match(destination_url, “https://.*”))) as “https”, count(eval(match(destination_url, “http://.*”))) by host

Recent 5 active session This report searches for swg_log entries. It removes entries that contain the same username, session_id, and source_ip. It sorts by time and takes the first 5 entries. It tabulates the username, session_id, and source_ip.
Actual search command:
search = sourcetype=“swg_log” | dedup username, session_id, source_ip |sort limit=5 - _time| table username, session_id, source_ip
Note: You can also add time column to this table replaced “table username, session_id, source_ip” by “table _time, username, session_id, source_ip”
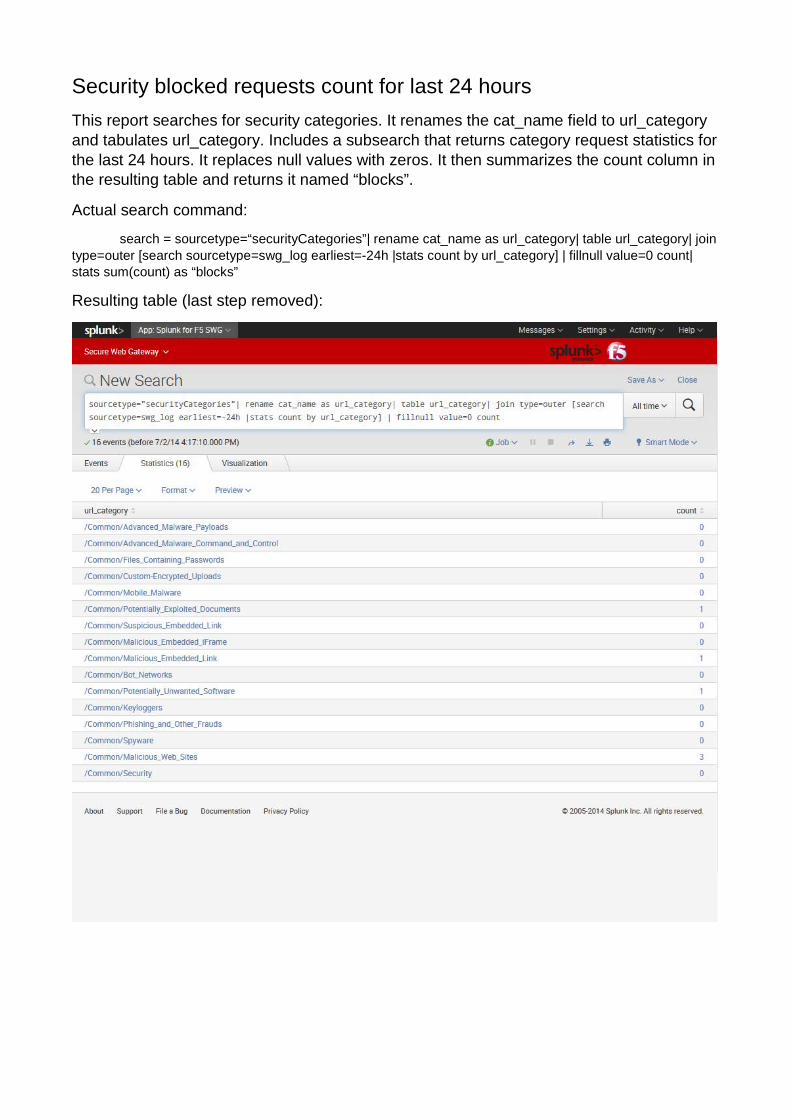
Security blocked requests count for last 24 hours This report searches for security categories. It renames the cat_name field to url_category and tabulates url_category. Includes a subsearch that returns category request statistics for the last 24 hours. It replaces null values with zeros. It then summarizes the count column in the resulting table and returns it named “blocks”.
Actual search command:
search = sourcetype=“securityCategories”| rename cat_name as url_category| table url_category| join type=outer [search sourcetype=swg_log earliest=-24h |stats count by url_category] | fillnull value=0 count| stats sum(count) as “blocks”
Resulting table (last step removed):

Security stats This report is the same as the Security blocks requests count for last 24 hours report except the last step and subsearch search through all data not only for the last 24 hours.
Actual search command:
search = sourcetype=“securityCategories” earliest=1| rename cat_name as url_category| table url_category| join type=outer [search sourcetype=swg_log |stats count by url_category] | fillnull value=0 count
Note: The outer search includes earliest=1 because the Security Categories events are filled only once, and the time range does not need to be applied to retrieving security events.

URLs requested from Category This is an advanced view search report. Please refer to $SPLUNK_DIR/etc/apps/SplunkforF5AccessSWG/default/data/ui/views/category_url.xml for detailed implementation information.
All advanced reports include the ability to multiple select.

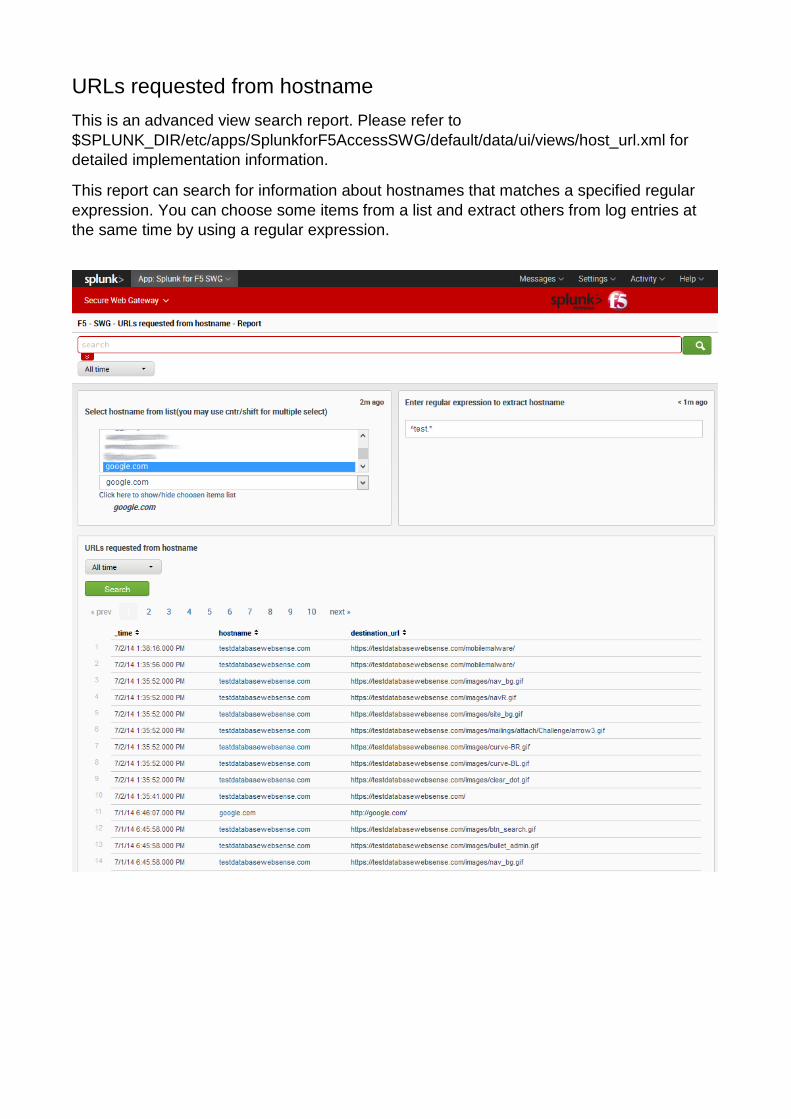
URLs requested from hostname This is an advanced view search report. Please refer to $SPLUNK_DIR/etc/apps/SplunkforF5AccessSWG/default/data/ui/views/host_url.xml for detailed implementation information.
This report can search for information about hostnames that matches a specified regular expression. You can choose some items from a list and extract others from log entries at the same time by using a regular expression.
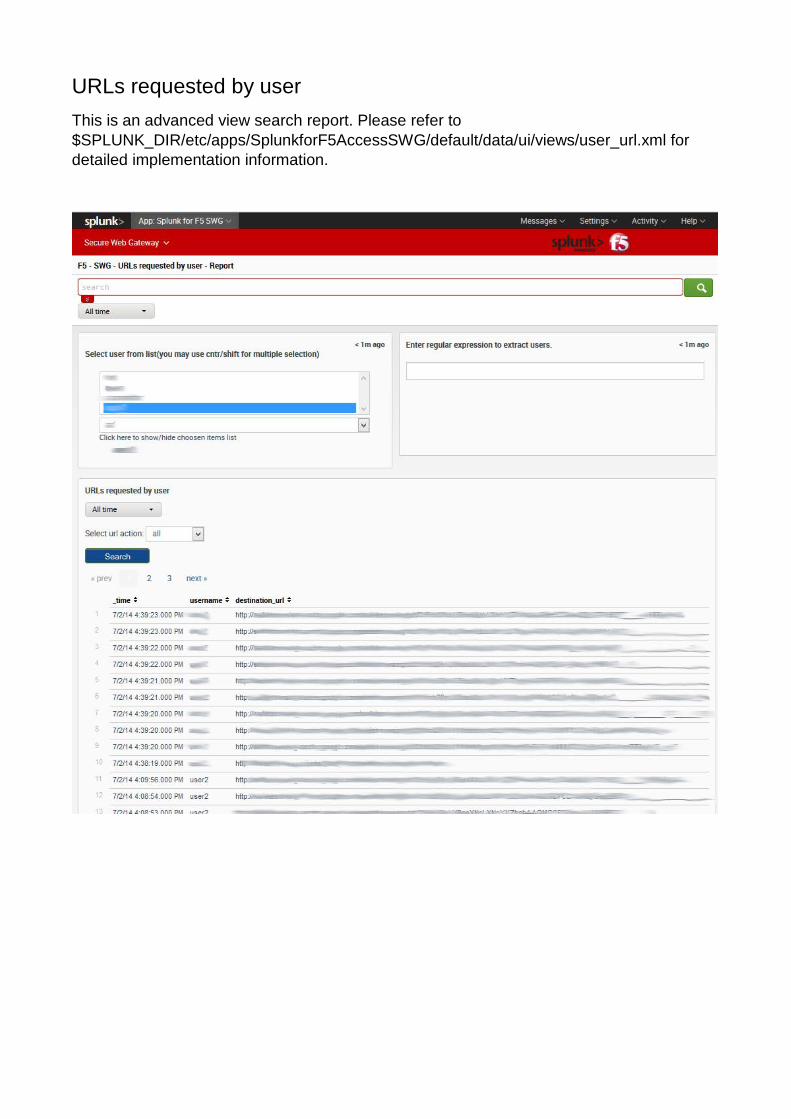
URLs requested by user This is an advanced view search report. Please refer to $SPLUNK_DIR/etc/apps/SplunkforF5AccessSWG/default/data/ui/views/user_url.xml for detailed implementation information.

URLs requested by user by category This is an advanced view search report. Please refer to $SPLUNK_DIR/etc/apps/SplunkforF5AccessSWG/default/data/ui/views/user_category.xml for detailed implementation information.
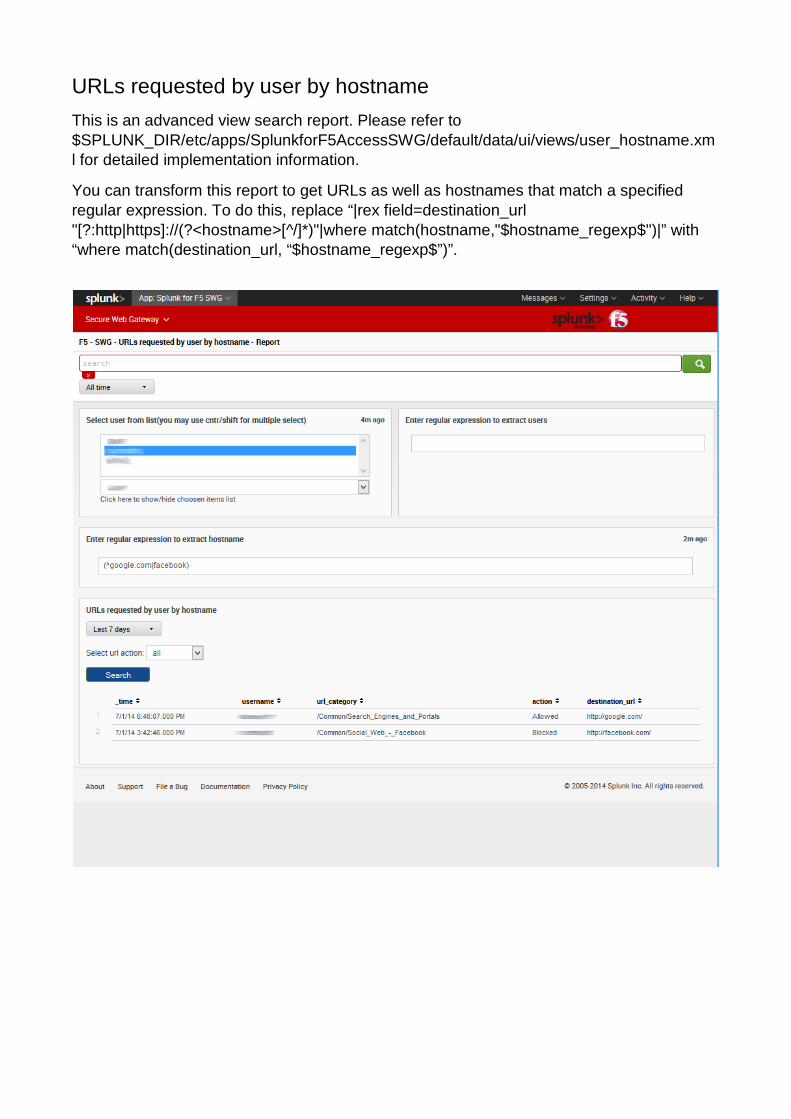
URLs requested by user by hostname This is an advanced view search report. Please refer to $SPLUNK_DIR/etc/apps/SplunkforF5AccessSWG/default/data/ui/views/user_hostname.xml for detailed implementation information.
You can transform this report to get URLs as well as hostnames that match a specified regular expression. To do this, replace “|rex field=destination_url "[?:http|https]://(?<hostname>[^/]*)"|where match(hostname,"$hostname_regexp$")|” with “where match(destination_url, “$hostname_regexp$”)”.
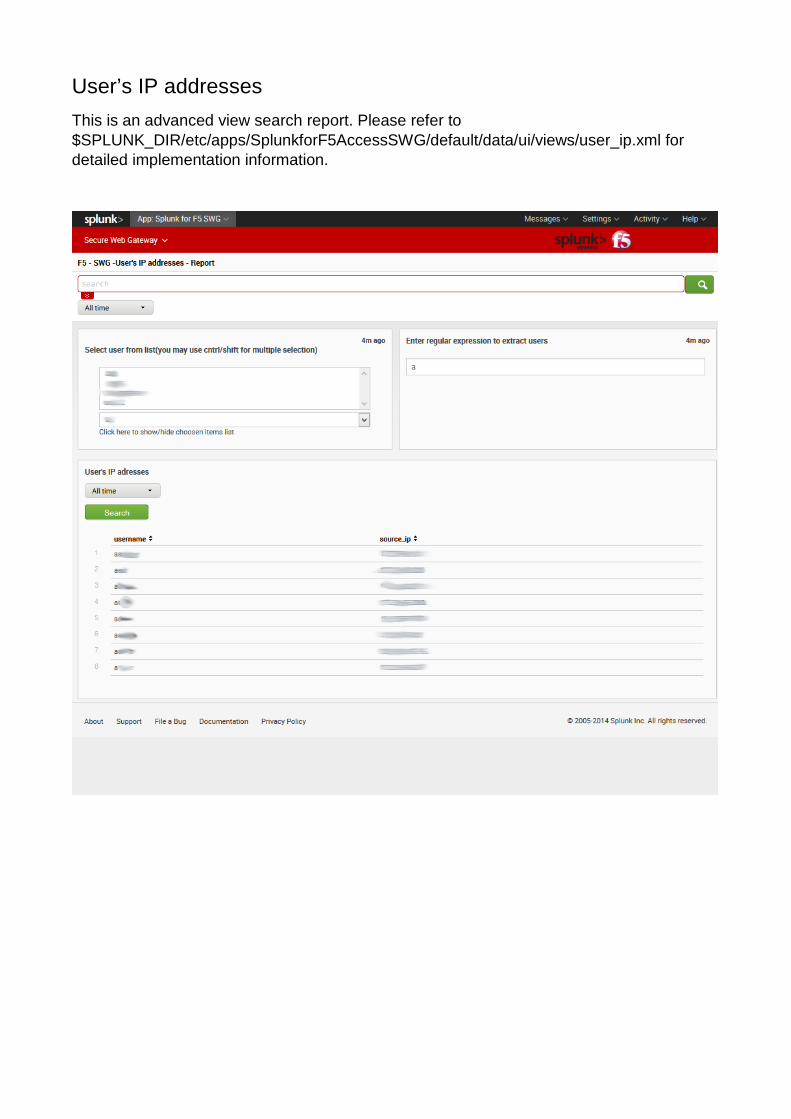
User’s IP addresses This is an advanced view search report. Please refer to $SPLUNK_DIR/etc/apps/SplunkforF5AccessSWG/default/data/ui/views/user_ip.xml for detailed implementation information.
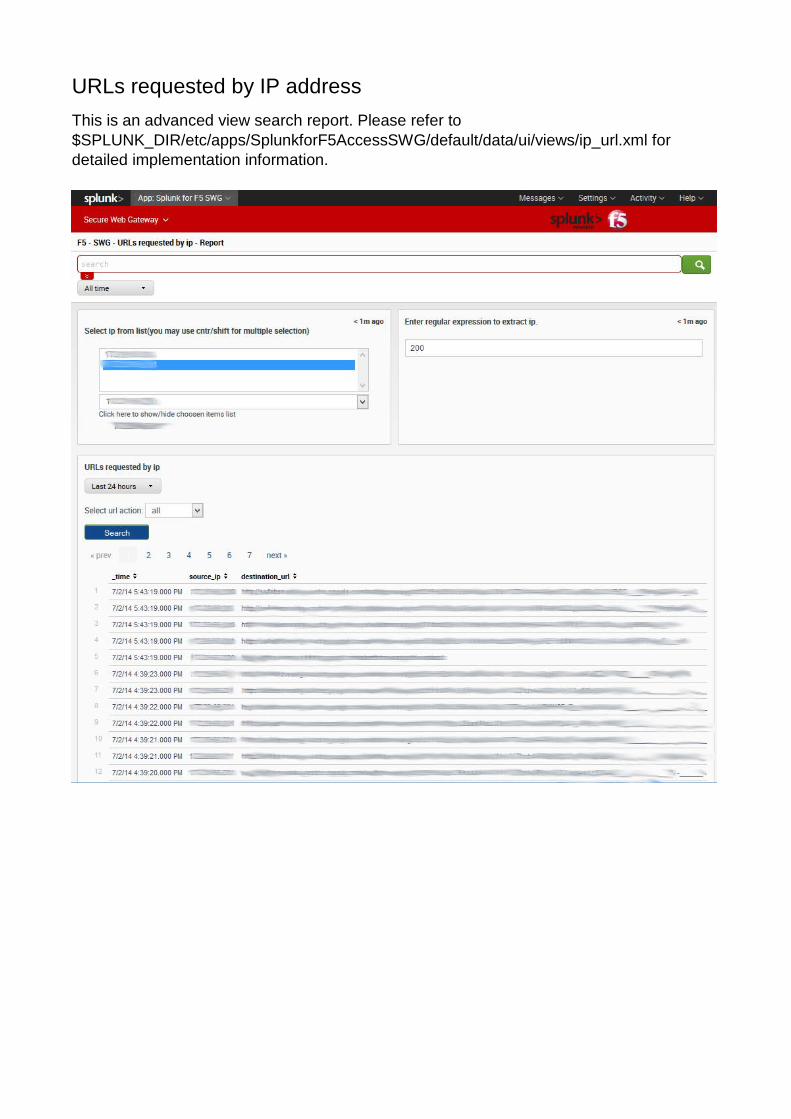
URLs requested by IP address This is an advanced view search report. Please refer to $SPLUNK_DIR/etc/apps/SplunkforF5AccessSWG/default/data/ui/views/ip_url.xml for detailed implementation information.

URLs requested by IP by category This is an advanced view search report. Please refer to $SPLUNK_DIR/etc/apps/SplunkforF5AccessSWG/default/data/ui/views/ip_category.xml for detailed implementation information.

URLs requested by IP by hostname This is an advanced view search report. Please refer to $SPLUNK_DIR/etc/apps/SplunkforF5AccessSWG/default/data/ui/views/ip_hostname.xml for detailed implementation information.
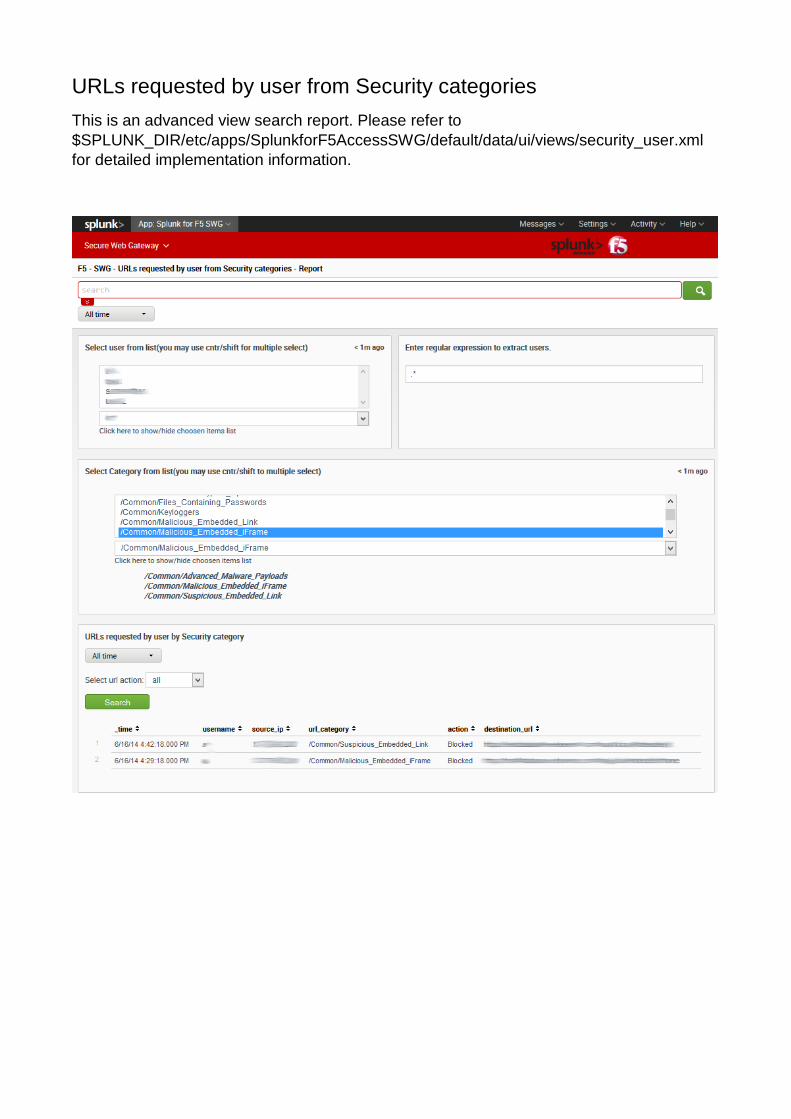
URLs requested by user from Security categories This is an advanced view search report. Please refer to $SPLUNK_DIR/etc/apps/SplunkforF5AccessSWG/default/data/ui/views/security_user.xml for detailed implementation information.
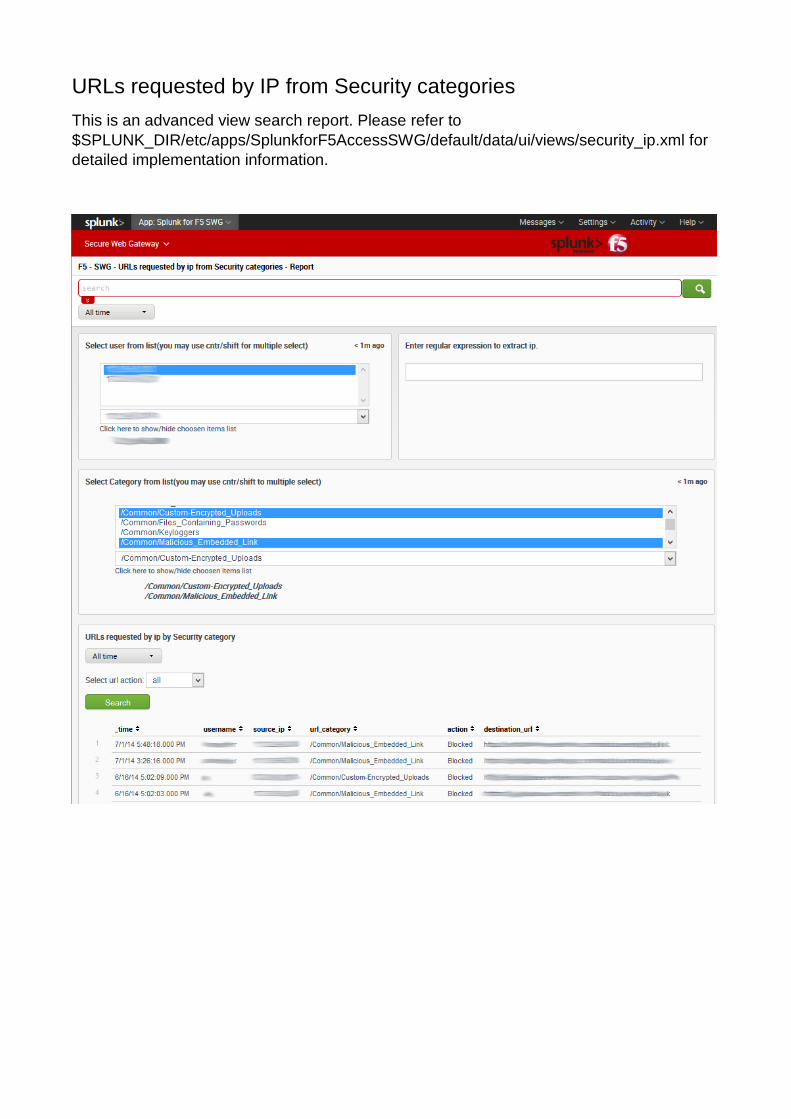
URLs requested by IP from Security categories This is an advanced view search report. Please refer to $SPLUNK_DIR/etc/apps/SplunkforF5AccessSWG/default/data/ui/views/security_ip.xml for detailed implementation information.

© 2014 F5 Networks, Inc. All rights reserved. F5, F5 Networks, the F5 logo, BIG-IP, FirePass, iControl, TMOS, and VIPRION are trademarks or registered trademarks of
F5 Networks, Inc. in the U.S. and in certain other countries.