big vs agile? - ernst & young€¦ · 05/12/2018 · big vs agile? global ipo trends: q4 2018....
TRANSCRIPT

Big vs agile?Global IPO trends: Q4 2018Mega and unicorn IPOs characterize 2018 deal landscape; trend to continue in 2019
The better the question. The better the answer. The better the world works.

ContentsGlobal IPO market 3Americas 7Asia-Pacific 11Europe, Middle East, India and Africa 21Appendix 30About this report
EY Global IPO trends report is released every quarter and looks at the IPO markets, trends and outlook for the Americas, Asia-Pacific, Japan and EMEIA regions.
The report provides insights, facts and figures on the 2018 IPO market year-to-date and analyzes the implications for companies planning to go public in the short and medium term.
You will find this report at the EY Global IPO website. You can also follow the report on LinkedIn or Twitter.
All values are US$ unless otherwise noted.

Global IPO trends: Q4 2018 | Page 3
Global IPO market2018 IPO activity charts a steady course forward, despite waves of volatility“Through a fog of uncertainty, IPO markets around the world found a clear path forward and investment opportunities ultimately delivered returns in 2018, as investor confidence, mega IPOs and the rise of the unicorn companies helped provide assurance for IPO investors. While the fourth quarter was weak, the year ended as expected, with 2018 activity held back toward the end of the year by geopolitical tensions, trade issues between the US, China and the EU, and the looming exit of the UK from the EU. Looking ahead to 2019, we expect a cautious start, followed by rays of hope that should brighten IPO activity in the second half of the year. In the meantime, it is more important than ever for IPO candidates to remain flexible and be well-prepared to move when the fog begins to lift.”Dr. Martin SteinbachEY Global and EY EMEIA IPO Leader
Global IPO trends: Q4 2018 | Page 4All values are US$ unless otherwise noted. | Q4 2018 and Q4 18 refer to the fourth quarter of 2018 and cover priced IPOs from 1 October to 5 December 2018 plus expected IPOs by end of December. YTD 2018 and 2018 refer to the full year of 2018 and cover priced IPOs from 1 January to 5 December 2018 plus expected IPOs by end of December.
Markets
Global IPO market
Activity Q4 2018
Stock exchangesby highest total proceeds
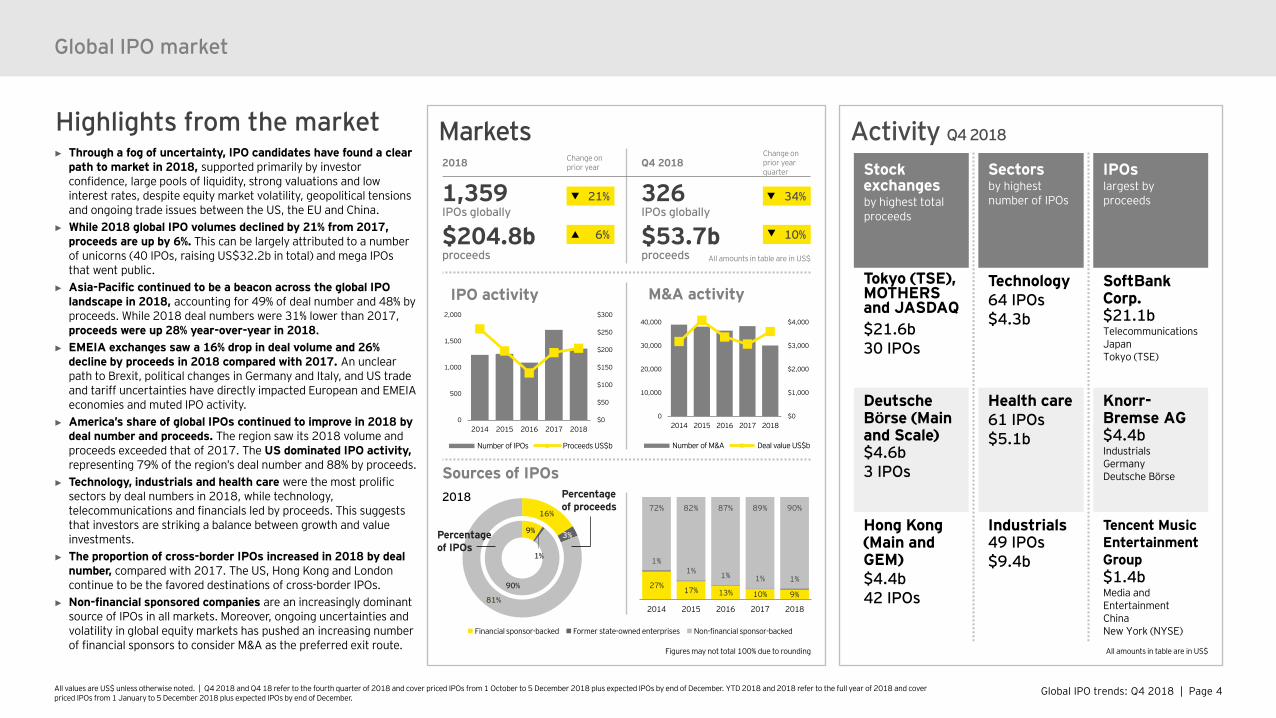
Tokyo (TSE), MOTHERS and JASDAQ$21.6b30 IPOs
Deutsche Börse (Main and Scale)$4.6b3 IPOs
Hong Kong (Main and GEM)$4.4b42 IPOs
IPOslargest by proceeds
SoftBank Corp.$21.1bTelecommunicationsJapanTokyo (TSE)
Knorr-Bremse AG$4.4bIndustrialsGermanyDeutsche Börse
Tencent Music Entertainment Group$1.4bMedia and EntertainmentChinaNew York (NYSE)
Sectorsby highest number of IPOs
Technology64 IPOs$4.3b
Health care61 IPOs$5.1b
Industrials49 IPOs$9.4b
Sources of IPOs2018
All amounts in table are in US$
16%
3%
81%
Percentage of proceeds
9%
1%
90%
Percentage of IPOs
Financial sponsor-backed Former state-owned enterprises Non-financial sponsor-backed
$0
$1,000
$2,000
$3,000
$4,000
0
10,000
20,000
30,000
40,000
2014 2015 2016 2017 2018
M&A activity
Number of M&A Deal value US$b
27% 17% 13% 10% 9%
1%1% 1% 1% 1%
72% 82% 87% 89% 90%
2014 2015 2016 2017 2018
$0
$50
$100
$150
$200
$250
$300
0
500
1,000
1,500
2,000
2014 2015 2016 2017 2018
IPO activity
Number of IPOs Proceeds US$b
Figures may not total 100% due to rounding
2018 Change on prior year Q4 2018
Change on prior yearquarter
1,359IPOs globally
326IPOs globally
$204.8bproceeds
$53.7bproceeds All amounts in table are in US$
21%
6%
34%
Highlights from the market► Through a fog of uncertainty, IPO candidates have found a clear
path to market in 2018, supported primarily by investor confidence, large pools of liquidity, strong valuations and low interest rates, despite equity market volatility, geopolitical tensions and ongoing trade issues between the US, the EU and China.
► While 2018 global IPO volumes declined by 21% from 2017, proceeds are up by 6%. This can be largely attributed to a number of unicorns (40 IPOs, raising US$32.2b in total) and mega IPOs that went public.
► Asia-Pacific continued to be a beacon across the global IPO landscape in 2018, accounting for 49% of deal number and 48% by proceeds. While 2018 deal numbers were 31% lower than 2017, proceeds were up 28% year-over-year in 2018.
► EMEIA exchanges saw a 16% drop in deal volume and 26% decline by proceeds in 2018 compared with 2017. An unclear path to Brexit, political changes in Germany and Italy, and US trade and tariff uncertainties have directly impacted European and EMEIA economies and muted IPO activity.
► America’s share of global IPOs continued to improve in 2018 by deal number and proceeds. The region saw its 2018 volume and proceeds exceeded that of 2017. The US dominated IPO activity,representing 79% of the region’s deal number and 88% by proceeds.
► Technology, industrials and health care were the most prolific sectors by deal numbers in 2018, while technology, telecommunications and financials led by proceeds. This suggests that investors are striking a balance between growth and value investments.
► The proportion of cross-border IPOs increased in 2018 by deal number, compared with 2017. The US, Hong Kong and London continue to be the favored destinations of cross-border IPOs.
► Non-financial sponsored companies are an increasingly dominant source of IPOs in all markets. Moreover, ongoing uncertainties and volatility in global equity markets has pushed an increasing number of financial sponsors to consider M&A as the preferred exit route.
10%
Global IPO trends: Q4 2018 | Page 5All values are US$ unless otherwise noted. | Q4 2018 and Q4 18 refer to the fourth quarter of 2018 and cover priced IPOs from 1 October to 5 December 2018 plus expected IPOs by end of December. YTD 2018 and 2018 refer to the full year of 2018 and cover priced IPOs from 1 January to 5 December 2018 plus expected IPOs by end of December.
Regional performance and trends
25%
16%
12%
13%
19%
30%
30%
29%
30%
32%
45%
54%
59%
57%
49%
2014
2015
2016
2017
2018
Regional share by number of IPOs
38%
19%
17%
27%
29%
31%
36%
28%
34%
23%
31%
45%
54%
39%
48%
2014
2015
2016
2017
2018
Regional share by proceeds
Global IPO market
Although positive post-IPO performance has receded from previous years, first-day IPO returns continue to outperform IPO offer pricing by at least 10%. These encouraging returns continue to feed investor appetite, particularly for technology, industrials and health care IPOs. The rise of the unicorns and mega IPOs have also helped to push 2018 proceeds beyond 2017 levels.
Americas EMEIA Asia-Pacific
Top countries of origin 2018By number of IPOs outside home country
• China (3)• Singapore (15)• UK (12)• US (10)• Australia (6)
Top IPO destinations* 2018By number of IPOs
• NASDAQ (33)• NYSE (27)• Hong Kong (23)• London (14)• Australia (9)
or or — = increase or decrease or remain constant for full year 2018 compared with the full year of 2017Figures may not total 100% due to rounding.
10%
8%
6%
7%
10%
2014
2015
2016
2017
2018
Cross-border IPOs Percentage by number of IPOs globally
*IPO destinations refer to stock exchanges (main and junior markets).
Global IPO trends: Q4 2018 | Page 6All values are US$ unless otherwise noted. | Q4 2018 and Q4 18 refer to the fourth quarter of 2018 and cover priced IPOs from 1 October to 5 December 2018 plus expected IPOs by end of December. YTD 2018 and 2018 refer to the full year of 2018 and cover priced IPOs from 1 January to 5 December 2018 plus expected IPOs by end of December.
Outlook► Given market volatilities and geopolitical uncertainties, the
strong decline in quarter-over-quarter IPO activity in all regions in Q4 2018 sends signals for a cautious start in 2019. However, companies that do come to the public markets will be of higher quality as investors become more selective. The best option for IPO candidates is to ride the wave, take the additional time to further improve their IPO readiness and consider a multitrack approach.
► Although 2019 IPO deal numbers could be below that of 2018 (1,150 to 1,300 IPOs), it is likely that global proceeds could meet or exceed the high 2018 levels.
► Asia-Pacific: Heading into 2019, we expect the decline in IPO activity to continue by deal numbers and proceeds. However, if geopolitical uncertainties and market volatility stabilize, IPO activity levels could improve in the second half of the year.
► EMEIA: US-China-EU trade tensions, Brexit, uncertainty with respect to the stability of selected European economies, and the potential of rising interest rates will likely continue to dampen IPO activity in the first half of 2019. However, with strong fundamentals and investor confidence, EMEIA IPO markets will remain a dominant force globally in 2019.
► Americas: Healthy performance in 2018 creates a supportive backdrop for continued Americas IPO activity. The number of companies, including multiple unicorns, considering the public markets in 2019 suggests that the Americas IPO market has much to look forward to in the year ahead.
► Sectors: Technology, industrials, health care and consumer products sectors will remain particularly active as investors look to balance high returns potential, with more traditional, less risky investments.
► Cross-border: We expect cross-border activity to maintain its momentum well into 2019, with the US, Hong Kong and London continuing to be the top destinations.
EY IPO sentiment radarThe radar contains a variety of market factors that may impact investor sentiment for IPOs.Pre-IPO companies should analyze how these factors may affect their business and valuations. These factors can ultimately have an impact on the timing and value of their transaction in view of their chosen IPO destination.
Global IPO market
Brexit
Geopoliticaltensions
Short-term volatility
Interest rate hikes
Currency
Implications from changes in US trade policies
Economic growth
Stronger regulatory requirements
Potential impact► Consider a number of
alternative funding or exit options (multitrack)
► Preserve optionality with early IPO readiness preparations
► Prepare early to complete your IPO quickly in narrow IPO windows
► Be flexible in timing and pricing
Oil prices

Global IPO trends: Q4 2018 | Page 7
AmericasDespite market volatility, 2018 Americas IPO activity continued full-steam ahead“Despite muted IPO activity on Central and South America exchanges in the second half of 2018, the IPO pipeline continues to build in the Americas. We expect issuers that are well prepared will be able to manage through periods of market instability.”Jackie KelleyEY Americas IPO Markets Leader

Global IPO trends: Q4 2018 | Page 8All values are US$ unless otherwise noted. | Q4 2018 and Q4 18 refer to the fourth quarter of 2018 and cover priced IPOs from 1 October to 5 December 2018 plus expected IPOs by end of December. YTD 2018 and 2018 refer to the full year of 2018 and cover priced IPOs from 1 January to 5 December 2018 plus expected IPOs by end of December.
Brazil‘s B3 2018
US‘ NASDAQ and NYSE 2018
Canada‘s Toronto Stock Exchange and TSX Venture Exchange 2018
Mexico‘s Mexican Stock Exchange 2018
Activity Q4 2018
Markets 2018
AmericasAmericas
Change on prior year
261 IPOs
$60.0b proceeds
$99m median deal size
14%
16%
13%
Highlights from the markets► Despite the volatility, Americas IPO markets are ending on a high as year-over-year deal volumes and
proceeds from 2018 exceeded 2017 numbers by 14% and 16%, respectively. ► The US exchanges accounted for 79% of Americas IPO deal numbers and 88% by proceeds. ► Besides the US, Canada’s Toronto Stock Exchange and Venture Exchange saw 17 IPOs, which raised
US$1.1b in 2018, accounting for 7% of Americas IPOs and 2% by proceeds. There were no significant IPOs on Brazil’s or Mexico’s markets in the second half of 2018.
► Cross-border deals accounted for 25% (65 IPOs) of 2018 Americas IPOs. 60 foreign issuers listed in the US and 5 listed on Canada’s Toronto Main and Venture Exchanges and CNQ. This signaled continued confidence in Americas exchanges.
► Health care, technology and financials sectors saw the highest level of IPO activity in 2018, with health care alone contributing to 35% of deal volume, while technology and financials accounted for 22% and 10%, respectively. These sectors accounted for 17%, 28% and 13% of proceeds, respectively.
Change on prior year
17 IPOs
$1.1b proceeds
$15m median deal size
Change on prior year
6 IPOs
$3.2b proceeds
$387m median deal size
Change on prior year
3 IPOs
$2.0b proceeds
$801m median deal size
Change on prior year
205 IPOs
$52.8b proceeds
$111m median deal size
31%
All amounts in table are in US$
Stock exchanges by highest total proceeds
NASDAQ$4.3b | 27 IPOs US
NYSE$3.7b | 11 IPOs US
Toronto TSX and Venture$235m | 5 IPOs Canada
Sectors by highest number of IPOs
Health care23 IPOs | $2.4b
Technology14 IPOs | $2.8b
Materials7 IPOs | $395m
IPOslargest by proceedsTencent Music Entertain-ment Group $1.4b Media and entertainment, New York, China
StoneCo Ltd.$1.4b Technology, NASDAQ, Brazil
Moderna Inc.$500m Health care, NASDAQ, US
All amounts in table are in US$
19%
24%
20%
All amounts in table are in US$
$0
$40
$80
$120
0
100
200
300
400
2014 2015 2016 2017 2018
Number of IPOs Proceeds US$b
$0
$20
$40
$60
$80
$100
0
100
200
300
2014 2015 2016 2017 2018
Number of IPOs Proceeds US$b
$0$1$2$3$4$5$6$7
02468
1012
2014 2015 2016 2017 2018
Number of IPOs Proceeds US$b
$0
$1
$2
$3
$4
0
5
10
15
20
25
2014 2015 2016 2017 2018
Number of IPOs Proceeds US$b
$0
$1
$2
$3
$4
0
2
4
6
8
2014 2015 2016 2017 2018
Number of IPOs Proceeds US$b
IPO activity in 2016 includes one IPO on BATS exchange.
IPO activity of Canadian Securities Exchange is excluded.
70%
65%
102%
80%
20%
59%
14%
4%

Global IPO trends: Q4 2018 | Page 9
Americas — US IPO market insight2018 US IPO markets surpass 2017 deal volume and proceeds“The US IPO markets will finish the year strong, with both volume and proceeds surpassing 2017 levels. A number of unicorn companies brought IPOs to market in 2018, with more on record stating that they will be conducting IPOs in 2019. As we head into the new year, we expect IPO volumes to remain steady, driven by a number of high quality issuers that have kicked off IPO processes.”Jackie KelleyEY Americas IPO Markets Leader
Global IPO trends: Q4 2018 | Page 10All values are US$ unless otherwise noted. | Q4 2018 and Q4 18 refer to the fourth quarter of 2018 and cover priced IPOs from 1 October to 5 December 2018 plus expected IPOs by end of December. YTD 2018 and 2018 refer to the full year of 2018 and cover priced IPOs from 1 January to 5 December 2018 plus expected IPOs by end of December.
Trends2018
Change on prior year
Median deal size $111.1mMedian post-IPO market cap $515.6m
Americas — US IPO market insight
Activity Q4 2018
Performance 2018
IPO pricing and performance
US markets
First-day average return
Share price performance since IPO (aka offer-to-current)
+15.1% +10.6%
Equity indices
DJIA+1.2%US
S&P 500+1.0%US
Volatility indexCBOE VIX®
+87.9% | 20.7 index levelYTD
Sectorsby highest number of IPOs
Health care19 IPOs | $2.3b
Technology9 IPOs | $2.8bMedia and Entertainment 2 IPOs | $1.8bConsumer products2 IPOs | $318m
Financials2 IPOs | $283m
IPOslargest by proceeds
Tencent Music Entertainment Group $1.4b Media and entertainment, NYSE, China
StoneCo Ltd.$1.4b Technology, NASDAQ, Brazil
Moderna Inc.$500m Health care, NASDAQ, US
Studio City International Holdings Ltd.$413m Media and entertainment, NYSE, Macau
Livent Corp.$391m Materials, NYSE, US
All amounts in table are in US$
All amounts in table are in US$
Cross-border IPOs: top countries/regions of origin 2018
All amounts in table are in US$
60IPOs
China 33 IPOs ($9.4b)
Europe 13 IPOs ($3.8b)
Israel 4 IPOs ($158m)
Brazil 3 IPOs ($4.2b)
Argentina 2 IPOs ($865m)
Markets 2018
All amounts in table are in US$
Q4 2018
NASDAQ$4.3b27 IPOs
NYSE$3.7b11 IPOs
Change on prior year
205 IPOs
$52.8b proceeds
27% of IPOs are financial sponsor-backed
31%
+ or – indicates change since 29 December 2017
+ indicates a increase in expected volatility as of 4 December 2018 compared with 29 December 2017 for year-to-date (YTD).
+ or – indicates change compared with offer price at IPO
Highlights from the market► Despite market volatility, US IPO activity saw 205 IPOs raising a
total of US$52.8b in 2018, a year-on-year rise of 14% by volume and 31% by proceeds.
► Health care and technology sectors continue to dominate the US exchanges in 2018 by deal number and proceeds.
► Twenty-six unicorns (with total proceeds of US$15.0b) came to the public market in 2018, a trend we expect will continue into 2019.
► US exchanges continue to be the destination of choice for foreign companies. Cross-border IPOs accounted for 29% of US IPOs, with 60 companies choosing to list in the US from 15 countries during 2018.
► Positive post-IPO price performance is keeping investors engaged and encouraging more IPO candidates to come to the market. US IPOs have posted average first-day returns of around 15% and average current share price post-IPO is up by around 11%.
$0
$20
$40
$60
$80
$100
0
50
100
150
200
250
300
2014 2015 2016 2017 2018
Number of IPOs Proceeds US$b
Outlook► Although there is limited visibility into the IPO pipeline due
to confidential filings, there continues to be rumblings of significant IPO activity set to take place during the first half of 2019 behind the scenes.
► Unicorn technology companies garner the majority of the headlines, but the IPO pipeline includes industry and geographical diversity as well as financial sponsor-backed companies, signaling continued strength in the US IPO market.
► As markets digest geopolitical developments and increased uncertainty, IPO windows may narrow and issuers that are prepared to move nimbly will be rewarded.
IPO activity in 2016 includes one IPO on BATS exchange.
23%
First-day and current average returns are mean returns of issuers who started trading by 29 November.
Median post-IPO market cap is calculated for IPOs that were priced by 29 November.
14%
4%
1%

Global IPO trends: Q4 2018 | Page 11
Asia-PacificAsia-Pacific IPO markets have reached crossroads heading into 2019“Despite a slowdown in Q4 2018 quarter-on-quarter, Asia-Pacific IPO markets continued to be a beacon across the global IPO landscape in 2018. However, as we head into 2019, the Asia-Pacific IPO market has reached crossroads. If fundamental factors improve, such as greater geopolitical certainty, better trade relations or an increase in liquidity, we may see improvements in IPO activity as early as the first half of 2019. However, if fundamentals remain as they are, we may see a short burst of activity in the first half of 2019, but sustained improvement in IPO activity may not be realized until the second half of the year.”Ringo ChoiEY Asia-Pacific IPO Leader
Global IPO trends: Q4 2018 | Page 12All values are US$ unless otherwise noted. | Q4 2018 and Q4 18 refer to the fourth quarter of 2018 and cover priced IPOs from 1 October to 5 December 2018 plus expected IPOs by end of December. YTD 2018 and 2018 refer to the full year of 2018 and cover priced IPOs from 1 January to 5 December 2018 plus expected IPOs by end of December.
Markets 2018 Change on
prior year Q4 2018Change on prior year quarter
666IPOs
190IPOs
$97.1bproceeds
$33.4bproceeds
Activity Q4 2018
Asia-Pacific
Stock exchangesby highest total proceeds
Tokyo (TSE), MOTHERS and JASDAQ$21.6b30 IPOsJapan
Hong Kong (Main and GEM)$4.4b42 IPOsHong Kong
Thailand (SET + MAI)$2.1b10 IPOsThailand
Sectorsby highest number of IPOs
Technology34 IPOs$1.0b
Industrials33 IPOs $2.5b
Materials29 IPOs $1.7b
IPOslargest by proceeds
SoftBank Corp.$21.1bTelecommunicationsJapanTokyo (TSE)
Thailand Future Fund$1.4bIndustrialsThailandThailand (SET)
People's Insurance Co. (Group) of China Ltd.$872mFinancialsChinaShanghai (SSE)
Main markets Junior marketsQ4 2018 Change on
Q4 2017 Q4 2018 Change on Q4 2017
103IPOs
87IPOs
$30.9bproceeds
$2.5bProceeds
All amounts in table are in US$ All amounts in table are in US$
$0
$2
$4
$6
$8
$10
$12
$14
0
50
100
150
200
250
300
350
400
2014 2015 2016 2017 2018
Number of IPOs Proceeds US$b
$0$10$20$30$40$50$60$70$80$90$100
0
100
200
300
400
500
600
700
2014 2015 2016 2017 2018
All amounts in table are in US$
40%
14%
14%
31% 30%
28%
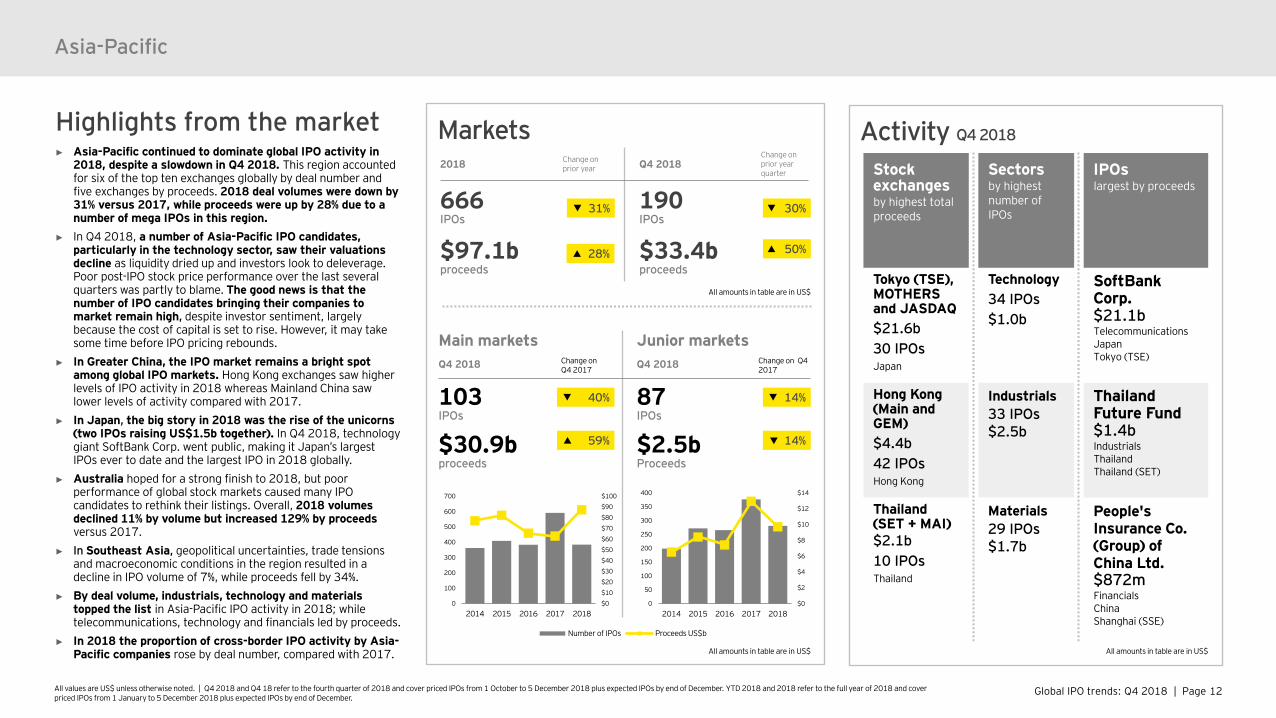
Highlights from the market► Asia-Pacific continued to dominate global IPO activity in
2018, despite a slowdown in Q4 2018. This region accounted for six of the top ten exchanges globally by deal number and five exchanges by proceeds. 2018 deal volumes were down by 31% versus 2017, while proceeds were up by 28% due to a number of mega IPOs in this region.
► In Q4 2018, a number of Asia-Pacific IPO candidates, particularly in the technology sector, saw their valuations decline as liquidity dried up and investors look to deleverage. Poor post-IPO stock price performance over the last several quarters was partly to blame. The good news is that the number of IPO candidates bringing their companies to market remain high, despite investor sentiment, largely because the cost of capital is set to rise. However, it may take some time before IPO pricing rebounds.
► In Greater China, the IPO market remains a bright spot among global IPO markets. Hong Kong exchanges saw higher levels of IPO activity in 2018 whereas Mainland China saw lower levels of activity compared with 2017.
► In Japan, the big story in 2018 was the rise of the unicorns (two IPOs raising US$1.5b together). In Q4 2018, technology giant SoftBank Corp. went public, making it Japan’s largest IPOs ever to date and the largest IPO in 2018 globally.
► Australia hoped for a strong finish to 2018, but poor performance of global stock markets caused many IPO candidates to rethink their listings. Overall, 2018 volumes declined 11% by volume but increased 129% by proceeds versus 2017.
► In Southeast Asia, geopolitical uncertainties, trade tensions and macroeconomic conditions in the region resulted in a decline in IPO volume of 7%, while proceeds fell by 34%.
► By deal volume, industrials, technology and materials topped the list in Asia-Pacific IPO activity in 2018; while telecommunications, technology and financials led by proceeds.
► In 2018 the proportion of cross-border IPO activity by Asia-Pacific companies rose by deal number, compared with 2017.
50%
59%

Global IPO trends: Q4 2018 | Page 13All values are US$ unless otherwise noted. | Q4 2018 and Q4 18 refer to the fourth quarter of 2018 and cover priced IPOs from 1 October to 5 December 2018 plus expected IPOs by end of December. YTD 2018 and 2018 refer to the full year of 2018 and cover priced IPOs from 1 January to 5 December 2018 plus expected IPOs by end of December.
Trends
Sources of IPOs
20183.7% 2.3%
94.0%
Percentage of proceeds
Asia-Pacific
Cross-border 3.4% of all Asia-Pacific issuers* listed abroad but within the Asia-Pacific region
Outbound5.9% of all Asia-Pacific issuers* listed outside Asia-Pacific
Inbound7.8% of cross-border IPOs globally** listed in Asia-Pacific but came from outside the region
*There were 688 IPOs by Asia-Pacific issuers in YTD 2018. This analysis is based on the listed company domicile, regardless of the listed company exchange.** There were 130 cross-border IPOs globally in YTD 2018.
Cross-border activity 2018
Asia-Pacific issuers’ cross-border activityPercentage of all Asia-Pacific issuers
Despite declines in most IPO markets across the region during 2018, Asia-Pacific exchanges represented six of the top ten exchanges globally by volume in 2018, and five of the top ten by proceeds.
10IPOs
41IPOs
Transaction sizes
Main markets Junior markets2018 Change on prior year 2018 Change on prior year
Median post-IPO market cap $138.3m $40.3mMedian deal size $37.3m $9.9mTrends
27%
20%
All amounts in table are in US$. Figures may not total 100% due to rounding.
Financial sponsor-backed Former state-owned enterprises Non-financial sponsor-backed
24IPOs
13% 6% 4.2% 5% 6%
1%1% 0.3% 0.3% 0%
86% 93% 95.5% 95% 94%
2014 2015 2016 2017 2018
8%
5% 6% 6%9%
2014 2015 2016 2017 2018
$0
$100
$200
$300
2014 2015 2016 2017 2018$0
$20
$40
$60
$80
$100
2014 2015 2016 2017 2018
Median post-IPO market cap US$m
Median deal size US$m
5.8% 0.6%
93.6%
Percentageof IPOs
54%
51%
Global IPO trends: Q4 2018 | Page 14All values are US$ unless otherwise noted. | Q4 2018 and Q4 18 refer to the fourth quarter of 2018 and cover priced IPOs from 1 October to 5 December 2018 plus expected IPOs by end of December. YTD 2018 and 2018 refer to the full year of 2018 and cover priced IPOs from 1 January to 5 December 2018 plus expected IPOs by end of December.
Asia-Pacific
PerformanceEquity indices 2018
Hang Seng-8.9%Hong Kong
Nikkei 225-3.2%Japan
ASX 200-5.8%Australia
Shanghai Composite-19.4%Mainland China
FTSE Straits Times-1.4%Singapore
KOSPI-14.3%South Korea
IPO pricing and performance 2018
First-day average return
Share price performance since IPO
Main markets +17.0% +9.1%
Junior markets +40.3% +97.2%
Volatility index
Hang Seng Volatility24.83 index level
+36.6%YTD
+10.2%Q4 2018
+ or – indicates change since 29 December 2017+ or – indicates change compared with offer price at IPO
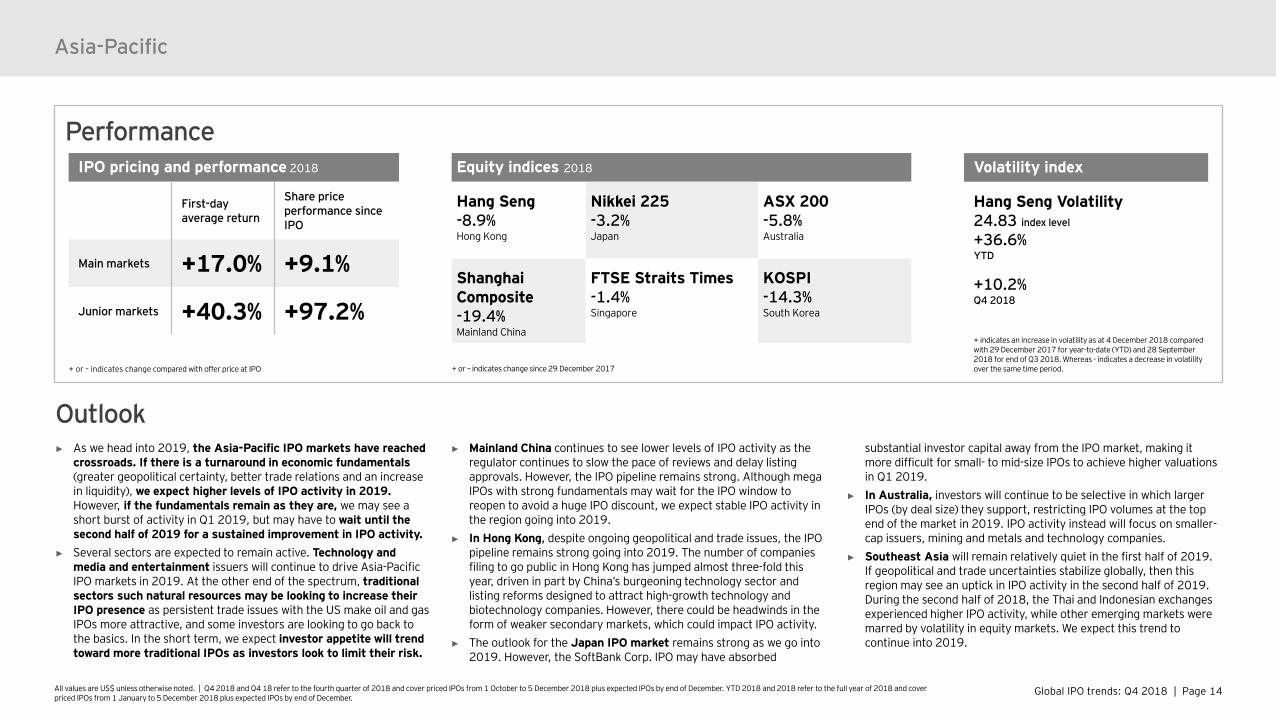
► As we head into 2019, the Asia-Pacific IPO markets have reached crossroads. If there is a turnaround in economic fundamentals (greater geopolitical certainty, better trade relations and an increase in liquidity), we expect higher levels of IPO activity in 2019. However, if the fundamentals remain as they are, we may see a short burst of activity in Q1 2019, but may have to wait until the second half of 2019 for a sustained improvement in IPO activity.
► Several sectors are expected to remain active. Technology and media and entertainment issuers will continue to drive Asia-Pacific IPO markets in 2019. At the other end of the spectrum, traditional sectors such natural resources may be looking to increase their IPO presence as persistent trade issues with the US make oil and gas IPOs more attractive, and some investors are looking to go back to the basics. In the short term, we expect investor appetite will trend toward more traditional IPOs as investors look to limit their risk.
► Mainland China continues to see lower levels of IPO activity as the regulator continues to slow the pace of reviews and delay listing approvals. However, the IPO pipeline remains strong. Although mega IPOs with strong fundamentals may wait for the IPO window to reopen to avoid a huge IPO discount, we expect stable IPO activity in the region going into 2019.
► In Hong Kong, despite ongoing geopolitical and trade issues, the IPO pipeline remains strong going into 2019. The number of companies filing to go public in Hong Kong has jumped almost three-fold this year, driven in part by China’s burgeoning technology sector and listing reforms designed to attract high-growth technology and biotechnology companies. However, there could be headwinds in the form of weaker secondary markets, which could impact IPO activity.
► The outlook for the Japan IPO market remains strong as we go into 2019. However, the SoftBank Corp. IPO may have absorbed
substantial investor capital away from the IPO market, making it more difficult for small- to mid-size IPOs to achieve higher valuations in Q1 2019.
► In Australia, investors will continue to be selective in which larger IPOs (by deal size) they support, restricting IPO volumes at the top end of the market in 2019. IPO activity instead will focus on smaller-cap issuers, mining and metals and technology companies.
► Southeast Asia will remain relatively quiet in the first half of 2019. If geopolitical and trade uncertainties stabilize globally, then this region may see an uptick in IPO activity in the second half of 2019. During the second half of 2018, the Thai and Indonesian exchanges experienced higher IPO activity, while other emerging markets were marred by volatility in equity markets. We expect this trend to continue into 2019.
Outlook
+ indicates an increase in volatility as at 4 December 2018 compared with 29 December 2017 for year-to-date (YTD) and 28 September 2018 for end of Q3 2018. Whereas - indicates a decrease in volatility over the same time period.

Global IPO trends: Q4 2018 | Page 15
Asia-Pacific — Greater China market insight Early preparation remains key to capturing the IPO window in 2019“Despite the geopolitical issues, which created market volatility during Q4 2018, Greater China exchanges posted a modest increase in IPO proceeds in 2018 compared with 2017. New listing rules on weighted voting rights and pre-revenue biotech companies have attracted high-profile technology and biotech companies to list in Hong Kong. In Mainland China, a new science and technology innovation board will fast-track the listing of quality high-tech and advanced manufacturing companies. With volatility set to continue in 2019, successful issuers will be those that are well-prepared and ready to capture the IPO window when it opens.”Terence HoEY Greater China IPO Leader
Global IPO trends: Q4 2018 | Page 16All values are US$ unless otherwise noted. | Q4 2018 and Q4 18 refer to the fourth quarter of 2018 and cover priced IPOs from 1 October to 5 December 2018 plus expected IPOs by end of December. YTD 2018 and 2018 refer to the full year of 2018 and cover priced IPOs from 1 January to 5 December 2018 plus expected IPOs by end of December.
Markets 2018 Change on
prior year Q4 2018Change on prior yearquarter
307IPOs
62IPOs
$56.7bproceeds
$7.7proceeds
Asia-Pacific — Greater China market insight
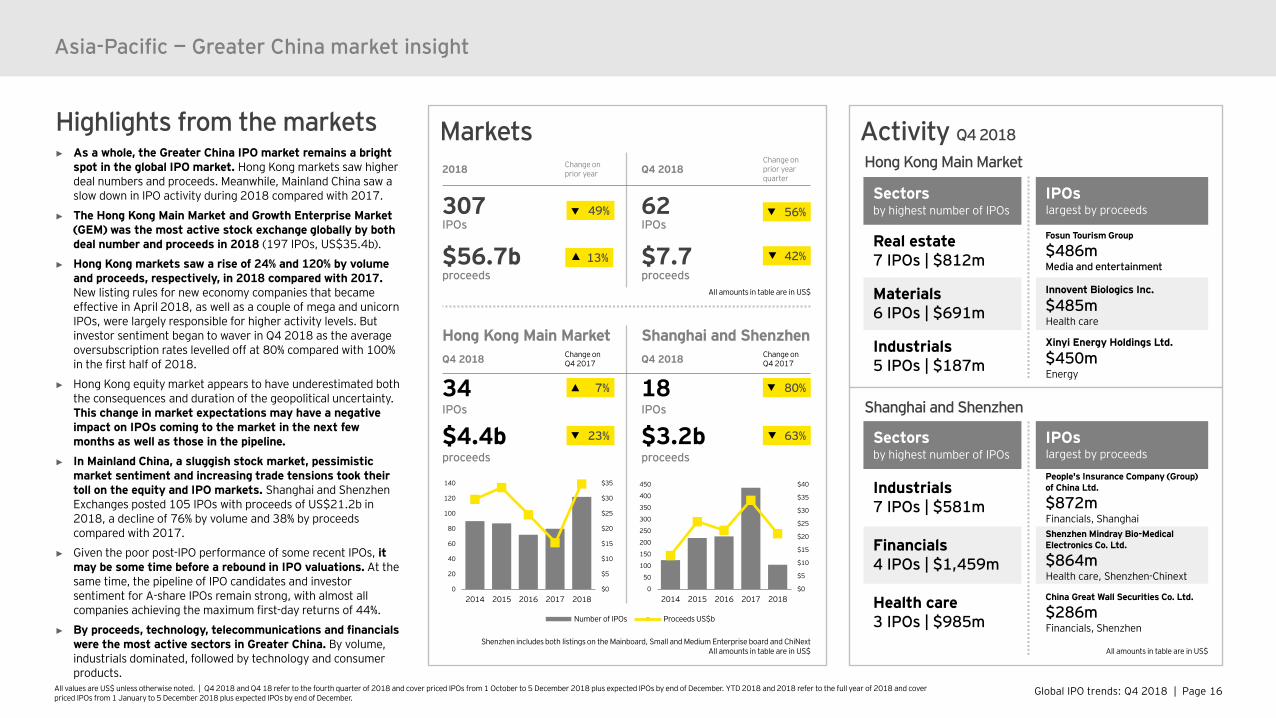
Highlights from the markets► As a whole, the Greater China IPO market remains a bright
spot in the global IPO market. Hong Kong markets saw higher deal numbers and proceeds. Meanwhile, Mainland China saw a slow down in IPO activity during 2018 compared with 2017.
► The Hong Kong Main Market and Growth Enterprise Market (GEM) was the most active stock exchange globally by both deal number and proceeds in 2018 (197 IPOs, US$35.4b).
► Hong Kong markets saw a rise of 24% and 120% by volume and proceeds, respectively, in 2018 compared with 2017. New listing rules for new economy companies that became effective in April 2018, as well as a couple of mega and unicorn IPOs, were largely responsible for higher activity levels. But investor sentiment began to waver in Q4 2018 as the average oversubscription rates levelled off at 80% compared with 100% in the first half of 2018.
► Hong Kong equity market appears to have underestimated both the consequences and duration of the geopolitical uncertainty. This change in market expectations may have a negative impact on IPOs coming to the market in the next few months as well as those in the pipeline.
► In Mainland China, a sluggish stock market, pessimistic market sentiment and increasing trade tensions took their toll on the equity and IPO markets. Shanghai and Shenzhen Exchanges posted 105 IPOs with proceeds of US$21.2b in 2018, a decline of 76% by volume and 38% by proceeds compared with 2017.
► Given the poor post-IPO performance of some recent IPOs, it may be some time before a rebound in IPO valuations. At the same time, the pipeline of IPO candidates and investor sentiment for A-share IPOs remain strong, with almost all companies achieving the maximum first-day returns of 44%.
► By proceeds, technology, telecommunications and financials were the most active sectors in Greater China. By volume, industrials dominated, followed by technology and consumer products.
Activity Q4 2018
Hong Kong Main Market
Sectors by highest number of IPOs
Real estate7 IPOs | $812m
Materials6 IPOs | $691m
Industrials5 IPOs | $187m
IPOslargest by proceeds
Fosun Tourism Group
$486mMedia and entertainment
Innovent Biologics Inc.
$485mHealth care
Xinyi Energy Holdings Ltd.
$450mEnergy
Shanghai and Shenzhen
Sectors by highest number of IPOs
Industrials7 IPOs | $581m
Financials4 IPOs | $1,459m
Health care3 IPOs | $985m
IPOslargest by proceeds
People's Insurance Company (Group) of China Ltd.
$872mFinancials, ShanghaiShenzhen Mindray Bio-Medical Electronics Co. Ltd.
$864mHealth care, Shenzhen-Chinext
China Great Wall Securities Co. Ltd.
$286mFinancials, Shenzhen
Hong Kong Main Market Shanghai and ShenzhenQ4 2018 Change on
Q4 2017 Q4 2018 Change on Q4 2017
34IPOs
18IPOs
$4.4bproceeds
$3.2bproceeds
Shenzhen includes both listings on the Mainboard, Small and Medium Enterprise board and ChiNextAll amounts in table are in US$
All amounts in table are in US$
$0
$5
$10
$15
$20
$25
$30
$35
$40
0
50
100
150
200
250
300
350
400
450
2014 2015 2016 2017 2018
Number of IPOs Proceeds US$b
$0
$5
$10
$15
$20
$25
$30
$35
0
20
40
60
80
100
120
140
2014 2015 2016 2017 2018
49%
80%
56%
All amounts in table are in US$
13%
7%
23% 63%
42%
Global IPO trends: Q4 2018 | Page 17All values are US$ unless otherwise noted. | Q4 2018 and Q4 18 refer to the fourth quarter of 2018 and cover priced IPOs from 1 October to 5 December 2018 plus expected IPOs by end of December. YTD 2018 and 2018 refer to the full year of 2018 and cover priced IPOs from 1 January to 5 December 2018 plus expected IPOs by end of December.
Trends
Sources of IPOs
20182%
97%
Percentage of proceeds
Asia-Pacific — Greater China market insight
Cross-border activity 2018
Greater China issuers’ cross-border activityPercentage of all China issuers
2018
Leaving Greater China
Outbound11.3% of Greater China issuers* listed abroad
Coming to Greater China
Inbound 16.4% of cross-border IPOs globally** were listed on HKEx and GEM
*There were 314 IPOs by Greater China issuers in YTD 2018. This analysis is based on the listed company domicile, regardless of the listed company exchange.** There were 130 cross-border IPOs globally in YTD 2018.
21IPOs
36IPOs
To which destination? 2018
35 IPOs to US exchanges
1 IPO to South Korea’s KOSDAQ
Transaction sizes
Hong Kong Main Market Shanghai and Shenzhen2018 Change on prior year 2018 Change on prior year
Median post-IPO market cap $127.9m $467.5mMedian deal size $32.1m $90.4mTrends
110%
0.3%
99.4%
Percentage of IPOs
All amounts in table are in US$. Figures may not total 100% due to rounding.
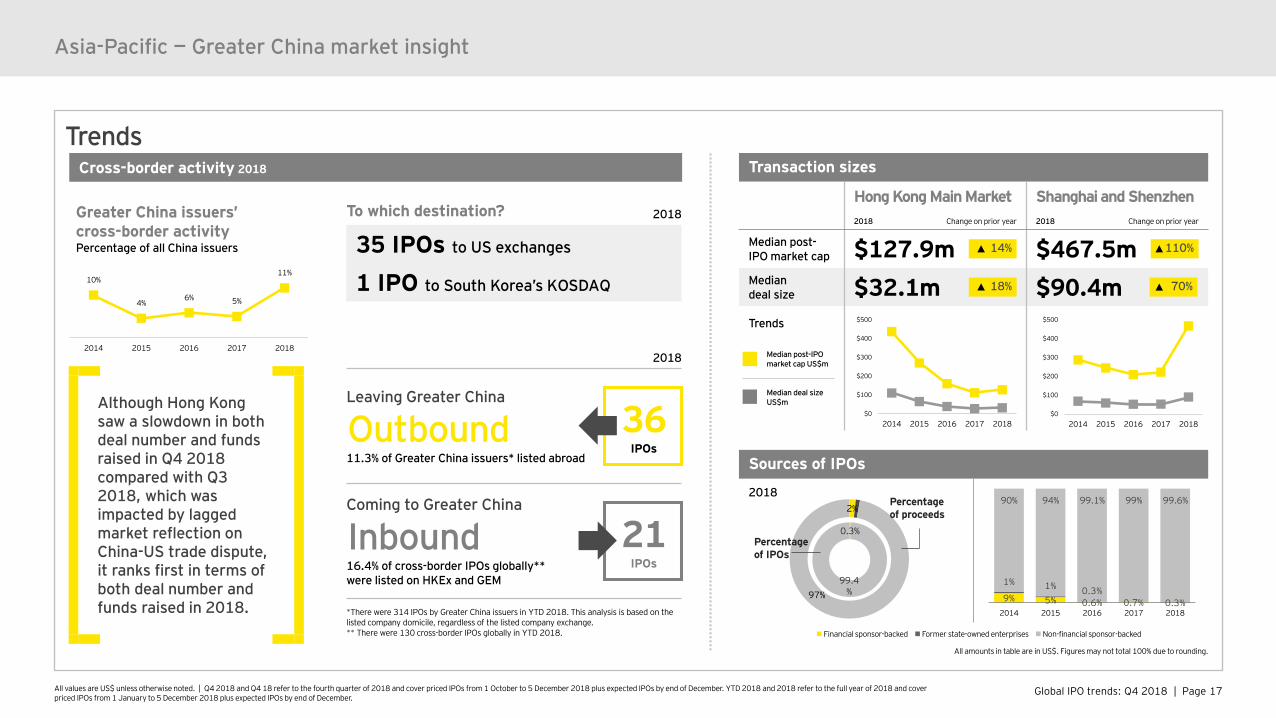
Although Hong Kong saw a slowdown in both deal number and funds raised in Q4 2018 compared with Q3 2018, which was impacted by lagged market reflection on China-US trade dispute, it ranks first in terms of both deal number and funds raised in 2018.
Financial sponsor-backed Former state-owned enterprises Non-financial sponsor-backed
9% 5% 0.6% 0.7% 0.3%
1% 1% 0.3%
90% 94% 99.1% 99% 99.6%
2014 2015 2016 2017 2018
10%
4%6% 5%
11%
2014 2015 2016 2017 2018
$0
$100
$200
$300
$400
$500
2014 2015 2016 2017 2018$0
$100
$200
$300
$400
$500
2014 2015 2016 2017 2018
Median post-IPO market cap US$m
Median deal size US$m
18% 70%
14%
Global IPO trends: Q4 2018 | Page 18All values are US$ unless otherwise noted. | Q4 2018 and Q4 18 refer to the fourth quarter of 2018 and cover priced IPOs from 1 October to 5 December 2018 plus expected IPOs by end of December. YTD 2018 and 2018 refer to the full year of 2018 and cover priced IPOs from 1 January to 5 December 2018 plus expected IPOs by end of December.
Outlook
Asia-Pacific — Greater China market insight
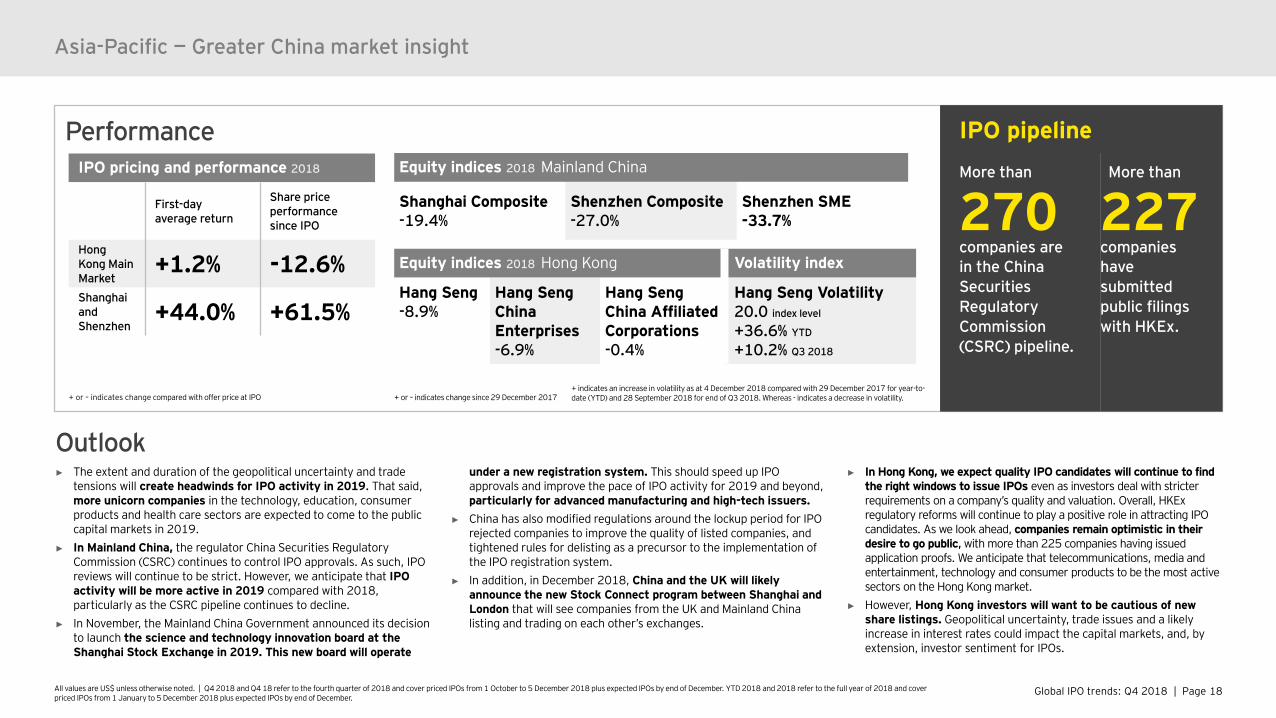
PerformanceEquity indices 2018 Mainland China
Shanghai Composite-19.4%
Shenzhen Composite-27.0%
Shenzhen SME-33.7%
IPO pricing and performance 2018
First-day average return
Share price performance since IPO
Hong Kong Main Market
+1.2% -12.6%Shanghai and Shenzhen
+44.0% +61.5%
Equity indices 2018 Hong Kong Volatility index
Hang Seng -8.9%
Hang Seng China Enterprises-6.9%
Hang Seng China Affiliated Corporations-0.4%
Hang Seng Volatility20.0 index level
+36.6% YTD
+10.2% Q3 2018
IPO pipelineMore than
270companies arein the China Securities Regulatory Commission (CSRC) pipeline.
More than
227companieshave submitted public filings with HKEx.
+ or – indicates change compared with offer price at IPO + or – indicates change since 29 December 2017
► The extent and duration of the geopolitical uncertainty and trade tensions will create headwinds for IPO activity in 2019. That said, more unicorn companies in the technology, education, consumer products and health care sectors are expected to come to the public capital markets in 2019.
► In Mainland China, the regulator China Securities Regulatory Commission (CSRC) continues to control IPO approvals. As such, IPO reviews will continue to be strict. However, we anticipate that IPO activity will be more active in 2019 compared with 2018, particularly as the CSRC pipeline continues to decline.
► In November, the Mainland China Government announced its decision to launch the science and technology innovation board at the Shanghai Stock Exchange in 2019. This new board will operate
under a new registration system. This should speed up IPO approvals and improve the pace of IPO activity for 2019 and beyond, particularly for advanced manufacturing and high-tech issuers.
► China has also modified regulations around the lockup period for IPO rejected companies to improve the quality of listed companies, and tightened rules for delisting as a precursor to the implementation of the IPO registration system.
► In addition, in December 2018, China and the UK will likely announce the new Stock Connect program between Shanghai and London that will see companies from the UK and Mainland China listing and trading on each other’s exchanges.
► In Hong Kong, we expect quality IPO candidates will continue to find the right windows to issue IPOs even as investors deal with stricter requirements on a company’s quality and valuation. Overall, HKExregulatory reforms will continue to play a positive role in attracting IPO candidates. As we look ahead, companies remain optimistic in their desire to go public, with more than 225 companies having issued application proofs. We anticipate that telecommunications, media and entertainment, technology and consumer products to be the most active sectors on the Hong Kong market.
► However, Hong Kong investors will want to be cautious of new share listings. Geopolitical uncertainty, trade issues and a likely increase in interest rates could impact the capital markets, and, by extension, investor sentiment for IPOs.
+ indicates an increase in volatility as at 4 December 2018 compared with 29 December 2017 for year-to-date (YTD) and 28 September 2018 for end of Q3 2018. Whereas - indicates a decrease in volatility.
Global IPO trends: Q4 2018 | Page 19
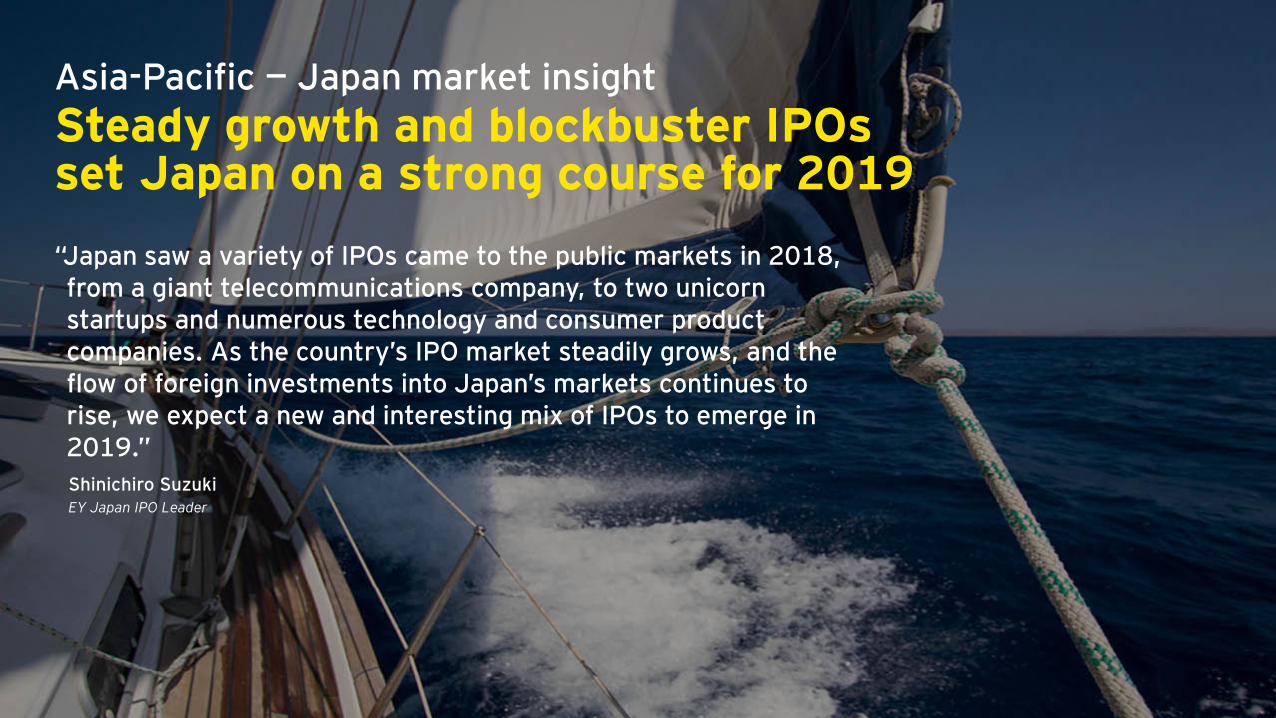
Asia-Pacific — Japan market insight Steady growth and blockbuster IPOs set Japan on a strong course for 2019“Japan saw a variety of IPOs came to the public markets in 2018, from a giant telecommunications company, to two unicorn startups and numerous technology and consumer product companies. As the country’s IPO market steadily grows, and the flow of foreign investments into Japan’s markets continues to rise, we expect a new and interesting mix of IPOs to emerge in 2019.”Shinichiro SuzukiEY Japan IPO Leader

Global IPO trends: Q4 2018 | Page 20All values are US$ unless otherwise noted. | Q4 2018 and Q4 18 refer to the fourth quarter of 2018 and cover priced IPOs from 1 October to 5 December 2018 plus expected IPOs by end of December. YTD 2018 and 2018 refer to the full year of 2018 and cover priced IPOs from 1 January to 5 December 2018 plus expected IPOs by end of December.
Markets 2018 Change on
prior year Q4 2018Change on prior yearquarter
97IPOs
31IPOs
$26.4bProceeds
$21.6bproceeds
$10.3mmedian deal size
$7.1mmedian deal size
Tokyo Main Market JASDAQ and MOTHERSQ4 2018
Change on prior year quarter
Q4 2018Change on prior year quarter
4IPOs
27IPOs
$21.3bproceeds
$0.3bproceeds
$101.5mmedian deal size
$6.7mmedian deal size
Activity Q4 2018
Asia-Pacific — Japan market insight
Sectorsby highest number of IPOs
Technology11 IPOs$61m
Consumer products5 IPOs$42m
Industrials3 IPOs$87m
IPOslargest by proceeds
SoftBankCorp.$21.1bTelecomsTokyo (TSE)
ARTERIA Networks Corp.$204mTelecomsTokyo (TSE)
Autonomous Control Systems Laboratory Ltd.$73mIndustrialsMOTHERS
Equity index
Nikkei 225-3.2%Japan
Tokyo Main MarketIPO pricing and performance
First-day average return
+1.6%Share price performance since IPO
-12.5%
All amounts in table are in US$. + or – indicates change since 29 December 2017All amounts in table are in US$
Highlights from the market► Japan ends 2018 on a high note with 31 IPOs in Q4 2018
with total proceeds of US$21.6b. Overall, Japan posted 97 IPOs in 2018, a modest 2% increase in terms of volume, but representing a massive 333% increase over 2017 proceeds. This can be attributed to the listing of telecommunications giant SoftBank Corp. (a subsidiary of SoftBank Group Corp. (SBG)) on the Tokyo Stock Exchange in the second half of December, with expected proceeds of US$21.1b to US$23.5b, making it Japan’s largest IPOs ever.
► Strong Abenomics reform policies, combined with Japan’s hosting of the Rugby World Cup in 2019 and the Olympics in 2020 are contributing to Japan’s strong economy. Meanwhile, the performance and profitable growth of the country’s larger companies have exceeded 2017 levels in 2018. Japan’s favorable relationship with China has allowed Japan to sidestep the trade tensions that have impacted economies in other parts of the world. These positive economic and financial factors are feeding investor confidence and maintaining their appetite to invest in major companies, startups and IPOs.
► In 2018, technology was the primary driver of IPOs as Japan entered the unicorn era, with Mercari, Inc. and MTG Co. Ltd. leading the way. However, the biggest story of the year, was the mega IPO by telecommunications company SoftBank Corp.
► Following Prime Minister Abe’s recent re-election, he is expected to lead Japan until 2021. This ongoing political stability create favorable conditions for Japan’s economy and IPO markets.
► Looking ahead to 2019, we expect Japan to launch around 90 to 100 IPOs next year, similar to 2018 deal volume. However, the SoftBank Corp. IPO may absorb substantial amount of investors’ funds from the IPO market. We expect more small- to mid-size IPOs to come in Q1 2019, but these issuers may face lower IPO valuations. The good news, however, is that the ratio of overseas investors continues to rise, bringing new investment funds into the Japan IPO markets.
+ or – indicates change compared with offer price at IPO
$0.0$0.2$0.4$0.6$0.8$1.0$1.2$1.4$1.6$1.8$2.0$2.2$2.4$2.6$2.8$3.0
0
10
20
30
40
50
60
70
80
90
2014 2015 2016 2017 2018
Number of IPOs Proceeds US$b
-$2
$2
$6
$10
$14
$18
$22
$26
0
5
10
15
20
25
30
2014 2015 2016 2017 2018
40%
16%
64%
14%
17%
2%
333% 698%
15%
5% 39%
808%
Global IPO trends: Q4 2018 | Page 21
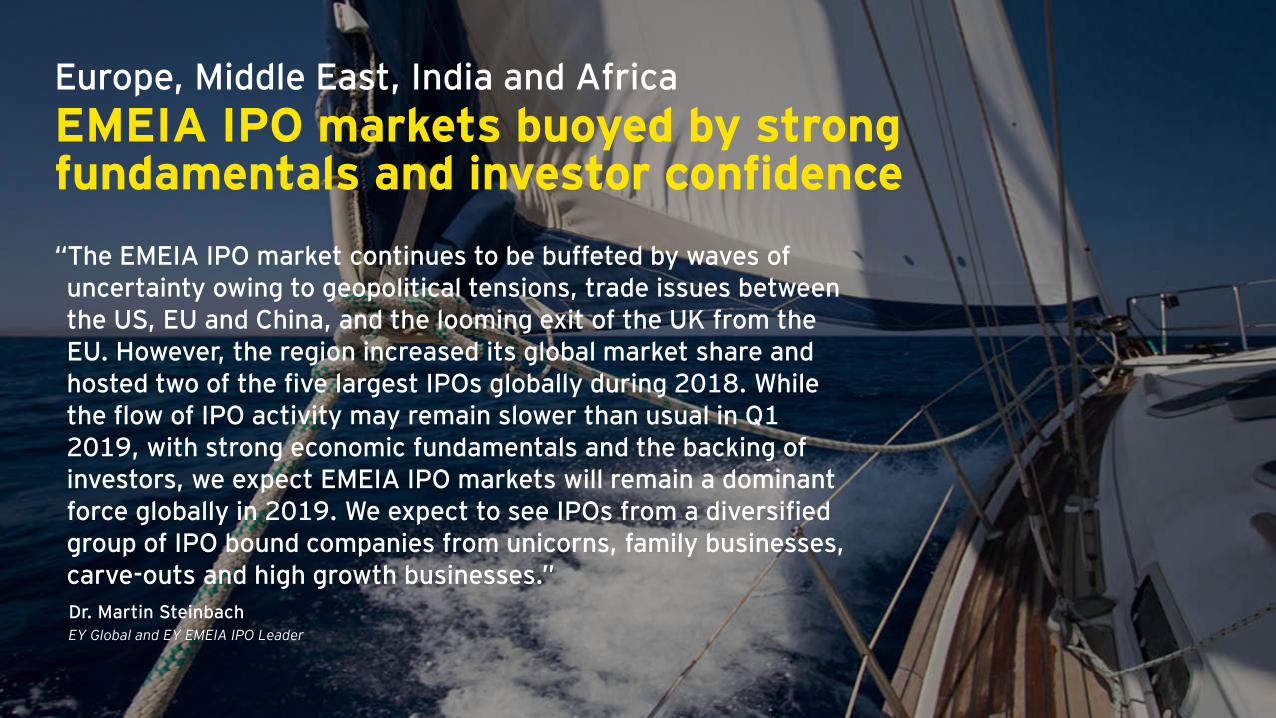
Europe, Middle East, India and AfricaEMEIA IPO markets buoyed by strong fundamentals and investor confidence“The EMEIA IPO market continues to be buffeted by waves of uncertainty owing to geopolitical tensions, trade issues between the US, EU and China, and the looming exit of the UK from the EU. However, the region increased its global market share and hosted two of the five largest IPOs globally during 2018. While the flow of IPO activity may remain slower than usual in Q1 2019, with strong economic fundamentals and the backing of investors, we expect EMEIA IPO markets will remain a dominant force globally in 2019. We expect to see IPOs from a diversified group of IPO bound companies from unicorns, family businesses, carve-outs and high growth businesses.” Dr. Martin SteinbachEY Global and EY EMEIA IPO Leader

Global IPO trends: Q4 2018 | Page 22All values are US$ unless otherwise noted. | Q4 2018 and Q4 18 refer to the fourth quarter of 2018 and cover priced IPOs from 1 October to 5 December 2018 plus expected IPOs by end of December. YTD 2018 and 2018 refer to the full year of 2018 and cover priced IPOs from 1 January to 5 December 2018 plus expected IPOs by end of December.
Markets 2018 Change on
prior year Q4 2018Change on prior year quarter
432IPOs
79IPOs
$47.7bproceeds
$12.0bproceeds
Europe, Middle East, India and Africa
Highlights from the markets► Geopolitical tensions had a clear impact on EMEIA IPO activity in
2018, as deal volume dropped 16% compared with 2017. An unclear path to Brexit, political changes in Germany and Italy, and US trade and tariff uncertainties all had a direct impact on EMEIA economies and IPO activity.
► Despite these challenges, EMEIA exchanges remained strong as the world’s second-largest IPO market. EMEIA accounted for 32% of global volume and 23% by proceeds in 2018. EMEIA accounted for three of the top ten exchanges by proceeds (Germany, UK and India) and one by volume (India).
► In Europe, Northern EU economies remain stable and interest rates remain low. However, geopolitical issues and trade tensions continue to mute investor confidence. 2018 IPO deal volumes fell by 16% and proceeds fell by 17%, versus 2017.
► UK markets remain active, despite the Brexit turmoil. The London Main Market and AIM ranked seventh place within the top ten exchanges globally by proceeds in 2018. UK IPOs raised US$8.5b from 51 IPOs.
► In India, a liquidity crisis among non-bank lenders caused a correction in the Indian stock market in Q4 2018. At the same time, foreign investors continue to be net sellers of equity, which has triggered in a drop in the Indian rupee. In 2018, Indian exchanges saw 161 IPOs, raising US$5.5b in capital.
► In the Middle East and North Africa (MENA), volatility in oil prices, coupled with geopolitical tensions in the region and volatility in global equity markets have caused investors in MENA IPO markets to press pause. As a result, IPO candidates have put their transactions on hold until favorable conditions return in the region.
► Technology and industrials posted the highest deal numbers in EMEIA in Q4 2018, while industrials overwhelmingly drove proceeds. For 2018, technology, industrials and consumer products sectors saw the highest number of IPOs.
► Cross-border activity of EMEIA issuers rose during 2018 (9.6% of IPOs), moving toward the historical average of 10%.
Activity Q4 2018
Stock exchangesBy highest proceeds
Deutsche Börse(Main+Scale)$4.6b3 IPOsGermany
London (Main and AIM)$2.7b13 IPOsUK
Euronext & Alternext$1.5b5 IPOsNetherlands, Belgium, Paris, Lisbon
IPOslargest byproceeds
Knorr-Bremse AG$4.4bGermanyIndustrialsDeutsche Börse
Aston Martin Lagonda Global Holdings plc$1.4bUKIndustrialsLondon (LSE)
Neoen SA$807mFranceEnergyEuronext (Paris)
Sectorsby highestnumber of IPOs
Technology16 IPOs$485m
Industrials14 IPOs$6,792m
Consumer products12 IPOs$617m
All amounts in table are in US$
Main markets Junior marketsQ4 2018
Change on prior year quarter
Q4 2018Change on prior year quarter
39IPOs
40IPOs
$11.6bproceeds
$0.3bproceeds
All amounts in table are in US$
All amounts in table are in US$
$0.0
$1.0
$2.0
$3.0
$4.0
$5.0
$6.0
$7.0
0
50
100
150
200
250
300
350
2014 2015 2016 2017 2018
Number of IPOs Proceeds US$b
$0
$20
$40
$60
$80
0
50
100
150
200
250
2014 2015 2016 2017 2018
16%
37%
26%
47%
43%
41%
54%
76%

Global IPO trends: Q4 2018 | Page 23All values are US$ unless otherwise noted. | Q4 2018 and Q4 18 refer to the fourth quarter of 2018 and cover priced IPOs from 1 October to 5 December 2018 plus expected IPOs by end of December. YTD 2018 and 2018 refer to the full year of 2018 and cover priced IPOs from 1 January to 5 December 2018 plus expected IPOs by end of December.
Trends
Sources of IPOs
2018
2018
Cross-border 9.6% of all EMEIA issuers* listed abroad
Outbound4.7% of all EMEIA issuers* listed outside EMEIA
Inbound5.4% of cross-border IPOs globally** listedon EMEIA exchanges but came fromoutside the region
*There were 446 IPOs by EMEIA issuers in YTD 2018. This analysis is based on the listed company domicile, regardless of the listed company exchange.** There were 130 cross-border IPOs globally in YTD 2018.
Europe, Middle East, India and Africa
Cross-border activity 2018
EMEIA issuers’ cross-border activityPercentage of all EMEIA issuers
IPOs that launched in 2018 posted first-day returns of nearly 10% and have outperformed most main market indices in 2018, solidifying investor confidence in the EMEIA IPO market.
7IPOs
21IPOs
Transaction sizes 2018
Main markets Junior markets2018 Change on prior year 2018 Change on prior year
Median post-IPO market cap $255.6m $11.3mMedian deal size $83.2m $2.9mTrends
21%
8%
71%
Percentage of proceeds
All amounts in table are in US$. Figures may not total 100% due to rounding.
7%3%
90%
Percentageof IPOs
43IPOs
Financial sponsor-backed Former state-owned enterprises Non-financial sponsor-backed
12%
21% 19% 15% 10% 7%
1% 1%2% 1%
3%
78% 80% 83% 89% 90%
2014 2015 2016 2017 2018
16%
12%8% 8%
10%
2014 2015 2016 2017 2018
$0
$100
$200
$300
2014 2015 2016 2017 2018$0
$10
$20
$30
$40
2014 2015 2016 2017 2018
Median post-IPO market cap US$m
Median deal size US$m
15%2%
13%

Global IPO trends: Q4 2018 | Page 24All values are US$ unless otherwise noted. | Q4 2018 and Q4 18 refer to the fourth quarter of 2018 and cover priced IPOs from 1 October to 5 December 2018 plus expected IPOs by end of December. YTD 2018 and 2018 refer to the full year of 2018 and cover priced IPOs from 1 January to 5 December 2018 plus expected IPOs by end of December.
Europe, Middle East, India and Africa
PerformanceEquity indices 2018
BSE SENSEX+6.1%India
CAC 40-5.6%France
DAX 30-12.3%Germany
Euro STOXX 50-9.2%Europe
FTSE 100-8.7%UK
JSE All Share-12.2%South Africa
MICEX+15.8%Russian Federation
Tadawul All Share+6.4%Saudi Arabia
IPO pricing and performance 2018
First-day average return
Share price performance since IPO
Main markets +9.6% +9.0%
Junior markets +7.6% -2.2%
Volatility indices
VSTOXX®
17.20index level
+27.4%YTD
+16.6%Q3 2018
VDAX®
18.36 index level
+29.7%YTD
+21.0%Q3 2018
VFTSE 100 16.83index level
+76.3%YTD
+43.3%Q3 2018
+ or – indicates change since 29 December 2017
-+ indicates a increase in volatility as at 4 December 2018 compared with 29 December 2017 for year-to-date (YTD) and 28 September 2018 for end of Q3 2018. Whereas -indicates an decrease in volatility over the same time period.+ or – indicates change compared with offer price at IPO
► Looking ahead to 2019, a number of uncertainties prevail, including the US-China-EU trade tensions, Brexit and uncertainty with respect to the stability of selected European country economies. At the same time, with interest rates expected to rise in the US, it’s only a matter of time before the European Central Bank feels the pressure to follow suit. These issues will likely continue to influence IPO activity in the quarters to come. However, with strong economic fundamentals and investor confidence, EMEIA IPO markets are expected to remain a dominant force globally in 2019.
► In Europe, all eyes will be on the four largest economies (France, Germany, Italy and the UK). If one falters, it could challenge capital and IPO markets. Meanwhile, Brexit will be an issue until the UK and EU Governments finalize a plan no later than Q1 2019. European IPO deal activity could remain sluggish until the second half of 2019.
► In the UK, Brexit will likely find resolution in Q1 2019. In Q1 2019, we anticipate that foreign IPO candidates will dominate IPO activity as domestic companies delay their IPO plans and wait to see how markets react post-Brexit. In the second half of 2019, the UK IPO markets are expected to kick back into gear as domestic IPO candidates look to launch when the timing is right.
► In India, the results of a series of upcoming state elections may impact macroeconomic stability in 2019. If the results are favorable, we expect Indian stock markets to rally and provide momentum to IPO activity, at least in Q1 2019. Overall, we expect IPO candidates to take a “wait and watch” approach, until the stock market correction, low rupee exchange rate, and other domestic and geopolitical uncertainties reach resolution.
► Across MENA, while pipelines remain robust, companies may continue to put their IPO plans on hold, at least in Q1 2019, in response to fluctuating oil prices and geopolitical uncertainty. However, there are positive opportunities ahead for MENA IPO markets: the Abu Dhabi Securities Exchange plans to roll out futures trading in 2019 to boost investments; the Morgan Stanley Capital International (MSCI) may reclassify the Kuwait Stock Exchange as an emerging market; and the Egyptian Government looks to list state-owned enterprises on its stock exchange.
► Given the ongoing political and economic instability in many key African markets, we continue to anticipate that African IPO activity will remain slow for the first half of 2019.
Outlook
Global IPO trends: Q4 2018 | Page 25All values are US$ unless otherwise noted. | Q4 2018 and Q4 18 refer to the fourth quarter of 2018 and cover priced IPOs from 1 October to 5 December 2018 plus expected IPOs by end of December. YTD 2018 and 2018 refer to the full year of 2018 and cover priced IPOs from 1 January to 5 December 2018 plus expected IPOs by end of December.
Markets2018 Change on
prior year Q4 2018Change on prior year quarter
228IPOs
61IPOs
$38.6bProceeds
$10.6bproceeds
10% of IPOs are financial sponsor-backed
5% of IPOs are financial sponsor-backed
Activity Q4 2018
Performance 2018
Europe snapshot
Main markets Junior marketsQ4 2018
Change on prior year quarter
Q4 2018Change on prior year quarter
29IPOs
32IPOs
$10.1bproceeds
$0.3bproceeds
All amounts in table are in US$
All amounts in table are in US$
73% IPO pricing and performance
First-day average return
Main markets +9.5%Junior markets +10.3%Share price performance since IPO
Main markets +12.2%Junior markets -0.5%
Equity indices
CAC 40-5.6%France
DAX 30-12.3%Germany
Euro STOXX 50-9.2%Europe
FTSE 100-8.7%UK
Volatility index
VSTOXX®
+27.4% | 17.2 index levelYTD
VFTSE 100 +76.3% | 16.8 index levelYTD
Sectorsby highest number of IPOs
Technology15 IPOs | $484m
Health care11 IPOs | $252m
Industrials9 IPOs | $6,704m
All amounts in table are in US$ + or – indicates change since 29 December 2017
+ indicates a increase in volatility as at 4 December 2018 compared with 29 December 2017 for year-to-date (YTD).
+ or – indicates change compared with offer price at IPO
IPOslargest by proceeds
Knorr-Bremse AG $4.4b Industrials, Deutsche Börse
Aston Martin Lagonda Global Holdings plc $1.4b Industrials, London (LSE)
Neoen SA $807m Energy, Euronext (Paris)
Stock exchanges by highest total proceeds
Deutsche Börse (Main and Scale)$4.6b | 3 IPOs Germany
London (Main and AIM)$2.7b | 13 IPOs UK
Euronext and Alternext$1.5b | 5 IPOs France, Belgium, Portugal
Trends 2018
Transaction sizesMain markets Change on prior year Junior markets Change on prior year
Median post-IPO market cap $240.2m $28.8m
Median deal size $89.0m $6.8m
$0
$1
$2
$3
$4
$5
$6
0
20
40
60
80
100
120
140
160
2014 2015 2016 2017 2018
Number of IPOs Proceeds US$b
$0
$10
$20
$30
$40
$50
$60
$70
0
20
40
60
80
100
120
140
160
180
2014 2015 2016 2017 2018
Cross-border IPOs: top IPO issuers
Cross-border 15% of all Europe issuers* listed abroad
35IPOs
Outbound7.3% of all Europe issuers* listed outside Europe
17IPOs
Inbound7.7% of cross-border IPOs globally** listed on European exchanges but came from outside Europe
10IPOs
*There were 234 IPOs by European issuers in 2018. This analysis is based on the listed company domicile, regardless of the listed company exchange.
** There were 130 cross-border IPOs globally in 2018.
17%
16%
14%
42%
35%
7%
26%
45%
16%
11%
8%

Global IPO trends: Q4 2018 | Page 26
EMEIA — UK IPO market insightBrexit uncertainty gives IPO candidates more time to prepare for 2019“Despite the uncertainty that Brexit has created, London exchanges continue to rank among the top 10 exchanges globally by proceeds. Moreover, we’ve seen some significant companies successfully complete their IPOs, proving that IPOs remain a viable option. Without a firm Brexit plan, we expect a slow start to H1 2019. However, once we have clarity, we believe the IPO window will reopen rapidly, so IPO candidates should now take the time to prepare in order to be ready to launch and take advantage of pent-up investor demand.”Scott McCubbinEY UK and Ireland IPO Leader

Global IPO trends: Q4 2018 | Page 27All values are US$ unless otherwise noted. | Q4 2018 and Q4 18 refer to the fourth quarter of 2018 and cover priced IPOs from 1 October to 5 December 2018 plus expected IPOs by end of December. YTD 2018 and 2018 refer to the full year of 2018 and cover priced IPOs from 1 January to 5 December 2018 plus expected IPOs by end of December.
Markets 2018 Change on
prior year Q4 2018Change on prior yearquarter
51IPOs
13IPOs
$8.5bproceeds
$2.7bproceeds
EMEIA — UK IPO market insight
Highlights from the markets► The Brexit story continues to play out as 2018 draws to a
close. As of 7 December 2018, a Brexit plan has yet to be finalized. As a result, it is difficult to predict the 2019 UK IPO market with any certainty. As it has in previous quarters, the shadow of Brexit continues to create uncertainty.
► Year-on-year, 2018 UK IPO deal volumes declined 35%, while proceeds fell by 43% compared with 2017. Lower deal volumes and proceeds largely reflect investor hesitation to back IPOs in a volatile and uncertain market.
► Nevertheless, London Main Market and AIM remain a key listing destination, ranking seventh within the top ten exchanges globally by proceeds during 2018.
► Despite the slowdown in transactions because of Brexit, the Q4 2018 deals that have moved forward have been sizeable. The Aston Martin Lagonda Global Holdings plc listing in October ranked as the fourth biggest IPO globally in Q4 2018, posting US$1.4b in proceeds.
► Due to the Aston Martin deal, industrials led UK IPO activity by proceeds in Q4 2018. By deal number, materials and technology each saw three IPOs, while consumer products and financials saw two IPO each.
► Cross-border activity in the UK market in Q4 2018 included companies from Kazakhstan, Cuba and South Africa with one IPO each. In 2018 as a whole, UK exchanges hosted 14 inbound deals with proceeds totalling US$3.1b, accounting for 27% of UK IPOs and 37% by total proceeds.
► Although 2018 deal volumes and proceeds saw a decline from 2017 levels, the UK IPO pipeline remains robust. A pause in the UK IPO market is giving IPO candidates additional time to prepare so that they are well-positioned to take advantage of the reopening of the UK IPO window later in 2019.
Activity Q4 2018
Sectorsby highest number of IPOs
Materials3 IPOs$437m
Technology3 IPOs$235m
Consumer products2 IPOs$288m
IPOs on AIMlargest by proceeds
Manolete Partners plc$38mConsumer productsUK
Kropz plc$35mMaterialsSouth Africa
Renalytix AI plc$32mHealth careUK
IPOs on Main Marketlargest by proceeds
Aston Martin Lagonda Global Holdings plc$1.4bIndustrialsUK
National Atomic Company KazatompromJSC$401mMaterials Kazakhstan
Global Sustainability Trust plc$262mFinancialsUK
All amounts in table are in US$
London Main Market London AIMQ4 2018 Change on
Q4 2017 Q4 2018 Change on Q4 2017
8IPOs
5IPOs
$2.6bproceeds
$119mproceeds
All amounts in table are in US$
All amounts in table are in US$
$0
$2
$4
$6
$8
0
10
20
30
40
50
60
70
80
2014 2015 2016 2017 2018
Number of IPOs Proceeds US$b
$0
$5
$10
$15
$20
$25
0
5
10
15
20
25
30
35
40
45
2014 2015 2016 2017 2018
35%
20%
43% 43%
37%
67%
82%
48%
Global IPO trends: Q4 2018 | Page 28All values are US$ unless otherwise noted. | Q4 2018 and Q4 18 refer to the fourth quarter of 2018 and cover priced IPOs from 1 October to 5 December 2018 plus expected IPOs by end of December. YTD 2018 and 2018 refer to the full year of 2018 and cover priced IPOs from 1 January to 5 December 2018 plus expected IPOs by end of December.
Trends
Sources of IPOs
2018
41%
5%
54%
Percentage of proceeds
10%
2%
88%
Percentage of IPOs
EMEIA — UK IPO market insight
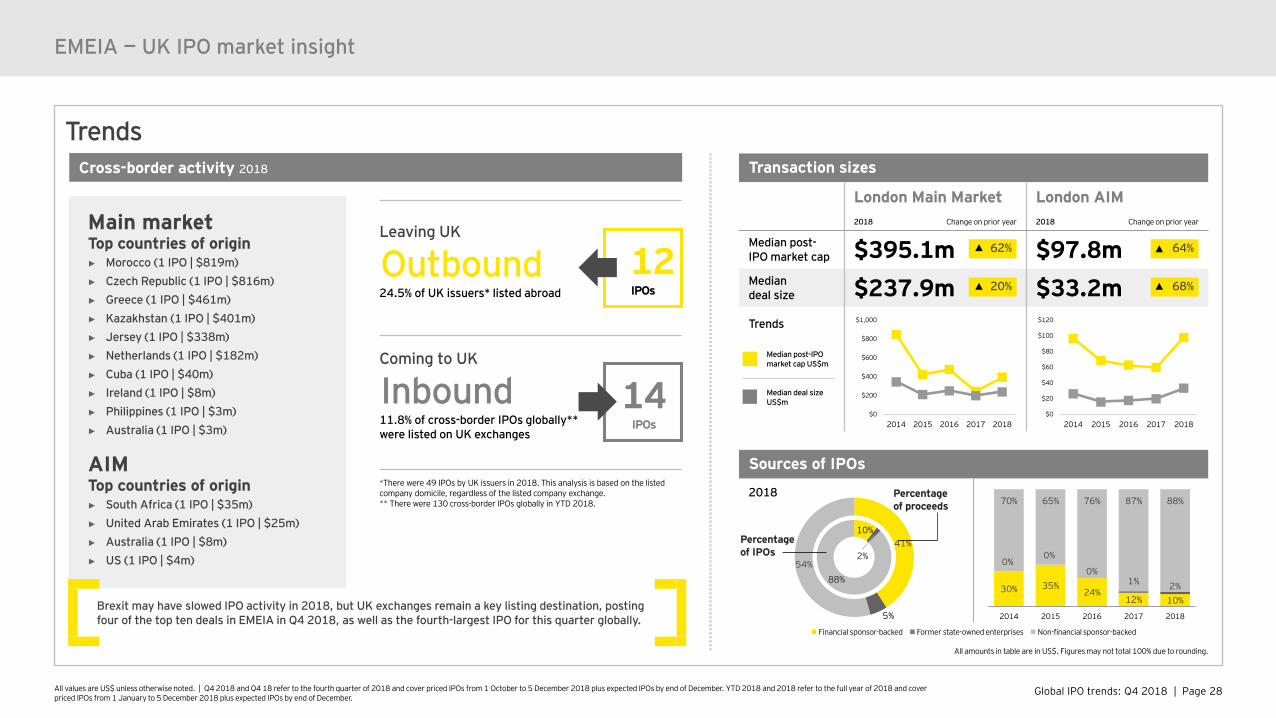
Leaving UK
Outbound24.5% of UK issuers* listed abroad
Coming to UK
Inbound 11.8% of cross-border IPOs globally**were listed on UK exchanges
*There were 49 IPOs by UK issuers in 2018. This analysis is based on the listed company domicile, regardless of the listed company exchange.** There were 130 cross-border IPOs globally in YTD 2018.
Cross-border activity 2018
Main marketTop countries of origin► Morocco (1 IPO | $819m)► Czech Republic (1 IPO | $816m)► Greece (1 IPO | $461m)► Kazakhstan (1 IPO | $401m)► Jersey (1 IPO | $338m)► Netherlands (1 IPO | $182m)► Cuba (1 IPO | $40m)► Ireland (1 IPO | $8m)► Philippines (1 IPO | $3m)► Australia (1 IPO | $3m)
AIMTop countries of origin► South Africa (1 IPO | $35m)► United Arab Emirates (1 IPO | $25m)► Australia (1 IPO | $8m)► US (1 IPO | $4m)
14IPOs
12IPOs
Transaction sizes
London Main Market London AIM2018 Change on prior year 2018 Change on prior year
Median post-IPO market cap $395.1m $97.8mMedian deal size $237.9m $33.2mTrends
Median post-IPO market cap US$m
Median deal size US$m
All amounts in table are in US$. Figures may not total 100% due to rounding.
Financial sponsor-backed Former state-owned enterprises Non-financial sponsor-backed
Brexit may have slowed IPO activity in 2018, but UK exchanges remain a key listing destination, posting four of the top ten deals in EMEIA in Q4 2018, as well as the fourth-largest IPO for this quarter globally.
$0
$200
$400
$600
$800
$1,000
2014 2015 2016 2017 2018$0
$20
$40
$60
$80
$100
$120
2014 2015 2016 2017 2018
68%
64%62%
20%
30% 35%24%
12% 10%
0%0%
0%1% 2%
70% 65% 76% 87% 88%
2014 2015 2016 2017 2018

Global IPO trends: Q4 2018 | Page 29All values are US$ unless otherwise noted. | Q4 2018 and Q4 18 refer to the fourth quarter of 2018 and cover priced IPOs from 1 October to 5 December 2018 plus expected IPOs by end of December. YTD 2018 and 2018 refer to the full year of 2018 and cover priced IPOs from 1 January to 5 December 2018 plus expected IPOs by end of December.
EMEIA — UK IPO market insight
PerformanceEquity indices 2018
FTSE 100-8.7%UK
FTSE 350-9.1%UK
FTSE AIM All-Share-12.1%UK
IPO pricing and performance 2018
First-day average return
Share price performance since IPO
London Main Market +1.6% -4.6%
London AIM +17.0% +4.3%
Volatility indices
FTSE 100 VIX (VFTSE 100)16.83 index level
+76.3%YTD
+43.3%Q3 2018
+ or – indicates change since 29 December 2017+ or – indicates change compared with offer price at IPO
+ indicates a increase in volatility as at 4 December 2018 compared with 29 December 2017 for year-to-date (YTD) and 28 September 2018 for end of Q3 2018. Whereas - indicates an decrease in volatility over the same time period.
► The outlook for Q1 2019 remains uncertain. However, once a Brexit deal is finalized between the UK and the EU, we anticipate a resurgence of activity in the IPO market as IPO candidates that have been sitting on the sidelines take advantage of pent-up investors’ demand once the IPO window reopens.
► While we expect IPO activity in Q1 2019 to remain slow, we may see an uptick in cross-border IPO activity as foreign IPO candidates will want to take advantage of the UK market earlier in the year. Domestic IPO candidates may choose to delay their listings until the dust settles to gauge the full impact of Brexit on the UK capital markets and the economy.
► In a post-Brexit world, investors may initially look to sectors and established companies with strong track records, which would mean that we may see more mature businesses and those in traditional sectors come to the public markets during 2019.
Outlook
AppendixAreas and regional IPO markets facts and figures
Definitions

Global IPO trends: Q4 2018 | Page 31*Data based on domicile of the exchange, regardless of the listed company domicile. Euronext includes Amsterdam, Paris, Brussels and Lisbon; Shenzhen (SZSE) includes the Main Board, SME Board and ChiNext.
Appendix
By number of IPOs
2018
yea
r-to
-dat
e
Ranking Stock exchanges* Number of IPOs % of global IPOs
1 Hong Kong (HKEx) and GEM 197 14.52 National (NSE and SME) and Bombay (BSE and SME) 161 11.83 NASDAQ 142 10.44 Tokyo (TSE), MOTHERS and JASDAQ 96 7.15 Australia (ASX) 85 6.36 New York (NYSE) 63 4.67 Korea (KRX and KOSDAQ) 62 4.68 Shanghai (SSE) 59 4.39 NASDAQ OMX and First North 55 4.0
10 Indonesia (IDX) 53 3.911 London (Main and AIM) 51 3.812 Shenzhen (SZSE and Chinext) 46 3.4
Other stock exchanges (46) 289 21.3
Global IPO activity 1,359 100.0
2017
Ranking Stock exchanges* Number of IPOs % of global IPOs
1 Shenzhen (SZSE and Chinext) 222 13.02 Shanghai (SSE) 214 12.53 National (NSE and SME) and Bombay (BSE and SME) 171 10.04 Hong Kong (HKEx and GEM) 159 9.35 NASDAQ 109 6.36 Australia (ASX) 96 5.67 Tokyo (TSE), MOTHERS and JASDAQ 90 5.38 NASDAQ OMX and First North 86 5.09 London (Main and AIM) 78 4.6
10 New York (NYSE) 71 4.111 Korea (KRX+KOSDAQ) 56 3.312 Thailand (SET+MAI) 44 2.6
Other stock exchanges (53 exchanges) 318 18.6
Global IPO activity 1,714 100.0
By proceedsRanking Stock exchanges* US$b % of global IPOs
1 Hong Kong (HKEx) and GEM 35.4 17.32 New York (NYSE) 29.7 14.53 Tokyo (TSE), MOTHERS and JASDAQ 26.4 12.94 NASDAQ 23.1 11.35 Deutsche Börse (Main and Scale) 13.6 6.66 Shanghai (SSE) 13.6 6.67 London (Main and AIM) 8.5 4.18 Shenzhen (SZSE and Chinext) 7.6 3.79 National (NSE and SME) and Bombay (BSE and SME) 5.5 2.7
10 Australia (ASX) 5.0 2.411 Euronext and Alternext 4.1 2.012 NASDAQ OMX and First North 3.6 1.8
Other stock exchanges (46) 28.7 14.0
Global IPO activity 204.8 100.0
Ranking Stock exchanges* US$b % of global IPOs
1 New York (NYSE) 30.1 15.72 Shanghai (SSE) 20.3 10.53 Hong Kong (HKEx) and GEM 16.1 8.44 London (Main and AIM) 14.8 7.75 Shenzhen (SZSE and Chinext) 13.7 7.16 National (NSE and SME) and Bombay (BSE and SME) 11.7 6.17 NASDAQ 10.3 5.38 Korea (KRX and KOSDAQ) 6.8 3.59 Tokyo (TSE), MOTHERS and JASDAQ 6.1 3.2
10 Sao Paulo (BM&F BOVESPA) 5.7 3.011 NASDAQ OMX and First North 4.9 2.612 SIX Swiss Exchange 4.6 2.4
Other stock exchanges (53 exchanges) 47.2 24.6
Global IPO activity 192.3 100.0
Top 12 stock exchanges
Global IPO trends: Q4 2018 | Page 32*Data based on domicile of the exchange, regardless of the listed company domicile. Euronext includes Amsterdam, Paris, Brussels and Lisbon; Shenzhen (SZSE) includes the Main Board, SME Board and ChiNext.
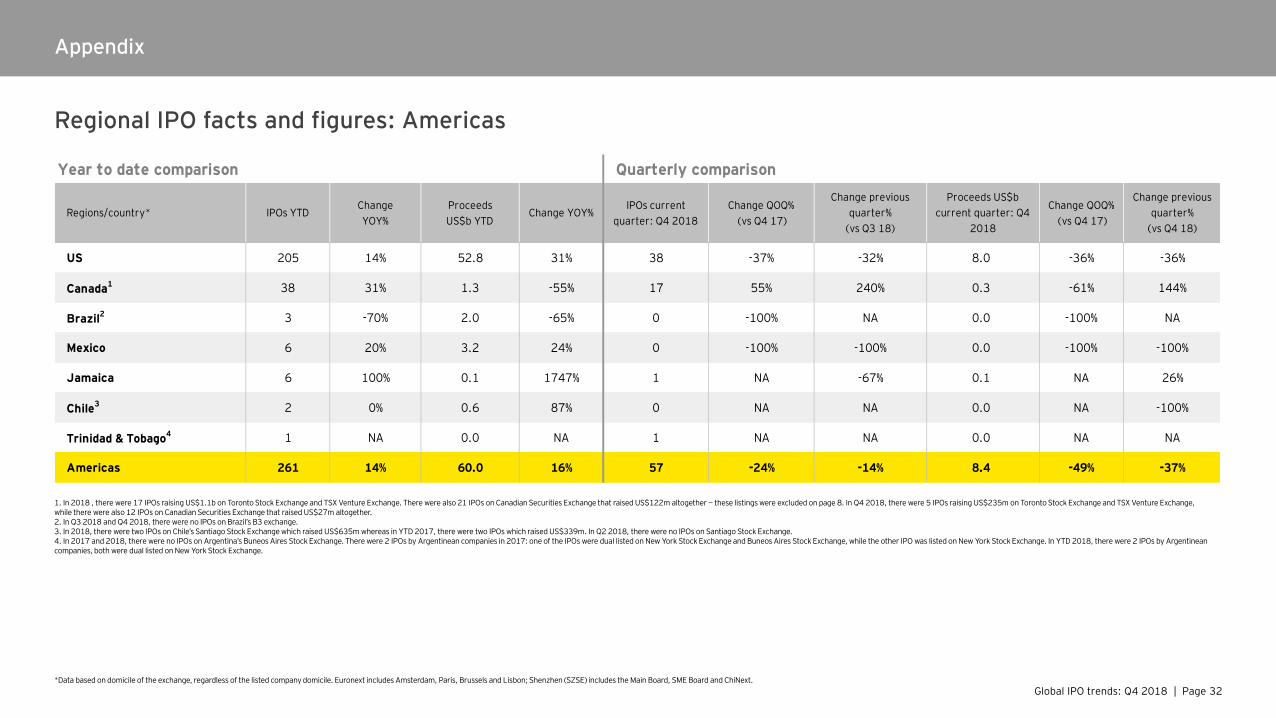
1. In 2018 , there were 17 IPOs raising US$1.1b on Toronto Stock Exchange and TSX Venture Exchange. There were also 21 IPOs on Canadian Securities Exchange that raised US$122m altogether — these listings were excluded on page 8. In Q4 2018, there were 5 IPOs raising US$235m on Toronto Stock Exchange and TSX Venture Exchange, while there were also 12 IPOs on Canadian Securities Exchange that raised US$27m altogether.2. In Q3 2018 and Q4 2018, there were no IPOs on Brazil’s B3 exchange.3. In 2018, there were two IPOs on Chile’s Santiago Stock Exchange which raised US$635m whereas in YTD 2017, there were two IPOs which raised US$339m. In Q2 2018, there were no IPOs on Santiago Stock Exchange. 4. In 2017 and 2018, there were no IPOs on Argentina’s Buneos Aires Stock Exchange. There were 2 IPOs by Argentinean companies in 2017: one of the IPOs were dual listed on New York Stock Exchange and Buneos Aires Stock Exchange, while the other IPO was listed on New York Stock Exchange. In YTD 2018, there were 2 IPOs by Argentinean companies, both were dual listed on New York Stock Exchange.
Appendix
Regional IPO facts and figures: Americas
US 205 14% 52.8 31% 38 -37% -32% 8.0 -36% -36%
Canada1 38 31% 1.3 -55% 17 55% 240% 0.3 -61% 144%
Brazil2 3 -70% 2.0 -65% 0 -100% NA 0.0 -100% NA
Mexico 6 20% 3.2 24% 0 -100% -100% 0.0 -100% -100%
Jamaica 6 100% 0.1 1747% 1 NA -67% 0.1 NA 26%
Chile3 2 0% 0.6 87% 0 NA NA 0.0 NA -100%
Trinidad & Tobago4 1 NA 0.0 NA 1 NA NA 0.0 NA NA
Americas 261 14% 60.0 16% 57 -24% -14% 8.4 -49% -37%
Quarterly comparison
Regions/country* IPOs YTDChange YOY%
Proceeds US$b YTD
Change YOY%Change previous
quarter% (vs Q3 18)
Proceeds US$b current quarter: Q4
2018
Change QOQ% (vs Q4 17)
Change previous quarter%
(vs Q4 18)
Change QOQ% (vs Q4 17)
IPOs current quarter: Q4 2018
Year to date comparison
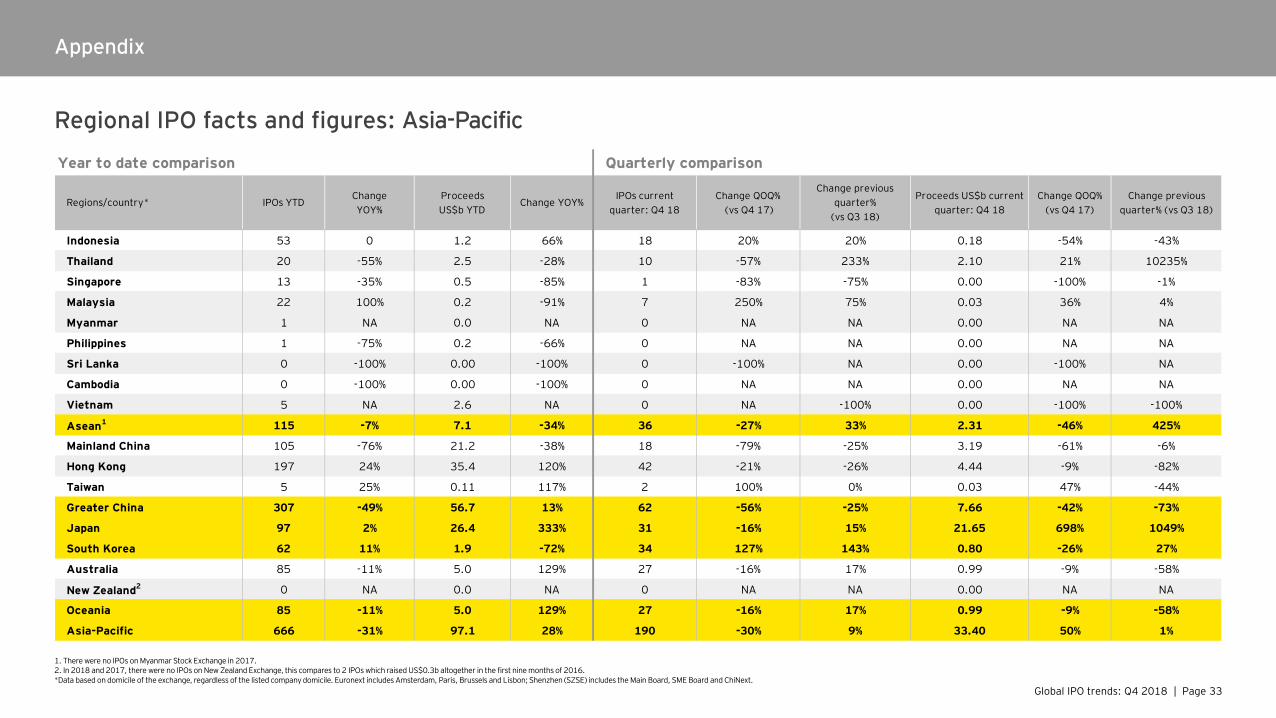
Global IPO trends: Q4 2018 | Page 33*Data based on domicile of the exchange, regardless of the listed company domicile. Euronext includes Amsterdam, Paris, Brussels and Lisbon; Shenzhen (SZSE) includes the Main Board, SME Board and ChiNext.
Appendix
1. There were no IPOs on Myanmar Stock Exchange in 2017.2. In 2018 and 2017, there were no IPOs on New Zealand Exchange, this compares to 2 IPOs which raised US$0.3b altogether in the first nine months of 2016.
Regional IPO facts and figures: Asia-Pacific
Indonesia 53 0 1.2 66% 18 20% 20% 0.18 -54% -43%
Thailand 20 -55% 2.5 -28% 10 -57% 233% 2.10 21% 10235%
Singapore 13 -35% 0.5 -85% 1 -83% -75% 0.00 -100% -1%
Malaysia 22 100% 0.2 -91% 7 250% 75% 0.03 36% 4%
Myanmar 1 NA 0.0 NA 0 NA NA 0.00 NA NA
Philippines 1 -75% 0.2 -66% 0 NA NA 0.00 NA NA
Sri Lanka 0 -100% 0.00 -100% 0 -100% NA 0.00 -100% NA
Cambodia 0 -100% 0.00 -100% 0 NA NA 0.00 NA NA
Vietnam 5 NA 2.6 NA 0 NA -100% 0.00 -100% -100%
Asean1 115 -7% 7.1 -34% 36 -27% 33% 2.31 -46% 425%
Mainland China 105 -76% 21.2 -38% 18 -79% -25% 3.19 -61% -6%
Hong Kong 197 24% 35.4 120% 42 -21% -26% 4.44 -9% -82%
Taiwan 5 25% 0.11 117% 2 100% 0% 0.03 47% -44%
Greater China 307 -49% 56.7 13% 62 -56% -25% 7.66 -42% -73%
Japan 97 2% 26.4 333% 31 -16% 15% 21.65 698% 1049%
South Korea 62 11% 1.9 -72% 34 127% 143% 0.80 -26% 27%
Australia 85 -11% 5.0 129% 27 -16% 17% 0.99 -9% -58%
New Zealand2 0 NA 0.0 NA 0 NA NA 0.00 NA NA
Oceania 85 -11% 5.0 129% 27 -16% 17% 0.99 -9% -58%
Asia-Pacific 666 -31% 97.1 28% 190 -30% 9% 33.40 50% 1%
Regions/country* IPOs YTDChange YOY%
Proceeds US$b YTD
Change YOY%IPOs current
quarter: Q4 18
Quarterly comparison
Change QOQ% (vs Q4 17)
Change previous quarter%
(vs Q3 18)
Proceeds US$b current quarter: Q4 18
Change QOQ% (vs Q4 17)
Change previous quarter% (vs Q3 18)
Year to date comparison

Global IPO trends: Q4 2018 | Page 34*Data based on domicile of the exchange, regardless of the listed company domicile. Euronext includes Amsterdam, Paris, Brussels and Lisbon; Shenzhen (SZSE) includes the Main Board, SME Board and ChiNext.
Appendix
Regional IPO facts and figures: EMEIA
Nordics (Denmark, Norway, Sweden and Finland)
76 -22% 4.7 -24% 26 -21% 420% 0.4 -80% 300%
Commonwealth of Independent States (CIS)
0 -100% 0.0 -100% 0 NA NA 0.0 NA NA
Central and Southern Europe (CSE)
26 -13% 2.3 -10% 6 -50% 100% 0.7 5% 11786%
Germany, Switzerland and Austria (GSA)
24 41% 17.1 75% 3 -57% 50% 4.6 0% 160%
Mediterrean (Italy and Spain) 27 -7% 1.9 -78% 9 -10% -25% 0.6 -44% 489%
WEM (Western Europe and Maghreb)
26 37% 4.2 10% 6 20% 0% 1.6 108% 1347%
Continental Europe 179 -9% 30.2 -5% 50 -28% 79% 7.9 6% 277%
UK and Ireland1 52 -33% 8.6 -42% 10 -60% -9% 2.7 -43% 91%
Europe 231 -16% 38.7 -17% 60 -36% 54% 10.6 -13% 202%
Africa2 5 -38% 0.6 -1% 1 -50% -50% 0.0 -90% -88%
India3 168 -8% 5.6 -53% 13 -69% -72% 0.3 -95% -68%
Middle East and North Africa4 28 -45% 2.9 -36% 5 -1% 25% 1.0 -0.6% 200%
EMEIA 432 -16% 47.7 -26% 79 -47% -14% 12.0 -43% 137%
Quarterly comparison
IPOs current quarter: Q4 18
Change QOQ% (vs Q4 17)
Change previous quarter%
(vs Q3 18)
Year to date comparison
Regions/country* IPOs YTDChange YOY%
Proceeds US$b YTD
Change YOY%Proceeds US$b
current quarter: Q4 18
Change QOQ% (vs Q4 17)
Change previous quarter% (vs Q3 18)
1. In YTD 2018, there were 37 IPOs on London Main Market and AIM, which raised US$5.1b and in Q3 2018, there were 10 IPOs which raised US$836m. In YTD 2018, there was 1 IPO on Ireland’s Irish Stock Exchange, which raised US$88m. 2. In YTD 2018 and Q3 2018, there were 4 IPOs and 2 IPOs respectively on African exchanges, which raised US$527m and US$285m. There were 2 IPOs in Q2 2018. In YTD 2017, there was 6 IPOs on African exchanges that raised US$1.6b.3. India includes India’s National and Bombay Stock Exchange Main Market and SME (128 IPOs, US$5.2b) and Bangladesh’s Dhaka Stock Exchange (6 IPOs, US$45m).4. Middle East and North Africa includes IPO activity on Israel’s Stock Exchange (8 IPOs, US$359m).
Regions is as per EY regional classification for EMEIA Area. This table may have different statistics for MENA and India compared to the EMEIA section in the report (page 22-25) and UK section (page 26-29).

Global IPO trends: Q4 2018 | Page 35*Data based on domicile of the exchange, regardless of the listed company domicile. Euronext includes Amsterdam, Paris, Brussels and Lisbon; Shenzhen (SZSE) includes the Main Board, SME Board and ChiNext.
Appendix
Most active sectors around the worldSummary of the top three sectors by number of IPOs, by region1 and sub-region1 for Q4 2018 () and 2018 year-to-date ()
Stock exchange regions Technology Industrials Health
care Materials Consumerproducts Financials Consumer
staplesReal
estate Energy Retail Media and entertainment Telecommunications
Americas
• US
Asia-Pacific
• Greater China
• Japan
EMEIA
• Europe2
• UK3
Global
2018 year-to-date global IPO activity
254 205 193 150 137 92 82 82 59 42 42 21
Q4 2018 IPO activity 64 49 61 41 29 18 6 18 14 6 14 6
1. Region and sub-regions are classified according to the domicile of the exchange, regardless of the listed company domicile. Please refer to the appendix for the geographic definitions of the regions and sub-regions, which differs slightly from the EY regional classification.2. For Q4 2019, European exchanges saw four active sectors. Technology led the pack with 15 IPOs, health care saw 11 IPOs, while industrials and consumer products sectors accounted for 9 IPOs each, with proceeds of US$6.7b and US$507m, respectively.3. For Q4 2018. UK exchanges saw four most active sectors. Materials and technology sectors saw 3 IPOs each, with proceeds of US$437m and US$235m, respectively. While consumer products and financials sectors had 1 deal each, with proceeds of US$288m and US$269m, respectively.
Global IPO trends: Q4 2018 | Page 36
Definitions
Methodology• The data presented in the Global IPO trends: Q4 2018 report and press release
is from Dealogic and EY. Q4 2018 (i.e., October—December) and YTD 2018 (January—December) is based on priced IPOs as of 5 December 2018 and expected IPOs in December. Data is up to 5 December 2018, 12 p.m. UK time. All data contained in this document is sourced to Dealogic and EY unless otherwise noted.
• For the purposes of these reports and press releases, we focus only on IPOs of operating companies and define an IPO as a company's first offering of equity to the public.
• This report includes only those IPOs for which Dealogic and EY offer data regarding the issue date (the day the offer is priced and allocations are subsequently made), trading date (the date on which the security first trades) and proceeds (funds raised, including any over-allotment sold). Postponed IPOs, or those which have not yet been priced, are therefore excluded. Over-the-counter (OTC) listings are also excluded.
• In an attempt to exclude non-operating company IPOs such as trusts, funds and special purpose acquisition companies (SPACs), companies with the following Standard Industrial Classification (SIC) codes are excluded:
• 6091: Financial companies that conduct trust, fiduciary and custody activities
• 6371: Asset management companies such as health and welfare funds, pension funds and their third-party administration as well as other financial vehicles
• 6722: Companies that are open-end investment funds
• 6726: Companies that are other financial vehicles
• 6732: Companies that are grant-making foundations• 6733: Asset management companies that deal with trusts, estates and
agency accounts
• 6799: Special purpose acquisition companies (SPACs)
• In our analysis, unless stated otherwise, IPOs are attributed to the domicile of the company undertaking an IPO. The primary exchange on which they are listed is as defined by Dealogic and EY research.
• A cross-border (or foreign) listing is where the stock exchange nation of the company is different from the company's domicile (i.e., issuer's nation).
• For IPO listings on HKEx; SSE; SZE; Japan’s Tokyo Stock Exchange (TSE); TSE MOTHERS; Korea's KRX and KOSDAQ; Thailand's SET and MAI; Indonesia IDX; WSE; NewConnect; TSX and TSX-V exchanges, we use their first trading date in place of issue date.
Markets definitions• Many stock exchanges have set up main markets and junior markets:
• Main markets are where medium and large IPOs (by proceeds) are usually listed and traded. Junior markets are where small-cap companies or smaller IPOs are listed or traded. Stock exchanges without junior markets are classified as main markets.
• Junior markets include Americas: Toronto Venture Exchange and Canadian National Stock Exchange; Asia-Pacific: Malaysia ACE Market, Bombay SME, Hong Kong Growth Enterprise Market, Japan JASDAQ, Japan MOTHERS, Korea KOSDAQ, Thailand’s Market for Alternative Investment, National SME, Shenzhen ChiNext, Singapore Catalist, Tokyo Stock Exchange MOTHERS Index; EMEIA: Alternext, London Alternative Investment Market, Germany's Frankfurt SCALE (formerly Entry Standard), Spain's Mercado Alternativo Bursatil, NASDAQ OMX First North, Warsaw New Connect, Johannesburg Alternative Market, Nomu — Parallel Market.
• Emerging markets or rapid-growth markets include issuers from Argentina, Armenia, Bangladesh, Bolivia, Brazil, Bulgaria, Chile, Colombia, Croatia, Cyprus, Egypt, Ethiopia, Greater China, Hungary, India, Indonesia, Ireland, Israel, Kenya, Kuwait, Kazakhstan, Laos, Lithuania, Malaysia, Mauritius, Mexico, Namibia, Pakistan, Peru, Philippines, Poland, Qatar, Russian Federation, Saudi Arabia, Sierra Leone, Singapore, Slovenia, South Africa, South Korea, Sri Lanka, Tanzania, Thailand, Tunisia, Turkey, Ukraine, United Arab Emirates, Vietnam and Zambia.
• Developed markets include issuers from Australia, Austria, Belgium, Bermuda, Canada, Denmark, Finland, France, Germany, Greece, Guernsey, Isle of Man, Italy, Japan, Jersey, Luxembourg, Netherlands, New Zealand, Norway, Portugal, Spain, Sweden, Switzerland, the United Kingdom and the United States.
Geographic definitions• Africa includes Algeria, Botswana, Egypt, Ghana, Kenya, Madagascar, Malawi,
Morocco, Namibia, Rwanda, South Africa, Tanzania, Tunisia, Uganda, Zambia and Zimbabwe.
• Americas includes North America and Argentina, Bermuda, Brazil, Chile, Colombia, Jamaica, Mexico and Peru.
• Asean includes Brunei, Cambodia, Guam, Indonesia, Laos, Malaysia, Maldives, Myanmar, North Mariana Islands, Philippines, Singapore, Sri Lanka, Thailand and Vietnam.
• Asia includes Bangladesh, Greater China, Indonesia, Japan, Laos, Malaysia, Philippines, Singapore, South Korea, Sri Lanka, Thailand and Vietnam.
• Asia-Pacific includes Asia (as stated above) plus Australia, New Zealand, Fiji and Papua New Guinea.
• Central and South America includes Argentina, Bermuda, Brazil, Chile, Colombia, Ecuador, Jamaica, Mexico, Peru and Puerto Rico.
• EMEIA includes Armenia, Austria, Belgium, Bulgaria, Croatia, Cyprus, Czech Republic, Denmark, Estonia, Finland, France, Germany, Greece, Hungary, Iceland, India, Ireland, Isle of Man, Italy, Kazakhstan, Luxembourg, Lithuania, Netherlands, Norway, Pakistan, Poland, Portugal, Russian Federation, Spain, Sweden, Switzerland, Turkey, Ukraine and United Kingdom plus the Middle East and Africa countries listed below.
• Greater China includes Mainland China, Hong Kong, Macau and Taiwan.
• Middle East includes Bahrain, Iran, Israel, Jordan, Kuwait, Oman, Qatar, Saudi Arabia, Syria, United Arab Emirates and Yemen.
• North America consists of the United States and Canada.
Glossary• Financial sponsor-backed IPOs refer to IPOs that have private equity,
venture capital investors or both.• First-day average returns is the market value-weighted median of issuers’ offer
price versus the closing price at their first trade date, with the exception of the US section (page 10), where this is the mean of issuers’ offer price versus the closing price at their first trade date.
• Median deal size refers to the median IPO proceeds.
• Post-IPO market cap is the market value of the company after its IPO is completed. Median post-IPO market cap is calculated for IPOs priced by 4 December.
• Proceeds refers to total fund raised by the issuer company and selling shareholders. This is the total deal size.
• QOQ refers to quarter-on-quarter. This refers to the comparison of IPO activity on Q4 2018 with Q4 2017 for this current report.
• Share price performance since IPO is the market value weighted median current returns, which is the year-to-date returns as at 4 December 2018 versus offer price. This should be compared with equity indices performance that is also measured YTD. For the US section (page 10), this is the mean current returns.
• State-owned enterprise (SOE) privatizations refers to former state-owned entities that have completed their IPO listings to become public companies.
• YOY refers to year-on-year. This refers to the comparison of IPO activity for the full year of 2018 with the full year of 2017 for this current report.
• YTD stands for year-to-date. This refers to priced IPOs from 1 January to 5 December 2018 plus expected IPOs by the end of December.
EY | Assurance | Tax | Transactions | Advisory
About EY EY is a global leader in assurance, tax, transaction and advisory services. The insights and quality services we deliver help build trust and confidence in the capital markets and in economies the world over. We develop outstanding leaders who team to deliver on our promises to all of our stakeholders. In so doing, we play a critical role in building a better working world for our people, for our clients and for our communities.
EY refers to the global organization, and may refer to one or more, of the member firms of Ernst & Young Global Limited, each of which is a separate legal entity. Ernst & Young Global Limited, a UK company limited by guarantee, does not provide services to clients. For more information about our organization, please visit ey.com.
About EY’s Growth Markets NetworkEY worldwide Growth Markets Network is dedicated to serving the changing needs of high-growth companies. For more than 30 years, we’ve helped many of the world’s most dynamic and ambitious companies grow into market leaders. Whether working with international, mid-cap companies or early stage, venture backed businesses, our professionals draw upon their extensive experience, insight and global resources to help your business succeed. ey.com/growthmarkets
About EY’s Initial Public Offering ServicesEY is a leader in helping companies go public worldwide. With decades of experience, the global network is dedicated to serving market leaders and helping businesses evaluate the pros and cons of an initial public offering (IPO). We demystify the process by offering IPO readiness assessments, IPO preparation, project management and execution services, all of which help prepare you for life in the public spotlight. EY Global IPO Center of Excellence is a virtual hub, which provides access to our IPO knowledge, tools, thought leadership and contacts from around the world in one easy-to-use source.ey.com/ipocenter
© 2018 EYGM Limited. All Rights Reserved.
1811-2964967
EYG no: 012535-18Gbl
ED NoneThis material has been prepared for general information purposes only and is not intended to be relied upon as accounting, tax or other professional advice. Please refer to your advisors for specific advice.
ContactsDr. Martin SteinbachEY Global and EY EMEIA IPO [email protected]
Jackie KelleyEY Americas IPO Markets [email protected]
Ringo ChoiEY Asia-Pacific IPO [email protected]
Terence HoEY Greater China IPO [email protected]
Shinichiro SuzukiEY Japan IPO [email protected]
Scott McCubbinEY UK and Ireland IPO [email protected]
Find out more about future IPO prospectsFor more information on global IPO performance by quarter and year, and how the IPO market looks set to develop for the next 12 months, visit the EY Global IPO website:ey.com/ipoFollow the report on social media: via Twitter and LinkedInusing #IPOreport