bilateral trade analysis of italy and pakistan country report tdap.pdf · their trade volume, along...
TRANSCRIPT

BILATERAL
TRADE ANALYSIS
OF ITALY AND
PAKISTAN Country Report on Italy
ABSTRACT This report includes thorough bilateral trade analysis
of Italy & Pakistan and suggests potential exportable and trade scenario.
Arbab M. Murad Country Report on Italy

I
Executive summary
There is an untapped potential of approximately $311 million in Italian market, which Pakistan
can adventure to expand its bilateral trade volume of $1.5 billion to around $2 billion in the coming
years.
In this regard, the study identifies six potential items at HS 06 level that are further exportable in
their trade volume, along with its competitor's analysis and their pricing strategy in the market.
Among these potential products, four are from textile sector namely bedlinen of cotton, men’s and
boy’s trouser, women’s and girls’ trouser, knee-lengthen stockings and others are instruments and
appliances used in medical science and articles of apparel of leather or composition leather.
The study proposes that if the international standards are complied with appropriate marketing and
pricing strategies, these products have potential to expand manifold, and it also advices country
offices, relevant trade bodies, associations, MOC and TDAP for pertinent initiative regarding raw
material availability, R&D, and customs duty relaxations.

II
List of Acronyms
GSP: General scheme of preference
MFN: Most Favorite Nation
EU: European Union
SME: Small Medium Enterprise
R&D: Research and Development
SIMAP: Surgical Instrument Manufacturing Association of Pakistan
SVHC: Substance of Very High Concern
BPR: Biocidal Product
CEN: European Committee for Standardization
PPE: Personal Protective Equipment
PCP: Pentachlorophenol
DME: Dimethyl Fumarate
REACH Registration, Evaluation and Authorization and Restriction of Chemical.
CE: French acronym “Conformity Europeenne.”
EEA: European Economic Area
RAPEX: Rapid Alert System for dangerous Non-Food Products
GPSP: General Product Safety Directive
TBT: Trade Barrier for Trade
USD: United State Dollar
CAGR: Cumulative Annual Growth Rate
ITC: International Trade Center
PTA: Pakistan Tanner Association
APTMI: All Pakistan Textile Mills Association

III
Contents
Executive summary............................................................................................................................. I
List of Acronyms ................................................................................................................................ II
Introduction......................................................................................................................................1
Table 1: Key Economic indicator of Italy ........................................................................................2
Italy Trade Structure ....................................................................................................................3
Trade profile of Italy in figures .....................................................................................................3
Table 2: Italy’s trade with world ...................................................................................................3
Graph 1: Italy’s World Trade ........................................................................................................4
Graph 2: Key supplies markets .....................................................................................................5
Bilateral Trade Analysis: ..................................................................................................................5
Table 3: Bilateral trade between Pakistan & Italy...........................................................................5
Graph 3. Bilateral trade between Pakistan & Italy..........................................................................6
Imports from Italy ........................................................................................................................6
Table 4: Trade with Pakistan, ranking and market share ................................................................6
Potential Trade Scenario...................................................................................................................7
Table 5: List of top 15 items Pakistan exporting to Italy..................................................................7
Analysis of the potential items with tariffs ....................................................................................8
Table 6: List of potential products selected for analysis .................................................................9
Analysis of the potential products in Italy’s markets .............................................................................9
Table 7: Potential Product Bedlinen of cotton ...............................................................................9
Table 08: Potential Product Women's or girls' trousers, bib and brace .......................................... 11
Table 09: Potential Product Men's or boys' trousers, bib and brace overalls,................................. 12
Table 10: Potential Product Instrument and Appliance used in medical -surgical Sciences .............. 13
Table 11: Potential Product Articles of Apparel of leather or composition leather ......................... 14
Table 12: Potential Product Full-length or knee-length stockings, socks and other hosiery ............. 16
Non- Tariff Barrier of the Potential Products in Italy’s markets .................................................... 17
Table 13: Potential Products and there Non- Tariff Barriers in EU and Italy’s Market ..................... 17
Additional Requirement on non-tariff barriers standards........................................................... 19
The demand-side issue of Pakistan exports to Italy ......................................................................... 23
The supply-side issues of exporting country Pakistan ..................................................................... 23
Table 14: Global Competitiveness Index...................................................................................... 24
Potential product specific supply side issues. ............................................................................... 24

IV
Existence of International Brands in Italy ................................................................................... 26
Top ten Exporting Companies to Italy. ....................................................................................... 26
Table 15: Top ten Potential Product specific exporters ................................................................ 27
Market Initiatives by TDAP ............................................................................................................ 27
SWOT Analysis.................................................................................................................................. 27
Conclusion and Recommendation ................................................................................................... 29
Appendix ........................................................................................................................................ 31
Grape 04: GDP Per Capita of Italy ............................................................................................... 31
Graph 05: Unit prize comparison of top 15 products that Pakistan export to Italy ......................... 31
Table 17: All potential products identif ied in the study................................................................. 32
Non- Tariff Barrier Specification .................................................................................................... 33

1
Introduction
Italy is the 3rd biggest economy in Eurozone and the 9th largest in the world with the annual GDP
of $2.834 trillion. Its economic structure relies mainly on services and manufacturing sector. The
services sector accounts for almost three-quarters of total GDP and employs around 65% of the
country’s total employed labor force. Within the service sector, the most significant contributors
are the wholesale, retail sales and transportation sectors.
Industry accounts for a quarter of Italy’s total production and employs around 30% of the total
workforce. Manufacturing is the essential sub-sector within the industry sector, which specializes
in producing high-quality goods, mainly run by small and medium sized enterprises and most of
them are family-owned enterprises. However, Agriculture contributes the remaining share of total
GDP, and it employs around 4.0% of the total workforce. 1
Moreover, Italy has a highly- industrialized and developed northern region, where approximate ly
75% of the nation’s wealth is produced. On the contrary, there is a less developed more
agriculture-depended southern part with high unemployment due to which Italy's regional
disparities are renowned throughout the world.
The GDP per capita in Italy over the period of 5 years has shown a decline of 3.6 % from 2012 to
2014, and a recovery of 1.9 % in 2015-16 respectively. Italy’s economic performance since it
joined the Eurozone has been dismal. Thus, GDP per capita of Italy is now lower than it was at the
start of the Eurozone in 1999, meaning that the Italian population as a whole is far more poorer
than the country joined the Eurozone.
1 OECD.org
2
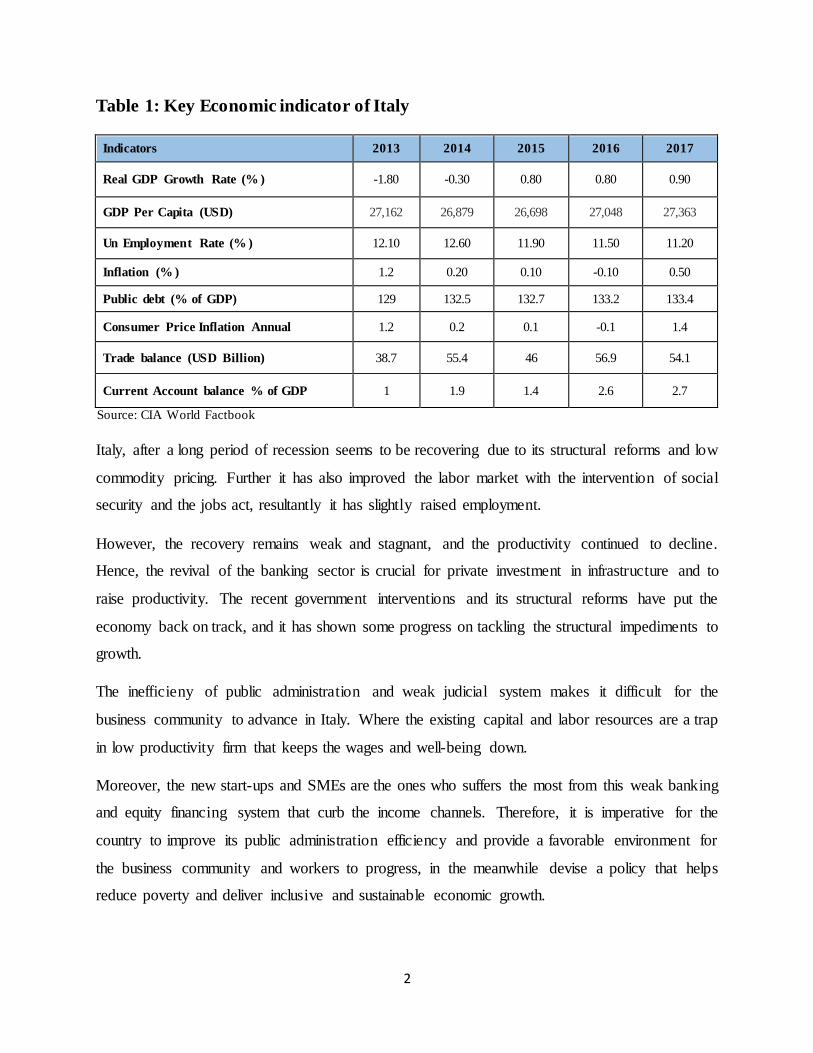
Table 1: Key Economic indicator of Italy
Indicators 2013 2014 2015 2016 2017
Real GDP Growth Rate (% ) -1.80 -0.30 0.80 0.80 0.90
GDP Per Capita (USD) 27,162 26,879 26,698 27,048 27,363
Un Employment Rate (% ) 12.10 12.60 11.90 11.50 11.20
Inflation (% ) 1.2 0.20 0.10 -0.10 0.50
Public debt (% of GDP) 129 132.5 132.7 133.2 133.4
Consumer Price Inflation Annual 1.2 0.2 0.1 -0.1 1.4
Trade balance (USD Billion) 38.7 55.4 46 56.9 54.1
Current Account balance % of GDP 1 1.9 1.4 2.6 2.7
Source: CIA World Factbook
Italy, after a long period of recession seems to be recovering due to its structural reforms and low
commodity pricing. Further it has also improved the labor market with the intervention of social
security and the jobs act, resultantly it has slightly raised employment.
However, the recovery remains weak and stagnant, and the productivity continued to decline.
Hence, the revival of the banking sector is crucial for private investment in infrastructure and to
raise productivity. The recent government interventions and its structural reforms have put the
economy back on track, and it has shown some progress on tackling the structural impediments to
growth.
The inefficieny of public administration and weak judicial system makes it difficult for the
business community to advance in Italy. Where the existing capital and labor resources are a trap
in low productivity firm that keeps the wages and well-being down.
Moreover, the new start-ups and SMEs are the ones who suffers the most from this weak banking
and equity financing system that curb the income channels. Therefore, it is imperative for the
country to improve its public administration efficiency and provide a favorable environment for
the business community and workers to progress, in the meanwhile devise a policy that helps
reduce poverty and deliver inclusive and sustainable economic growth.

3
Moreover, changes in the fiscal policy mix are required to improve investment and productivity
and to achieve higher GDP growth, as prolong low productivity and weak economic growth has
battered the social inclusion, hence, demanding a resolve to raise employment, especially among
women and youth. However, due to the inclusion of structural reform recovery is underway, a
modest positive change has been noticed from 2016 to 2017 due to these initiatives of Jobs Act,
exemption in social security and the accommodative monetary and fiscal policies, which has also
raised employment rate in the country.
Italy Trade Structure
Against the background of weak domestic demand, the external sector’s performance is essential
for the Italian economy. One of the most significant pillars of the economy is the production of
high-quality products such as; machinery, textiles products, industrial designs, alimentary and
furniture sectors. These products contribute considerably to the country’s exports. However, as a
country Italy is poor in national resources, it's energy and manufacturing sectors are highly
dependent on imports that makes its external position vulnerable to changes in import prices such
as fuel.
Trade profile of Italy in figures
Table 2: Italy’s trade with world USD billions
ITALY-World 2013 2014 2015 2016 2017 CAGR
Italy’s Exports 518 529.5 456.5 461.5 506.5 -0.005
Italy’s Imports 479.5 474 410.9 404.5 452.2 -0.01
Balance of Trade 38.7 55.4 46 56.9 54.1 0.08
Total Trade 997.4 1,003.6 867.9 866.1 958.5 -0.009
Source: ITC Trade Map.

4
Graph 1: Italy’s World Trade
Italy’s trade volumes have increased significantly after the country joined the Eurozone. Despite
the growing global competition in 2017, Italy ranked as the world’s 8th largest export economy
in the world, due to its significant numbers of exports of $506 billion and imports of $452 billion,
with a positive trade balance of $54.1 billion.
By means of using the HS (Harmonized System) classification. Its top import items are Cars ($31.4
billion), Crude Petroleum ($28.6 billion), Packaged Medicaments ($15.2 billion), Unspecified
($13.7 billion) and Petroleum Gas ($12.1 billion). Whereas the top exports items are Packaged
Medicaments ($24.2 billion), Cars ($17.1 billion), Vehicle Parts ($14.5 billion), Unspecified
($14.4 billion) and Refined Petroleum ($11.4 billion).
The top export destinations of Italy are Germany ($58.3 billion), France ($48.6 billion), the United
States ($40.9 billion), the United Kingdom ($24.9 billion) and Spain ($23.2 billion). The top
import origins are Germany ($67.2 billion), France ($35.7 billion), China ($26.4 billion), Spain
($22.5 billion) and Belgium ($20.8 billion).2
Italy borders with Switzerland, Austria, France, Slovenia, Vatican City and San Marino by land
and Libya, Algeria, Tunisia, Spain, Albania, Greece, Malta, Croatia and Montenegro by sea.
2 Oec
0
100
200
300
400
500
600
Years 2013 2014 2015 2016
Italy's World Trade
Italy’s Exports Italy’s Imports Balance of Trade Linear (Balance of Trade )
USD bill ion

5
Graph 2: Key supplies markets
Bilateral Trade Analysis:
Despite all the odds, Italy is a notable economy for Pakistan regarding exports. It has always
followed Pakistani market with keen interest, and in the last decades, it has gradually increased
it’s positioning.
Italy as become one of the top ten global trading partners of Pakistan and the third amongst the EU
member states with a growing trade volume amounting to $1.56 billion in 2016-17.
Table 3: Bilateral trade between Pakistan & Italy USD Million
Pak-Italy Trade 2013 2014 2015 2016 2017 CAGR
Pakistan Exports 632.91 739.89 641.31 663.30 708.81 0.02
Pakistan Imports 571.32 559.39 488.29 688.07 854.10 0.10
Trade Balance 61.59 180.49 153.02 -24.77 -145.29 ---
Total trade volume 1,204.23 1,299.28 1,129.61 1,351.38 1,562.91 0.06
Source: ITC Trade Map.
73.73
39.6432.02
25.40 23.89
0.00
20.00
40.00
60.00
80.00
LIST OF TOP FIVE SUPPLYING MARKETS
Germany France China Netherland SpainUSD Billion

6
Graph 3. Bilateral trade between Pakistan & Italy
Imports from Italy
Pakistan’s top imports from Italy includes products like heavy machinery such as power generating
machinery, precision apparatus, metalworking machinery, transport equipment’s and electrical
machinery.
Further, it imports iron and steel, telecommunication equipment’s, waste and scrap of copper and
aluminum, surgical instrument, defense equipment, mineral fuels and dyes for tanning paints.
Moreover, a considerable amount of arms are being imported by Pakistan from Italy.
Table 4: Trade with Pakistan, ranking and market share
Bilateral Trade 2013 2014 2015 2016 2017
Pak’s Export to Italy(USD Million) 632.92 739.89 641.32 663.3 708.81
Market share (% ) 0.11 0.1 0.1 0.14 0.0001
Ranking 78 79 79 69 65
Pak's Imports from Italy (USD million) 571.3 559.3 488.2 688.1 854.1
Market share (% ) 0.11 0.1 0.1 0.14 0.16
Ranking of Pakistan 79 81 80 70 66
Source: ITC Trade Map.
-200
0
200
400
600
800
1000
Years 2013 2014 2015 2016
Bilateral Trade Italy-Pakistan
Pakistan Exports Pakistan Imports
Trade Balance Linear (Trade Balance )
USD Million

7
The trade ties between Italy and Pakistan are indicating good signs, as the trade volume between
the two countries has surpassed $1.5 billion in the year 2017.
Although the trade balance turned into negative in the year 2016-17, an increase of 29 and 19%
were recorded respectively in the imports bills which are due to the import of heavy machinery.
However, in the long run the import of automotive and machinery that are capital goods that
strengthen the manufacturing industry as there is direct relationship between technologica l
advancement and growth.
Potential Trade Scenario
Following are the list of top 15 items Pakistan is exporting to Italy.
Table 5: List of top 15 items Pakistan exporting to Italy
Product
code Product label
Pak-Exp
2016
USD
Million
Pak-Exp
2017
USD
Million
AAGR
2016/17
Tariff
lines
Italy
import
2017 %
'TOTAL All products 663.30 708.81 6.86
'630231 Bedlinen of cotton 49.67 61.22 23.24 0 51.57
'620342 Men's or boys' trousers 47.11 50.16 6.46 0 5.32
'520812 Plain woven fabrics of cotton 29.79 34.11 14.49 0 32.89
'410712 Grain splits leather 28.08 27.01 -3.81 0 9.05
'630260 Toilet linen and kitchen linen 23.58 25.68 8.91 0 21.38
'630221 Printed bedlinen of cotton 19.85 21.34 7.54 0 30.05
'620462 Women's or girls' trousers 16.75 17.00 1.5 0 2.99
'520819 Woven fabrics of cotton 16.31 15.37 -5.75 0 28.90
'640399 Footwear with outer soles of rubber 10.30 14.13 37.14 0 1.09
'100620 Husked or brown rice 11.16 13.97 25.21 3 20.05
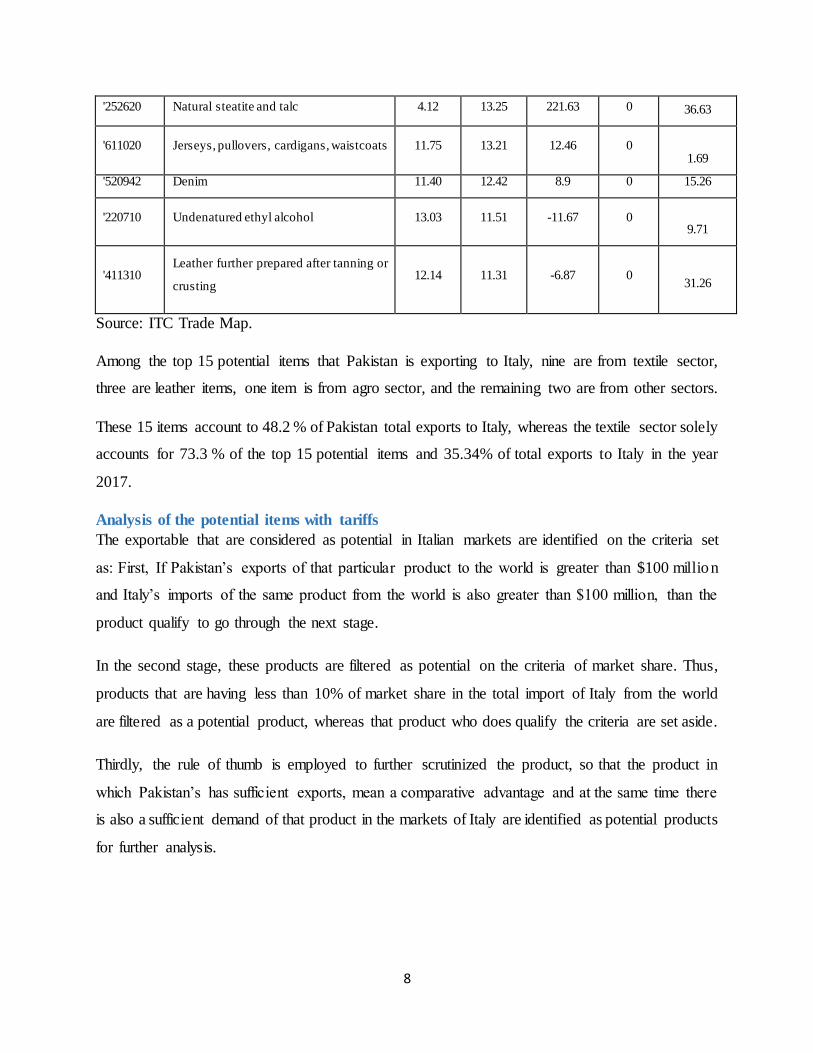
8
'252620 Natural steatite and talc 4.12 13.25 221.63 0 36.63
'611020 Jerseys, pullovers, cardigans, waistcoats 11.75 13.21 12.46 0 1.69
'520942 Denim 11.40 12.42 8.9 0 15.26
'220710 Undenatured ethyl alcohol 13.03 11.51 -11.67 0 9.71
'411310 Leather further prepared after tanning or
crusting 12.14 11.31 -6.87 0
31.26
Source: ITC Trade Map.
Among the top 15 potential items that Pakistan is exporting to Italy, nine are from textile sector,
three are leather items, one item is from agro sector, and the remaining two are from other sectors.
These 15 items account to 48.2 % of Pakistan total exports to Italy, whereas the textile sector solely
accounts for 73.3 % of the top 15 potential items and 35.34% of total exports to Italy in the year
2017.
Analysis of the potential items with tariffs
The exportable that are considered as potential in Italian markets are identified on the criteria set
as: First, If Pakistan’s exports of that particular product to the world is greater than $100 million
and Italy’s imports of the same product from the world is also greater than $100 million, than the
product qualify to go through the next stage.
In the second stage, these products are filtered as potential on the criteria of market share. Thus,
products that are having less than 10% of market share in the total import of Italy from the world
are filtered as a potential product, whereas that product who does qualify the criteria are set aside.
Thirdly, the rule of thumb is employed to further scrutinized the product, so that the product in
which Pakistan’s has sufficient exports, mean a comparative advantage and at the same time there
is also a sufficient demand of that product in the markets of Italy are identified as potential products
for further analysis.

9
Table 6: List of potential products selected for analysis USD million
Hs Code Product label
Pak Exp
to Italy
2016
Pak Exp
to world
2016
Italy
Imp
from
world
2016
% of
Italy
Import
world
Tariffs
'630231 Bedlinen of cotton 49.67 773.3 108.77 45.67 0
'620462 Women's or girls' trousers. 16.75 366.22 551.9 3.03 0
'620342 Men's or boys' trousers, 47.11 543.87 999.28 4.71 0
'611595 Full-length or knee-length stockings, 1.52 143.32 188.72 0.8 0
'901890 Instruments and appliances used in
medical Science 2.1 326.02 1,351.86 0.15 0
'420310 Articles of apparel, of leather or
composition leather. 6.89 297.99 202.4 3.4 0
Analysis of the potential products in Italy’s markets
Table 7: Potential Product Bedlinen of cotton
Countries
2013
USD
million
2017
USD
million
Avg.
Tariff
rate (% )
ECI Ranking Unit
value
USD 2013 2017
Moldova 14.92 15.29 0 1 1 6,010
Pakistan 26.28 61.22 0 2 2 5,364
India 3.27 6.99 9.6 8 4 6,043
China 2.11 5.00 12 11 6 9,804
Bangladesh 0.855 3.57 0 12 10 6,898
Total 5 records 47.46 92.08
Others 41.60 26.61
The total value of the
world 89.06 118.69
Source: ITC Trade map.
Bedlinen of cotton is one of the top products that Pakistan is exporting to EU, it is the only product
that the researcher has incorporated even when its not fulfilling the second criteria of potential
product which is less than 10% of market share in the partner country.

10
It is also a product in which Pakistan has an absolute advantage over its competitors, and due to
that reason it has captured 51% of Italy’s market in the year 2017. Over the period of 5 years its
exports have increase multifold, its cumulative annual growth rate from the years 2013-17 is
12.6%, and its exports have increased 18.87 % in the year 2016-17.
Italy is the sixth biggest importer of Pakistani bedlinen of cotton in the world whereas USA top
the list, while Germany, Netherlands, United Kingdom, and Belgium in EU are ahead of Italy in
terms of value.
Pakistan’s bedlinen of cotton ranks 2nd on the Export Competitive Index in the world both in the
year 2013 and 2017, only second to Moldova, although Pakistan has captured the major share of
Italy market, and its competitors in the market are China, India, Bangladesh, and Moldova.
The unit price of Pakistani bedlinen is lowest among the competitors, which gives it a competitive
edge especially when the country enjoys preferential treatment of GSP Plus status in EU markets,
due to which there are zero tariff lines on its exports.
While China and India have high tariff duties 12 % and 9.6% respectively, however there ECI
ranking is improving over the years, along with Bangladesh which also has zero tariff duties on
everything but arms because of their LDC status but yet it hasn’t captured a notable market share.
Therefore, Moldova is considered as a close competitor in Italy market, which has a geographica l
edge over Pakistan, with less non-tariff barriers, and a good foreign relationship with Italy, as Italy
was one of the first countries to recognized Moldova in the year 1992.
However, the unit price of Pakistan’s bedlinen has a competitive edge due to which Italy is the
biggest importer of Pakistani bedlinen. Hence, the researcher asserts that its market share may
further increase due to the increasing trend over the years.

11
Table 08: Potential Product Women's or girls' trousers, bib and brace
Countries 2013 USD
Million
2017 USD
Million
Avg.
Tariff
rate (% )
ECI Ranking Unit price
USD 2013 2017
Bangladesh 77.28 95.67 0 5 2 16,396
China 50.62 47.68 12 3 6 25,342
India 4.80 5.11 9.6 19 27 33,780
Pakistan 17.52 17.00 0 14 20 18,153
Vietnam 2.29 0.652 9.6 27 36 28,708
Total 5 records 137.68 151.93
Others 584.93 416.54
The total value of the
world 722.61 568.47
Source: ITC Trade map.
Women’s or girls trousers, bib, and brace has a world export share of 0.15%, with an export value
of $25.4 billion in 2016. Top exporting country for this product is China with 37% share in world
market followed by Bangladesh with 14% export share.
Pakistan exports $593.1 million worth of women’s or girls trouser to the world; its top importing
country is the United States. In term of value, Italy is the 12th biggest importer of this item in the
world, with $568.4 million imports in the years 2017.
Pakistan’s exports to Italy have recorded a decline of 0.02% in 2016-17, the export of this item
from 2013-17 shows a mixed trend as in 2014 the export share in term of value reached $22
million, but in the next year in 2015 it decreases by 16 % and reached $18 milllion.
However, in the same year, the export share of China and India also decreased, while the export
share regarding the value of Bangladesh increased, which shows that Bangladesh is expanding and
capturing more market share in Italy. Its export competitiveness has also improved in the same
period from 4th to 2nd.
China, India, Vietnam, and Pakistan who are competitors in this market have recorded a weakening
position on the ECI indicator. However, on the price competitive strategy, Bangladesh have
outshined all its competitors as it’s per unit value is lower amongst all others, i.e. US $16,396
compare to Pakistan US $18,153. Moreover, due to its LDC status, it enjoys tariff-free access to
12
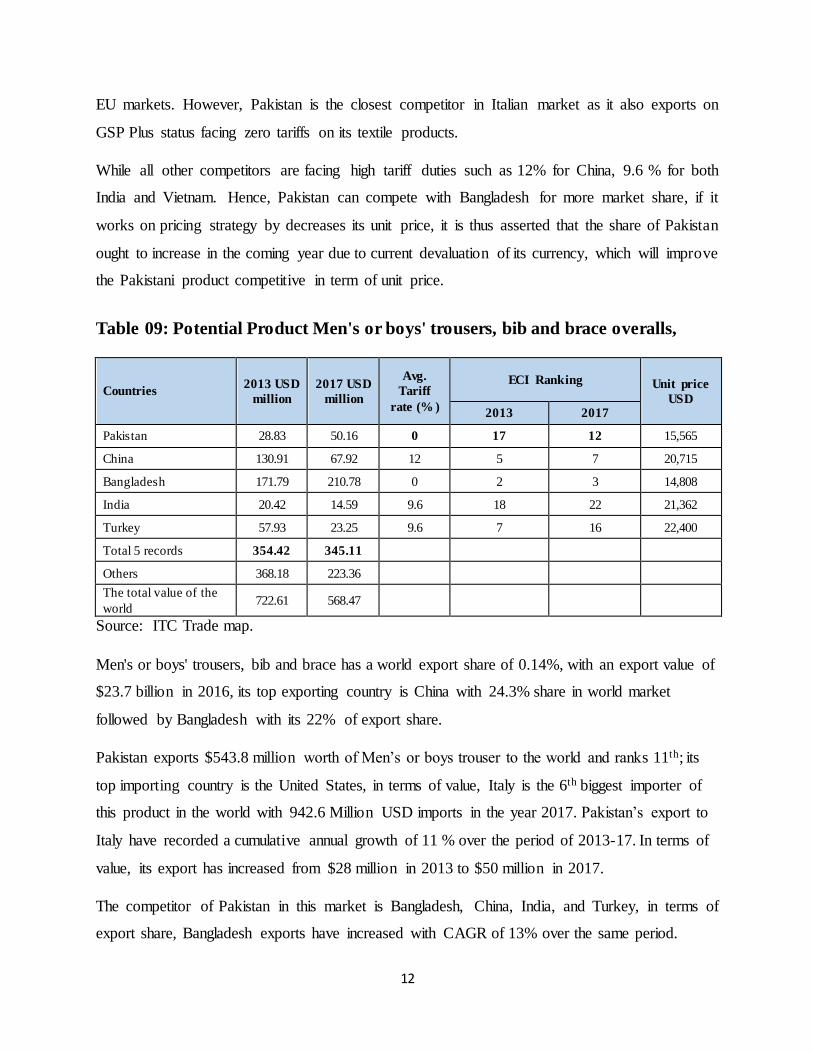
EU markets. However, Pakistan is the closest competitor in Italian market as it also exports on
GSP Plus status facing zero tariffs on its textile products.
While all other competitors are facing high tariff duties such as 12% for China, 9.6 % for both
India and Vietnam. Hence, Pakistan can compete with Bangladesh for more market share, if it
works on pricing strategy by decreases its unit price, it is thus asserted that the share of Pakistan
ought to increase in the coming year due to current devaluation of its currency, which will improve
the Pakistani product competitive in term of unit price.
Table 09: Potential Product Men's or boys' trousers, bib and brace overalls,
Countries 2013 USD
million
2017 USD
million
Avg.
Tariff
rate (% )
ECI Ranking Unit price
USD 2013 2017
Pakistan 28.83 50.16 0 17 12 15,565
China 130.91 67.92 12 5 7 20,715
Bangladesh 171.79 210.78 0 2 3 14,808
India 20.42 14.59 9.6 18 22 21,362
Turkey 57.93 23.25 9.6 7 16 22,400
Total 5 records 354.42 345.11
Others 368.18 223.36 The total value of the
world 722.61 568.47
Source: ITC Trade map.
Men's or boys' trousers, bib and brace has a world export share of 0.14%, with an export value of
$23.7 billion in 2016, its top exporting country is China with 24.3% share in world market
followed by Bangladesh with its 22% of export share.
Pakistan exports $543.8 million worth of Men’s or boys trouser to the world and ranks 11th; its
top importing country is the United States, in terms of value, Italy is the 6th biggest importer of
this product in the world with 942.6 Million USD imports in the year 2017. Pakistan’s export to
Italy have recorded a cumulative annual growth of 11 % over the period of 2013-17. In terms of
value, its export has increased from $28 million in 2013 to $50 million in 2017.
The competitor of Pakistan in this market is Bangladesh, China, India, and Turkey, in terms of
export share, Bangladesh exports have increased with CAGR of 13% over the same period.

13
China has lost its market share of $62.9 million, and Turkey has also lost a share of $34.6 million.
Likewise, India has lost share of $5.8 million in the same market over the year 2013-17.
The trend shows that Bangladesh is the only competitor whose share is increasing in Italy and its
ECI ranking is better than all players in the market.
Although Pakistan is the only country amongst competitors whose ECI has improved over the
period from the rank 17th to 12th and its market share is also increasing. The unit price strategy of
Bangladesh is very competitive, as its unit price is $14,808 thousand lowest in market comparabile
to Pakistan’s $15,565 thousand.
Both Pakistan and Bangladesh are facing zero tariff lines. As a result, it can be asserted that men’s
and boy’s trouser is a potential items for export to Italian market, especially when others are losing
its market share.
Table 10: Potential Product Instrument and Appliance used in medical-surgical Sciences
Countries 2013 USD
million
2017 USD
million
Avg. Tariff
rate (% )
ECI Ranking Unit Price
USD 2013 2017
Pakistan 267 2.8 0 30 39 32,813
China 50.62 47.68 0 9 10 12,956
Turkey 0.74 4.53 0 41 33 25,421
Singapore 8.56 6.48 0 16 20 27,057
India 4.8 5.11 0 26 36 30,254 Total 4
records 313.57 515,520
Others 1,066.29 1,050.81 Total value of
world 1,379.86 1,566.33
Source: ITC Trade map.
Instrument and appliance used in medical, surgical and veterinary sciences have a world export
share of 0.29%, with an export value of $ 47.9 billion in 2016. Its top exporting country is the
USA with 25.7% share in world market followed by Germany with its 11.9% of export share.
Pakistan exports $326 million worth of surgical instruments to the world and ranks 25th, its top
import destination is also the United States. In terms of value, Italy is 11th biggest importer of
this product in the world, with $1.5 billions imports in the year 2017.

14
Pakistan’s export to Italy has recorded a cumulative annual growth of 2.3% over the period of
2013-17, in term of value its export has increased from $2.6 million in 2013 to $2.8 million in the
year 2017.
The competitor of Pakistan in the surgical instrument market of Italy is China, India, Singapore ,
and Turkey, Among the competitors China is the biggest exporter to Italy with $47.6 million worth
of exports in the year 2016.
Singapore is second in term of export value with $6.8 million, there is zero tariff barrier for all
surgical item imported to Italy, It is due to the reason that Italy imports this item and add value to
it for re-exporting, as Italy itself is 12th biggest exporter of surgical items in the world with more
than USD 1 billion worth of exports.
Turkey is the only country among competitors whose export competitive index has improved over
the years, whereas all the competitor including Pakistan are losing its competitiveness in the
market.
Moreover, Turkey has a geographical edge over other players in the market, and that’s the reason
that its exports have increased multifold from $0.74 million to $4.5 million over the year 2013-
17. In terms of pricing strategy China is leading the market with the competitive unit price of
$12,926 thousand, lowest among all its competitors. China also has a better ECI ranking among
the competitors for surgical instruments.
Table 11: Potential Product Articles of Apparel of leather or composition leather
Countries 2013 USD
million
2017 USD
million
Avg.
Tariff
rate (% )
ECI Ranking Unit price
USD 2013 2017
India 63.94 51.90 0 2 2 92,606
Turkey 20.37 14.56 0 6 10 194,424
Vietnam 8.13 14.51 0 11 11 40,114
China 14.69 7.89 4 9 18 76,154
Pakistan 7.09 7.50 0 15 17 38,300
Total 5 records 114.24 96.38
Others 106.09 111.10
The total value of
the world 220.33 207.49
Source: ITC Trade Map.

15
Articles of apparel of leather or composition leather has a world export share of 0.01%, with an
export value of $3.1 billion in 2016. Its top exporting country is India with 17.4 % share in the
world market, followed by Italy with its 16.8% of export share, Pakistan ranks 3rd in world exports
of Apparel of leather with $297.9 million worth of exports. Its top importing country is the United
States, In term of value, Italy is 5th biggest importer of this product in the world with $207.4 million
imports in the year 2017.
Pakistan’s export to Italy has recorded a cumulative annual growth of 3.5% over the period of
2013-17, in term of value its export has increased from $7 million in 2013 to $7.5 million in the
year 2017. The competitor of Pakistan in the market of Italy is India, Vietnam, China, and Turkey,
among these competitors India is the biggest exporter to Italy with $51.9 million worth of exports
in the year 2017.
Turkey is second in number, in term of export value, with $14.5 million; there is zero tariff barrier
for all competitor except for China which pays 4% tariff duties on leather item imported by Italy.
India is the only country among competitors whose export competitive index has sustained over
the years, whereas all the competitor along with Pakistan are losing their competitiveness in the
market. Moreover, Turkey has a geographical edge over other players in the market and that is the
reason that its exports are second highest though its export share decreased by 28.5% over the
period 2013-17.
Regarding pricing strategy, Pakistan has a comparative advantage as its unit price of $38,300
thousand, which is lowest among all its competitors. But in terms of ECI ranking Pakistan is at
weakening position as compare to its competitors.
On the other hand India’s unit price is second highest in term of value which is $92,606 thousand
but still due to its ECI ranking which is lowest amongst all competitors, India has become the
biggest exporter of this product in the world.
Similarly, in term of pricing Turkey’s unit price is highest among all competitors, still it is the
second biggest exporter of apparel of leather to Italy. This proves that the unit price alone is not
sufficient indicator to capture a market share; geographical proximity, ECI and other variables are
equally important.

16
In the same context if we look at Vietnam, which has shown a remarkable increase of 49.3% over
the period 2013-17, in term of value its export share has increased from $8 million to $14 million
and its export competitiveness index ranking is better than Pakistan and China, hence, it also
second the argument asserted above about the importance of other variables.
Hence, If Pakistan works upon its competitiveness and bargains its pricing strategy with Italian
importer it could also increase its share in Italian market, especially when its unit price is lowest
in the market and the product it is exporting is of world quality.
Table 12: Potential Product Full-length or knee-length stockings, socks and other hosiery
Countries 2013 US D
million
2017 US D
million
Avg. ECI Ranking Unit price
USD Tariff
rate (% ) 2013 2017
China 35,064 48,380
11,414 12 2 2
Turkey 26,917 27,373 0 3 3 14,517
Pakistan 828 2,024 0 19 14 10,086
India 2,026 1,369 9.6 13 19 13,531
Srilanka 883 1,212 9.6 16 18 12,568
Total 5 records 65,718 80,358
Others 96,598 120,093
Total value of world 162,316 200,451
Source: ITC Trade Map.
Full-length or knee-length stockings has a world export share of 0.07%, with an export value of
$12.3 billion in 2016. Its top exporting country is China with 16.9 % share in the world market,
followed by Turkey with 5.1% of export share. Pakistan ranks 6th in world exports of knee-length
stockings with $143.3 million worth of exports. Top importing country for this product is the
United States. In term of value, Italy is 7th biggest importer of this product in the world, with
$200.4 million imports in the year 2017.
Pakistan’s export to Italy have recorded a cumulative annual growth of 4.8 % over the period of
2013-17, in term of value its export has increased from $0.828 Million in 2013 to $2 million in the
year 2017.
The competitor of Pakistan in the knee-length stockings market of Italy is India, Srilanka, China,
and Turkey. Among the competitors China is the biggest exporter to Italy with $ 48.3 million worth

17
of exports in the year 2017. Turkey stands second in term of export value with $27.3 million,
though there is zero tariff barrier for Pakistan and Turkey.
However, there are 9.6% tariffs for both India and Srilanka. Uptill now China faces the highest
tariff rates of 12%, but still it has captured the 24.1% of market share, which is due to its sustainab le
Export Copetitiveness Index ranking of 2nd over the years and demand driven policy it pursue.
Regarding pricing strategy, Pakistan is having a competitive unit price of $10,086 thousand, lowest
among all its competitors. Its ECI ranking has also improved over the year and so has its market
share by 59%. However, China also has a competitive unit price of $11,414 thousand, but Pakistan
is the only competitor whose ECI have improved along with its market share over the period.
Hence, it is suggested that knee-length stocking is one of the potential product that Pakistan can
bargain on grounds of pricing strategy with Italian importer and to increase its export to Italy.
Non- Tariff Barrier of the Potential Products in Italy’s markets3
Following are the non-tariff measure regarding the potential items in EU and Italy’s markets
Table 13: Potential Products and there Non- Tariff Barriers in EU and Italy’s Market
Product
Code Product Label Non-tariff Barriers
630231 Bedlinen of cotton
(1) Labeling requirements - (TBT)
(2) Marking requirements - (TBT)
(3) Product quality or performance requirement - (TBT)
(4) Testing requirement - (TBT)
620342 Men’s and Boys' trouser
(1) Prohibition for TBT reasons - (TBT)
(2) Labelling requirements - (TBT)
(3) Marking requirements - (TBT)
(4) Product quality or performance requirement - (TBT)
(5) Testing requirement - (TBT)
(6) Certification requirement - (TBT)
(7) Inspection requirement - (TBT)
3 ITC macmap.org

18
620462 Women’s and girls Trousers
(1) Prohibition for TBT reasons - (TBT)
(2) Labelling requirements - (TBT)
(3) Marking requirements - (TBT)
(4) Product quality or performance requirement - (TBT)
(5) Testing requirement - (TBT)
(6) Certification requirement - (TBT)
(7) Inspection requirement - (TBT)
611595 Knee-length stockens
1) Labelling requirements - (TBT)
(2) Marking requirements - (TBT)
(3) Product quality or performance requirement - (TBT)
(4) Testing requirement - (TBT)
(5) Certification requirement - (TBT)
(6) Inspection requirement - (TBT)
420310 Article of apparel of leather
(1) Prohibition for TBT reasons - (TBT)
(2) Product quality or performance requirement - (TBT)
(3) Certification requirement - (TBT)
(4) Inspection requirement - (TBT)
901890 instrument an appliance used in
medical surgical
(1) Registration requirement for importers for TBT reasons - (TBT)
(2) Restricted use of certain substances - (TBT)
(3) Labelling requirements - (TBT)
(4) Packaging requirements - (TBT)
(5) Production or Post-Production requirements not elsewhere
specified. - (TBT)
(6) Product quality or performance requirement - (TBT)
(7) Conformity assessment related to TBT - (TBT)
(8) Testing requirement - (TBT)
(9) Certification requirement - (TBT)
(10) Inspection requirement - (TBT)
(11) Import monitoring and surveillance requirements and other
automatic licensing measures - (C)

19
Additional Requirement on non-tariff barriers standards4
EU legislation harmonizes mandatory requirements for product safety throughout European
Economic Area (EEA), covering all 28 EU member states and including Iceland, Liechtenste in,
and Norway. With appropriate certification, goods travel freely within the EEA.
The specific EU technical legislation doesn’t regulate products, they are subject to the EU’s
General Product Safety Directive (GPSD), as well as to possible additional national (i.e., specific
EU member country) requirements.
The following are the main regulations that may apply to textiles, apparel, and footwear:
General Product Safety Directive (GPSD)
CE Marking
REACH (Registration, Evaluation, Authorization, and Restriction of Chemical)
Personal Protective Equipment (PPE)
Biocidal Products Regulation (BPR)
European Labeling Directives.
General Product Safety Directive (GPSD) - 2001/95/EC
The GPSD is intended to ensure a high level of product safety throughout the EU for consumer
products that are not covered by specific sector legislation. The Directive provides a generic
definition of a safe product. In addition to the basic requirement to place only safe products on the
market, manufacturers must inform consumers of the risks associated with the products they
supply. Manufacturers also must take appropriate measures to prevent such risks and be able to
trace dangerous products.
Rapid Alert System for dangerous non-food products (RAPEX)
The GPSD provides for an alert system between the Member States and the Commission. The
RAPEX system ensures that the relevant authorities are rapidly informed of dangerous products.
In the case of serious product risks, temporary decisions can be taken on Community-wide
4 OTEXA) Market Reports Textiles, Apparel,
European Union

20
measures. Under certain conditions, the Commission may adopt a formal Decision requiring the
Member States to ban the marketing of a product posing a serious risk, to recall it from consumers
or to withdraw it from the market.
CE Marking
Products sold in the EEA must have a CE marking whenever they are covered by specific product
legislation. The CE marking (an acronym for the French "Conformite Europeenne") certifies that
a product has met EU health, safety, and environmental requirements, which ensure consumer
safety.
The CE marking legislation offers manufacturers some choices and requires decisions to determine
which safety/health concerns need to be addressed, which conformity assessment module is best
suited to the manufacturing process, and whether or not to use EU-wide harmonized standards.
Products manufactured to standards adopted by CEN, CENELEC or ETSI, and referenced in the
EU Official Journal as harmonized standards, are presumed to conform to the requirements of EU
Directives.
Manufacturers of such products may apply the CE marking and issue a declaration of conformity,
which will allow the product to circulate freely within the EEA. Manufacturers can choose not to
use the harmonized EU standards but then must demonstrate that the product meets the essential
safety and performance requirements.5
Registration, Evaluation and Authorization and Restriction of Chemicals (REACH)
It is the system for controlling chemicals in the EU. Under REACH, registration is required on all
chemicals manufactured or imported into the EU in volumes above one metric ton per year.
Information on a chemical’s properties uses, and handling is part of the registration process.
Manufacturers or importers of articles containing more than 0.1% by weight of any substance
requiring authorization must provide their customers with adequate information on the safe use
and disposal of the article, including the relevant names of the substances of very high concern
(SVHC). Manufacturers and retailers must be prepared to answer consumers’ questions regarding
5 Export.gov

21
the presence of SVHC in articles and provide sufficient information to allow safe use of these
articles.
Restricted chemicals & dangerous substances REACH, affecting textile, apparel, and footwear
products include Lead, Cadmium, Azo Colorants ( Dyes & Pigments), Dimethyl Fumarate (DMF),
Nickel, Polycyclic Aromatic Hydrocarbons (PAHs), Pentachlorophenol (PCP) and Chromium.
Personal Protective Equipment (PPE)
The PPE Directive covers clothing and footwear designed to be worn by individuals for protection
against health and safety hazards. It is intended to ensure that any personal protective equipment
placed on the EU market meets its intended purpose. All products that come under the scope of
the Directive and are placed on the market in an EU country must be CE marked.
The PPE Directive does not define how particular types of the product must be tested. It only
includes health & safety requirements that need to be taken into account. However, the European
Commission has mandated the development of various product safety standards via the European
Standards agency CEN (Committee European de Normalization). A manufacturer can use any
technical specification, as long as it can be shown to satisfy the relevant PPE Directive essential
safety requirements. However, if a European harmonized standard is available, a sound technical
argument must be provided for not using it.
Biocidal Products Regulation.
Whenever biocidal products are added to textiles, apparel, or footwear to give them specific
properties (e.g., repel insects or avoid allergens) the provisions of the Biocidal Products Regulat ion
(BPR) must be followed.
The BPR requires treated articles to be labeled when:
1. There is a claim that the treated article has biocidal properties.
2. Conditions of the approval of the active substance used to treat the article require specific
labeling provisions to protect public health or the environment.

22
Fiber content labeling: EU regulations require that textile products be labeled to show fiber
content as specified in Regulation.
Fur and Leather content labeling: Any use of animal-derived materials (i.e., real fur and leather)
ought to be mentioned on apparel labels.
Care labeling:
Care labeling provides information on recommended methods for cleaning textile and apparel
products, i.e., washing, bleaching, ironing, dry cleaning and tumble drying. There is no harmonized
EU legislation on care labeling, although some EU member countries may require care labels on
products sold in their markets. Nevertheless, care labeling recommends the manufacturer that it
can be held liable under the EU Product Liability Directive if a problem occurs.
Country of Origin labeling:
There is no EU-wide legislation on country of origin labeling for textile and apparel products,
although some member countries may require the origin to be listed on the label.
Size labeling: Standard EN 13402 was developed for labeling clothes sizes, based on body
dimensions and measured in centimeters. Although EN 13402 was supposed to replace many older
national sizing systems, the standard reportedly has not been fully accepted in all EU member
states.
European Ecolabel:
The ecolabel is officially endorsed by the EU and can be placed on a range of products that meet
high standards of environmental awareness, which are sold across the EU. Participation in the eco-
label scheme is voluntary. While not required, companies may consider this label to improve
consumer perception of the product.
In the case of textiles, the label is awarded to products if: substances with harmful effects on the
aquatic environment and air have been limited during fiber production.
The risk of allergic reactions has been reduced; the product does not shrink more than conventiona l
products, the product is as color resistant against washing, drying friction and light exposure as
conventional products.
23
For a product made outside the European Community, an application must be submitted to the
designated authorities of the Member States in which the product is to be or has been placed on
the market. Applications for the award of an Eco-label are subject to payment of a fee. Also, there
is an annual fee for the use of the label.
The demand-side issue of Pakistan exports to Italy
The commercial counselor suggests that to improve the existing level of exports to Italy, Pakistan
needs to increase its presence in relevant trade fairs through:
Diversifying the products range from traditional to nontraditional.
Employing better marketing/communication tools to increase country visibility such as
better catalogs, and brochures.
Submitting an on-time application for business visas to the Italian Embassy with all
required documents to avoid visa refusals and thus empty booths and allied problems
during the fair.
There is a dire need for compliance with international standards and demand in the
market.
Pakistan may consider bringing some companies capable of manufacturing kids shoes
and khusa etc. as they are in demand.
Moreover, the CC also suggest that Pakistan should have a permanent stall of marble
and leather in commercial consulate to promote its exports.
The supply-side issues of exporting country Pakistan
On the supply side of the business environment, we look at the different indicators that measure
the business environment of the country. Among these are Global Competitiveness Indicator that
measures the macro and micro aspect of competitiveness into a single index.
The following table compares the Global Competitiveness Index of Pakistan with its regional
competitors in the market of Italy.
24
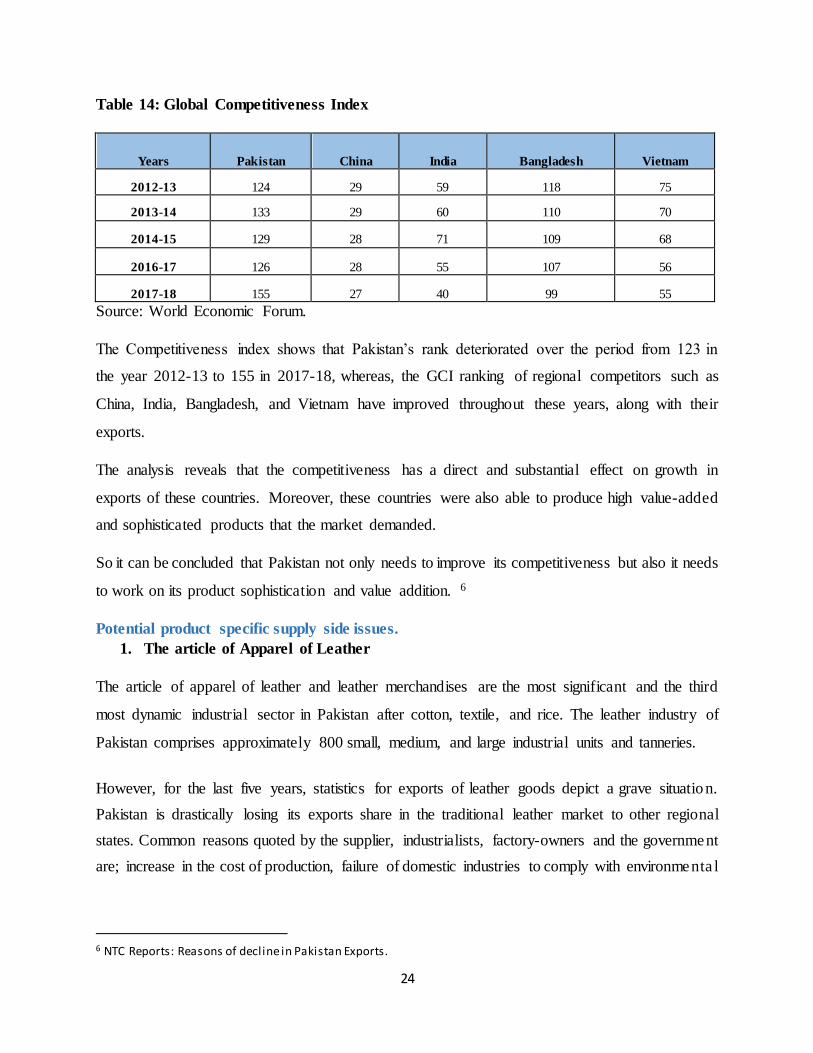
Table 14: Global Competitiveness Index
Years Pakistan China India Bangladesh Vietnam
2012-13 124 29 59 118 75
2013-14 133 29 60 110 70
2014-15 129 28 71 109 68
2016-17 126 28 55 107 56
2017-18 155 27 40 99 55
Source: World Economic Forum.
The Competitiveness index shows that Pakistan’s rank deteriorated over the period from 123 in
the year 2012-13 to 155 in 2017-18, whereas, the GCI ranking of regional competitors such as
China, India, Bangladesh, and Vietnam have improved throughout these years, along with their
exports.
The analysis reveals that the competitiveness has a direct and substantial effect on growth in
exports of these countries. Moreover, these countries were also able to produce high value-added
and sophisticated products that the market demanded.
So it can be concluded that Pakistan not only needs to improve its competitiveness but also it needs
to work on its product sophistication and value addition. 6
Potential product specific supply side issues.
1. The article of Apparel of Leather
The article of apparel of leather and leather merchandises are the most significant and the third
most dynamic industrial sector in Pakistan after cotton, textile, and rice. The leather industry of
Pakistan comprises approximately 800 small, medium, and large industrial units and tanneries.
However, for the last five years, statistics for exports of leather goods depict a grave situation.
Pakistan is drastically losing its exports share in the traditional leather market to other regional
states. Common reasons quoted by the supplier, industrialists, factory-owners and the government
are; increase in the cost of production, failure of domestic industries to comply with environmenta l
6 NTC Reports: Reasons of decline in Pakistan Exports.

25
standards and decline in the supply of leather as raw material. For the last five years, Pakistan
had an export of $1.2 billion in the leather sector.
However, two things make the situation sore. Firstly, overtime leather exports are exhibiting a
declining trend. As per PTA official data, the leather and leather products exports recorded a fall
of 6.76 % to $0.757 billion in 2016-17 from $0.812 billion in 2015-16. Export of leather apparel
and cloths declined by 8.95 %, gloves by 5.38 %, footwear by 6.35% during 2016-17 as compared
to 2015-16.
Secondly, the share of neighboring countries and competitors in the global leather market is
increasing, and they are achieving double-digit growth. China’s leather export rise by 20%, India’s
by 63% and Bangladesh’s 100%. Pakistan’s share of 0.5 percent in the global market for leather
is insignificant compared to China’s 19 percent, Italy’s 9 percent, Vietnam’s 4 percent and India’s
2.5 percent.
2. Instrument and appliance used in medical and surgical sciences
The surgical sector, according to the exporter, is facing several problems. These range from
marketing to adoption of new technology. Marketing is a basic problem owing to the failure in
developing local brands. However, energy supply is another major handicap.
Neither industrialists nor the government allocates funds for R&D to innovate new products to
stay updated with changing patterns in medical sciences. There is no training institute to train
human resource. As 95pc of the surgical industry operates in the SME sector, there is a need for a
common facility center to reduce the cost of production.
Sialkot’s position as a leading exporter of surgical instruments may also come under threat from
upcoming competition from China and Mexico. These countries have not only cheap labor but also
use superior technologically for innovation and better materials for manufacturing.
Moreover, this industry requires scrap as a raw material, which if imported is facing huge custom
duty of 7%, In this regard the Surgical Instruments Manufacturers Association of Pakistan
(SIMAP) have urged the government to abolish custom duty on raw material, and it has also shown
concerns over the exports of scrap from Pakistan as it weekend the local industry.
26
3. Textile Sector supply-side issues
In textile sector, minimal and low value-added products dominate exports, constituting over 60%
of the exported value. Cotton cloth, cotton yarn, bed sheets and knitwear remain major export
generators. Over the last five years, the composition has not undergone any major change except
minimal improvement in the share of readymade garments i.e. 18% in FY16 compared to 13% in
FY11 leaving significant upside potential untapped.
Whereas, Pakistan’s product mix of natural to synthetic fiber (80:20) does not correspond to the
international standards (60:40). The latter enhances the usability of raw material as synthetic fiber
offers greater flexibility as compare to natural fiber. There are 16% and 11% customs duties
respectively, on Polyester staple fiber and polyester fiber that Pakistan import as a raw material
for its textile-based exports which is an international standard requirement to catch up with the
international demand. 7
Moreover, lack of developed infrastructure facilities has hindered the growth of textile sector. The
country-wide energy crisis has adversely affected the textile sector and led to closure and transfer
of units to Bangladesh, Turkey, and other countries. The facilities installed require up-gradation,
but the sector is facing a dearth of investment as neither local bodies nor foreigners are willing to
invest.
Existence of International Brands in Italy
There are very few Pakistani brands that exist in Italy, One of these brands is “Linit” which is very
well-known throughout Italy, Linit manufactures products of linen, and it offers special sizes,
colors and models according to the individual order, it also offers personalized embroidery, print
or logo for the customer on all types of products. Other is Afroze Textile Industries Private
Limited, which is a renowned home textile sector, established in 1973 by a man named
Mahboob Alam and started trading export quality products.
Top ten Exporting Companies to Italy
Following is the list of top ten exporting companies of Pakistan to Italy concerning the potential
product identified.
7 (1st schedule of Pakistan custom tariff, 2017-18)
27
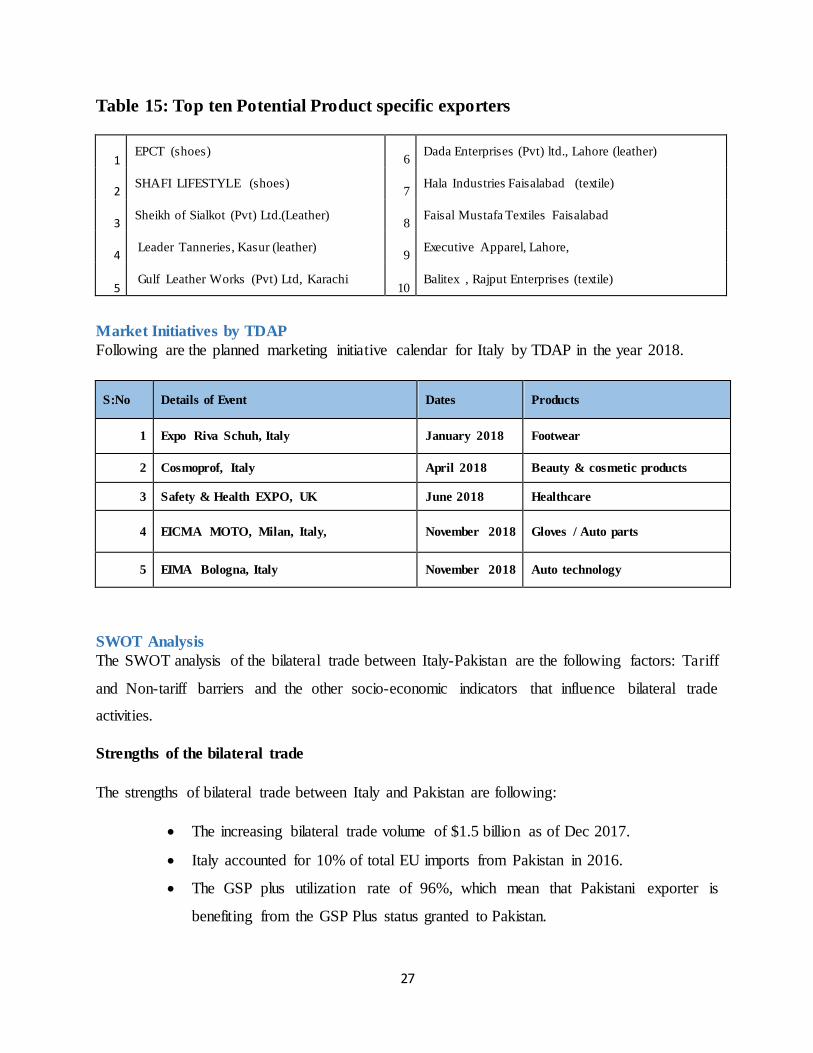
Table 15: Top ten Potential Product specific exporters
1 EPCT (shoes)
6 Dada Enterprises (Pvt) ltd., Lahore (leather)
2 SHAFI LIFESTYLE (shoes)
7 Hala Industries Faisalabad (textile)
3 Sheikh of Sialkot (Pvt) Ltd.(Leather)
8 Faisal Mustafa Textiles Faisalabad
4 Leader Tanneries, Kasur (leather)
9 Executive Apparel, Lahore,
5 Gulf Leather Works (Pvt) Ltd, Karachi
10 Balitex , Rajput Enterprises (textile)
Market Initiatives by TDAP
Following are the planned marketing initiative calendar for Italy by TDAP in the year 2018.
S:No Details of Event Dates Products
1 Expo Riva Schuh, Italy January 2018 Footwear
2 Cosmoprof, Italy April 2018 Beauty & cosmetic products
3 Safety & Health EXPO, UK June 2018 Healthcare
4 EICMA MOTO, Milan, Italy, November 2018 Gloves / Auto parts
5 EIMA Bologna, Italy November 2018 Auto technology
SWOT Analysis
The SWOT analysis of the bilateral trade between Italy-Pakistan are the following factors: Tariff
and Non-tariff barriers and the other socio-economic indicators that influence bilateral trade
activities.
Strengths of the bilateral trade
The strengths of bilateral trade between Italy and Pakistan are following:
The increasing bilateral trade volume of $1.5 billion as of Dec 2017.
Italy accounted for 10% of total EU imports from Pakistan in 2016.
The GSP plus utilization rate of 96%, which mean that Pakistani exporter is
benefiting from the GSP Plus status granted to Pakistan.

28
The GSP Plus status granted to Pakistan on February 2014, which has provided free
access to over 6300+ tariff lines and Pakistan exports to the EU have been subjected
to 20% less duty than the normal MFN duties.
Pakistan major export products such as bedlinen of cotton and plain woven fabrics
of cotton accounts for 51% and 32% respectively in Italy’s total imports from the
world.
Italy has agreed to grant duty-free access to Pakistani products in order to stimulate
an impressive growth in bilateral trade in Oct 2017.
Around 90 percent of Pakistan’s exports to Italy is textile and leather related
products. Whereas, half of Italy’s exports to Pakistan fall in the category of
machinery and equipment (Capital goods) which in the long run improve the
productivity of the country.
Weaknesses of the bilateral Trade
Pakistan has not progressed on products diversification required by GSP + agreements.
There is lack of modern technology and human resource development in our textile,
leather and surgical industries.
The exporter’s ignorance on quality certifications and conformity to internationa l
standards.
Raw material issues of Pakistan’s major exporting and potential product to Italy. Such
as textile, leather and surgical instruments.
The lack of foreign direct investment due to the economic instability and politica l
uncertainties.
The understaffed commercial consulates due to cumbersome bureaucratic culture.
The grave concerns of Compliance on GSP Plus obligation, such as capital punishment.
Opportunities for the bilateral Trade
Pakistan to take advantage of Italy’s technological advancement, as Italy’s per meter
value addition in textile is highest in the world.
The Italian investors and businessmen are showing interest in fashion and marble
sectors of Pakistan.

29
The modern technological infrastructure of Italy that can help Pakistan strengthen its
poor and outdated infrastructure.
The high level of internationalization and entrepreneurship, which has an opportunity
for Pakistani businessmen to take advantage from it.
The strong manufacturing and innovation capability in several areas, which has an
opportunity for Pakistani businessmen who lacked behind on innovative front in the
international arena.
Italy hosts many trade exhibitions with global appeal, which is an opportunity for
marketing Pakistani products to attract buying houses of the world.
Italy is one of the world’s top 5th tourist destinations, presence of Pakistani brands in
their market can help promote made in Pakistan culture, through proper marketing
strategies. For example promoting products under “Emerging Pakistan” brand on
Millan airport or hiring a duty-free shop for Pakistani products on their busiest airports.
Italy possesses countless opportunities for exporters and companies. Such as around 60
million demanding and sophisticated consumers, a favorable geographical position in
the center of the Mediterranean Sea, and an extensive infrastructure network, facilit ies ,
and support for foreign companies.
The threat for the bilateral Trade
The proposal of withdrawal of GSP benefits by Italian Senate on the alleged terror
financing charges in EU and its parliament on the charges of non-compliance with UN
conventions, Dec 2017.
The political uncertainty and economic instability in Italy are one of the weaknesses of our
bilateral trade.
Conclusion and Recommendation
The study concludes that the textile sector of Pakistan whose product mix of natural to synthetic
fiber i.e. (80:20) doesn’t correspond to the international standards of (60:40) as the later demand
more usage of raw material as synthetic fiber. Subsequently, when the industry imports these men
made fiber there are 16 and 11 percent customs duties respectively on Polythene staple fiber (PSF)
and Polyethylene fiber (PF) thus, the researcher proposes to either decrease or subside these

30
customs duties to support the textile industry in order to comply with the international standard in
the exports of textile products.
Similarly, in the surgical industry, there is a severe issue of raw material for manufacturing as the
raw material locally available are exported to other countries. On the other hand, there is a high
tariff on import of scrap as a raw material that in turns increases the cost of production. Moreover,
the surgical instrument manufacturing firms Pakistan do not have a proper marketing presence in
foreign countries to allow direct sales to end users in these countries.
Lastly, the leather industry is also facing many challenges, most importantly is the issue of
supplies as raw hides and skins produced in the country are not sufficient to fulfill the
requirenment of the tanning industry. The damand and supply gap is widening which increases the
cost of production. Further the industry has shown no progress to comply with the interntaiona l
environmental standards.
Thus, the study suggests the country offices, MOC and TDAP to devise a policy in collaboration
with the trade associations to comply with the international standards and demand. Further, it also
proposes to strategize a comprehensive marketing and promotional strategy for these items in
international markets.
Lastly the study suggests to introduce made in Pakistan brands in these sectors, to adventure the
full potential of these products in the market of Italy.

31
Appendix
Grape 04: GDP Per Capita of Italy
Graph 05: Unit prize comparison of top 15 products that Pakistan export to Italy
33400
33600
33800
34000
34200
34400
34600
34800
35000
2011 2012 2013 2014 2015 2016 2017
USD
GDP Per Capita italy
0102030405060
'630
231
'620
342
'520
812
'410
712
'630
260
'630
221
'620
462
'520
819
'640
399
'100
620
'252
620
'611
020
'520
942
'220
710
'411
310
Per unit prize comparison
Per units Prizeimports from Pakistan
Per unit Prize ImportFrom World

32
Table 17: All potential products identified in the study
Hs
Code Product label
Pak
Exp to
Italy
2016
Pak
Exp to
world
2016
Italy
Imp
from
world
2016
% of
Italy
Import
world
Tariffs
'630231 Bedlinen of cotton 49,677 773,306 108,770 45.67 0
'620342 Men's or boys' trousers, 47,115 543,874 999,282 4.71 0
'520812 Plain woven fabrics of cotton, 29,796 183,873 100,354 29.69 0
'410712
Grain splits leather "incl. parchment-
dressed leather", of the whole hides and skins of bovine
28,081 115,989 293,955 9.55 0
'630260 Toilet linen and kitchen linen. 23,585 777,086 130,658 18.05 0
'620462 Women's or girls' trousers. 16,755 366,222 551,906 3.03 0
'220710 Undenatured ethyl alcohol. 13,032 221,817 124,908 10.43 0
'420310 Articles of apparel, of leather or
composition leather. 6,894 297,991 202,404 3.4 0
'610910 T-shirts, singlets and other vests of cotton, knitted or crocheted
3,698 205,111 989,591 0.37 0
'901890
Instruments and appliances used in
medical, surgical or veterinary sciences, n.e.s.
2,100 326,028 1,351,864 0.15 0
'611595 Full-length or knee-length stockings, socks and other hosiery, incl. footwear
without applied ...
1,523 143,324 188,721 0.8 0
'610510 Men's or boys' shirts of cotton, knitted or crocheted.
654 209,890 304,911 0.21 0
'020110 Carcasses or half-carcasses of bovine animals, fresh or chilled
-
125,737 327,424 0 0

33
'390760 Poly"ethylene terephthalate", in primary
forms 11,639 135,835 448,647 2.59 0
'170199 Cane or beet sugar and chemically pure sucrose, in solid form.
-
123,078 691,824 0 0
Non- Tariff Barrier Specification
Labeling Requirement.
This requirement is to measure and regulate the kind color and size of printing on packages and
labels and defines the information that should be provided to the consumers. It may include a
requirement on the official languages to be used as well as technical information on that product
such as voltage, information to the consumers are providing regarding components, instruction on
use, safety and security advice. i.e., Refrigerators need to carry a label indicating its size, weight
as well as electricity consumption level.
Marking Requirements
This requirement is to measures defining the information for transport and customs that the
transport/distribution packaging of goods should carry for example handling or storage
conditions according to type of product, typically signs such as ""FRAGILE"" or ""THIS SIDE
UP"" etc. must be marked on the transport container. ".
Product Quality of Performance Requirement.
This requirement is for conditions to be satisfied regarding performance (e.g., durability, hardness)
or quality (e.g., the content of defined ingredients) Example: Door must resist certain minimum
high temperature.
Testing Requirements.
It is a requirement for products to be tested against a given regulation, such as performance level:
It includes sampling requirement. Example: A testing on a sample of motor vehicle imports is
required against the required safety compliance and its equipment, etc.
34
Prohibition for TBT reasons - (TBT)
Imports are prohibited for hazardous substances including explosives, certain toxic substances
covered by the Basel Convention such as aerosol sprays containing CFCs, a range of HCFCs and
BFCs, halons, methyl chloroform and carbon tetrachloride.
Certification requirement (TBT)
Certification of conformity with a given regulation: required by the importing country but may
be issued in the exporting or the importing country Example: Certificate of conformity for
electrical products is required.
Inspection requirement - (TBT)
The requirement for product inspection in the importing country: may be performed by public or
private entities. It is similar to testing, but it does not include laboratory testing. Example: Textile
and clothing imports must be inspected for size and materials used before entry is allowed.
Registration requirement for importers for TBT reasons - (TBT)
The requirement that importers should be registered to import certain products: To register,
importers need to comply with certain requirements, documentation and registration fees. It also
includes the registration of establishments producing certain products. Example: Importers of
"sensitive product" such as medicines, drugs, explosives, firearms, alcohol, cigarettes, game
machines, etc. may be required to be registered in the importing country.
Restricted use of certain substances - (TBT)
Restriction on the use of certain substances as components or material to prevent the risks arising
from their use: Example: a) Restricted use of solvents in paints; b) the maximum level of lead
allowed in consumer paint.
Conformity assessment related to TBT - (TBT)
The requirement for verification that a given TBT requirement has been met: it could be achieved
by one or combined forms of inspection and approval procedure, including procedures for

35
sampling, testing, and inspection, evaluation, verification and assurance of conformity,
accreditation, and approval, etc.
Import monitoring and surveillance requirements and other automatic licensing measures
Administrative measures which seek to monitor the import value or volume of specified products.
Example: Automatic import license is required as an administrative procedure for textile and
apparel before importation.