bilateral trade declines further by 7.5% in 2013 -...
TRANSCRIPT
31Indo-German Trade
Annual Review
2014
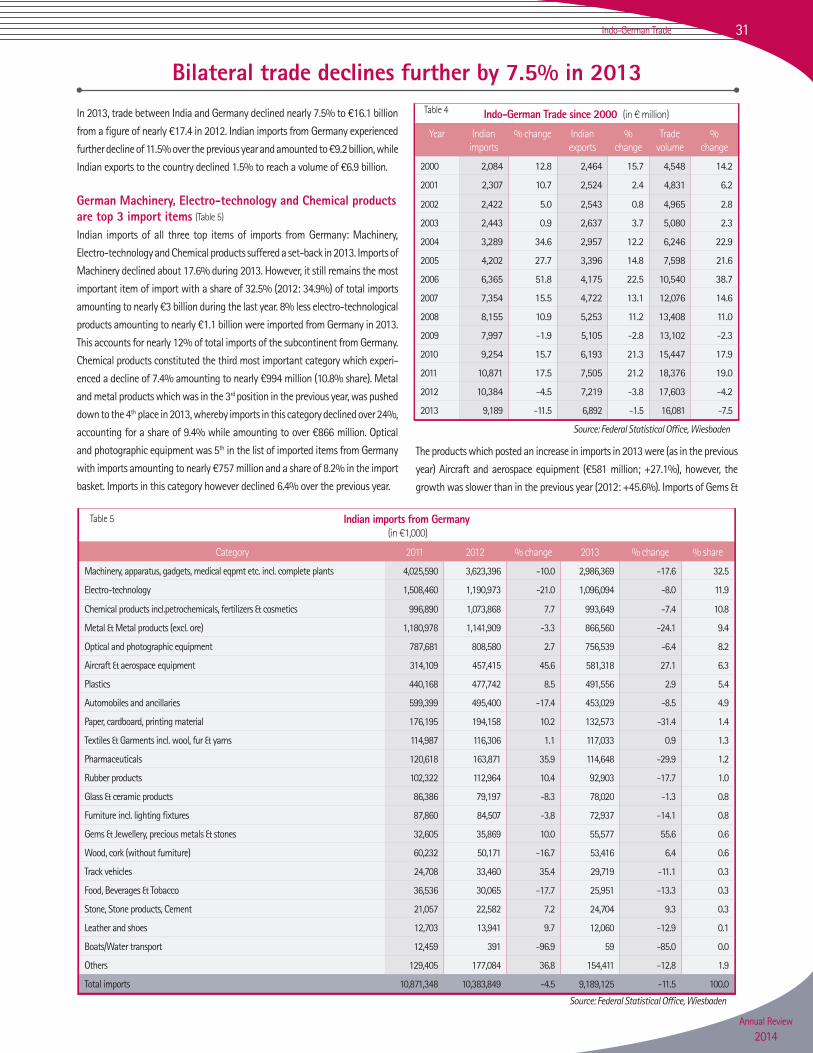
Bilateral trade declines further by 7.5% in 2013In 2013, trade between India and Germany declined nearly 7.5% to ¤16.1 billion
from a figure of nearly ¤17.4 in 2012. Indian imports from Germany experienced
further decline of 11.5% over the previous year and amounted to ¤9.2 billion, while
Indian exports to the country declined 1.5% to reach a volume of ¤6.9 billion.
German Machinery, Electro-technology and Chemical products are top 3 import itemsIndian imports of all three top items of imports from Germany: Machinery,
Electro-technology and Chemical products suffered a set-back in 2013. Imports of
Machinery declined about 17.6% during 2013. However, it still remains the most
important item of import with a share of 32.5% (2012: 34.9%) of total imports
amounting to nearly ¤3 billion during the last year. 8% less electro-technological
products amounting to nearly ¤1.1 billion were imported from Germany in 2013.
This accounts for nearly 12% of total imports of the subcontinent from Germany.
Chemical products constituted the third most important category which experi-
enced a decline of 7.4% amounting to nearly ¤994 million (10.8% share). Metal
and metal products which was in the 3rd position in the previous year, was pushed
down to the 4th place in 2013, whereby imports in this category declined over 24%,
accounting for a share of 9.4% while amounting to over ¤866 million. Optical
and photographic equipment was 5th in the list of imported items from Germany
with imports amounting to nearly ¤757 million and a share of 8.2% in the import
basket. Imports in this category however declined 6.4% over the previous year.
Indo-German Trade since 2000 (in ¤ million)
Year Indian imports
% change Indian exports
% change
Trade volume
% change
2000 2,084 12.8 2,464 15.7 4,548 14.2
2001 2,307 10.7 2,524 2.4 4,831 6.2
2002 2,422 5.0 2,543 0.8 4,965 2.8
2003 2,443 0.9 2,637 3.7 5,080 2.3
2004 3,289 34.6 2,957 12.2 6,246 22.9
2005 4,202 27.7 3,396 14.8 7,598 21.6
2006 6,365 51.8 4,175 22.5 10,540 38.7
2007 7,354 15.5 4,722 13.1 12,076 14.6
2008 8,155 10.9 5,253 11.2 13,408 11.0
2009 7,997 -1.9 5,105 -2.8 13,102 -2.3
2010 9,254 15.7 6,193 21.3 15,447 17.9
2011 10,871 17.5 7,505 21.2 18,376 19.0
2012 10,384 -4.5 7,219 -3.8 17,603 -4.2
2013 9,189 -11.5 6,892 -1.5 16,081 -7.5
Indian imports from Germany (in ¤1,000)
Category 2011 2012 % change 2013 % change % share
Machinery, apparatus, gadgets, medical eqpmt etc. incl. complete plants 4,025,590 3,623,396 -10.0 2,986,369 -17.6 32.5
Electro-technology 1,508,460 1,190,973 -21.0 1,096,094 -8.0 11.9
Chemical products incl.petrochemicals, fertilizers & cosmetics 996,890 1,073,868 7.7 993,649 -7.4 10.8
Metal & Metal products (excl. ore) 1,180,978 1,141,909 -3.3 866,560 -24.1 9.4
Optical and photographic equipment 787,681 808,580 2.7 756,539 -6.4 8.2
Aircraft & aerospace equipment 314,109 457,415 45.6 581,318 27.1 6.3
Plastics 440,168 477,742 8.5 491,556 2.9 5.4
Automobiles and ancillaries 599,399 495,400 -17.4 453,029 -8.5 4.9
Paper, cardboard, printing material 176,195 194,158 10.2 132,573 -31.4 1.4
Textiles & Garments incl. wool, fur & yarns 114,987 116,306 1.1 117,033 0.9 1.3
Pharmaceuticals 120,618 163,871 35.9 114,648 -29.9 1.2
Rubber products 102,322 112,964 10.4 92,903 -17.7 1.0
Glass & ceramic products 86,386 79,197 -8.3 78,020 -1.3 0.8
Furniture incl. lighting fixtures 87,860 84,507 -3.8 72,937 -14.1 0.8
Gems & Jewellery, precious metals & stones 32,605 35,869 10.0 55,577 55.6 0.6
Wood, cork (without furniture) 60,232 50,171 -16.7 53,416 6.4 0.6
Track vehicles 24,708 33,460 35.4 29,719 -11.1 0.3
Food, Beverages & Tobacco 36,536 30,065 -17.7 25,951 -13.3 0.3
Stone, Stone products, Cement 21,057 22,582 7.2 24,704 9.3 0.3
Leather and shoes 12,703 13,941 9.7 12,060 -12.9 0.1
Boats/Water transport 12,459 391 -96.9 59 -85.0 0.0
Others 129,405 177,084 36.8 154,411 -12.8 1.9
Total imports 10,871,348 10,383,849 -4.5 9,189,125 -11.5 100.0
Source: Federal Statistical Office, Wiesbaden
Source: Federal Statistical Office, Wiesbaden
The products which posted an increase in imports in 2013 were (as in the previous
year) Aircraft and aerospace equipment (¤581 million; +27.1%), however, the
growth was slower than in the previous year (2012: +45.6%). Imports of Gems &
Table 4
Table 5
(Table 5)
33Indo-German Trade
Annual Review
2014
Jewellery including Precious metals and stones also grew substantially, increasing
by 55.6% in 2013 over the previous year amounting to nearly ¤56 million. Imports
of Plastics grew about 3% touching ¤492 million.
The top 5 categories accounted for nearly 73% share of total imports from Germany,
while the top three accounted for over 55%.
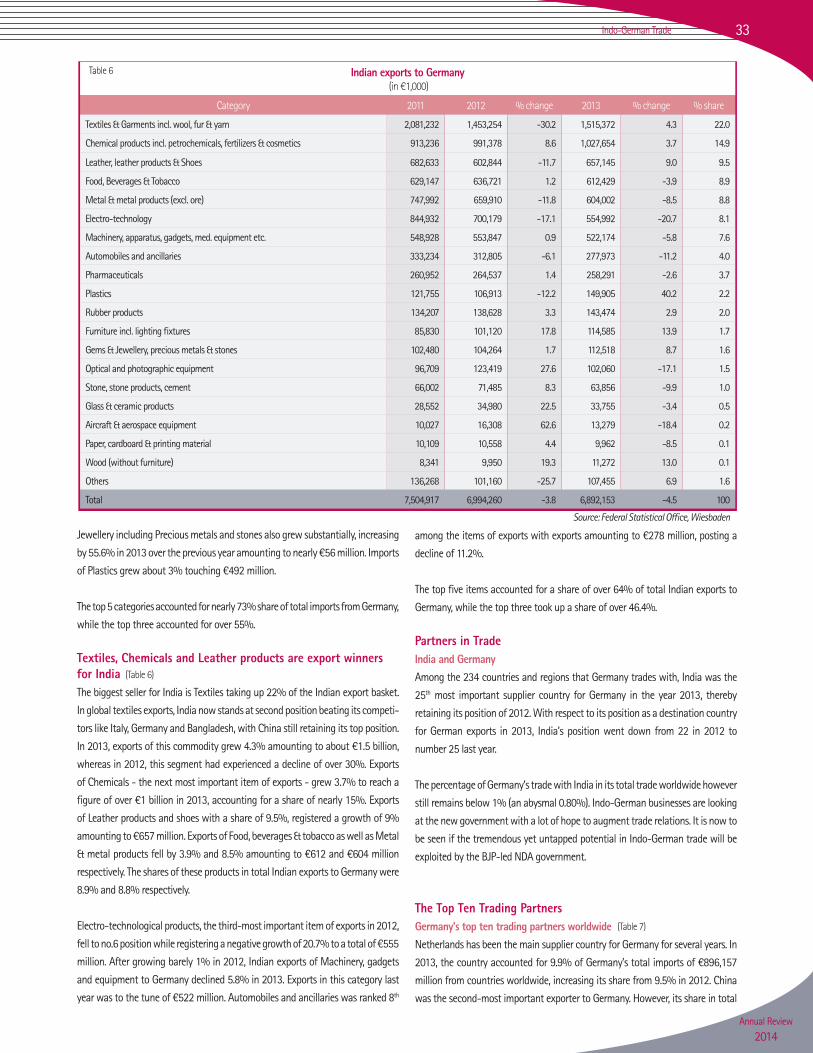
Textiles, Chemicals and Leather products are export winners for IndiaThe biggest seller for India is Textiles taking up 22% of the Indian export basket.
In global textiles exports, India now stands at second position beating its competi-
tors like Italy, Germany and Bangladesh, with China still retaining its top position.
In 2013, exports of this commodity grew 4.3% amounting to about ¤1.5 billion,
whereas in 2012, this segment had experienced a decline of over 30%. Exports
of Chemicals - the next most important item of exports - grew 3.7% to reach a
figure of over ¤1 billion in 2013, accounting for a share of nearly 15%. Exports
of Leather products and shoes with a share of 9.5%, registered a growth of 9%
amounting to ¤657 million. Exports of Food, beverages & tobacco as well as Metal
& metal products fell by 3.9% and 8.5% amounting to ¤612 and ¤604 million
respectively. The shares of these products in total Indian exports to Germany were
8.9% and 8.8% respectively.
Electro-technological products, the third-most important item of exports in 2012,
fell to no.6 position while registering a negative growth of 20.7% to a total of ¤555
million. After growing barely 1% in 2012, Indian exports of Machinery, gadgets
and equipment to Germany declined 5.8% in 2013. Exports in this category last
year was to the tune of ¤522 million. Automobiles and ancillaries was ranked 8th
Indian exports to Germany (in ¤1,000)
Category 2011 2012 % change 2013 % change % share
Textiles & Garments incl. wool, fur & yarn 2,081,232 1,453,254 -30.2 1,515,372 4.3 22.0
Chemical products incl. petrochemicals, fertilizers & cosmetics 913,236 991,378 8.6 1,027,654 3.7 14.9
Leather, leather products & Shoes 682,633 602,844 -11.7 657,145 9.0 9.5
Food, Beverages & Tobacco 629,147 636,721 1.2 612,429 -3.9 8.9
Metal & metal products (excl. ore) 747,992 659,910 -11.8 604,002 -8.5 8.8
Electro-technology 844,932 700,179 -17.1 554,992 -20.7 8.1
Machinery, apparatus, gadgets, med. equipment etc. 548,928 553,847 0.9 522,174 -5.8 7.6
Automobiles and ancillaries 333,234 312,805 -6.1 277,973 -11.2 4.0
Pharmaceuticals 260,952 264,537 1.4 258,291 -2.6 3.7
Plastics 121,755 106,913 -12.2 149,905 40.2 2.2
Rubber products 134,207 138,628 3.3 143,474 2.9 2.0
Furniture incl. lighting fixtures 85,830 101,120 17.8 114,585 13.9 1.7
Gems & Jewellery, precious metals & stones 102,480 104,264 1.7 112,518 8.7 1.6
Optical and photographic equipment 96,709 123,419 27.6 102,060 -17.1 1.5
Stone, stone products, cement 66,002 71,485 8.3 63,856 -9.9 1.0
Glass & ceramic products 28,552 34,980 22.5 33,755 -3.4 0.5
Aircraft & aerospace equipment 10,027 16,308 62.6 13,279 -18.4 0.2
Paper, cardboard & printing material 10,109 10,558 4.4 9,962 -8.5 0.1
Wood (without furniture) 8,341 9,950 19.3 11,272 13.0 0.1
Others 136,268 101,160 -25.7 107,455 6.9 1.6
Total 7,504,917 6,994,260 -3.8 6,892,153 -4.5 100
Source: Federal Statistical Office, Wiesbaden
among the items of exports with exports amounting to ¤278 million, posting a
decline of 11.2%.
The top five items accounted for a share of over 64% of total Indian exports to
Germany, while the top three took up a share of over 46.4%.
Partners in TradeIndia and GermanyAmong the 234 countries and regions that Germany trades with, India was the
25th most important supplier country for Germany in the year 2013, thereby
retaining its position of 2012. With respect to its position as a destination country
for German exports in 2013, India’s position went down from 22 in 2012 to
number 25 last year.
The percentage of Germany’s trade with India in its total trade worldwide however
still remains below 1% (an abysmal 0.80%). Indo-German businesses are looking
at the new government with a lot of hope to augment trade relations. It is now to
be seen if the tremendous yet untapped potential in Indo-German trade will be
exploited by the BJP-led NDA government.
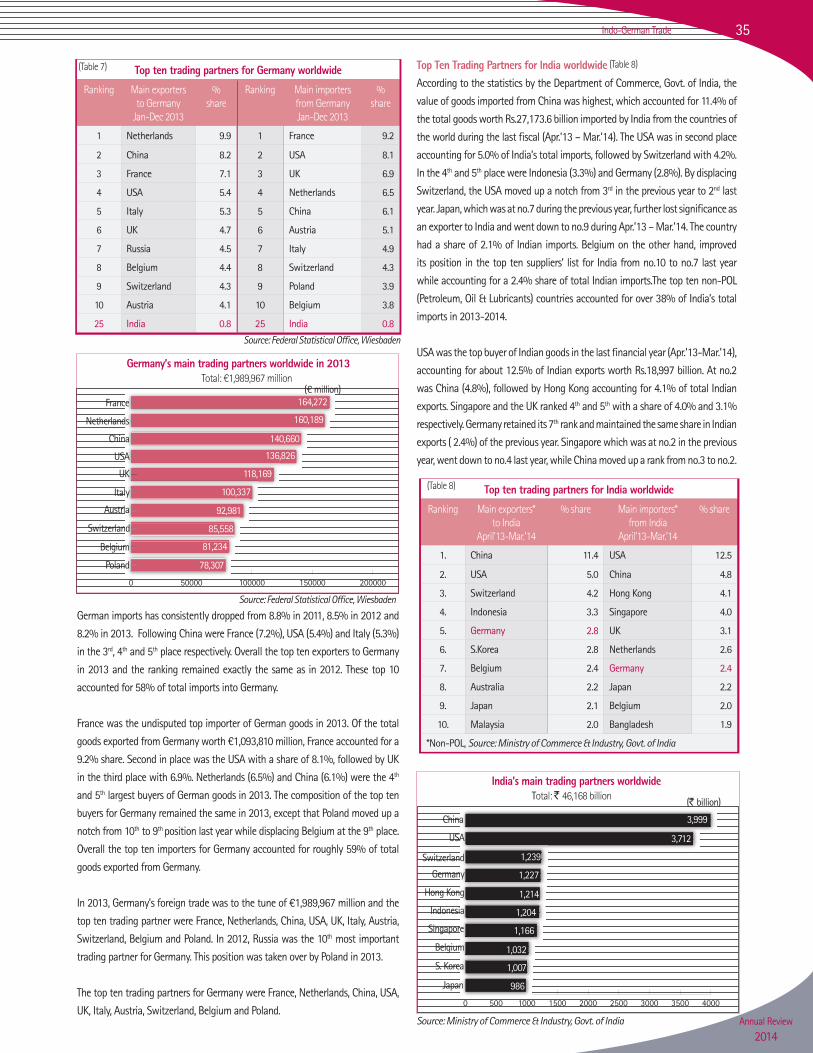
The Top Ten Trading PartnersGermany’s top ten trading partners worldwide Netherlands has been the main supplier country for Germany for several years. In
2013, the country accounted for 9.9% of Germany’s total imports of ¤896,157
million from countries worldwide, increasing its share from 9.5% in 2012. China
was the second-most important exporter to Germany. However, its share in total
Table 6
(Table 6)
(Table 7)
35Indo-German Trade
Annual Review
2014
German imports has consistently dropped from 8.8% in 2011, 8.5% in 2012 and
8.2% in 2013. Following China were France (7.2%), USA (5.4%) and Italy (5.3%)
in the 3rd, 4th and 5th place respectively. Overall the top ten exporters to Germany
in 2013 and the ranking remained exactly the same as in 2012. These top 10
accounted for 58% of total imports into Germany.
France was the undisputed top importer of German goods in 2013. Of the total
goods exported from Germany worth ¤1,093,810 million, France accounted for a
9.2% share. Second in place was the USA with a share of 8.1%, followed by UK
in the third place with 6.9%. Netherlands (6.5%) and China (6.1%) were the 4th
and 5th largest buyers of German goods in 2013. The composition of the top ten
buyers for Germany remained the same in 2013, except that Poland moved up a
notch from 10th to 9th position last year while displacing Belgium at the 9th place.
Overall the top ten importers for Germany accounted for roughly 59% of total
goods exported from Germany.
In 2013, Germany’s foreign trade was to the tune of ¤1,989,967 million and the
top ten trading partner were France, Netherlands, China, USA, UK, Italy, Austria,
Switzerland, Belgium and Poland. In 2012, Russia was the 10th most important
trading partner for Germany. This position was taken over by Poland in 2013.
The top ten trading partners for Germany were France, Netherlands, China, USA,
UK, Italy, Austria, Switzerland, Belgium and Poland.
Top Ten Trading Partners for India worldwideAccording to the statistics by the Department of Commerce, Govt. of India, the
value of goods imported from China was highest, which accounted for 11.4% of
the total goods worth Rs.27,173.6 billion imported by India from the countries of
the world during the last fiscal (Apr.’13 – Mar.’14). The USA was in second place
accounting for 5.0% of India’s total imports, followed by Switzerland with 4.2%.
In the 4th and 5th place were Indonesia (3.3%) and Germany (2.8%). By displacing
Switzerland, the USA moved up a notch from 3rd in the previous year to 2nd last
year. Japan, which was at no.7 during the previous year, further lost significance as
an exporter to India and went down to no.9 during Apr.’13 – Mar.’14. The country
had a share of 2.1% of Indian imports. Belgium on the other hand, improved
its position in the top ten suppliers’ list for India from no.10 to no.7 last year
while accounting for a 2.4% share of total Indian imports.The top ten non-POL
(Petroleum, Oil & Lubricants) countries accounted for over 38% of India’s total
imports in 2013-2014.
USA was the top buyer of Indian goods in the last financial year (Apr.’13-Mar.’14),
accounting for about 12.5% of Indian exports worth Rs.18,997 billion. At no.2
was China (4.8%), followed by Hong Kong accounting for 4.1% of total Indian
exports. Singapore and the UK ranked 4th and 5th with a share of 4.0% and 3.1%
respectively. Germany retained its 7th rank and maintained the same share in Indian
exports ( 2.4%) of the previous year. Singapore which was at no.2 in the previous
year, went down to no.4 last year, while China moved up a rank from no.3 to no.2.
Top ten trading partners for Germany worldwide
Ranking Main exporters to Germany
Jan-Dec 2013
% share
Ranking Main importers from GermanyJan-Dec 2013
% share
1 Netherlands 9.9 1 France 9.2
2 China 8.2 2 USA 8.1
3 France 7.1 3 UK 6.9
4 USA 5.4 4 Netherlands 6.5
5 Italy 5.3 5 China 6.1
6 UK 4.7 6 Austria 5.1
7 Russia 4.5 7 Italy 4.9
8 Belgium 4.4 8 Switzerland 4.3
9 Switzerland 4.3 9 Poland 3.9
10 Austria 4.1 10 Belgium 3.8
25 India 0.8 25 India 0.8
Source: Federal Statistical Office, Wiesbaden
0 50000 100000 150000 200000
France
Netherlands
China
USA
UK
Italy
Austria
Switzerland
Belgium
Poland
164,272
160,189
140,660
136,826
118,169
100,337
92,981
85,558
81,234
78,307
Germany’s main trading partners worldwide in 2013Total: ¤1,989,967 million
(¤ million)
Top ten trading partners for India worldwide
Ranking Main exporters* to India
April’13-Mar.’14
% share Main importers* from India
April’13-Mar.’14
% share
1. China 11.4 USA 12.5
2. USA 5.0 China 4.8
3. Switzerland 4.2 Hong Kong 4.1
4. Indonesia 3.3 Singapore 4.0
5. Germany 2.8 UK 3.1
6. S.Korea 2.8 Netherlands 2.6
7. Belgium 2.4 Germany 2.4
8. Australia 2.2 Japan 2.2
9. Japan 2.1 Belgium 2.0
10. Malaysia 2.0 Bangladesh 1.9
*Non-POL, Source: Ministry of Commerce & Industry, Govt. of India
0 500 1000 1500 2000 2500 3000 3500 4000
China
USA
Switzerland
Germany
Hong Kong
Indonesia
Singapore
Belgium
S. Korea
Japan
3,999
3,712
1,239
1,227
1,214
1,204
1,166
1,032
1,007
986
India’s main trading partners worldwideTotal: 46,168 billion (` billion)
(Table 7)
Source: Federal Statistical Office, Wiesbaden
(Table 8)
Source: Ministry of Commerce & Industry, Govt. of India
(Table 8)
37Indo-German Trade
Annual Review
2014
Hong Kong too improved its position from no.4 to no.3 last year. A new entrant
into the top ten list of importers of Indian goods is Bangladesh, which nudged
Brazil out of previous year’s list to assume the no.10 position last year.The top ten
non-POL (Petroleum, Oil & Lubricants) countries absorbed nearly 40% of India’s
total exports in the year 2013-14.
In the last financial year 2013-14, India’s foreign trade was to the tune of ¤46,168
billion and the top ten trading partners were China, USA, Switzerland, Germany,
Hong Kong, Indonesia, Singapore, Belgium, South Korea and Japan.
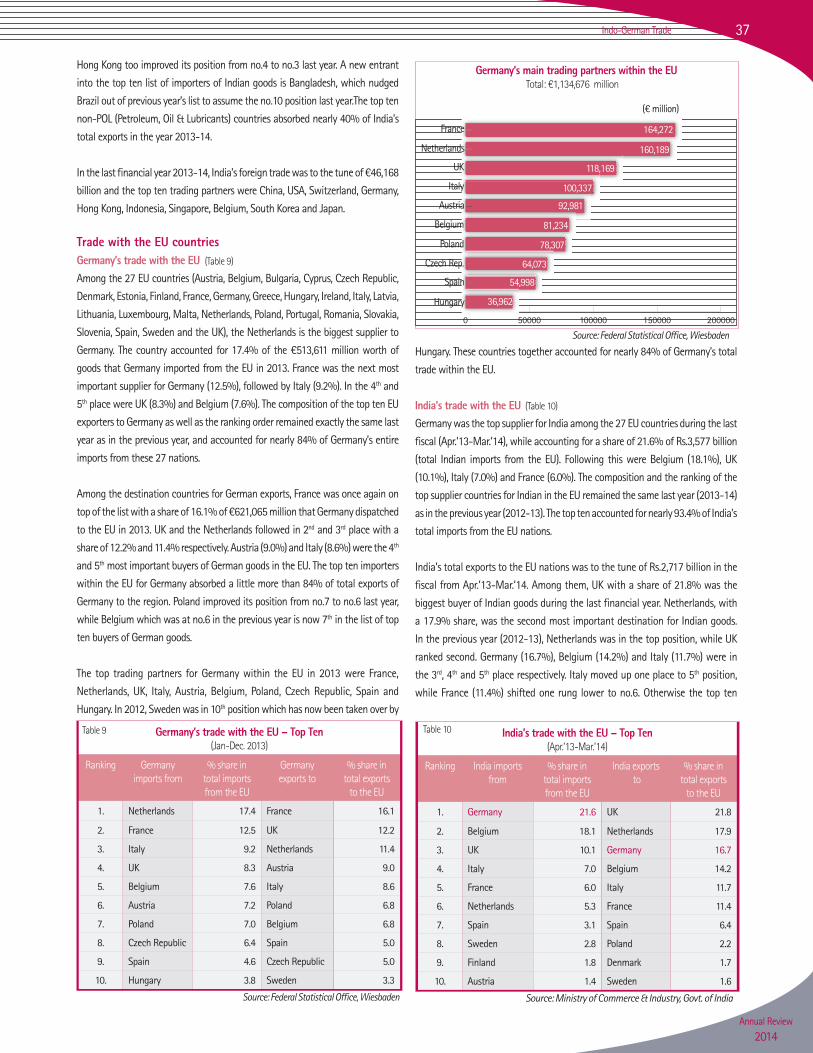
Trade with the EU countries Germany’s trade with the EUAmong the 27 EU countries (Austria, Belgium, Bulgaria, Cyprus, Czech Republic,
Denmark, Estonia, Finland, France, Germany, Greece, Hungary, Ireland, Italy, Latvia,
Lithuania, Luxembourg, Malta, Netherlands, Poland, Portugal, Romania, Slovakia,
Slovenia, Spain, Sweden and the UK), the Netherlands is the biggest supplier to
Germany. The country accounted for 17.4% of the ¤513,611 million worth of
goods that Germany imported from the EU in 2013. France was the next most
important supplier for Germany (12.5%), followed by Italy (9.2%). In the 4th and
5th place were UK (8.3%) and Belgium (7.6%). The composition of the top ten EU
exporters to Germany as well as the ranking order remained exactly the same last
year as in the previous year, and accounted for nearly 84% of Germany’s entire
imports from these 27 nations.
Among the destination countries for German exports, France was once again on
top of the list with a share of 16.1% of ¤621,065 million that Germany dispatched
to the EU in 2013. UK and the Netherlands followed in 2nd and 3rd place with a
share of 12.2% and 11.4% respectively. Austria (9.0%) and Italy (8.6%) were the 4th
and 5th most important buyers of German goods in the EU. The top ten importers
within the EU for Germany absorbed a little more than 84% of total exports of
Germany to the region. Poland improved its position from no.7 to no.6 last year,
while Belgium which was at no.6 in the previous year is now 7th in the list of top
ten buyers of German goods.
The top trading partners for Germany within the EU in 2013 were France,
Netherlands, UK, Italy, Austria, Belgium, Poland, Czech Republic, Spain and
Hungary. In 2012, Sweden was in 10th position which has now been taken over by
Hungary. These countries together accounted for nearly 84% of Germany’s total
trade within the EU.
India’s trade with the EU Germany was the top supplier for India among the 27 EU countries during the last
fiscal (Apr.’13-Mar.’14), while accounting for a share of 21.6% of Rs.3,577 billion
(total Indian imports from the EU). Following this were Belgium (18.1%), UK
(10.1%), Italy (7.0%) and France (6.0%). The composition and the ranking of the
top supplier countries for Indian in the EU remained the same last year (2013-14)
as in the previous year (2012-13). The top ten accounted for nearly 93.4% of India’s
total imports from the EU nations.
India’s total exports to the EU nations was to the tune of Rs.2,717 billion in the
fiscal from Apr.’13-Mar.’14. Among them, UK with a share of 21.8% was the
biggest buyer of Indian goods during the last financial year. Netherlands, with
a 17.9% share, was the second most important destination for Indian goods.
In the previous year (2012-13), Netherlands was in the top position, while UK
ranked second. Germany (16.7%), Belgium (14.2%) and Italy (11.7%) were in
the 3rd, 4th and 5th place respectively. Italy moved up one place to 5th position,
while France (11.4%) shifted one rung lower to no.6. Otherwise the top ten
Germany’s trade with the EU – Top Ten (Jan-Dec. 2013)
Ranking Germany imports from
% share in total imports from the EU
Germany exports to
% share in total exports
to the EU
1. Netherlands 17.4 France 16.1
2. France 12.5 UK 12.2
3. Italy 9.2 Netherlands 11.4
4. UK 8.3 Austria 9.0
5. Belgium 7.6 Italy 8.6
6. Austria 7.2 Poland 6.8
7. Poland 7.0 Belgium 6.8
8. Czech Republic 6.4 Spain 5.0
9. Spain 4.6 Czech Republic 5.0
10. Hungary 3.8 Sweden 3.3
0 50000 100000 150000 200000
France
Netherlands
UK
Italy
Austria
Belgium
Poland
Czech Rep.
Spain
Hungary
164,272
160,189
118,169
100,337
92,981
81,234
78,307
64,073
54,998
36,962
Germany’s main trading partners within the EU Total: ¤1,134,676 million
(¤ million)
India’s trade with the EU – Top Ten (Apr.’13-Mar.’14)
Ranking India imports from
% share in total imports from the EU
India exports to
% share in total exports
to the EU
1. Germany 21.6 UK 21.8
2. Belgium 18.1 Netherlands 17.9
3. UK 10.1 Germany 16.7
4. Italy 7.0 Belgium 14.2
5. France 6.0 Italy 11.7
6. Netherlands 5.3 France 11.4
7. Spain 3.1 Spain 6.4
8. Sweden 2.8 Poland 2.2
9. Finland 1.8 Denmark 1.7
10. Austria 1.4 Sweden 1.6
Source: Ministry of Commerce & Industry, Govt. of IndiaSource: Federal Statistical Office, Wiesbaden
(Table 9)
Table 9
(Table 10)
Table 10
Source: Federal Statistical Office, Wiesbaden
39Indo-German Trade
Annual Review
2014
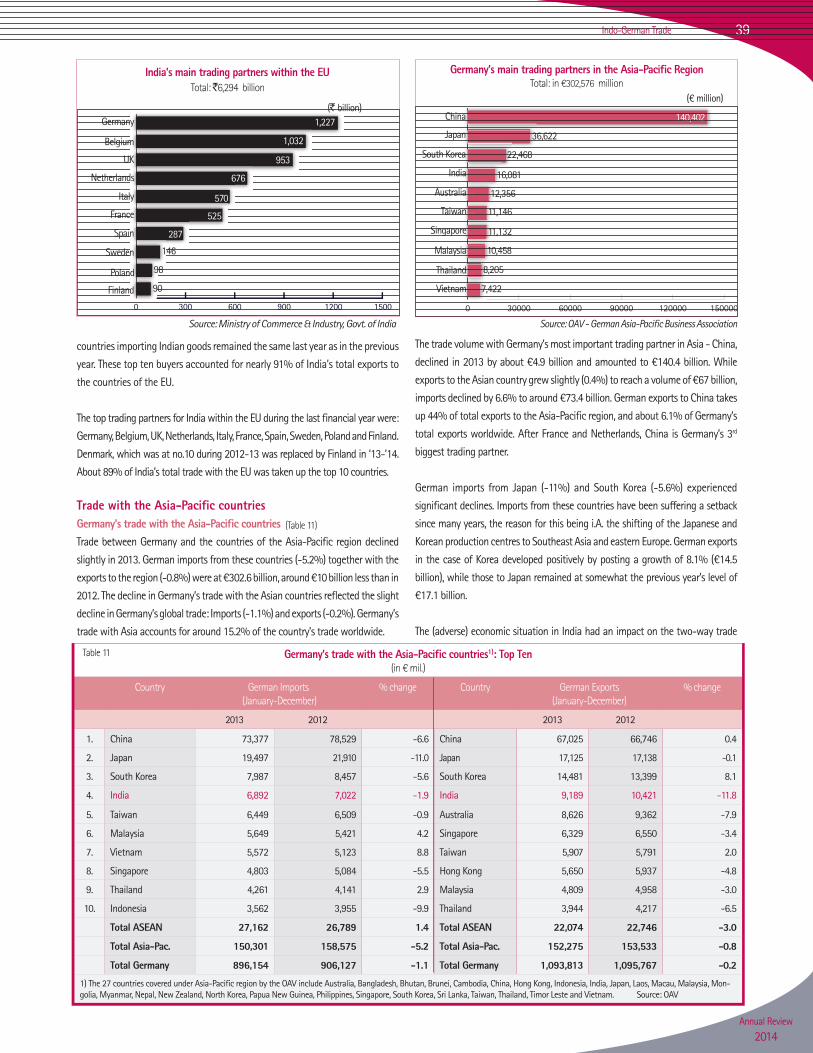
countries importing Indian goods remained the same last year as in the previous
year. These top ten buyers accounted for nearly 91% of India’s total exports to
the countries of the EU.
The top trading partners for India within the EU during the last financial year were:
Germany, Belgium, UK, Netherlands, Italy, France, Spain, Sweden, Poland and Finland.
Denmark, which was at no.10 during 2012-13 was replaced by Finland in ‘13-’14.
About 89% of India’s total trade with the EU was taken up the top 10 countries.
Trade with the Asia-Pacific countries Germany’s trade with the Asia-Pacific countries Trade between Germany and the countries of the Asia-Pacific region declined
slightly in 2013. German imports from these countries (-5.2%) together with the
exports to the region (-0.8%) were at ¤302.6 billion, around ¤10 billion less than in
2012. The decline in Germany’s trade with the Asian countries reflected the slight
decline in Germany’s global trade: Imports (-1.1%) and exports (-0.2%). Germany’s
trade with Asia accounts for around 15.2% of the country’s trade worldwide.
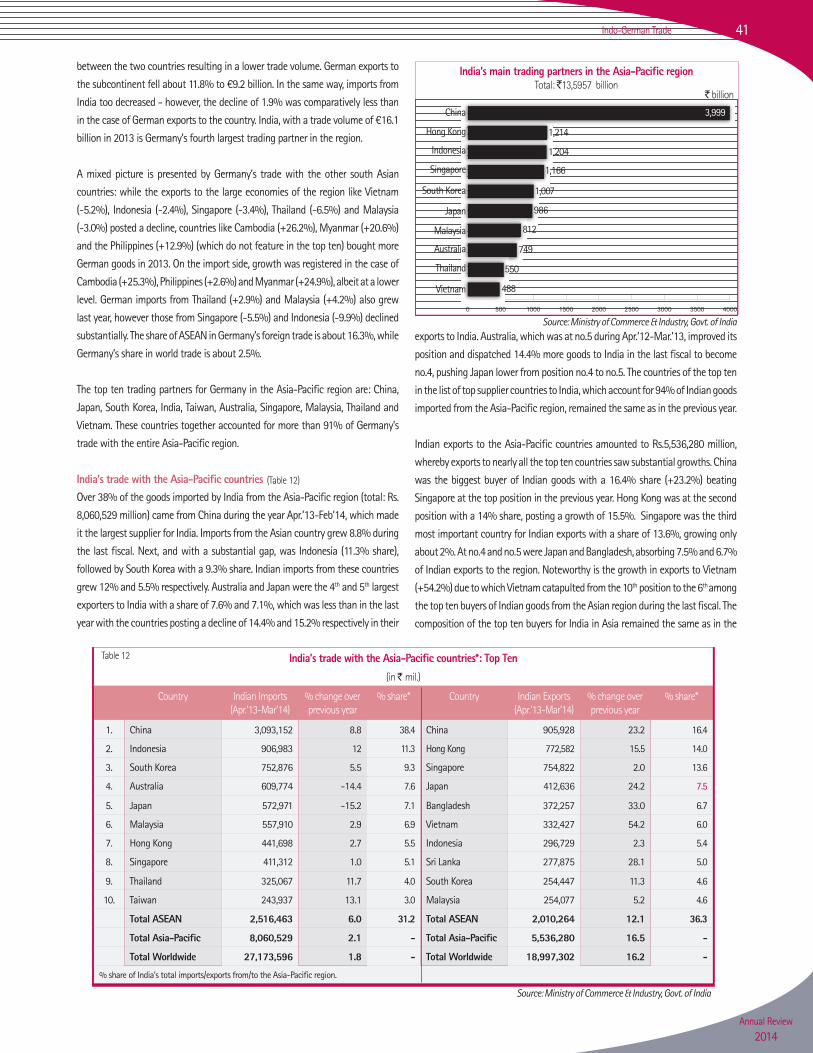
The trade volume with Germany’s most important trading partner in Asia - China,
declined in 2013 by about ¤4.9 billion and amounted to ¤140.4 billion. While
exports to the Asian country grew slightly (0.4%) to reach a volume of ¤67 billion,
imports declined by 6.6% to around ¤73.4 billion. German exports to China takes
up 44% of total exports to the Asia-Pacific region, and about 6.1% of Germany’s
total exports worldwide. After France and Netherlands, China is Germany’s 3rd
biggest trading partner.
German imports from Japan (-11%) and South Korea (-5.6%) experienced
significant declines. Imports from these countries have been suffering a setback
since many years, the reason for this being i.A. the shifting of the Japanese and
Korean production centres to Southeast Asia and eastern Europe. German exports
in the case of Korea developed positively by posting a growth of 8.1% (¤14.5
billion), while those to Japan remained at somewhat the previous year’s level of
¤17.1 billion.
The (adverse) economic situation in India had an impact on the two-way trade
0 300 600 900 1200 1500
Germany
Belgium
UK
Netherlands
Italy
France
Spain
Sweden
Poland
Finland
1,227
1,032
953
676
570
525
287
146
98
90
(` billion)
India’s main trading partners within the EU Total: 6,294 billion
Source: Ministry of Commerce & Industry, Govt. of India
Germany’s trade with the Asia-Pacific countries1): Top Ten (in ¤ mil.)
Country German Imports (January-December)
% change Country German Exports (January-December)
% change
2013 2012 2013 2012
1. China 73,377 78,529 -6.6 China 67,025 66,746 0.4
2. Japan 19,497 21,910 -11.0 Japan 17,125 17,138 -0.1
3. South Korea 7,987 8,457 -5.6 South Korea 14,481 13,399 8.1
4. India 6,892 7,022 -1.9 India 9,189 10,421 -11.8
5. Taiwan 6,449 6,509 -0.9 Australia 8,626 9,362 -7.9
6. Malaysia 5,649 5,421 4.2 Singapore 6,329 6,550 -3.4
7. Vietnam 5,572 5,123 8.8 Taiwan 5,907 5,791 2.0
8. Singapore 4,803 5,084 -5.5 Hong Kong 5,650 5,937 -4.8
9. Thailand 4,261 4,141 2.9 Malaysia 4,809 4,958 -3.0
10. Indonesia 3,562 3,955 -9.9 Thailand 3,944 4,217 -6.5
Total ASEAN 27,162 26,789 1.4 Total ASEAN 22,074 22,746 -3.0
Total Asia-Pac. 150,301 158,575 -5.2 Total Asia-Pac. 152,275 153,533 -0.8
Total Germany 896,154 906,127 -1.1 Total Germany 1,093,813 1,095,767 -0.2
1) The 27 countries covered under Asia-Pacific region by the OAV include Australia, Bangladesh, Bhutan, Brunei, Cambodia, China, Hong Kong, Indonesia, India, Japan, Laos, Macau, Malaysia, Mon-golia, Myanmar, Nepal, New Zealand, North Korea, Papua New Guinea, Philippines, Singapore, South Korea, Sri Lanka, Taiwan, Thailand, Timor Leste and Vietnam. Source: OAV
0 30000 60000 90000 120000 150000
China
Japan
South Korea
India
Australia
Taiwan
Singapore
Malaysia
Thailand
Vietnam
140,402
36,622
22,468
16,081
12,356
11,146
11,132
10,458
8,205
7,422
Germany’s main trading partners in the Asia-Pacific Region Total: in ¤302,576 million
(¤ million)
Source: OAV - German Asia-Pacific Business Association
(Table 11)
Table 11
41Indo-German Trade
Annual Review
2014
between the two countries resulting in a lower trade volume. German exports to
the subcontinent fell about 11.8% to ¤9.2 billion. In the same way, imports from
India too decreased - however, the decline of 1.9% was comparatively less than
in the case of German exports to the country. India, with a trade volume of ¤16.1
billion in 2013 is Germany’s fourth largest trading partner in the region.
A mixed picture is presented by Germany’s trade with the other south Asian
countries: while the exports to the large economies of the region like Vietnam
(-5.2%), Indonesia (-2.4%), Singapore (-3.4%), Thailand (-6.5%) and Malaysia
(-3.0%) posted a decline, countries like Cambodia (+26.2%), Myanmar (+20.6%)
and the Philippines (+12.9%) (which do not feature in the top ten) bought more
German goods in 2013. On the import side, growth was registered in the case of
Cambodia (+25.3%), Philippines (+2.6%) and Myanmar (+24.9%), albeit at a lower
level. German imports from Thailand (+2.9%) and Malaysia (+4.2%) also grew
last year, however those from Singapore (-5.5%) and Indonesia (-9.9%) declined
substantially. The share of ASEAN in Germany’s foreign trade is about 16.3%, while
Germany’s share in world trade is about 2.5%.
The top ten trading partners for Germany in the Asia-Pacific region are: China,
Japan, South Korea, India, Taiwan, Australia, Singapore, Malaysia, Thailand and
Vietnam. These countries together accounted for more than 91% of Germany’s
trade with the entire Asia-Pacific region.
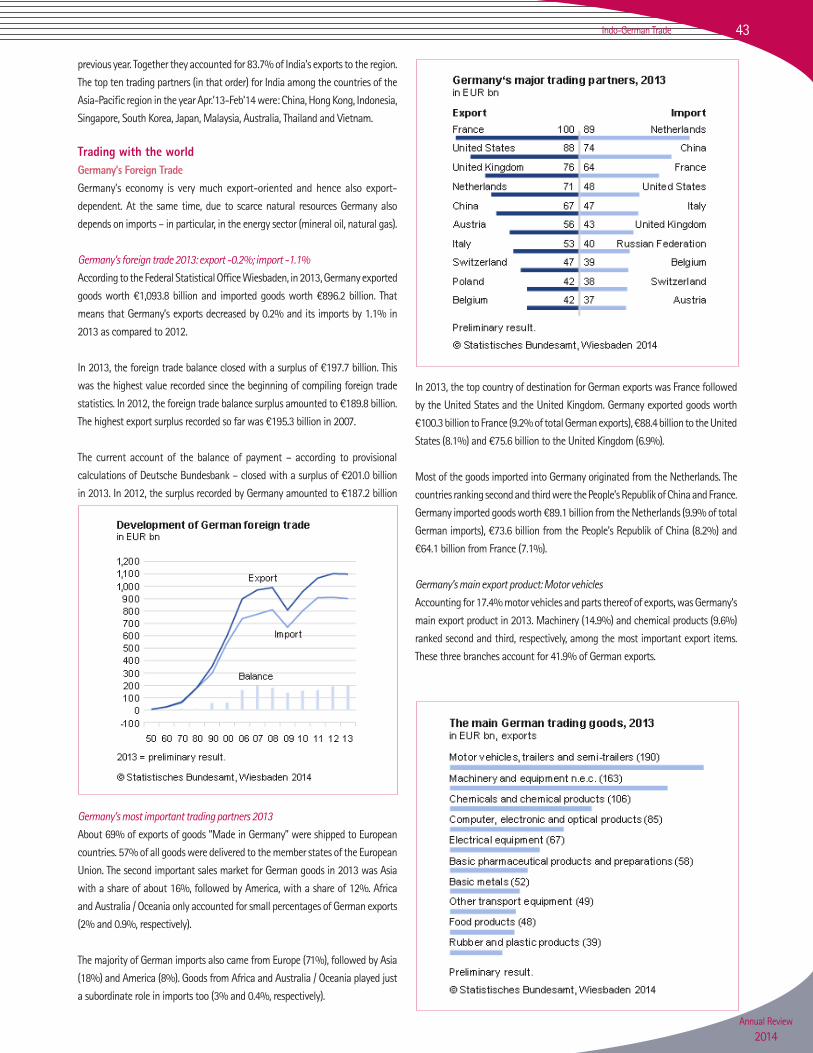
India’s trade with the Asia-Pacific countries Over 38% of the goods imported by India from the Asia-Pacific region (total: Rs.
8,060,529 million) came from China during the year Apr.’13-Feb’14, which made
it the largest supplier for India. Imports from the Asian country grew 8.8% during
the last fiscal. Next, and with a substantial gap, was Indonesia (11.3% share),
followed by South Korea with a 9.3% share. Indian imports from these countries
grew 12% and 5.5% respectively. Australia and Japan were the 4th and 5th largest
exporters to India with a share of 7.6% and 7.1%, which was less than in the last
year with the countries posting a decline of 14.4% and 15.2% respectively in their
exports to India. Australia, which was at no.5 during Apr.’12-Mar.’13, improved its
position and dispatched 14.4% more goods to India in the last fiscal to become
no.4, pushing Japan lower from position no.4 to no.5. The countries of the top ten
in the list of top supplier countries to India, which account for 94% of Indian goods
imported from the Asia-Pacific region, remained the same as in the previous year.
Indian exports to the Asia-Pacific countries amounted to Rs.5,536,280 million,
whereby exports to nearly all the top ten countries saw substantial growths. China
was the biggest buyer of Indian goods with a 16.4% share (+23.2%) beating
Singapore at the top position in the previous year. Hong Kong was at the second
position with a 14% share, posting a growth of 15.5%. Singapore was the third
most important country for Indian exports with a share of 13.6%, growing only
about 2%. At no.4 and no.5 were Japan and Bangladesh, absorbing 7.5% and 6.7%
of Indian exports to the region. Noteworthy is the growth in exports to Vietnam
(+54.2%) due to which Vietnam catapulted from the 10th position to the 6th among
the top ten buyers of Indian goods from the Asian region during the last fiscal. The
composition of the top ten buyers for India in Asia remained the same as in the
India’s trade with the Asia-Pacific countries*: Top Ten (in mil.)
Country Indian Imports (Apr.’13-Mar’14)
% change over previous year
% share* Country Indian Exports(Apr.’13-Mar’14)
% change over previous year
% share*
1. China 3,093,152 8.8 38.4 China 905,928 23.2 16.4
2. Indonesia 906,983 12 11.3 Hong Kong 772,582 15.5 14.0
3. South Korea 752,876 5.5 9.3 Singapore 754,822 2.0 13.6
4. Australia 609,774 -14.4 7.6 Japan 412,636 24.2 7.5
5. Japan 572,971 -15.2 7.1 Bangladesh 372,257 33.0 6.7
6. Malaysia 557,910 2.9 6.9 Vietnam 332,427 54.2 6.0
7. Hong Kong 441,698 2.7 5.5 Indonesia 296,729 2.3 5.4
8. Singapore 411,312 1.0 5.1 Sri Lanka 277,875 28.1 5.0
9. Thailand 325,067 11.7 4.0 South Korea 254,447 11.3 4.6
10. Taiwan 243,937 13.1 3.0 Malaysia 254,077 5.2 4.6
Total ASEAN 2,516,463 6.0 31.2 Total ASEAN 2,010,264 12.1 36.3
Total Asia-Pacific 8,060,529 2.1 - Total Asia-Pacific 5,536,280 16.5 -
Total Worldwide 27,173,596 1.8 - Total Worldwide 18,997,302 16.2 -
% share of India’s total imports/exports from/to the Asia-Pacific region.
0 500 1000 1500 2000 2500 3000 3500 4000
China
Hong Kong
Indonesia
Singapore
South Korea
Japan
Malaysia
Australia
Thailand
Vietnam
1,214
1,204
1,166
1,007
986
812
749
550
488
3,999
India’s main trading partners in the Asia-Pacific region Total: 13,5957 billion
billion
Source: Ministry of Commerce & Industry, Govt. of India
(Table 12)
Table 12
Source: Ministry of Commerce & Industry, Govt. of India
43Indo-German Trade
Annual Review
2014
previous year. Together they accounted for 83.7% of India’s exports to the region.
The top ten trading partners (in that order) for India among the countries of the
Asia-Pacific region in the year Apr.’13-Feb’14 were: China, Hong Kong, Indonesia,
Singapore, South Korea, Japan, Malaysia, Australia, Thailand and Vietnam.
Trading with the worldGermany’s Foreign TradeGermany’s economy is very much export-oriented and hence also export-
dependent. At the same time, due to scarce natural resources Germany also
depends on imports – in particular, in the energy sector (mineral oil, natural gas).
Germany’s foreign trade 2013: export -0.2%; import -1.1% According to the Federal Statistical Office Wiesbaden, in 2013, Germany exported
goods worth ¤1,093.8 billion and imported goods worth ¤896.2 billion. That
means that Germany’s exports decreased by 0.2% and its imports by 1.1% in
2013 as compared to 2012.
In 2013, the foreign trade balance closed with a surplus of ¤197.7 billion. This
was the highest value recorded since the beginning of compiling foreign trade
statistics. In 2012, the foreign trade balance surplus amounted to ¤189.8 billion.
The highest export surplus recorded so far was ¤195.3 billion in 2007.
The current account of the balance of payment – according to provisional
calculations of Deutsche Bundesbank – closed with a surplus of ¤201.0 billion
in 2013. In 2012, the surplus recorded by Germany amounted to ¤187.2 billion
Germany’s most important trading partners 2013About 69% of exports of goods “Made in Germany” were shipped to European
countries. 57% of all goods were delivered to the member states of the European
Union. The second important sales market for German goods in 2013 was Asia
with a share of about 16%, followed by America, with a share of 12%. Africa
and Australia / Oceania only accounted for small percentages of German exports
(2% and 0.9%, respectively).
The majority of German imports also came from Europe (71%), followed by Asia
(18%) and America (8%). Goods from Africa and Australia / Oceania played just
a subordinate role in imports too (3% and 0.4%, respectively).
In 2013, the top country of destination for German exports was France followed
by the United States and the United Kingdom. Germany exported goods worth
¤100.3 billion to France (9.2% of total German exports), ¤88.4 billion to the United
States (8.1%) and ¤75.6 billion to the United Kingdom (6.9%).
Most of the goods imported into Germany originated from the Netherlands. The
countries ranking second and third were the People’s Republik of China and France.
Germany imported goods worth ¤89.1 billion from the Netherlands (9.9% of total
German imports), ¤73.6 billion from the People’s Republik of China (8.2%) and
¤64.1 billion from France (7.1%).
Germany’s main export product: Motor vehiclesAccounting for 17.4% motor vehicles and parts thereof of exports, was Germany’s
main export product in 2013. Machinery (14.9%) and chemical products (9.6%)
ranked second and third, respectively, among the most important export items.
These three branches account for 41.9% of German exports.
45Indo-German Trade
Annual Review
2014
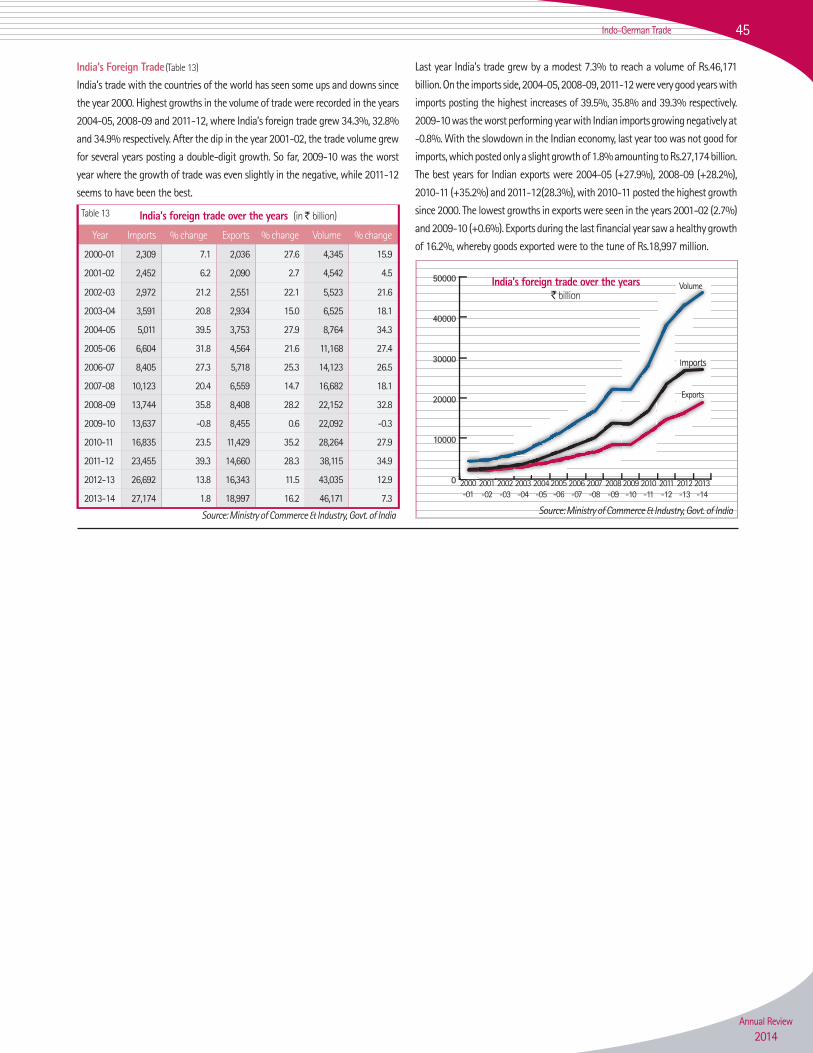
India’s Foreign Trade India’s trade with the countries of the world has seen some ups and downs since
the year 2000. Highest growths in the volume of trade were recorded in the years
2004-05, 2008-09 and 2011-12, where India’s foreign trade grew 34.3%, 32.8%
and 34.9% respectively. After the dip in the year 2001-02, the trade volume grew
for several years posting a double-digit growth. So far, 2009-10 was the worst
year where the growth of trade was even slightly in the negative, while 2011-12
seems to have been the best.
India’s foreign trade over the years (in billion)
Year Imports % change Exports % change Volume % change
2000-01 2,309 7.1 2,036 27.6 4,345 15.9
2001-02 2,452 6.2 2,090 2.7 4,542 4.5
2002-03 2,972 21.2 2,551 22.1 5,523 21.6
2003-04 3,591 20.8 2,934 15.0 6,525 18.1
2004-05 5,011 39.5 3,753 27.9 8,764 34.3
2005-06 6,604 31.8 4,564 21.6 11,168 27.4
2006-07 8,405 27.3 5,718 25.3 14,123 26.5
2007-08 10,123 20.4 6,559 14.7 16,682 18.1
2008-09 13,744 35.8 8,408 28.2 22,152 32.8
2009-10 13,637 -0.8 8,455 0.6 22,092 -0.3
2010-11 16,835 23.5 11,429 35.2 28,264 27.9
2011-12 23,455 39.3 14,660 28.3 38,115 34.9
2012-13 26,692 13.8 16,343 11.5 43,035 12.9
2013-14 27,174 1.8 18,997 16.2 46,171 7.3
Last year India’s trade grew by a modest 7.3% to reach a volume of Rs.46,171
billion. On the imports side, 2004-05, 2008-09, 2011-12 were very good years with
imports posting the highest increases of 39.5%, 35.8% and 39.3% respectively.
2009-10 was the worst performing year with Indian imports growing negatively at
-0.8%. With the slowdown in the Indian economy, last year too was not good for
imports, which posted only a slight growth of 1.8% amounting to Rs.27,174 billion.
The best years for Indian exports were 2004-05 (+27.9%), 2008-09 (+28.2%),
2010-11 (+35.2%) and 2011-12(28.3%), with 2010-11 posted the highest growth
since 2000. The lowest growths in exports were seen in the years 2001-02 (2.7%)
and 2009-10 (+0.6%). Exports during the last financial year saw a healthy growth
of 16.2%, whereby goods exported were to the tune of Rs.18,997 million.
0
10000
20000
30000
40000
50000
2000-01
2001-02
2002-03
2003-04
2004-05
2005-06
2006-07
2007-08
2008-09
2009-10
2010-11
2011-12
2012-13
2013-14
Imports
Exports
VolumeIndia’s foreign trade over the years billion
Source: Ministry of Commerce & Industry, Govt. of India Source: Ministry of Commerce & Industry, Govt. of India
(Table 13)
Table 13