bilingual project 1 st d 2014-2015. unit a 1. why do we study geography?why do we study geography?...
TRANSCRIPT

BILINGUAL PROJECTBILINGUAL PROJECT11ST ST DD
2014-20152014-2015
UNIT A
1. Why do we study Geography?2. What's Geography?3. Our Planet: the Earth4. The Solar System5. Earth in motion6. Why the seasons?7. Orientation8. Maps9. Tables, Charts, Diagrams

1. WHY?
Geo-litteracy.pdfby Canadian Council for Geographic Education
2. WHAT?
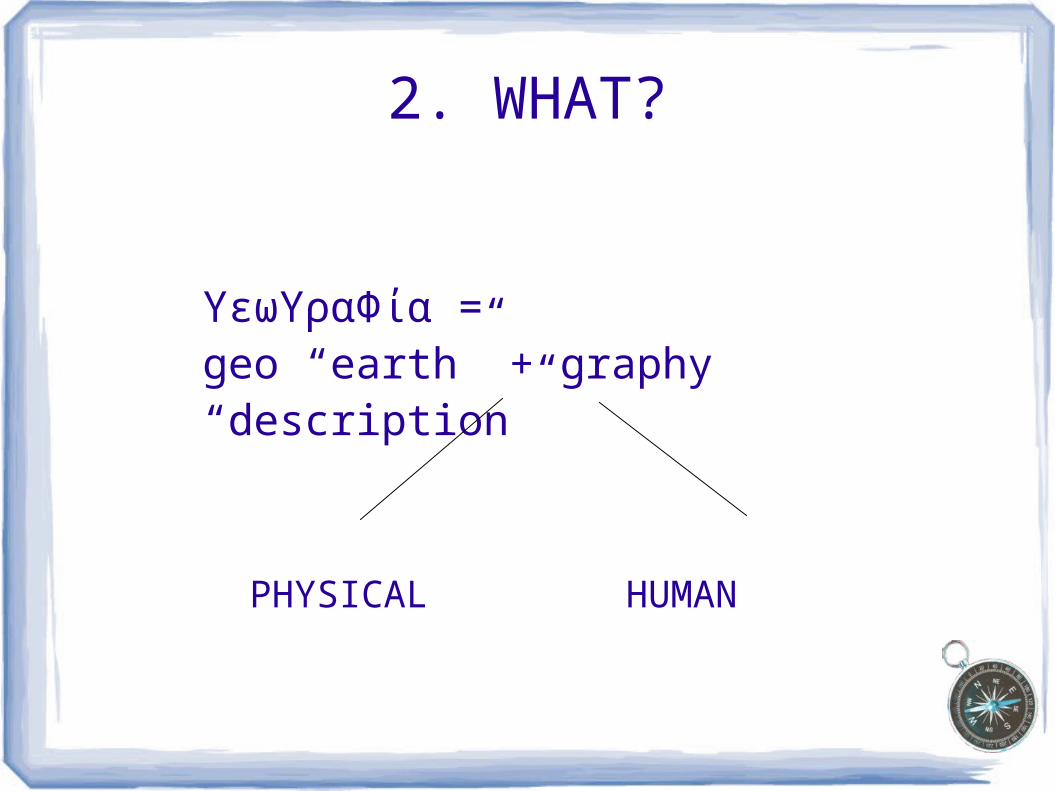
ϒεωϒραΦία =geo “earth” + graphy “description”
PHYSICAL HUMAN

2. WHAT
Physical Geography
Earth's surface: mountains, planes, deserts
Water: rivers, lakes, oceans.
Climate: weather conditions, temperature, rainfall
Life: animals, plants
Astronomy

2. WHAT?Human Geography
Population: numbers and distribuition
Settlement: cities, metropols, villages
Politics: states, provinces, etc
Languages and Cultures
Economy: agriculture, industry, etc
Communication: means of transport, telecommunication
Now Excercise!Book, page 4
Ph: physical; H: human

3. THE EARTH
It's a SPHERE
It's a planet of the SOLAR SYSTEM

3. THE EARTH
•A GLOBE lightly flattened at the Poles
•An imaginary line runs
in the middle: the
Equator.

Equator divides Earth in 2 hemispheres:
Northern hemisphere
Southern hemisphere
3. THE EARTH

3. THE EARTH
NUMBERS AND FIGURES
Total Surface= 510 million Km2
Water= 71%, Land= 29%
Equator= 40.000 Km
Excercises
BooK, Page 5, n.1

4. SOLAR SYSTEM
4. SOLAR SYSTEM
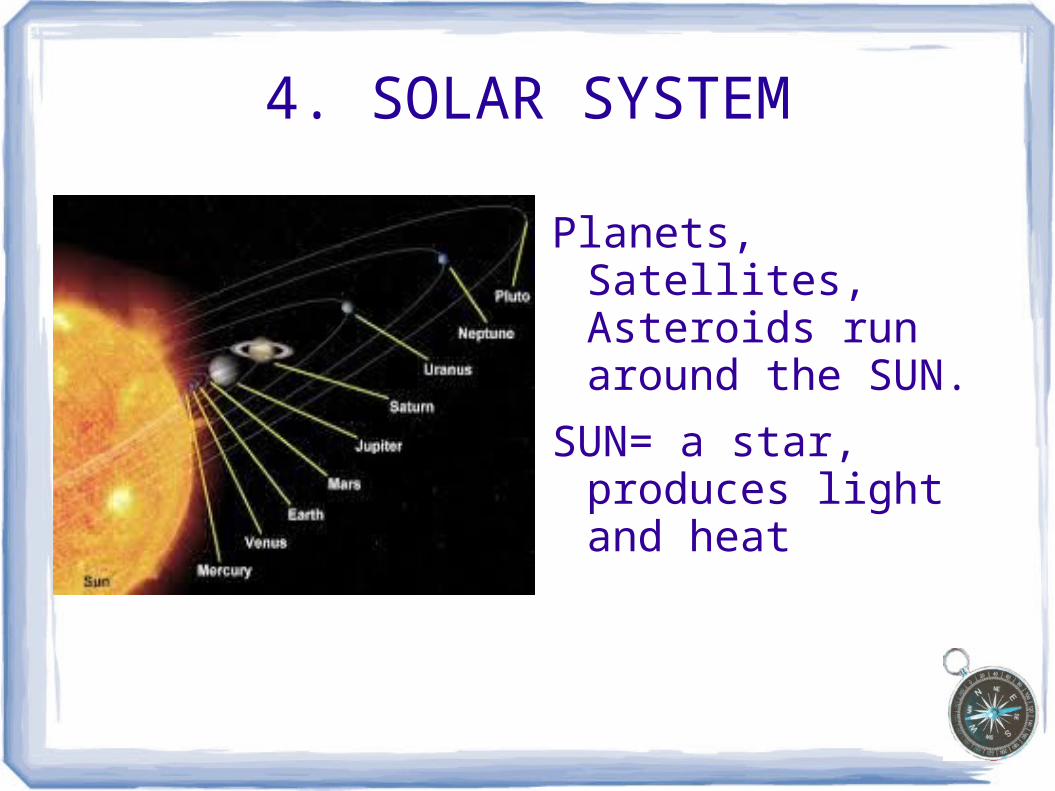
Planets, Satellites, Asteroids run around the SUN.
SUN= a star, produces light and heat

4. SOLAR SYSTEM
The Solar System is in
MILKY WAY GALAXY
4. SOLAR SYSTEM
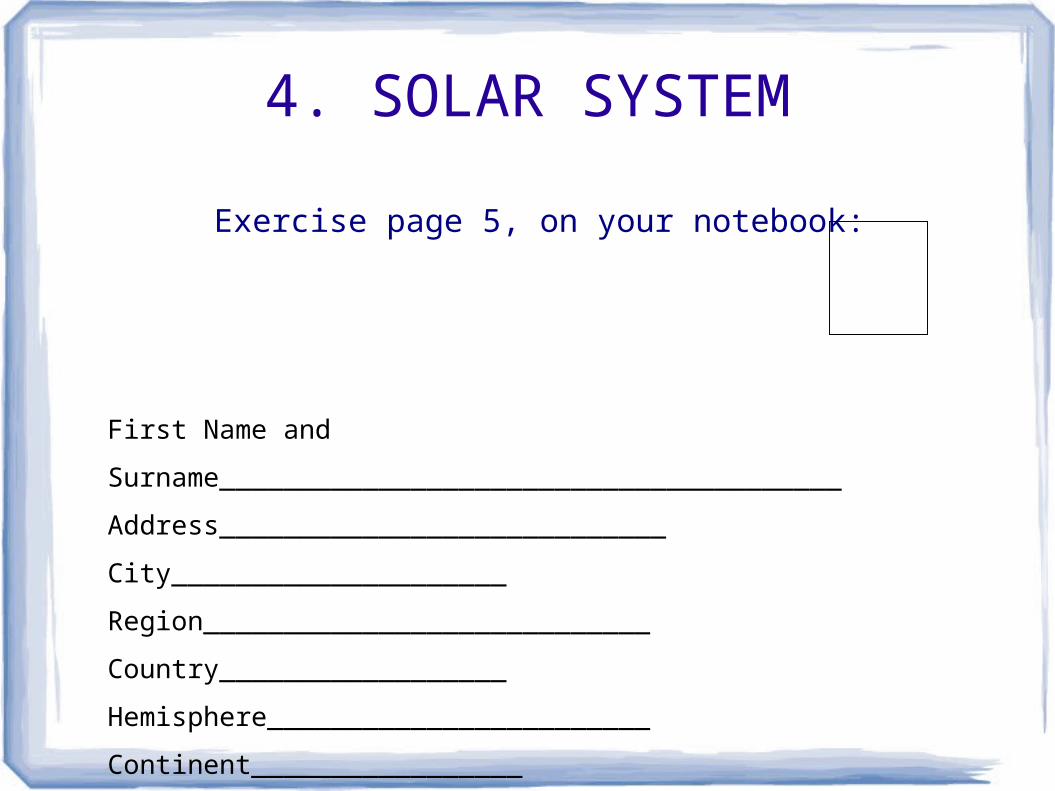
Exercise page 5, on your notebook:
First Name and Surname_______________________________________
Address____________________________
City_____________________
Region____________________________ Country__________________
Hemisphere________________________ Continent_________________
Planet___________________________ System____________________
Galaxy_________________________________
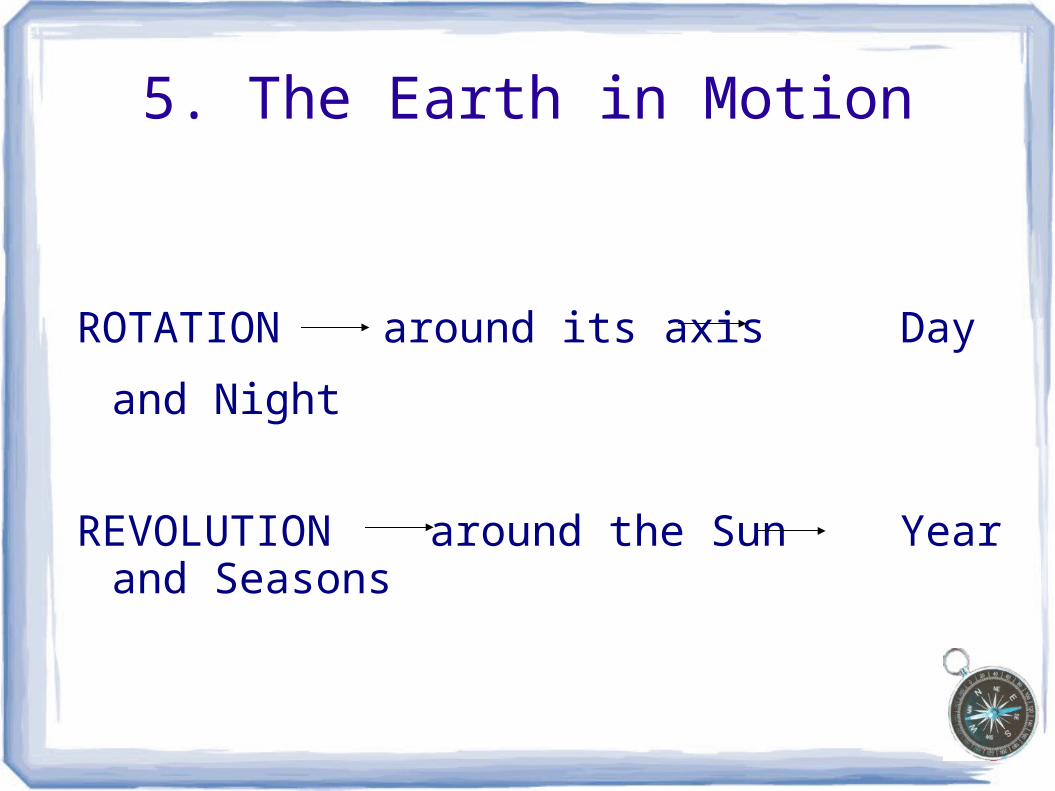
5. The Earth in Motion
ROTATION around its axis Day and Night
REVOLUTION around the Sun Year and Seasons

5. The Earth in Motion
Eppur si muove!(Galileo Galilei)
The Earth moves:
see the video

5. The Earth in Motion
Exercise page 6: Day and Night
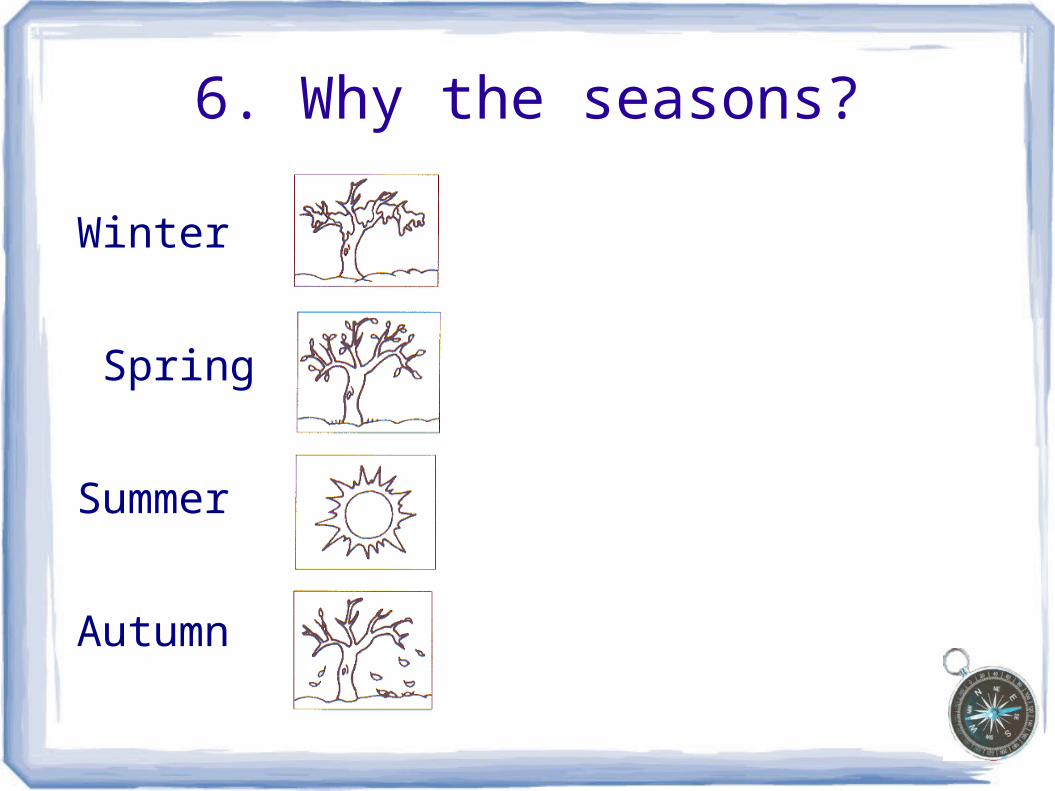
6. Why the seasons?
Winter
Spring
Summer
Autumn
6. Why the seasons?

6. Why the seasons

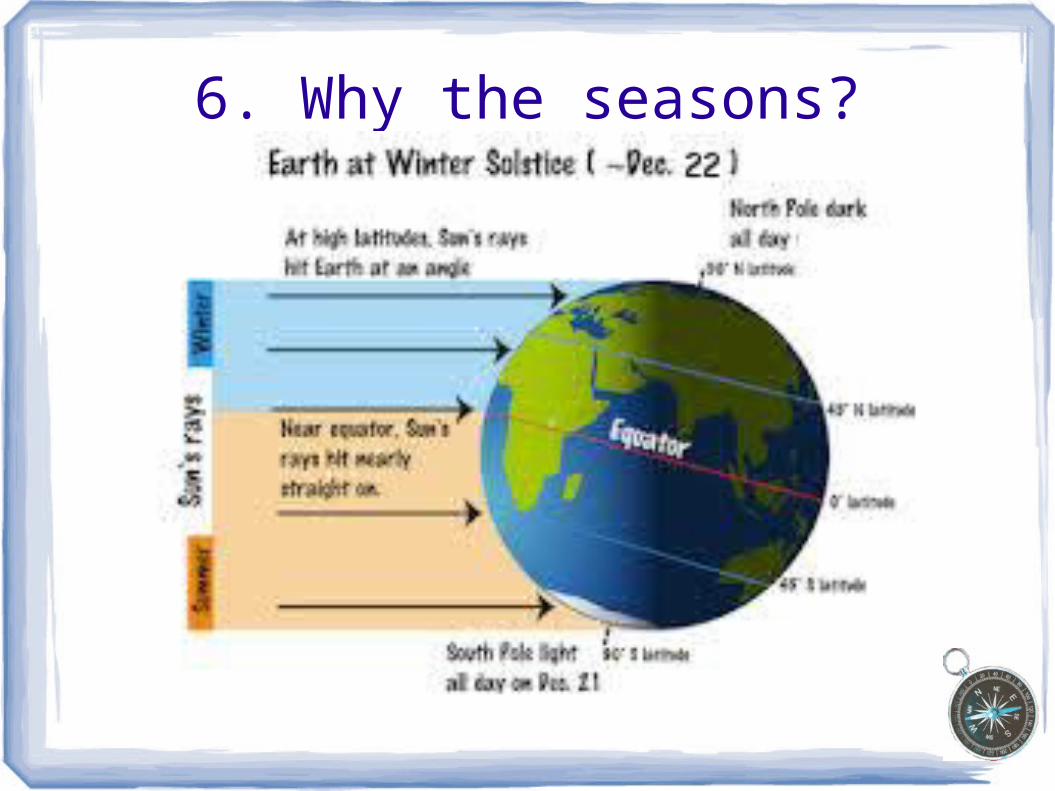
6. Why the seasons?
EQUINOXsame duration of day and night:Spring Equinox, 21st March, Autumn Equinox, 23rd September
SOLSTICESummer Solstice, 21st June: longest dayWinter Solstice 22nd December: longest night

6. Why the seasons?
Exercise page 6: winter and summer
Exercise page 7: Solstice and Equinox

7. ORIENTATION
How can we find direction?
7. ORIENTATION
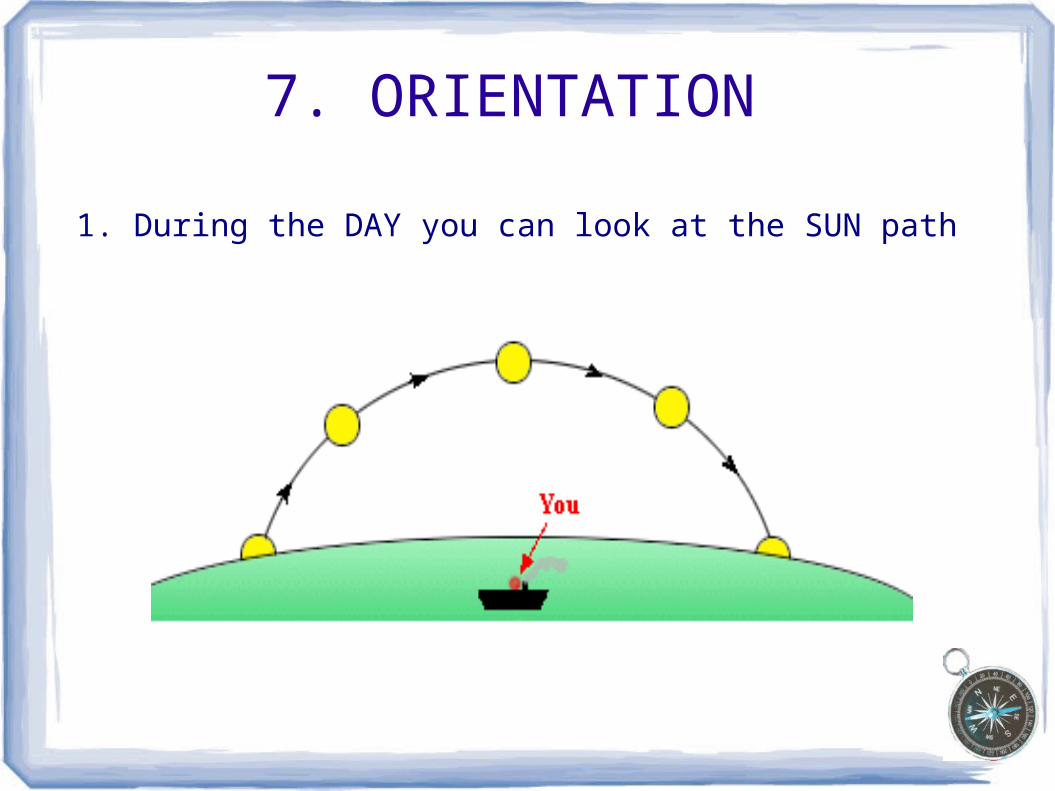
1. During the DAY you can look at the SUN path

7. ORIENTATION
East: sunrise
South: at 12:00, mid-day, top.
West: sunset
7. ORIENTATION
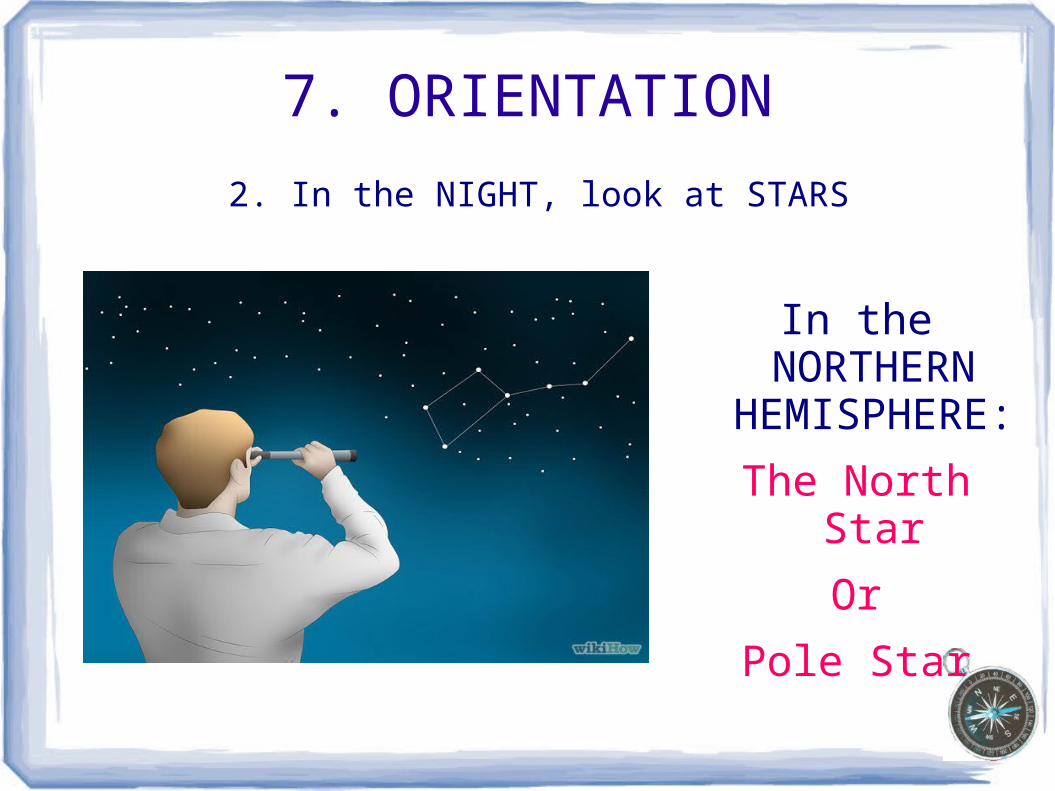
2. In the NIGHT, look at STARS
In the NORTHERN
HEMISPHERE:
The North Star
Or
Pole Star

7. ORIENTATION
So you have found:
THE CARDINAL POINTS
NORTH, EAST, WEST, SOUTH

7. ORIENTATION
3. Use a COMPASS:
has a magnetised needle which always points towards the Earth's magnetic North Pole.

7. ORIENTATION
Longitude and Latitude:
See file PDF
8. Maps
First see the video:
Maps

8. Maps
In geography, MAPS are one of the most important tools.
MAPS = pictures of the Earth's surface.

8. MapsThe Earth is too big to stay in a MAP
SCALE = each map has a "scale" which indicates the relationship between a certain distance on the map and the distance on the ground.
Ratio or Representative Fraction (RF) = indicates how many units on the earth's surface is equal to one unit on the map. Exemple: 1:100,000 - one centimeter on the map equals 100,000 centimeters (1 kilometer)
A graphic scale = it is a line marked with distance on the ground which the map user can use along with a ruler to determine scale on the map.

8. Maps
TYPES OF MAPS
Physical Map: shows the physical landscape features of a place.
Political Map: does not show any topographic features. It instead focuses solely on the state and national boundaries of a place.
Thematic Map: focuses on a particular theme or special topic. An example of a thematic map would be one showing the population change of Canada in specific locations from 1996 to 2001.

8. MapsTYPES OF MAPS
Political MapPhysical Map
Thematic Map

9. Table, Charts, Diagrams
To organize DATA
You can use:
1. TABLES:
Data are distributed in columns and rows
North Centre South
Population

9. Table, Charts, Diagrams
2. Graphs
2.1 Line graph: used to indicate a trend in a period of time
Row 1 Row 2 Row 3 Row 40
2
4
6
8
10
12
Column 1
Column 2
Column 3

9. Table, Charts, Diagrams
2.2 Bar Chart: compares data.
Row 1 Row 2 Row 3 Row 40
2
4
6
8
10
12
Column 1
Column 2
Column 3
9. Table, Charts, Diagrams
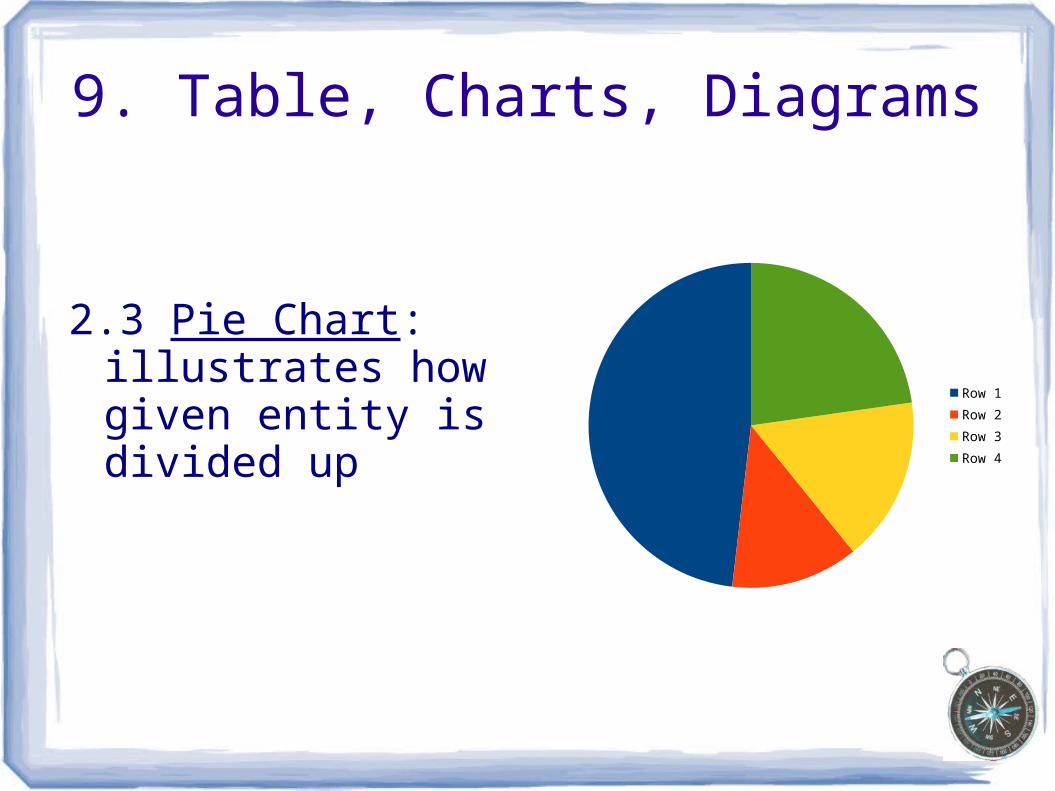
2.3 Pie Chart: illustrates how given entity is divided up
Row 1
Row 2
Row 3
Row 4

THE END OF“THE ABC OF GEOGRAPHY”
PRESENTATION