bilkent university teachigng and learning support …
TRANSCRIPT

BTLSC Annual Report, 2020 1
BILKENT UNIVERSITY
TEACHIGNG AND LEARNING SUPPORT CENTER
(BTLSC)
ANNUAL REPORT
2020
by
Dr. DUYGU ALBAYRAK
March 2021

BTLSC Annual Report, 2020 2
TABLE OF CONTENTS
TABLE OF CONTENTS ..................................................................................................2
LIST OF TABLES ............................................................................................................3
LIST OF FIGURES ..........................................................................................................3
1 BTLSC’s Services in 2020 ...........................................................................................4
1.1 Student Services ....................................................................................................4 1.1.1 Tutoring .........................................................................................................5
1.1.2 Seminars ........................................................................................................9 1.2 Faculty Services ..................................................................................................12
2 2019 Services vs 2020 Services .................................................................................20
2.1 Student Services ..................................................................................................20
2.2 Faculty Services ..................................................................................................24
3 Future Plans ................................................................................................................24
Appendices ......................................................................................................................26
A. Weekly Schedules of Tutoring Sessions ................................................................26 B. Example of Online Questionnaire for Tutoring Sessions.......................................27 C. Example of Online Questionnaire for Faculty Seminar .........................................29
BTLSC Annual Report, 2020 3
LIST OF TABLES
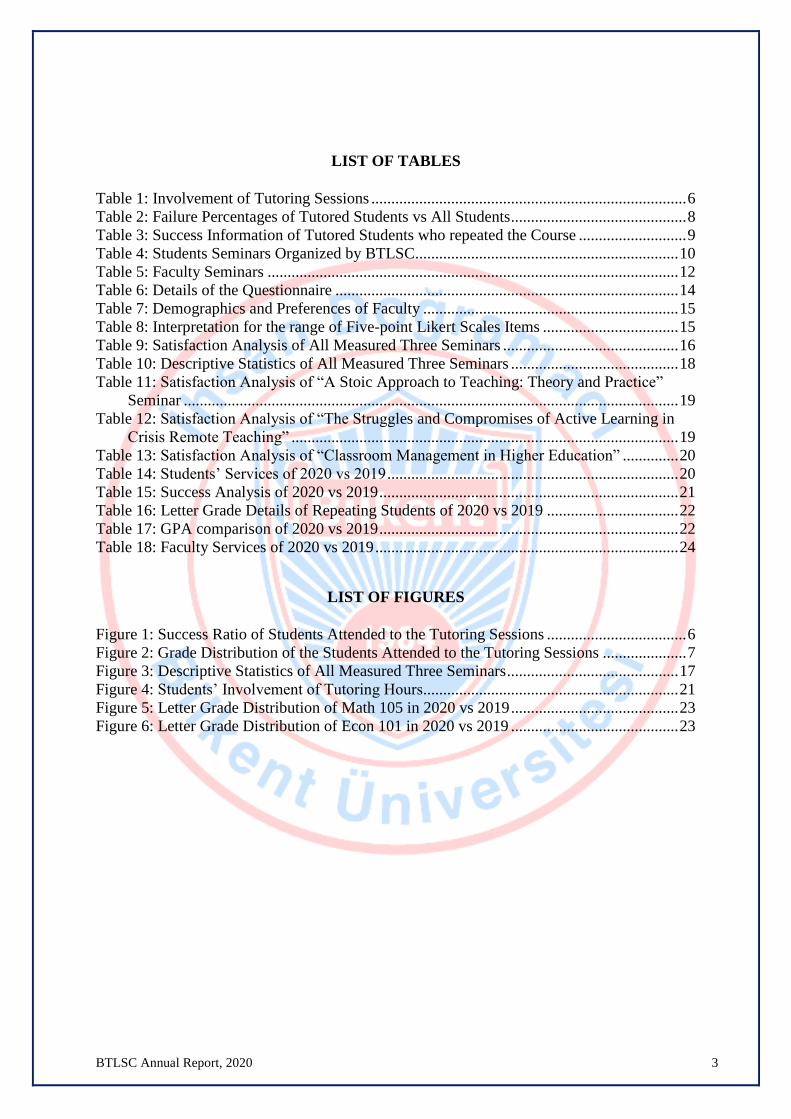
Table 1: Involvement of Tutoring Sessions ............................................................................... 6 Table 2: Failure Percentages of Tutored Students vs All Students ............................................ 8
Table 3: Success Information of Tutored Students who repeated the Course ........................... 9 Table 4: Students Seminars Organized by BTLSC.................................................................. 10 Table 5: Faculty Seminars ....................................................................................................... 12 Table 6: Details of the Questionnaire ...................................................................................... 14 Table 7: Demographics and Preferences of Faculty ................................................................ 15
Table 8: Interpretation for the range of Five-point Likert Scales Items .................................. 15 Table 9: Satisfaction Analysis of All Measured Three Seminars ............................................ 16
Table 10: Descriptive Statistics of All Measured Three Seminars .......................................... 18 Table 11: Satisfaction Analysis of “A Stoic Approach to Teaching: Theory and Practice”
Seminar ............................................................................................................................ 19 Table 12: Satisfaction Analysis of “The Struggles and Compromises of Active Learning in
Crisis Remote Teaching” ................................................................................................. 19 Table 13: Satisfaction Analysis of “Classroom Management in Higher Education” .............. 20 Table 14: Students’ Services of 2020 vs 2019 ......................................................................... 20
Table 15: Success Analysis of 2020 vs 2019 ........................................................................... 21 Table 16: Letter Grade Details of Repeating Students of 2020 vs 2019 ................................. 22
Table 17: GPA comparison of 2020 vs 2019 ........................................................................... 22 Table 18: Faculty Services of 2020 vs 2019 ............................................................................ 24
LIST OF FIGURES
Figure 1: Success Ratio of Students Attended to the Tutoring Sessions ................................... 6 Figure 2: Grade Distribution of the Students Attended to the Tutoring Sessions ..................... 7
Figure 3: Descriptive Statistics of All Measured Three Seminars ........................................... 17
Figure 4: Students’ Involvement of Tutoring Hours................................................................ 21 Figure 5: Letter Grade Distribution of Math 105 in 2020 vs 2019 .......................................... 23
Figure 6: Letter Grade Distribution of Econ 101 in 2020 vs 2019 .......................................... 23

BTLSC Annual Report, 2020 4
Annual Report 2020 of Bilkent Teaching and Learning Support Center
Bilkent University Teaching Learning and Support Center (BTLSC) was established in
January 2019. The center’s mission is to further the educational mission of the university and
inspire excellence in teaching and learning. BTLSC strives to achieve its mission by
providing systematic support for the teaching and learning needs of Bilkent Community.
This annual report aims to summarize the center’s activities conducted in the calendar year
2020, to compare these activities with the ones performed in 2019, and to further provide
future plans of the center. The organization of the report is as follows: Section 1 summarizes
the activities of BTLSC in 2020. Section 1.1 presents the services provided to the Bilkent
University students and Section 1.2 provides BTLSC services for the faculty of Bilkent
University. Comparison of the services provided in 2019 and 2020 is summarized in Section
2. Future Plans of BTLSC for 2021 is provided in Section 3.
1 BTLSC’s Services in 2020
The outbreak of Corona Virus Disease 2019 (COVID-19) in various countries during spring
2019-2020 semester transferred traditional face-to-face teaching to online education
platforms, which directly has affected the way of providing services in higher education. As a
result, in 2020 BTLSC started to offer all of its services as online services.
We define a service as an activity where a person participates only once in a BTLSC offering,
providing a measure of the overall volume of activity. Except for tutoring services, if an
individual participates to BTLSC seminars more than once, this participation is counted as
multiple services.
1.1 Student Services
BTLSC aims to guide students to learn how to learn, and to develop specific set of
metacognitive skills, attitudes and behaviors that allow students to understand, create,
evaluate, apply, and construct their own knowledge. To support development of these skills,
BTLSC provided several online peer tutoring and seminars in 2020 for students.

BTLSC Annual Report, 2020 5
1.1.1 Tutoring
Due to Covid 19, peer tutoring hours were arranged as online for Math 103, Math 105, Math
106, Econ 101 and Econ 102 courses. In 2020, Math 106 and Econ 102 tutoring services were
started upon the request of Prof. Dr. Ülkü Gürler, the Dean of Faculty of Business
Administration.
Tutors were selected by the course coordinators from the previous semester’s successful
students. Except for Math 103, course coordinators had executive control over the forms of
support they permit tutors to offer students. Tutors, in general, worked with group of students
to help them master the skills needed to succeed on their own by coaching rather than
providing answers. Tutors discussed and identified course concepts & problem sets. The
tutors also prepared students for the upcoming exams.
For all courses, departments informed and encouraged students to attend tutoring sessions
and BTLCS also sent an e-mail and informed unsuccessful students about tutoring sessions
who took the course more than once. Weekly schedules of tutoring sessions are presented in
Appendix A.
Student Involvement Analysis
The descriptive statistics for involvement in tutoring sessions are presented in Table 1
according to the course. The involvement data demonstrated that student’s involvement in
both Math 105, Math 106, Econ 101 and Econ 102 tutoring sessions were capturing similar
and a considerable amount of their time. Students’ attendance in Math 103 tutoring sessions
were too low. This results is similar to the previous semester students’ attendance
measurement.

BTLSC Annual Report, 2020 6
Table 1: Involvement of Tutoring Sessions
Course # of Students Max Participation (%)
Math 103: Thinking Mathematically I 2 9.09
Math 105: Introduction to Calculus I 34 100.00
Math 106: Introduction to Calculus II 15 45.45
Econ 101: Introduction to Economics I 39 27.27
Econ 102: Introduction to Economics II 13 36.36
Total 103
Another result of student’s involvement data showed that the students, especially for Econ
101 and Econ 102 courses, preferred to attend to the tutor sessions if the students had an
exam. Thus, as compared to the other periods, the students’ involvements in tutoring sessions
are higher prior to the exams.
Students Success Analysis
Figure 1 presents the success ratio of the students involved in tutoring sessions according to
the course. According to the students’ letter grades, majority of the students, enrolled in the
tutoring sessions of Econ 101 (94.9%, n = 37), Econ 102 (92.3%, n =1 2), Math 105 (97.1%,
n= 33), Math 106 (86.7%, n = 13) and Math 103 (100%, n = 1) passed from the course.
Moreover, 80.2% of the tutored students got letter grades equal or higher than C (see Figure
1).
Figure 1: Success Ratio of Students Attended to the Tutoring Sessions

BTLSC Annual Report, 2020 7
The letter grade distributions of the students attended to the tutoring sessions are presented in Figure 2 according to the course.
Figure 2: Grade Distribution of the Students Attended to the Tutoring Sessions

BTLSC Annual Report, 2020 8
Table 2 presents GPA and failing percentage of both tutored and all students in Fall 2020-
2021 semester. Among the students involved in the tutoring sessions, Econ 101 students are
the most successful ones, while Math 106 students are the least successful. In all courses,
GPA of tutored students are higher than that of all students, while failing percentage of
tutored students is less than that of all students. Maximum difference of GPA (0.67) and
failing percentage (20.31%) between tutored and all students is in Econ 102, while minimum
difference (GPA =.0.24, & Failing percentage = 8.60%) is observed in Math 106. Minimum
failure percentage (2.94%) is in Math 105 in which the tutored students have the highest and
regular attendance to the online tutoring hours.
Table 2: Failure Percentages of Tutored Students vs All Students
Courses
GPA Failure Percentage (%)
Math 105 Tutored Students 2.54 2.94
All Students 2.21 17.70
Math 106 Tutored Students 2.16 13.40
All Students 1.92 22.00
Econ 101 Tutored Students 2.98 5.21
All Students 2.72 15.30
Econ 102 Tutored Students 2.23 7.69
All Students 1.56 28.00
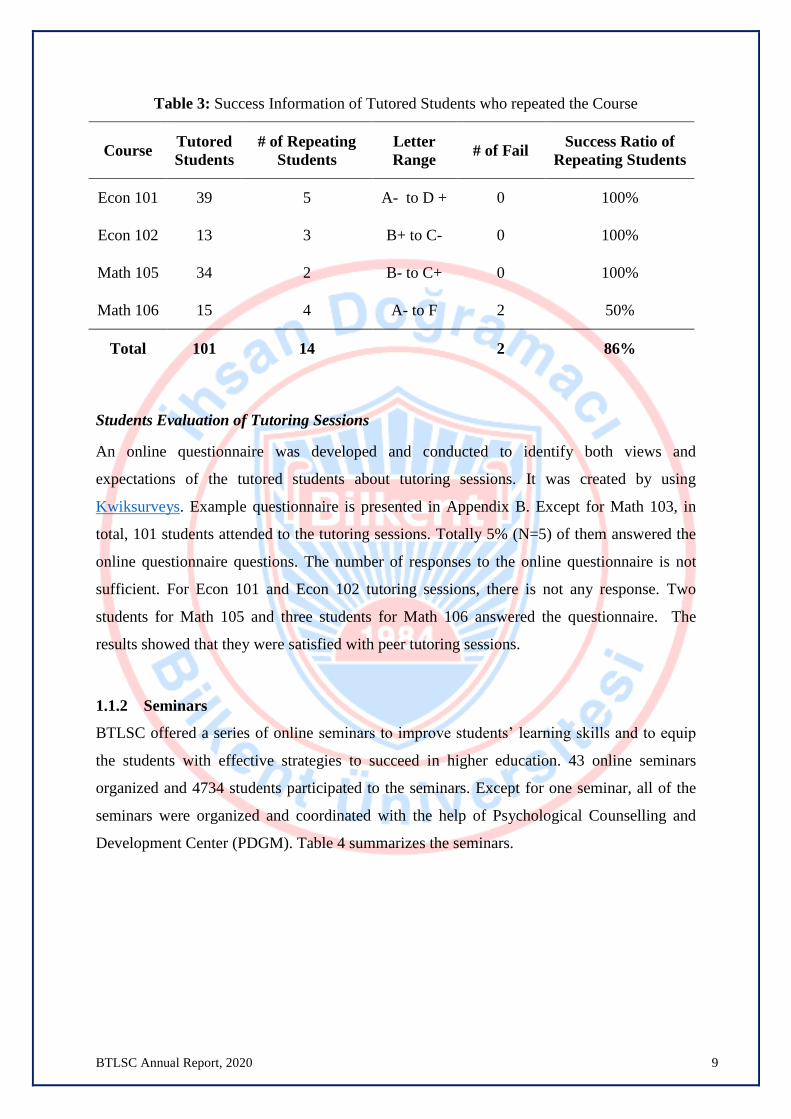
Table 3 presents success percentage of students who are repeating the course. Except for
Math 106, all students who are repeating the courses passed from the courses. 86% of those
students passed the course and 71% of them got a grade equal or higher than C.
BTLSC Annual Report, 2020 9
Table 3: Success Information of Tutored Students who repeated the Course
Course Tutored
Students
# of Repeating
Students
Letter
Range # of Fail
Success Ratio of
Repeating Students
Econ 101 39 5 A- to D + 0 100%
Econ 102 13 3 B+ to C- 0 100%
Math 105 34 2 B- to C+ 0 100%
Math 106 15 4 A- to F 2 50%
Total 101 14 2 86%
Students Evaluation of Tutoring Sessions
An online questionnaire was developed and conducted to identify both views and
expectations of the tutored students about tutoring sessions. It was created by using
Kwiksurveys. Example questionnaire is presented in Appendix B. Except for Math 103, in
total, 101 students attended to the tutoring sessions. Totally 5% (N=5) of them answered the
online questionnaire questions. The number of responses to the online questionnaire is not
sufficient. For Econ 101 and Econ 102 tutoring sessions, there is not any response. Two
students for Math 105 and three students for Math 106 answered the questionnaire. The
results showed that they were satisfied with peer tutoring sessions.
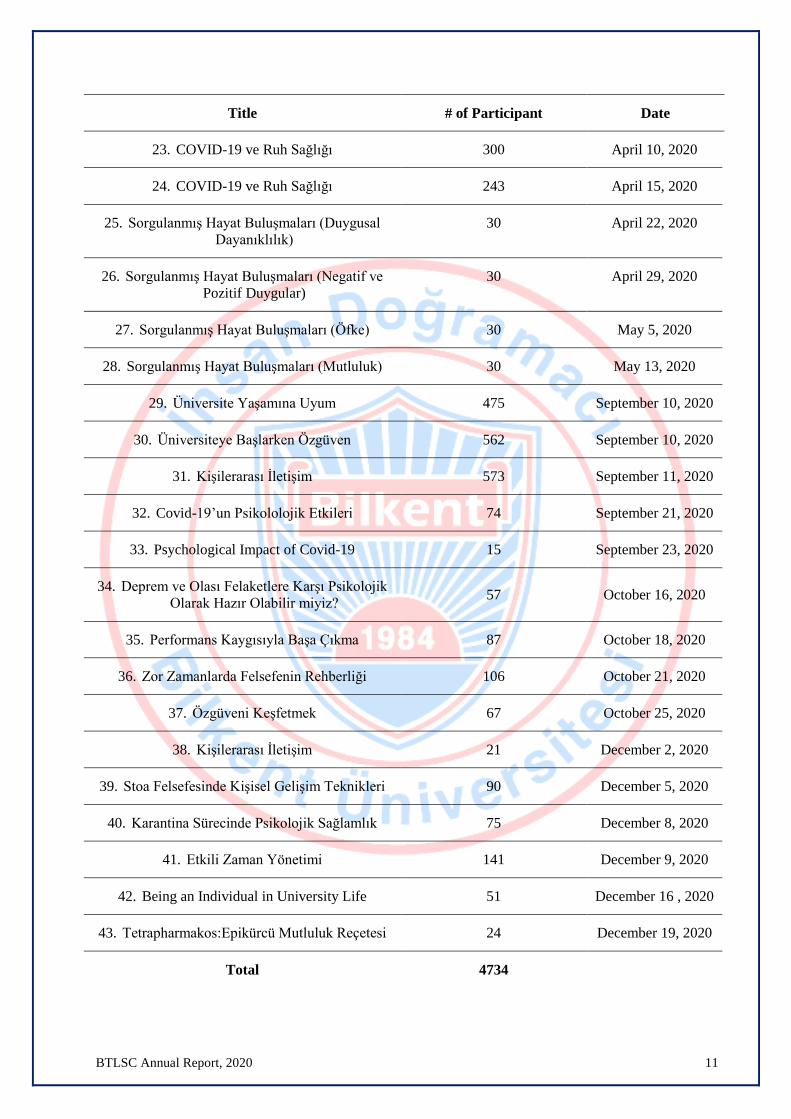
1.1.2 Seminars
BTLSC offered a series of online seminars to improve students’ learning skills and to equip
the students with effective strategies to succeed in higher education. 43 online seminars
organized and 4734 students participated to the seminars. Except for one seminar, all of the
seminars were organized and coordinated with the help of Psychological Counselling and
Development Center (PDGM). Table 4 summarizes the seminars.

BTLSC Annual Report, 2020 10
Table 4: Students Seminars Organized by PDGM Under the Coordination of BTLSC
Title # of Participant Date
1. Erteleme 12 January 6, 2020
2. Felsefe Üstüne Sunumlar 170 January 31, 2020
3. Felsefe Üstüne Sunumlar 162 February 7, 2020
4. Felsefe Üstüne Sunumlar 175 February 10, 2020
5. Felsefe Üstüne Sunumlar 164 February 14, 2020
6. Felsefe Üstüne Sunumlar 158 February 21, 2020
7. Motivasyon ve zaman yönetimi 17 February 24, 2020
8. Motivasyon ve zaman yönetimi 18 February 24, 2020
9. Motivasyon ve zaman yönetimi 12 February 26, 2020
10. Motivasyon ve zaman yönetimi 16 March 2, 2020
11. Sınav Kaygısı 16 March 2, 2020
12. Motivasyon ve zaman yönetimi 14 March 4, 2020
13. Sınav Kaygısı 9 March 2, 2020
14. Sınav Kaygısı 11 March 4, 2020
15. Stresle Başa Çıkma ve Öfke Kontrolü 12 March 5, 2020
16. Stresle Başa Çıkma ve Öfke Kontrolü 15 March 6, 2020
17. Sınav Kaygısı 14 March 9, 2020
18. Erteleme 41 March 10, 2020
19. Kişilerarası İletişim 15 March 12, 2020
20. Koranavirüs Günlerinde Felsefenin Rehberliği
(Türkçe) 252 April 1, 2020
21. Koranavirüs Günlerinde Felsefenin Rehberliği
(İngilizce) 50 April 2, 2020
22. Koranavirüs Günlerinde Felsefenin Rehberliği
(Türkçe)
300 April 8, 2020
BTLSC Annual Report, 2020 11
Title # of Participant Date
23. COVID-19 ve Ruh Sağlığı 300 April 10, 2020
24. COVID-19 ve Ruh Sağlığı 243 April 15, 2020
25. Sorgulanmış Hayat Buluşmaları (Duygusal
Dayanıklılık)
30 April 22, 2020
26. Sorgulanmış Hayat Buluşmaları (Negatif ve
Pozitif Duygular)
30 April 29, 2020
27. Sorgulanmış Hayat Buluşmaları (Öfke) 30 May 5, 2020
28. Sorgulanmış Hayat Buluşmaları (Mutluluk) 30 May 13, 2020
29. Üniversite Yaşamına Uyum 475 September 10, 2020
30. Üniversiteye Başlarken Özgüven 562 September 10, 2020
31. Kişilerarası İletişim 573 September 11, 2020
32. Covid-19’un Psikololojik Etkileri 74 September 21, 2020
33. Psychological Impact of Covid-19 15 September 23, 2020
34. Deprem ve Olası Felaketlere Karşı Psikolojik
Olarak Hazır Olabilir miyiz? 57 October 16, 2020
35. Performans Kaygısıyla Başa Çıkma 87 October 18, 2020
36. Zor Zamanlarda Felsefenin Rehberliği 106 October 21, 2020
37. Özgüveni Keşfetmek 67 October 25, 2020
38. Kişilerarası İletişim 21 December 2, 2020
39. Stoa Felsefesinde Kişisel Gelişim Teknikleri 90 December 5, 2020
40. Karantina Sürecinde Psikolojik Sağlamlık 75 December 8, 2020
41. Etkili Zaman Yönetimi 141 December 9, 2020
42. Being an Individual in University Life 51 December 16 , 2020
43. Tetrapharmakos:Epikürcü Mutluluk Reçetesi 24 December 19, 2020
Total 4734

BTLSC Annual Report, 2020 12
1.2 Faculty Services
BTLSC offered a series of online seminars and workshops in various aspects of higher
education teaching and learning to support continual development of teaching and learning to
faculty. These seminars bring instructors together to share ideas across disciplines. They also
help instructors develop and improve their teaching skills, expand their repertoire of teaching
methods, and gain new perspectives on teaching at Bilkent. Guest presenters from both
Bilkent and other universities have conducted online seminars. The seminars and workshop
subjects can be categorized as:
student engagement and interaction
course design that promotes active learning and critical thinking
use of educational technologies, such as zoom, course management systems (Moodle)
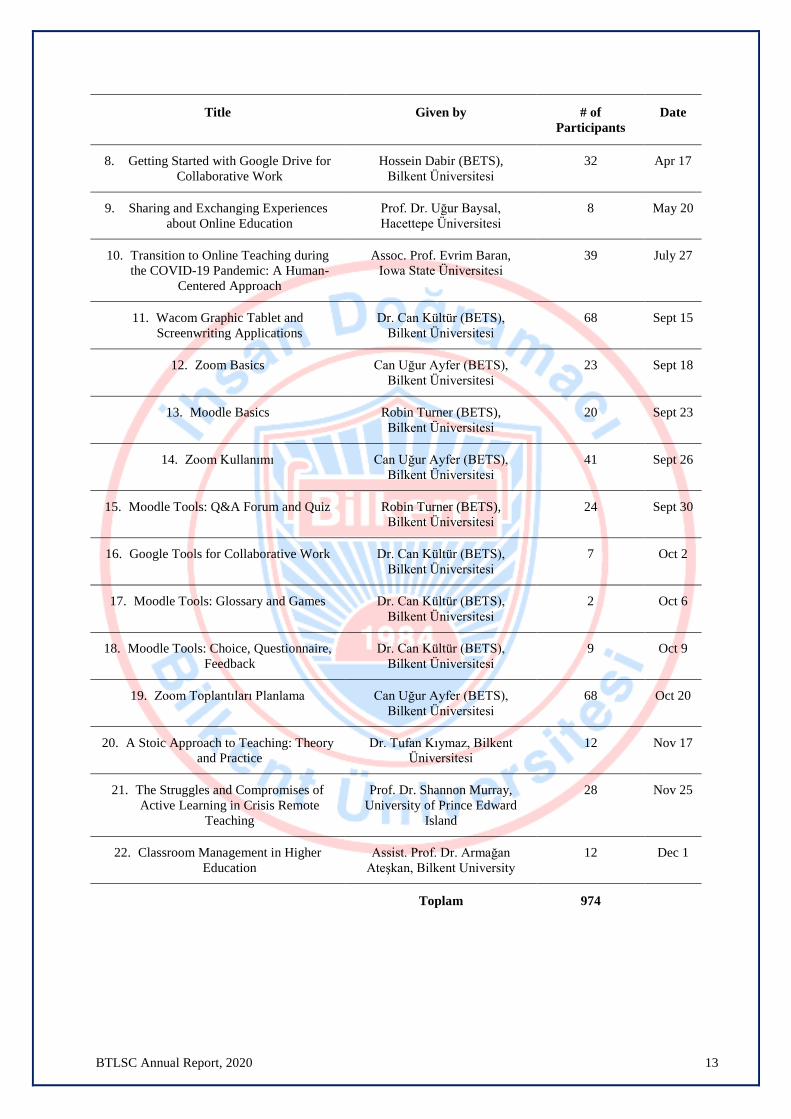
68.2% (n = 15) of the seminars were organized and coordinated with the help of Bilkent
University Educational Technology Support (BETS) about the technology utilization. In total,
974 faculty members were participated to the seminars given in 2020. Only one seminar was
face to face, and 21 seminars were given online. Table 5 summarizes the seminars organized
by BTLSC and BETS.
Table 5: Faculty Seminars
Title Given by # of
Participants
Date
1. How to increase student involvement in
the classroom?
Jamel Ben Chafra 18 Feb 19
2. Zoom Basics Can Uğur Ayfer (BETS),
Bilkent Üniversitesi
118 Apr 2
3. Moodle Tools Q&A Forum and Quiz Robin Turner (BETS),
Bilkent Üniversitesi
153 Apr 8
4. A Student Response System: Socrative Aysen Sayan (BETS),
Bilkent Üniversitesi
143 Apr 10
5. Zoom Poll and Breakout Rooms Can Uğur Ayfer &
Reyyan Ayfer (BETS),
Bilkent Üniversitesi
82 Apr 13
6. A Digital Toolbox: Edpuzzle Şule Şener (BETS),
Bilkent Üniversitesi
21 Apr 15
7. Cooperative Learning Techniques Asst. Prof. Erdem Aksoy,
TED Üniversitesi
46 Apr 16
BTLSC Annual Report, 2020 13
Title Given by # of
Participants
Date
8. Getting Started with Google Drive for
Collaborative Work
Hossein Dabir (BETS),
Bilkent Üniversitesi
32 Apr 17
9. Sharing and Exchanging Experiences
about Online Education
Prof. Dr. Uğur Baysal,
Hacettepe Üniversitesi
8 May 20
10. Transition to Online Teaching during
the COVID-19 Pandemic: A Human-
Centered Approach
Assoc. Prof. Evrim Baran,
Iowa State Üniversitesi
39 July 27
11. Wacom Graphic Tablet and
Screenwriting Applications
Dr. Can Kültür (BETS),
Bilkent Üniversitesi
68 Sept 15
12. Zoom Basics Can Uğur Ayfer (BETS),
Bilkent Üniversitesi
23 Sept 18
13. Moodle Basics Robin Turner (BETS),
Bilkent Üniversitesi
20 Sept 23
14. Zoom Kullanımı Can Uğur Ayfer (BETS),
Bilkent Üniversitesi
41 Sept 26
15. Moodle Tools: Q&A Forum and Quiz Robin Turner (BETS),
Bilkent Üniversitesi
24 Sept 30
16. Google Tools for Collaborative Work Dr. Can Kültür (BETS),
Bilkent Üniversitesi
7 Oct 2
17. Moodle Tools: Glossary and Games Dr. Can Kültür (BETS),
Bilkent Üniversitesi
2 Oct 6
18. Moodle Tools: Choice, Questionnaire,
Feedback
Dr. Can Kültür (BETS),
Bilkent Üniversitesi
9 Oct 9
19. Zoom Toplantıları Planlama Can Uğur Ayfer (BETS),
Bilkent Üniversitesi
68 Oct 20
20. A Stoic Approach to Teaching: Theory
and Practice
Dr. Tufan Kıymaz, Bilkent
Üniversitesi
12 Nov 17
21. The Struggles and Compromises of
Active Learning in Crisis Remote
Teaching
Prof. Dr. Shannon Murray,
University of Prince Edward
Island
28 Nov 25
22. Classroom Management in Higher
Education
Assist. Prof. Dr. Armağan
Ateşkan, Bilkent University
12 Dec 1
Toplam 974

BTLSC Annual Report, 2020 14
Satisfaction Analysis of Faculty Seminars
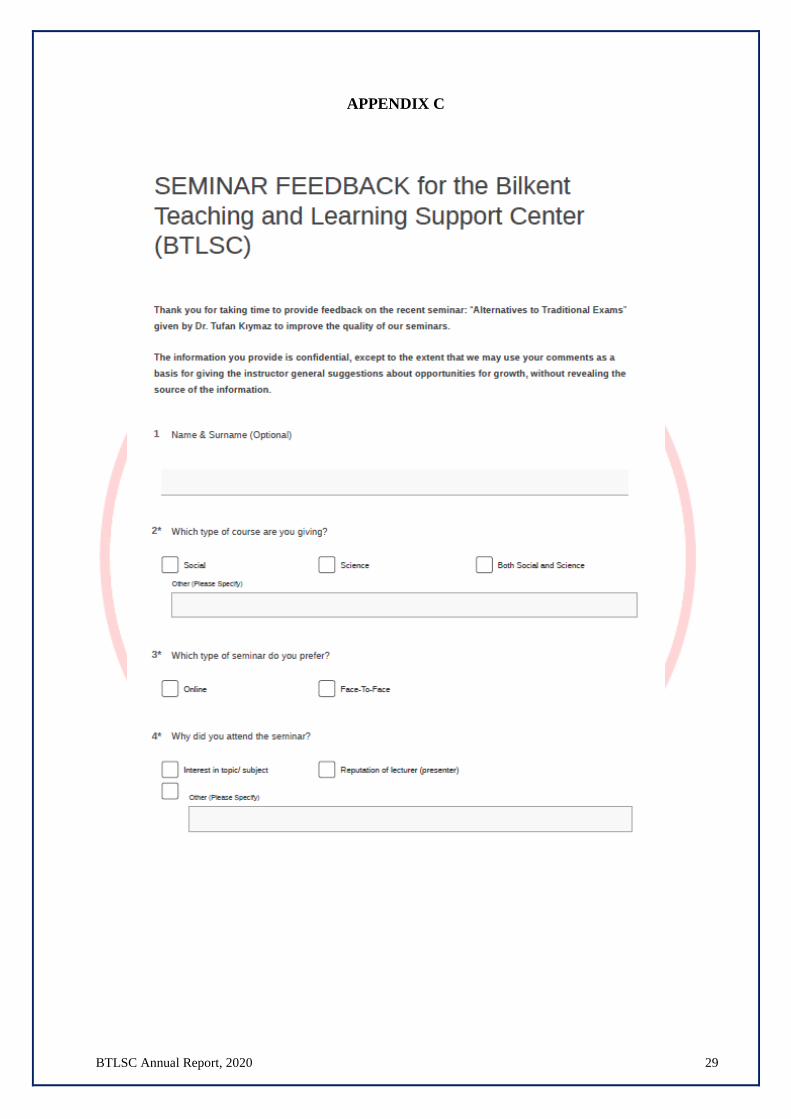
In Faculty Seminars, both quantitative and qualitative data were collected through an online
questionnaire (See Appendix C). All of the seminars were done online. An online form of
questionnaire was created by using Kwiksurveys. The online questionnaire has two new
questions. The questionnaire was distributed via e-mail in the last three seminars which are
1. A Stoic Approach to Teaching: Theory and Practice (SAT) with 13 participants.
2. The Struggles and Compromises of Active Learning in Crisis Remote Teaching
(SCAL) with 26 participants.
3. Classroom Management in Higher Education (CMH) with 12 participants.
In total, 51 faculty members attended to the above listed seminars. Totally 45% (N=23) of
participants answered the online questionnaire questions. Table 6 presents details of the
questionnaire used in the faculty seminars.
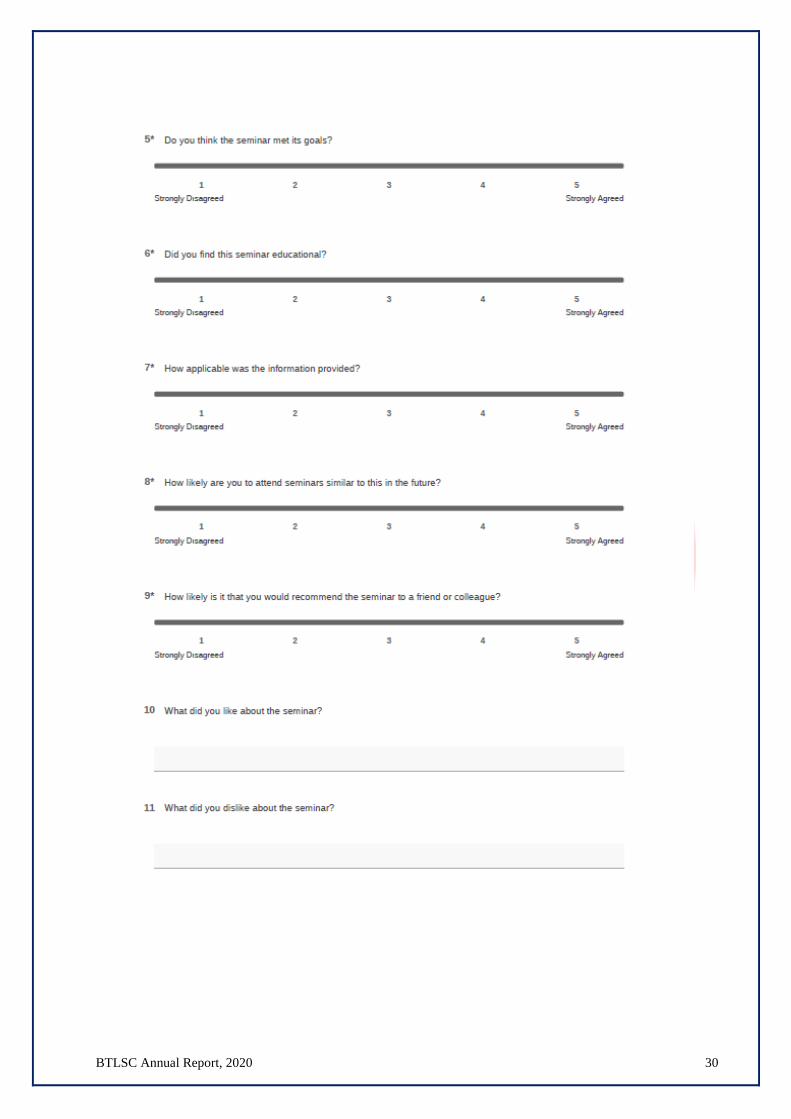
Table 6: Details of the Questionnaire
Data Type Scale Questions Purpose # of
Items
Quantitative Multiple choice 1 to 3
Clarify participants’ aim of attendance
Participants’ preference of the type for
seminar.
Type of course given.
3
Quantitative Five-point Likert 3 to 7 Measure satisfaction 5
Qualitative Open-Ended 8 to 12 Measure satisfaction and needs 6
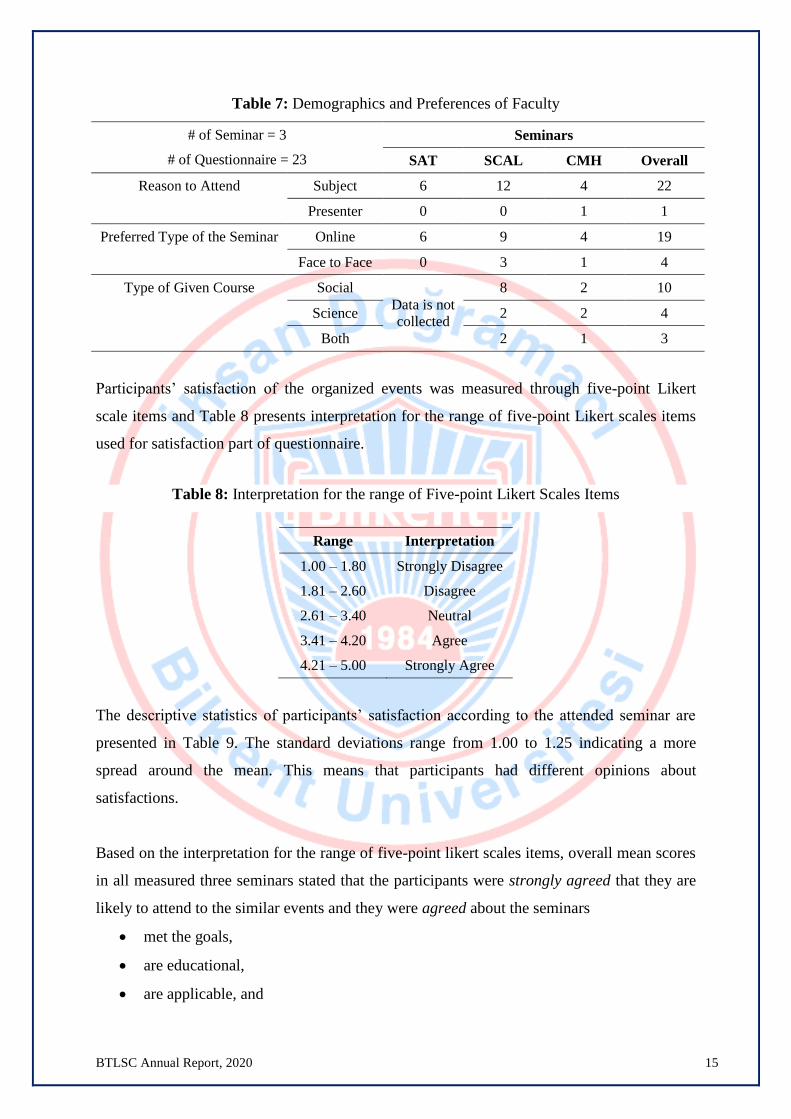
According to the participants of the attended seminar, 95.7% of the faculty preferred and
attended to the seminar due to their interests in the subject. Most of the participants (82.6%)
also preferred online seminars. 58.8% of the participants were teaching social courses while
23.5% of them were teaching science courses. 17.6% of the participants were teaching both
social and science courses. Demographics and preferences of the participants are presented in
Table 7.
BTLSC Annual Report, 2020 15
Table 7: Demographics and Preferences of Faculty
# of Seminar = 3
# of Questionnaire = 23
Seminars
SAT SCAL CMH Overall
Reason to Attend Subject 6 12 4 22
Presenter 0 0 1 1
Preferred Type of the Seminar Online 6 9 4 19
Face to Face 0 3 1 4
Type of Given Course Social
Data is not
collected
8 2 10
Science 2 2 4
Both 2 1 3
Participants’ satisfaction of the organized events was measured through five-point Likert
scale items and Table 8 presents interpretation for the range of five-point Likert scales items
used for satisfaction part of questionnaire.
Table 8: Interpretation for the range of Five-point Likert Scales Items
Range Interpretation
1.00 – 1.80 Strongly Disagree
1.81 – 2.60 Disagree
2.61 – 3.40 Neutral
3.41 – 4.20 Agree
4.21 – 5.00 Strongly Agree
The descriptive statistics of participants’ satisfaction according to the attended seminar are
presented in Table 9. The standard deviations range from 1.00 to 1.25 indicating a more
spread around the mean. This means that participants had different opinions about
satisfactions.
Based on the interpretation for the range of five-point likert scales items, overall mean scores
in all measured three seminars stated that the participants were strongly agreed that they are
likely to attend to the similar events and they were agreed about the seminars
met the goals,
are educational,
are applicable, and
BTLSC Annual Report, 2020 16
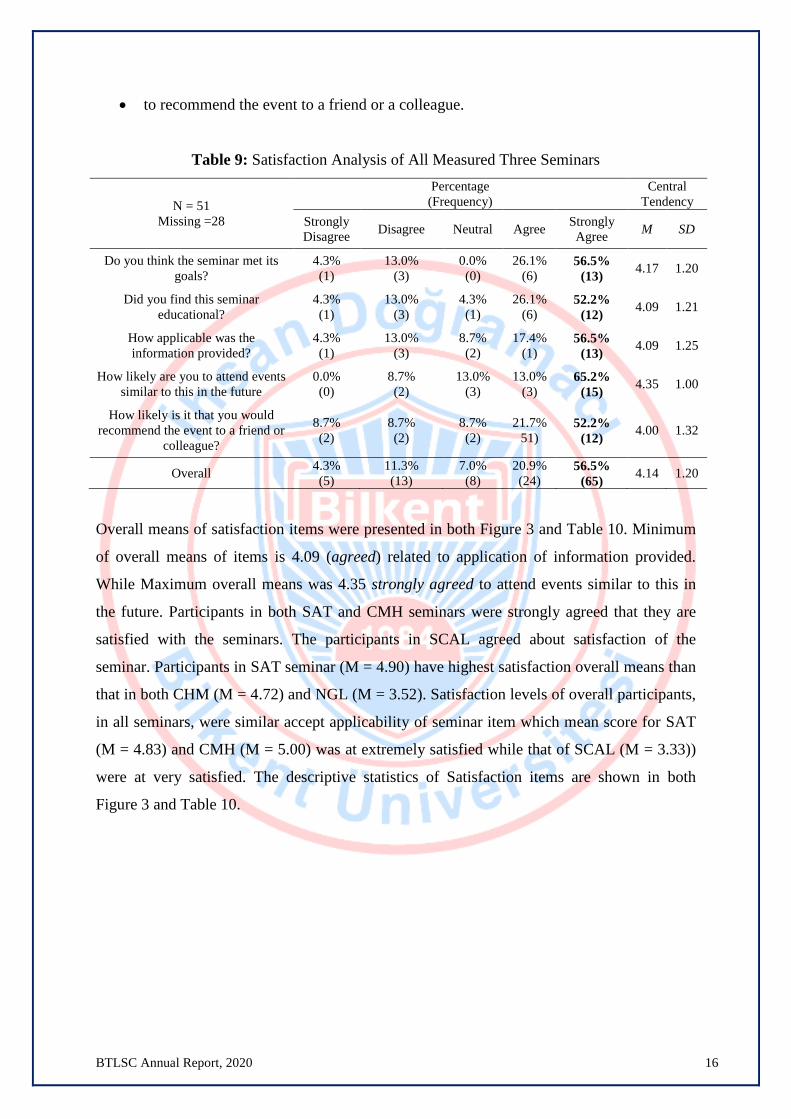
to recommend the event to a friend or a colleague.
Table 9: Satisfaction Analysis of All Measured Three Seminars
N = 51
Missing =28
Percentage
(Frequency)
Central
Tendency
Strongly
Disagree Disagree Neutral Agree
Strongly
Agree M SD
Do you think the seminar met its
goals?
4.3%
(1)
13.0%
(3)
0.0%
(0)
26.1%
(6) 56.5%
(13) 4.17 1.20
Did you find this seminar
educational?
4.3%
(1)
13.0%
(3)
4.3%
(1)
26.1%
(6) 52.2%
(12) 4.09 1.21
How applicable was the
information provided?
4.3%
(1)
13.0%
(3)
8.7%
(2)
17.4%
(1) 56.5%
(13) 4.09 1.25
How likely are you to attend events
similar to this in the future
0.0%
(0)
8.7%
(2)
13.0%
(3)
13.0%
(3) 65.2%
(15) 4.35 1.00
How likely is it that you would
recommend the event to a friend or
colleague?
8.7%
(2)
8.7%
(2)
8.7%
(2)
21.7%
51) 52.2%
(12) 4.00 1.32
Overall 4.3%
(5)
11.3%
(13)
7.0%
(8)
20.9%
(24) 56.5%
(65) 4.14 1.20
Overall means of satisfaction items were presented in both Figure 3 and Table 10. Minimum
of overall means of items is 4.09 (agreed) related to application of information provided.
While Maximum overall means was 4.35 strongly agreed to attend events similar to this in
the future. Participants in both SAT and CMH seminars were strongly agreed that they are
satisfied with the seminars. The participants in SCAL agreed about satisfaction of the
seminar. Participants in SAT seminar (M = 4.90) have highest satisfaction overall means than
that in both CHM (M = 4.72) and NGL (M = 3.52). Satisfaction levels of overall participants,
in all seminars, were similar accept applicability of seminar item which mean score for SAT
(M = 4.83) and CMH (M = 5.00) was at extremely satisfied while that of SCAL (M = 3.33))
were at very satisfied. The descriptive statistics of Satisfaction items are shown in both
Figure 3 and Table 10.

BTLSC Annual Report, 2020 17
Figure 3: Descriptive Statistics of All Measured Three Seminars
BTLSC Annual Report, 2020 18
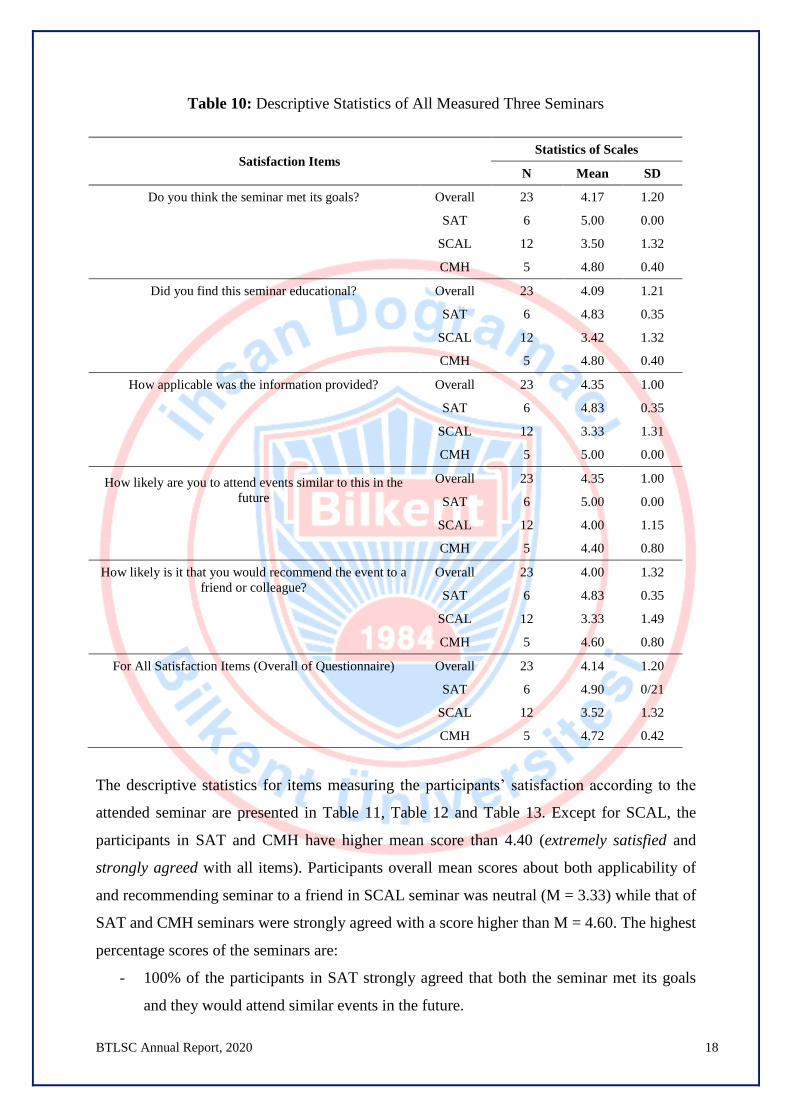
Table 10: Descriptive Statistics of All Measured Three Seminars
Satisfaction Items Statistics of Scales
N Mean SD
Do you think the seminar met its goals? Overall 23 4.17 1.20
SAT 6 5.00 0.00
SCAL 12 3.50 1.32
CMH 5 4.80 0.40
Did you find this seminar educational? Overall 23 4.09 1.21
SAT 6 4.83 0.35
SCAL 12 3.42 1.32
CMH 5 4.80 0.40
How applicable was the information provided? Overall 23 4.35 1.00
SAT 6 4.83 0.35
SCAL 12 3.33 1.31
CMH 5 5.00 0.00
How likely are you to attend events similar to this in the
future
Overall 23 4.35 1.00
SAT 6 5.00 0.00
SCAL 12 4.00 1.15
CMH 5 4.40 0.80
How likely is it that you would recommend the event to a
friend or colleague?
Overall 23 4.00 1.32
SAT 6 4.83 0.35
SCAL 12 3.33 1.49
CMH 5 4.60 0.80
For All Satisfaction Items (Overall of Questionnaire) Overall 23 4.14 1.20
SAT 6 4.90 0/21
SCAL 12 3.52 1.32
CMH 5 4.72 0.42
The descriptive statistics for items measuring the participants’ satisfaction according to the
attended seminar are presented in Table 11, Table 12 and Table 13. Except for SCAL, the
participants in SAT and CMH have higher mean score than 4.40 (extremely satisfied and
strongly agreed with all items). Participants overall mean scores about both applicability of
and recommending seminar to a friend in SCAL seminar was neutral (M = 3.33) while that of
SAT and CMH seminars were strongly agreed with a score higher than M = 4.60. The highest
percentage scores of the seminars are:
- 100% of the participants in SAT strongly agreed that both the seminar met its goals
and they would attend similar events in the future.
BTLSC Annual Report, 2020 19
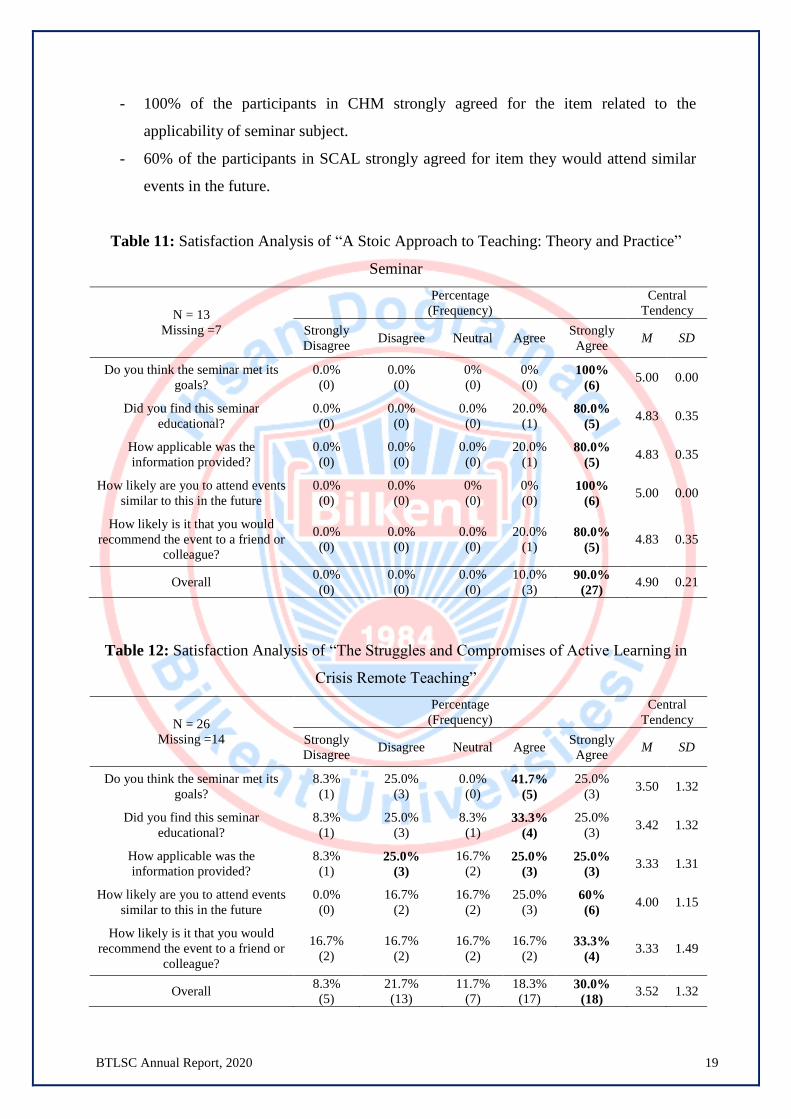
- 100% of the participants in CHM strongly agreed for the item related to the
applicability of seminar subject.
- 60% of the participants in SCAL strongly agreed for item they would attend similar
events in the future.
Table 11: Satisfaction Analysis of “A Stoic Approach to Teaching: Theory and Practice”
Seminar
N = 13
Missing =7
Percentage
(Frequency)
Central
Tendency
Strongly
Disagree Disagree Neutral Agree
Strongly
Agree M SD
Do you think the seminar met its
goals?
0.0%
(0)
0.0%
(0)
0%
(0)
0%
(0) 100%
(6) 5.00 0.00
Did you find this seminar
educational?
0.0%
(0)
0.0%
(0)
0.0%
(0)
20.0%
(1) 80.0%
(5) 4.83 0.35
How applicable was the
information provided?
0.0%
(0)
0.0%
(0)
0.0%
(0)
20.0%
(1) 80.0%
(5) 4.83 0.35
How likely are you to attend events
similar to this in the future
0.0%
(0)
0.0%
(0)
0%
(0)
0%
(0) 100%
(6) 5.00 0.00
How likely is it that you would
recommend the event to a friend or
colleague?
0.0%
(0)
0.0%
(0)
0.0%
(0)
20.0%
(1) 80.0%
(5) 4.83 0.35
Overall 0.0%
(0)
0.0%
(0)
0.0%
(0)
10.0%
(3) 90.0%
(27) 4.90 0.21
Table 12: Satisfaction Analysis of “The Struggles and Compromises of Active Learning in
Crisis Remote Teaching”
N = 26
Missing =14
Percentage
(Frequency)
Central
Tendency
Strongly
Disagree Disagree Neutral Agree
Strongly
Agree M SD
Do you think the seminar met its
goals?
8.3%
(1)
25.0%
(3)
0.0%
(0) 41.7%
(5)
25.0%
(3) 3.50 1.32
Did you find this seminar
educational?
8.3%
(1)
25.0%
(3)
8.3%
(1) 33.3%
(4)
25.0%
(3) 3.42 1.32
How applicable was the
information provided?
8.3%
(1) 25.0%
(3)
16.7%
(2) 25.0%
(3)
25.0%
(3) 3.33 1.31
How likely are you to attend events
similar to this in the future
0.0%
(0)
16.7%
(2)
16.7%
(2)
25.0%
(3) 60%
(6) 4.00 1.15
How likely is it that you would
recommend the event to a friend or
colleague?
16.7%
(2)
16.7%
(2)
16.7%
(2)
16.7%
(2) 33.3%
(4) 3.33 1.49
Overall 8.3%
(5)
21.7%
(13)
11.7%
(7)
18.3%
(17) 30.0%
(18) 3.52 1.32

BTLSC Annual Report, 2020 20
Table 13: Satisfaction Analysis of “Classroom Management in Higher Education”
N = 12
Missing = 7
Percentage
(Frequency)
Central
Tendency
Strongly
Disagree Disagree Neutral Agree
Strongly
Agree M SD
Do you think the seminar met its
goals?
0.0%
(0)
0.0%
(0)
0.0%
(0)
20.0%
(1) 80.0%
(4) 4.80 0.40
Did you find this seminar
educational?
0.0%
(0)
0.0%
(0)
0.0%
(0)
20.0%
(1) 80.0%
(4) 4.80 0.40
How applicable was the
information provided?
0.0%
(0)
0.0%
(0)
0.0%
(0)
0.0%
(0) 100.0%
(5) 5.00 0.00
How likely are you to attend events
similar to this in the future
0.0%
(0)
0.0%
(0)
20.0%
(1)
20.0%
(1) 60.0%
(3) 4.40 0.80
How likely is it that you would
recommend the event to a friend or
colleague?
0.0%
(0)
0.0%
(0)
0.0%
(0)
20.0%
(2) 60.0%
(3) 4.60 0.49
Overall 0.0%
(0)
0.0%
(0)
4.0%
(1)
20.0%
(5) 76.0%
(19) 4.72 0.42
2 2019 Services vs 2020 Services
This section presents a comparison of both students and faculty services provided in 2020
with that in 2019.
2.1 Student Services
Number of all services and participated students are more in 2020 than in 2019. Table 14
presents descriptive statistics of the students’ services according to years. Students’
engagement in seminars has increased remarkably. In 2019, the first year of BTLSC, less students
were tutored than in 2020, and the number of courses included in tutoring service increased (67%,
n = 2).
Table 14: Students’ Services of 2020 vs 2019
Services 2020 2019
# # of Students # # of Students
Seminars 43 4734 14 208
Peer Tutoring 5 Course 103 3 Courses 37

BTLSC Annual Report, 2020 21
Except for Math 103, in all tutored courses, students’ involvements has increased in 2020
(See Figure 4).
Figure 4: Students’ Involvement of Tutoring Hours
Student Success Analysis
According to both 2019 and 2020 data collected from the tutored sessions, the tutoring
sessions offered by BTLSC has had a positive impact on the students’ success at Bilkent
University. In comparison to 2019 tutoring sessions, the students were more successful in
2020. As presented in Table 15 and Table 16, all of the repeated students passed from Math
105, Econ 101, and Econ 102 in 2020. In 2020, the passing grades of the repeating students
were in between A- to D+ while in 2019 that was D+ and D (See Table 16).
Table 15: Success Analysis of 2020 vs 2019
Tutored
Courses
2020 2019
Student Success Ratio of (%) Students Success Ratio of (%)
# Repeating All Repeating # Repeating All Repeating
Math 103 2 - 100.0 - 4 4 50.0 50.0
Math 105 34 2 97.1 100.0 19 1 84.2 100.0
Econ 101 39 5 94.9 100.0 14 0 92.9 -
Econ 102 13 3 92.3 100.0
Not Given
Math 106 15 4 86.7 50.0
BTLSC Annual Report, 2020 22
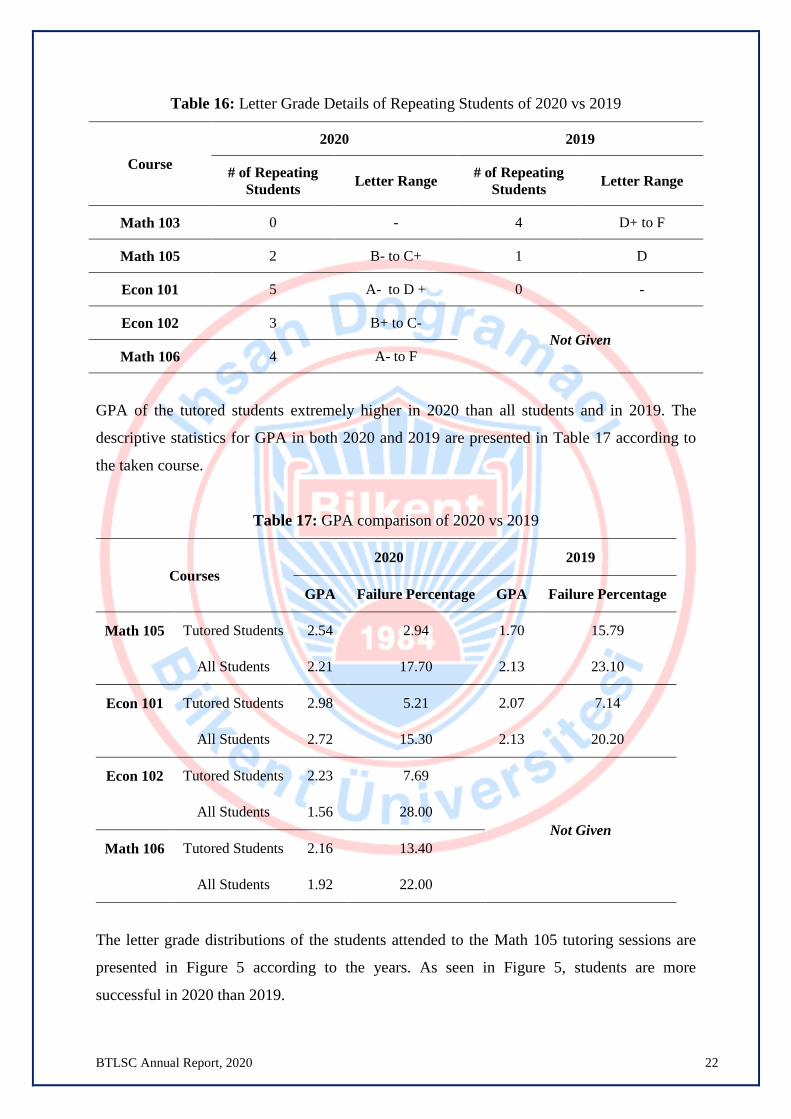
Table 16: Letter Grade Details of Repeating Students of 2020 vs 2019
Course
2020 2019
# of Repeating
Students Letter Range
# of Repeating
Students Letter Range
Math 103 0 - 4 D+ to F
Math 105 2 B- to C+ 1 D
Econ 101 5 A- to D + 0 -
Econ 102 3 B+ to C-
Not Given
Math 106 4 A- to F
GPA of the tutored students extremely higher in 2020 than all students and in 2019. The
descriptive statistics for GPA in both 2020 and 2019 are presented in Table 17 according to
the taken course.
Table 17: GPA comparison of 2020 vs 2019
Courses
2020 2019
GPA Failure Percentage GPA Failure Percentage
Math 105 Tutored Students 2.54 2.94 1.70 15.79
All Students 2.21 17.70 2.13 23.10
Econ 101 Tutored Students 2.98 5.21 2.07 7.14
All Students 2.72 15.30 2.13 20.20
Econ 102 Tutored Students 2.23 7.69
Not Given
All Students 1.56 28.00
Math 106 Tutored Students 2.16 13.40
All Students 1.92 22.00
The letter grade distributions of the students attended to the Math 105 tutoring sessions are
presented in Figure 5 according to the years. As seen in Figure 5, students are more
successful in 2020 than 2019.

BTLSC Annual Report, 2020 23
Figure 5: Letter Grade Distribution of Math 105 in 2020 vs 2019
The letter grade distributions of the students attended to the Econ 101 tutoring sessions are
presented in Figure 6 according to the years. The distribution is negatively skewed in 2020
which means that the majority of the letter grades fall in the upper part (close to letter grade
A) of the distribution. In other words, number of students having high letter grade is
remarkably more than that have lower grades.
Figure 6: Letter Grade Distribution of Econ 101 in 2020 vs 2019

BTLSC Annual Report, 2020 24
2.2 Faculty Services
Technology utilization becomes very important due to Covid-19 and online teaching
processes. Therefore, the number of seminars about technology utilization (given by BETS)
has increased considerably in 2020 (see Table 18). Similarly, faculty participation in
educational technology seminars has been growing, more than 10 times from 2019 to 2020.
The number of seminars about online teaching, instructional designs remain the same.
However, majority (71.4%) of the speakers are from other universities and 28.5% of them are
from foreign universities in 2020. While in 2019 only 14.7% of the speakers are from other
universities in Turkey. Due to overload of all academics during Covid-19, having the same
number of both seminars and participants in 2020 can be counted as a success.
Table 18: Faculty Services of 2020 vs 2019
Seminars 2020 2019
# # of Participants # # of Participants
BTLSC 7 124 7 124
BETS 15 850 5 78
Total 22 974 12 202
3 Future Plans
In terms of strategy, BTLSC will continue to organize events (seminars, tutoring sessions)
not only to raise campus awareness, but also to increase interest and disseminate easy-to-
utilize practices in both teaching and learning processes. In the long term, the BTLSC’s work
reveals interests and needs in the areas of instructional technology, instructional theories,
assessment, and flexible online instructional and learning design. We aim to find ways to
support these emerging requests in future planning.
In addition to the existing services given and organized by BTLSC (tutoring, seminars,
workshops, etc.) following plans will be realized:
1. Involvement in the educational decisions taken by university
BTLSC Annual Report, 2020 25
2. Increase the number of staff to improve not only the quality but also the number of the
services provided by BTLSC
3. Add new courses to the tutored courses
4. Increase the number of repeating students in the tutoring sessions
5. Get opinions of the tutored students about tutoring sessions
6. Increase the quality of the seminars given for the faculty

BTLSC Annual Report, 2020 26
Appendices
APPENDIX A
Weekly Schedules of Tutoring Sessions
A. Weekly Schedules of Tutoring Sessions
Math 103: Thinking Mathematically I
# Day Time Tutor
1 Wednesday 13:30 - 14:20 Selin Öztürk
2 Wednesday 16:30 – 17:20 Almina Zeynep Gözdemir
Math 105: Introduction to Calculus I
# Day Time Tutor
1 Friday 15:30 – 16:20 Zeynep Doğa Bulamaç
2 Saturday 15:30 – 16:20 Meryem Gökçe Yavuz
Math 106: Introduction to Calculus II
# Day Time Tutor
1 Sunday 10:30 – 11:20 İrem Gürsu
2 Saturday 17:00 – 17:50 Elif Buse Cevik
Econ 101: Introduction to Economics I
# Day Time Tutor
1 Wednesday 14:30 - 15:20 Burcu Yıldız
2 Wednesday 15:30 - 16:20 Burcu Yıldız
Econ 102: Introduction to Economics II
# Day Time Tutor
1 Monday 15:30 - 16:20 Mahmut Sefa İpek
2 Friday 15:30 - 16:20 Mahmut Sefa İpek
BTLSC Annual Report, 2020 27
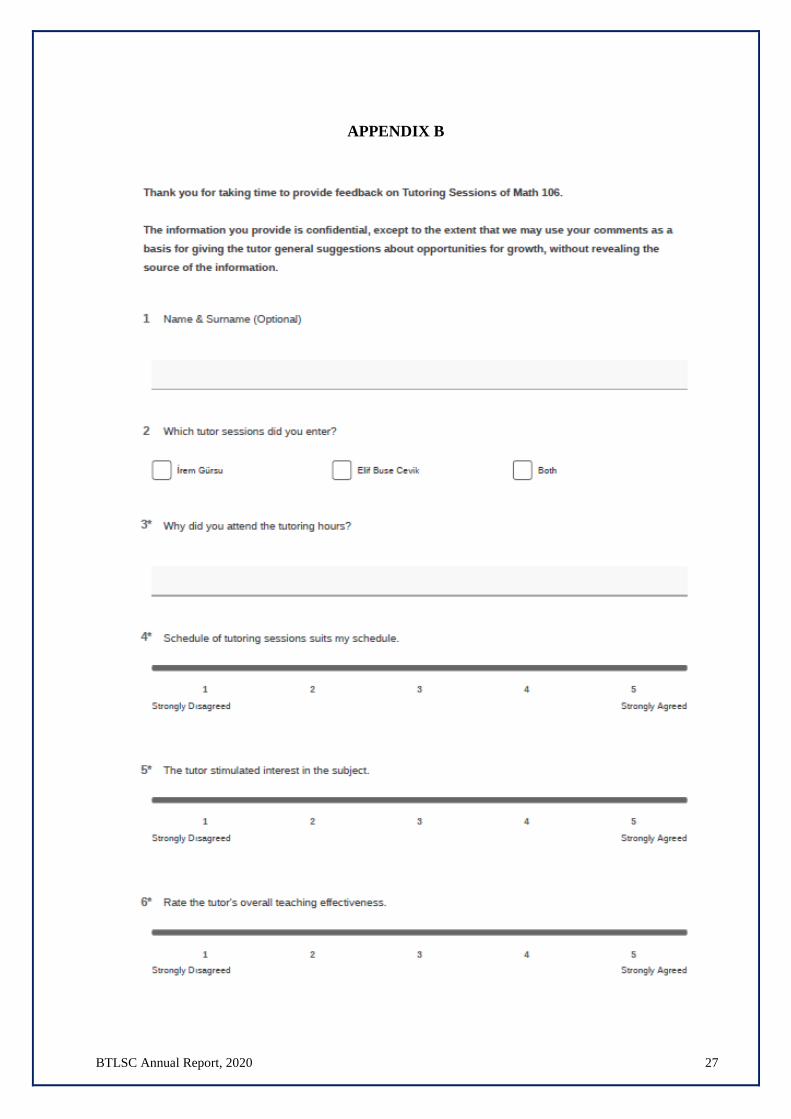
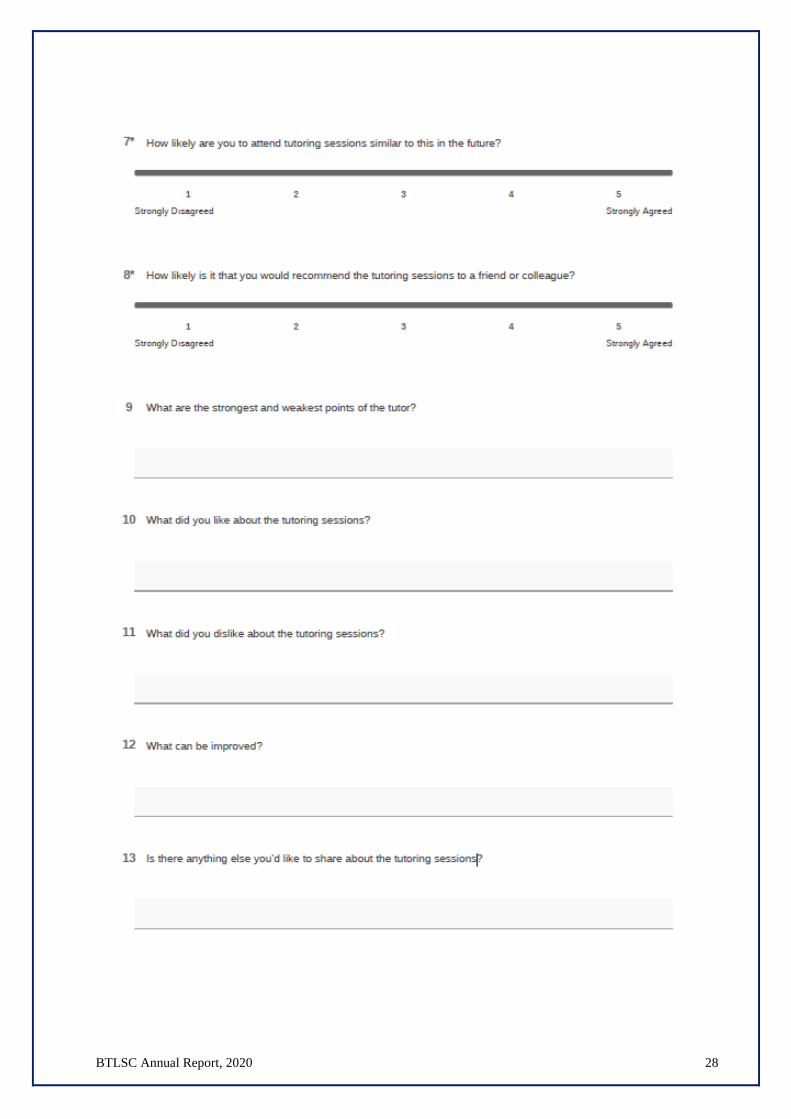
APPENDIX B
B. Example of Online Questionnaire for Tutoring Sessions
BTLSC Annual Report, 2020 28
BTLSC Annual Report, 2020 29
APPENDIX C
C. Example of Online Questionnaire for Faculty Seminar
BTLSC Annual Report, 2020 30
BTLSC Annual Report, 2020 31