bill harrison cleveland - akron chapters joint meeting march 16, 2009
TRANSCRIPT
Bill Harrison Cleveland - Akron Chapters Joint Meeting
March 16, 2009
Bill Harrison Cleveland - Akron Chapters Joint Meeting
March 16, 2009

ChallengesChallenges
Energy – cost and availability Food – cost and availability Protecting the environment

ASHRAE ASHRAE
52,000 members in 130 countries 170 chapters in 24 countries Associate Societies in 32 countries 2500 members active on committees

EnergyEnergy
Cost and availability IEA: $100 / Barrel till 2015; $120 till 2030
End use in developed economies Buildings – 40% Transportation 28% Industry 32%
Coal and oil primary energy sources 45% Growth between 2006 and 2030

FoodFood
Cost Energy driven costs Spoilage
Availability Cost and spoilage Foodstock diversion
Refrigeration – large energy consumer

EnvironmentEnvironment
Buildings use 70% of electricity Extensive emissions from generation Water use for generation 45% Emissions growth 2006 to 2030
ASHRAE role: Take energy out of buildings

Energy WasteEnergy WasteA Real Problem… A Real OpportunityA Real Problem… A Real Opportunity

Sustainability for ASHRAESustainability for ASHRAESustainability for ASHRAESustainability for ASHRAE
Energy EfficiencyEnergy Efficiency
AndAnd
Healthy and Productive Indoor Healthy and Productive Indoor EnvironmentsEnvironments

Improved Operating StrategiesImproved Operating Strategies
Energy Systems Lab - Texas A & M – Save 10% to 40% energy
World Energy Forum: 17% Internal rate of return for energy efficiency upgrades
Not product centered Software and expert knowledge focused Limited knowledge distribution

Improved Operating StrategiesImproved Operating Strategies
Lack of standardization Minor changes use major energy Wrong incentives for operators No training programs

Chilled Water Plant StrategiesChilled Water Plant Strategies
Rightsizing equipment Variable Primary Pumping Optimized condenser water
Temperature Flow
Thermal storage Model energy - track energy Periodic re-commissioning

Energy Conserving StrategiesEnergy Conserving Strategies
Envelope testing Pressure tests Infrared Scans
Return to design conditions Scheduling review

Operator TrainingOperator Training
Local chapter programLocal chapter program HVAC fundamentalsHVAC fundamentals High performance products and High performance products and
systemssystems 1980’s training produces 1980 1980’s training produces 1980
resultsresults

The Cost of Owning HVACThe Cost of Owning HVAC
Capital costs Utility costs Repair costs Replacement costs Maintenance costs

Maintenance PlansMaintenance Plans
ASHRAE Guideline 4 – 2008 Preparation of Operating and
Maintenance Documentation for Building Systems
CIBSE Guide M – 2008 Maintenance Engineering and
Management
Must include energy budgets and energy reporting

Maintenance StrategiesMaintenance Strategies
Develop proper documentation ASHRAE Guideline 4
Keep equipment clean Don’t accept dirty equipment Maintenance management software Monitor energy use In house / outsource
Training capabilities

Sustainability ChallengeSustainability Challenge
Six of top ten energy measures Six of top ten energy measures under control of architectsunder control of architects
Integrated Building Design Integrated Building Design process essentialprocess essential
Communication - collaborationCommunication - collaboration ““First Cost” mentalityFirst Cost” mentality Engineers: evil enablersEngineers: evil enablers

Owner OrganizationsOwner Organizations
Building Owners and Managers Building Owners and Managers AssociationAssociation
International Facility Management International Facility Management AssociationAssociation
APPA – The Association of Higher APPA – The Association of Higher Education Facility Executives Education Facility Executives

Owner IssuesOwner Issues
Life Cycle CostingLife Cycle Costing Equipment room sizingEquipment room sizing Engineers need to deliver energy Engineers need to deliver energy
messagemessage Energy cost implicationsEnergy cost implications Building CommissioningBuilding Commissioning
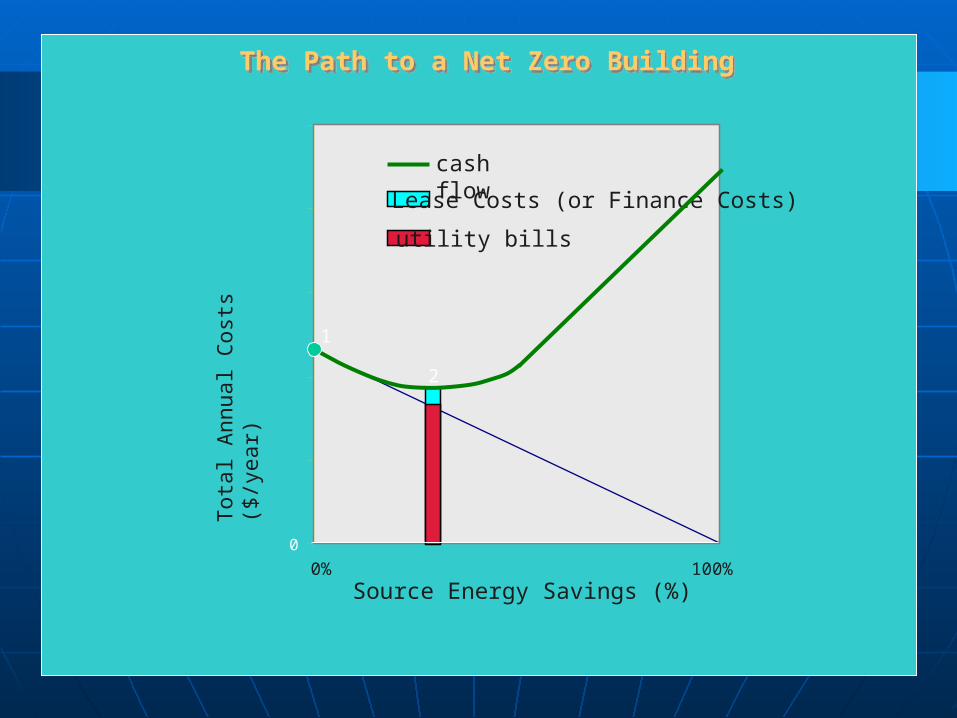
0
0% 100%Source Energy Savings (%)
Tot
al A
nnua
l Cos
ts (
$/ye
ar)
Lease Costs (or Finance Costs)
utility bills
cash flow
1
2
The Path to a Net Zero BuildingThe Path to a Net Zero Building
00% 100%
Source Energy Savings (%)
Tot
al A
nnua
l Cos
ts (
$/ye
ar)
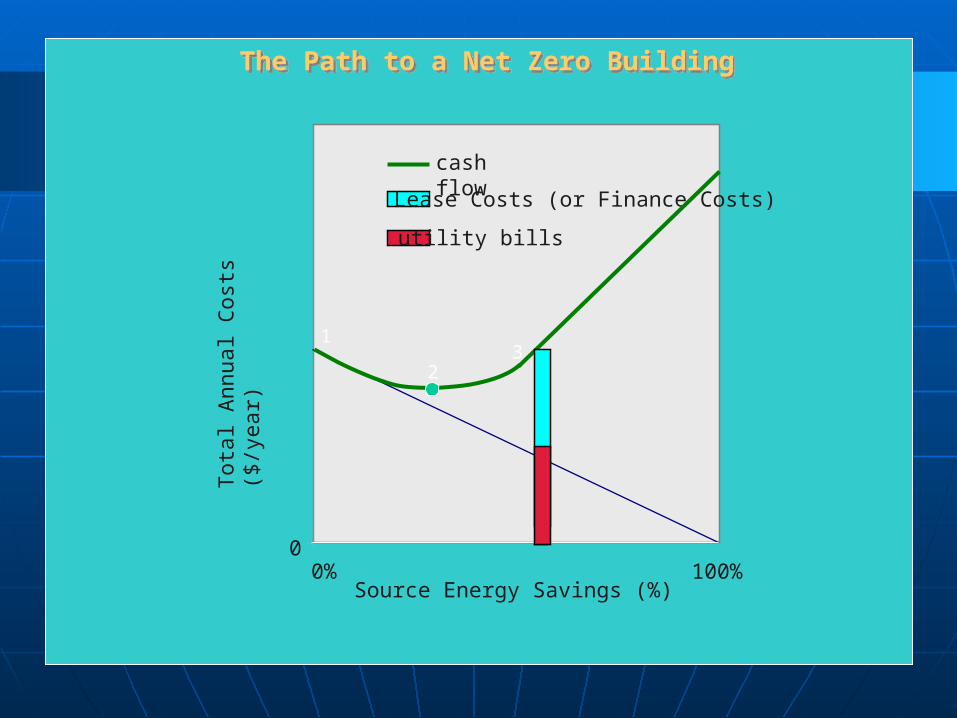
Lease Costs (or Finance Costs)
utility bills
cash flow
1
23
The Path to a Net Zero BuildingThe Path to a Net Zero Building

0
0% 100%Source Energy Savings (%)
To
tal A
nn
ual
Co
sts
($/y
ear)
Lease Costs (or Finance Costs)
utility bills
cash flow
1
23
4
The Path to a Net Zero BuildingThe Path to a Net Zero Building

Energy TermsEnergy Terms
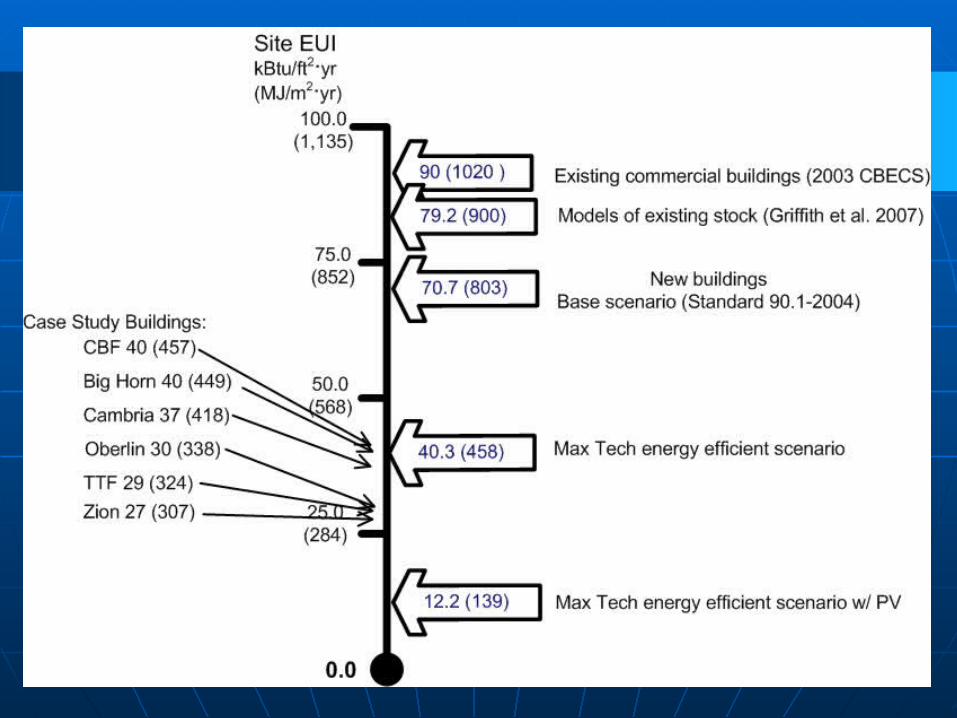
Energy Use Intensity: BTU/Sq. Ft./Year Site versus Source Plug and process loads
CBECS: Commercial Building Energy Consumption Survey
Net zero energy building: a building which on an annual basis, produces as much energy from renewable sources as it consumes

Reference SourcesReference Sources
US Department of Energy www.energy.gov
National Renewable Energy Laboratory Great case studies www.nrel.gov
EPA www.epa.gov
ASHRAE www.engineeringforsustainability.org

High Performance Building Design
High Performance Building Design
Energy Modeling
Building Narrative

High Performance Building Design
High Performance Building Design
A larger budget for planning and design produces lower
construction costs and lower operating costs
ASHRAE’s RoleASHRAE’s Role
Net zero design guidance by 2015
Building Energy Labeling AEDGs to reduce energy in
existing buildings Affordable and maintainable
refrigeration systems Efficient refrigeration systems

ASHRAE Chapter ActionsASHRAE Chapter Actions
Schedule a meeting with local owner organizations Integrated Building Design High performance design costs more Keep your Green Buildings Green
Get comfortable with building energy benchmarks:“What’s your EUI?”
Walk the talk – how is your building being operated?

The Buildings BusinessThe Buildings Business
Largest user primary energy Improved building operations
10% to 40% energy savings
Local educational programs by ASHRAE chapters
Keep our green buildings green

World Population GrowthWorld Population Growth
2008 - 6,700,000,000 2050 – 9,200,000,000
Growth: 2,500,000,000 People

Per Capita CO2 EmissionsPer Capita CO2 Emissions
World: 4.3 Metric tons/person OECD Nations: 11 Metric tons/person USA: 19 Metric tons/person Grow from 2 t0 6 “Americums”
Global CO2 Emissions
2009: 30 Billion metric tons
2030: 42 Billion metric tons

Atmospheric CO2 LevelsAtmospheric CO2 Levels
Pre-industrial: 280 PPM 2007: 380 PPM 2050 Business as usual: 580 PPM
Can we afford to take a chance?

The Cost of Being GreenThe Cost of Being Green
Energy Efficiency - $170 Billion Smart Grid - $8.6 Trillion Energy Storage - $180 per Megawatt hour Carbon Capture and Sequestration - $ ??? Priced carbon emissions - $ ??? $450 - $600 Billion per year until 2030
Estimates for global mitigation from “Green Investing” - 2009 WEF

The Cost of Being GreenThe Cost of Being Green
2006 Global Emissions: 28,000,000,000 MT 2006 USA Emissions: 5,700,000,000
United States Share: 20%
Global cost of mitigation: $10,500,000,000,000 US Share: $2,100,000,000,000
What is the cost of taking energy out of buildings?
