bill wells -...
TRANSCRIPT

WORK IS THE BEST FORM OF WELFARE (SAVINGS):
THE PROCESS IS THE POLICY.
BILL WELLS

BEVERIDGEAN WELFARE STATE PRINCIPLES: in
‘SOCIAL INSURANCE AND ALLIED SERVICES’. [1944]
The first principle is that any proposals for the future, while they should use to the full the
experience gathered in the past, should not be restricted by consideration of sectional
interests established in the obtaining of that experience. Now, when the war is abolishing
landmarks of every kind, is the opportunity for using experience in a clear field. A
revolutionary moment in the world's history is a time for revolutions, not for patching.
The second principle is that organisation of social insurance should be treated as one
part only of a comprehensive policy of social progress. Social insurance fully developed
may provide income security; it is an attack upon Want. But Want is one only of five
giants on the road of reconstruction and in some ways the easiest to attack. The others
are Disease, Ignorance, Squalor and Idleness.
The third principle is that social security must be achieved by co-operation
between the State and the individual. The State should offer security for service
and contribution. The State in organising security should not stifle incentive,
opportunity, responsibility; in establishing a national minimum, it should leave
room and encouragement for voluntary action by each individual to provide more
than that minimum for himself and his family.
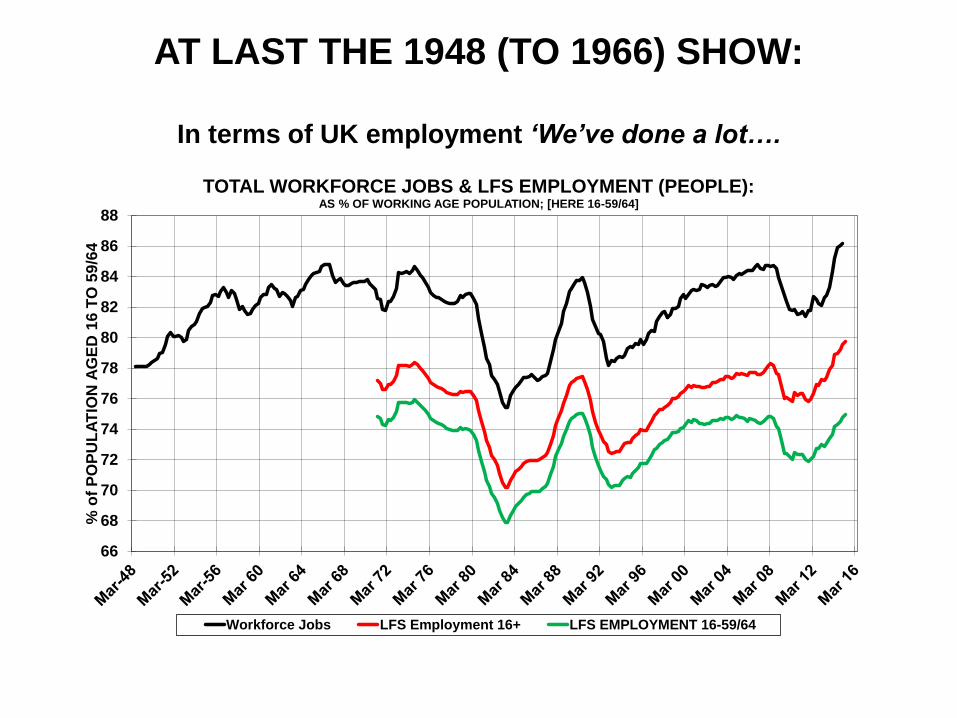
AT LAST THE 1948 (TO 1966) SHOW:
In terms of UK employment ‘We’ve done a lot….
66
68
70
72
74
76
78
80
82
84
86
88
% o
f P
OP
UL
AT
ION
AG
ED
16
TO
59
/64
TOTAL WORKFORCE JOBS & LFS EMPLOYMENT (PEOPLE): AS % OF WORKING AGE POPULATION; [HERE 16-59/64]
Workforce Jobs LFS Employment 16+ LFS EMPLOYMENT 16-59/64

‘…but – to hit 2 million jobs this parliament – there is still more to do.’
The ‘ageing population’ is already here.
Over 50s – who work less – up by 2 million. With half over 65
Under 50s – who work more – down by ½ million.
-91 -129
216
-135
255163
574
855
-98-133
62
-155
297
170
542
685
-500
-250
0
250
500
750
1,000
1,250
1,500
1,750
TH
OU
SA
ND
S
POPULATION CHANGE 2015-2020: BY AGE/SEX:ONS: 2012 PROJECTIONS:
MALES FEMALES

So, it is difficult to see employment growth of more than ¾ to 1 million
over the next 5 years without substantial policy reform.
Reforms would need to deliver 1- 1¼ million more people in employment
-121 -121 -89-52
-641 46 69 79
189 221
313
569
235
-200
-100
0
100
200
300
400
500
600
700
800
900
1,000
TH
OU
SA
ND
S
PROJECTED EMPLOYMENT CHANGE 2015-2020 WITHOUT REFORM:CONSTANT EMPLOYMENT RATES & EXCESS UNEMPLOYMENT (BACK TO PRE-RECESSIONARY LEVELS)
Constant Employment Rates Excess Unemployment (+ve Only)

REFORM: BACK TO THE FUTURE? Complete the process of Beveridgean welfare to work that was
RESTART-ed in 1986?
SOCIAL SECURITY MUST BE ACHIEVED BY
CO-OPERATION BETWEEN THE STATE & THE INDIVIDUAL
The State should offer security…
State sorts out individual’s benefits quickly & accurately & provides certainty.
…for service & contribution.
Every individual is expected to behave in a way that improves their situation
– despite receiving benefits – and so minimise the time spent on benefits.
The State in organising security should not stifle
incentive, opportunity, responsibility;
• Individual agrees contract of behaviour with state. Based on jobsearch
• Regularly and frequently check and review the individual’s behaviour.
• State provides more help to individual the longer they are on benefits.

The rise in UK average living standards – as measured by GDP per
head – has been amongst the fastest in the OECD over the past 30
years or so.
This is despite a fall of 2% between 2007 and 2014…
427
180
134127
78 77 75 74 72 71 69 67 66 66 66 66 65 60 5850 49 48 42 39 34 27
87
-20 -19
28
8-2 -5
4-11 -14
-5 -5-15
0 2 2 8-2 5 4
-10-2 3 6
-18
-42
-80
-40
0
40
80
120
160
200
240
280
320
360
400
440
PE
R C
EN
T
RANKED OVER WHOLE PERIOD 1983-2014
GDP PER HEAD: %AGE CHANGE 1983-2014: OECD: $PPP
1983-2014 2007-2014
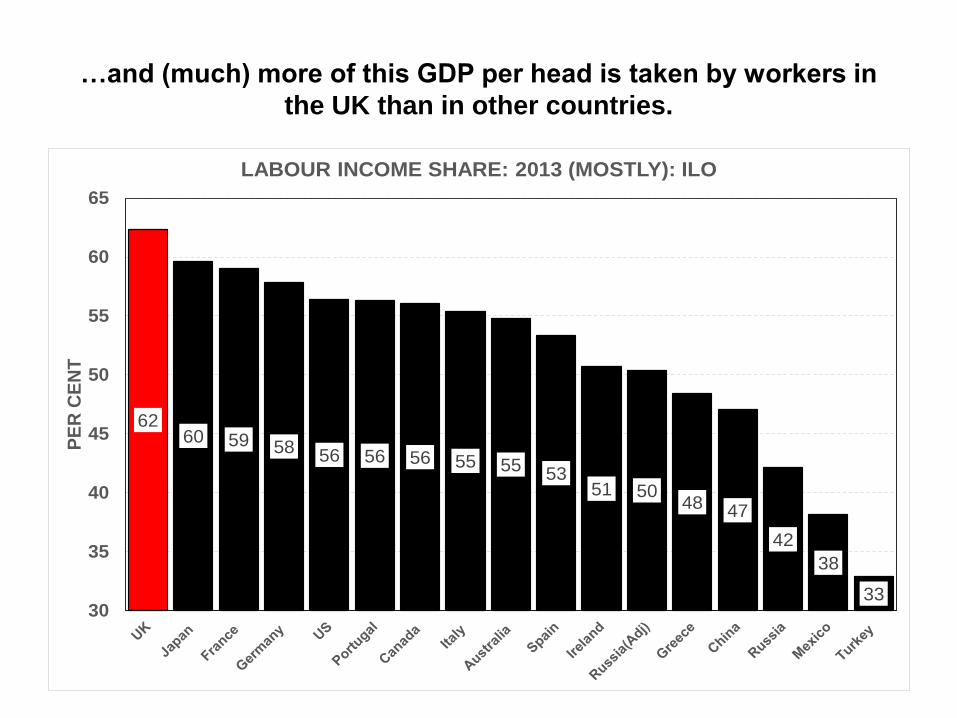
…and (much) more of this GDP per head is taken by workers in
the UK than in other countries.
6260 59 58 56 56 56 55 55
5351 50
48 47
42
38
3330
35
40
45
50
55
60
65
PE
R C
EN
T
LABOUR INCOME SHARE: 2013 (MOSTLY): ILO
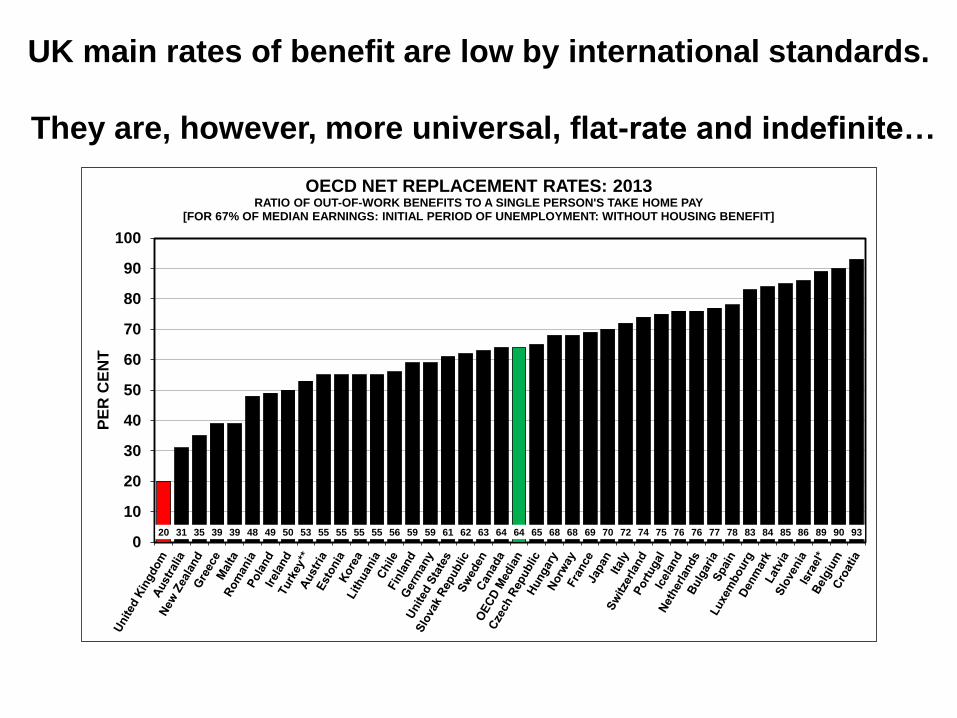
UK main rates of benefit are low by international standards.
They are, however, more universal, flat-rate and indefinite…
20 31 35 39 39 48 49 50 53 55 55 55 55 56 59 59 61 62 63 64 64 65 68 68 69 70 72 74 75 76 76 77 78 83 84 85 86 89 90 93
0
10
20
30
40
50
60
70
80
90
100
PE
R C
EN
T
OECD NET REPLACEMENT RATES: 2013RATIO OF OUT-OF-WORK BENEFITS TO A SINGLE PERSON'S TAKE HOME PAY
[FOR 67% OF MEDIAN EARNINGS: INITIAL PERIOD OF UNEMPLOYMENT: WITHOUT HOUSING BENEFIT]
0%
2%
4%
6%
8%
10%
12%
14%
16%
18%
20%
22%
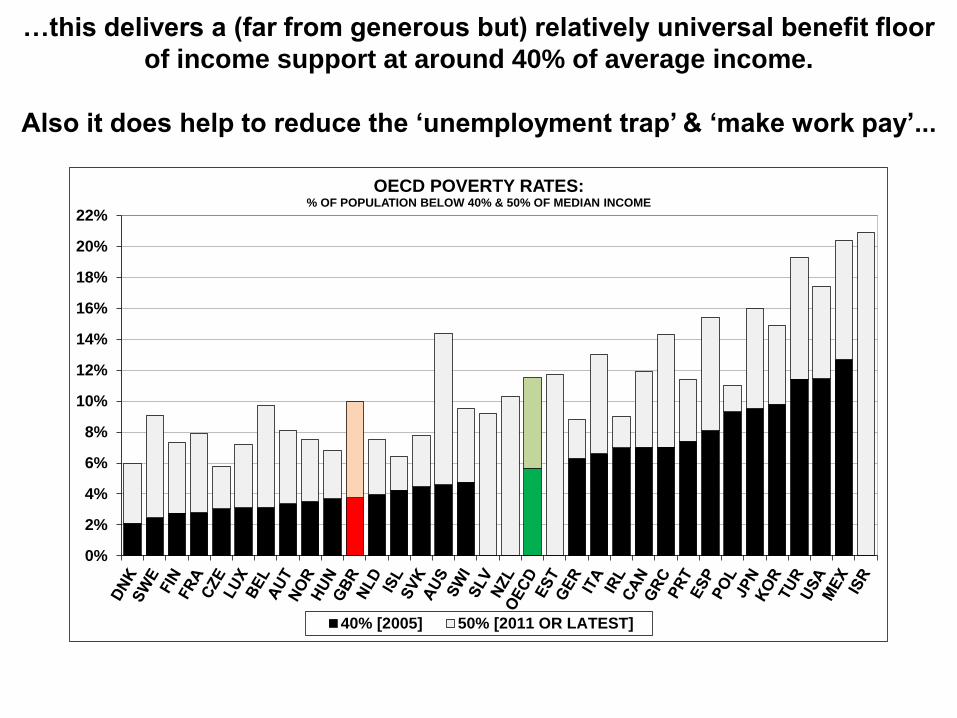
OECD POVERTY RATES:% OF POPULATION BELOW 40% & 50% OF MEDIAN INCOME
40% [2005] 50% [2011 OR LATEST]
…this delivers a (far from generous but) relatively universal benefit floor
of income support at around 40% of average income.
Also it does help to reduce the ‘unemployment trap’ & ‘make work pay’...

…and once in work the average income of UK workers (wages net
of tax/NI Contributions) is amongst the very highest in the world.
This is despite poor growth in take-home pay since the recession.
142
109 109105 105 104
100
9795
92 90 9086 85 83 82 82 81
79 78 77 7771 71
6356 51 47 46 46 45 45 41 39
29
2825
19
33
23
9
3
19
11 9
2825
19 19
3022
26
20
37
14
2522 24
15 -119
27
38
61
28
39
26
39
51
13
-10
0
10
20
30
40
50
60
70
80
90
100
110
120
130
140
150
IND
EX
: U
K T
AK
E H
OM
E P
AY
=1
00
AVERAGE TAKE HOME PAY 2014: OECD ESTIMATES: INDEX UK =100ANNUAL EARNINGS: $US USING PURCHASING POWER PARITY EXCHANGE RATES:
[FOR A SINGLE PRIVATE SECTOR WORKER, NO CHILDREN: ON AVERAGE EARNINGS:]
2013 %AGE CHANGE 2007-14
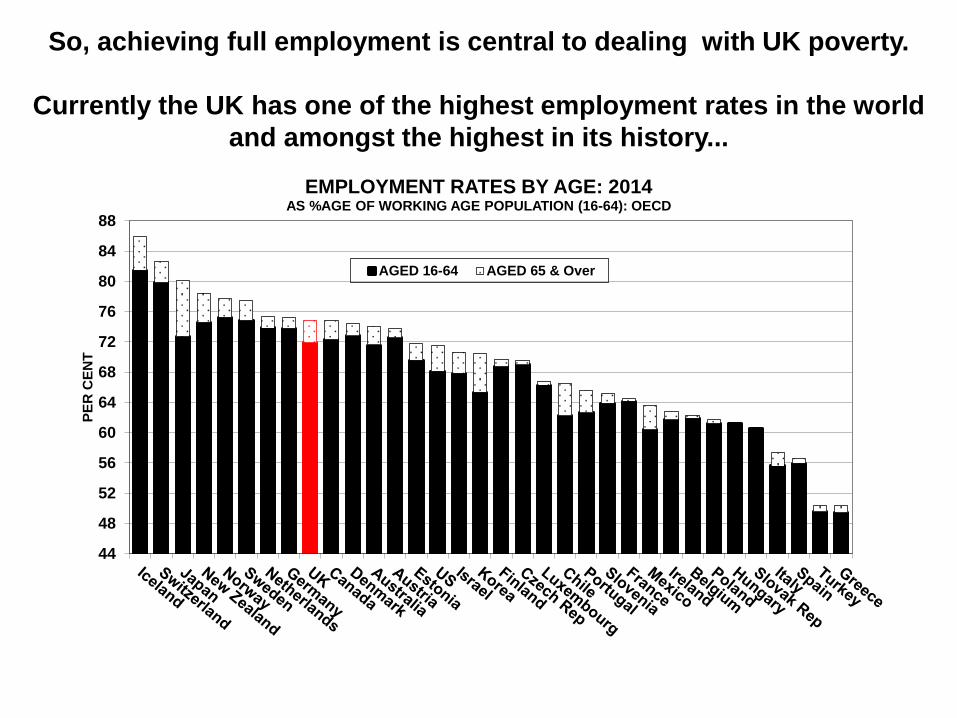
So, achieving full employment is central to dealing with UK poverty.
Currently the UK has one of the highest employment rates in the world
and amongst the highest in its history...
44
48
52
56
60
64
68
72
76
80
84
88
PE
R C
EN
T
EMPLOYMENT RATES BY AGE: 2014AS %AGE OF WORKING AGE POPULATION (16-64): OECD
AGED 16-64 AGED 65 & Over

Growth has generally been more ‘job rich/productivity poor.’
.…with, in line with most but not all, other countries,
a big improvement in rates from the ‘80s mass unemployment period.
Equivalent in the UK to around 3 million more people in employment.
-8
-4
0
4
8
12
16
20
24
28
PE
R C
EN
T
CHANGE IN EMPLOYMENT RATES BY AGE: 1984 TO 2014AS %AGE OF WORKING AGE POPULATION (16-64): OECD
AGED 16-64 AGED 65 & Over
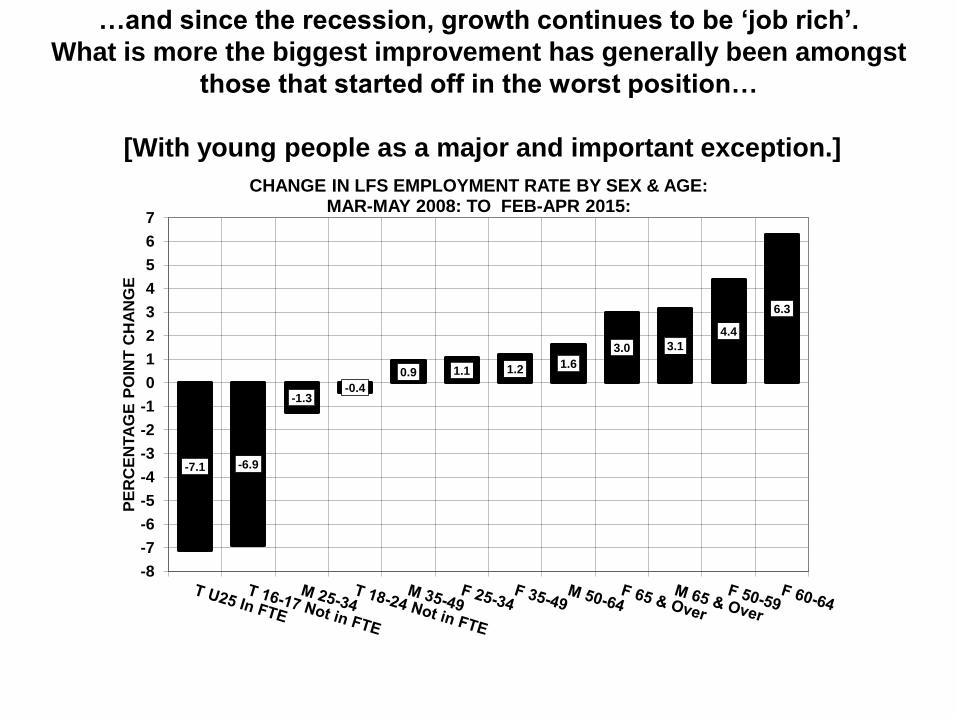
…and since the recession, growth continues to be ‘job rich’.
What is more the biggest improvement has generally been amongst
those that started off in the worst position…
[With young people as a major and important exception.]
-7.1 -6.9
-1.3-0.4
0.9 1.1 1.2 1.6
3.0 3.1
4.4
6.3
-8
-7
-6
-5
-4
-3
-2
-1
0
1
2
3
4
5
6
7
PE
RC
EN
TA
GE
PO
INT
CH
AN
GE
CHANGE IN LFS EMPLOYMENT RATE BY SEX & AGE:MAR-MAY 2008: TO FEB-APR 2015:

…rates have grown for UK nationals, most other EU nationalities & most
ethnic groups.
They have fallen for non-EU nationals (outside the Indian sub-
continent), the new EU2 states and for the Chinese…
1.2 1.1 0.5
-2.2
-4.6
11.5
7.0 6.4
2.31.4 0.8 0.5
-3.6
-8.7
-10
-8
-6
-4
-2
0
2
4
6
8
10
12
PE
RC
EN
TA
GE
PO
INT
CH
AN
GE
CHANGE IN EMPLOYMENT RATE BYNATIONALITY (16-64) & ETHNIC MINORITIES (16 & OVER):
LFS: (16-64): N.S.A.: JAN-MAR 2008-14

…and all types of households have also benefited. Again the biggest
improvements in those that started off in the worst position.
Employment rate growth has also been concentrated amongst people
with disabilities/work limitations…
0.5
1.61.1
2.2
7.9
0.5
4.1
6.8
-0.6
1.4
-1
0
1
2
3
4
5
6
7
8
PE
RC
EN
TA
GE
PO
INT
CH
AN
GE
CHANGE IN EMPLOYMENT RATES (16-64): LFSFOR VARIOUS GROUPS OF HOUSEHOLDS/INDIVIDUALS [OCT-DEC 2007-14: JAN-MAR 2008-2015]

…with active management of disability benefits contributing to this shift
from welfare to work. They are now at 20 year lows and 250-300 thousand
lower than its peak. But still over 1m higher than the mid 1980s.
Then, by mistake, a temporary sickness benefit for people without jobs
became a permanent incapacity benefit…
0
400
800
1,200
1,600
2,000
2,400
2,800
3,200
TH
OU
SA
ND
S
DISABILITY BENEFITS (ESTIMATED):[Including & Excluding Effect of Equalising State Pension Age]
EMPLOYMENT SUPPORT ALLOWANCE (ESA), INCAPACITY BENEFITS (IB) & SEVERE DISABILITY ALLOWANCE (SDA):
All ESA/Incapacity Benefits ESA/Incapacity (Net of Females Aged 60-64)

…but, history suggests that active management is not enough.
As the UK is one of the few countries with indefinite benefits the state
needs to stay in constant contact, maintaining effective jobsearch
behaviour & provide more help the longer the individual stays on benefit.
0 0 0 0 0 0 0 0 0 0 0 0 0 0 0 0 0 0 0 0 0 0 0 0 0 0 0 0 2 7 20 23 31 32 33 35 47 51 51 58
0
10
20
30
40
50
60
70
80
90
100
PE
R C
EN
T
OECD NET REPLACEMENT RATES: AT 5 YEARS DURATIONRATIO OF OUT-OF-WORK BENEFITS TO A SINGLE PERSON'S TAKE HOME PAY: 2013
[FOR 67% OF MEDIAN EARNINGS: WITHOUT HOUSING BENEFIT]
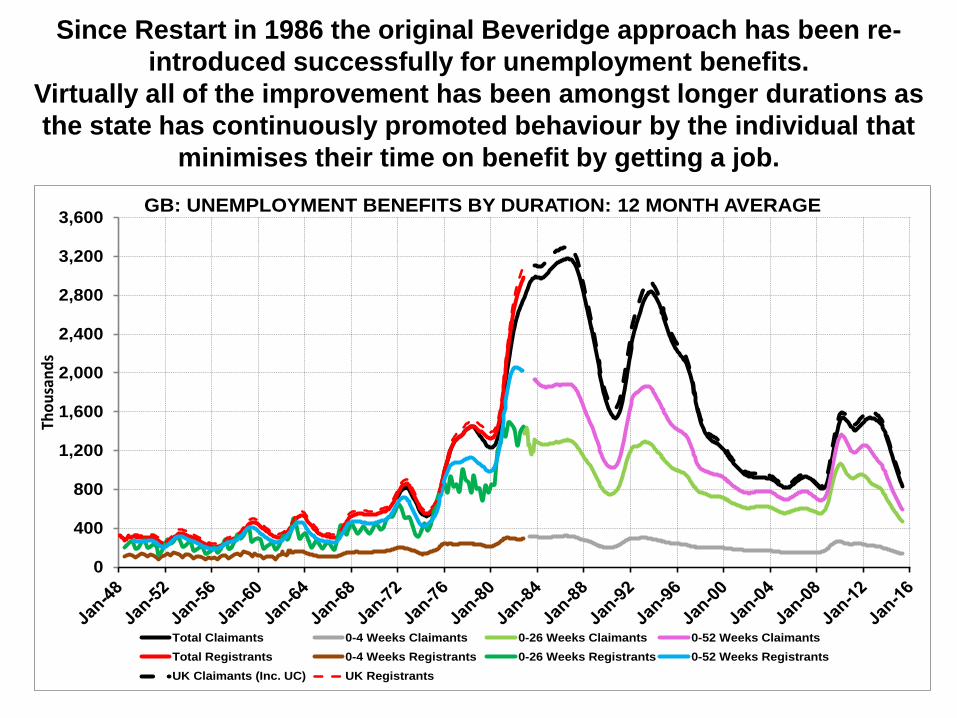
Since Restart in 1986 the original Beveridge approach has been re-
introduced successfully for unemployment benefits.
Virtually all of the improvement has been amongst longer durations as
the state has continuously promoted behaviour by the individual that
minimises their time on benefit by getting a job.
0
400
800
1,200
1,600
2,000
2,400
2,800
3,200
3,600
Tho
usa
nd
s
GB: UNEMPLOYMENT BENEFITS BY DURATION: 12 MONTH AVERAGE
Total Claimants 0-4 Weeks Claimants 0-26 Weeks Claimants 0-52 Weeks Claimants
Total Registrants 0-4 Weeks Registrants 0-26 Weeks Registrants 0-52 Weeks Registrants
UK Claimants (Inc. UC) UK Registrants
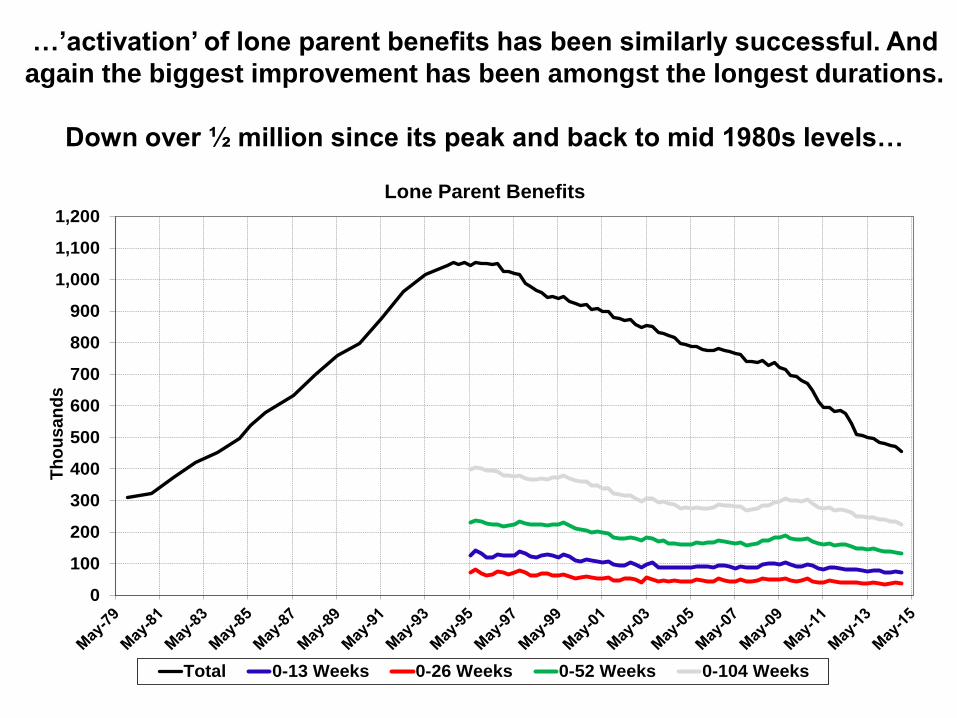
…’activation’ of lone parent benefits has been similarly successful. And
again the biggest improvement has been amongst the longest durations.
Down over ½ million since its peak and back to mid 1980s levels…
0
100
200
300
400
500
600
700
800
900
1,000
1,100
1,200
Th
ou
san
ds
Lone Parent Benefits
Total 0-13 Weeks 0-26 Weeks 0-52 Weeks 0-104 Weeks
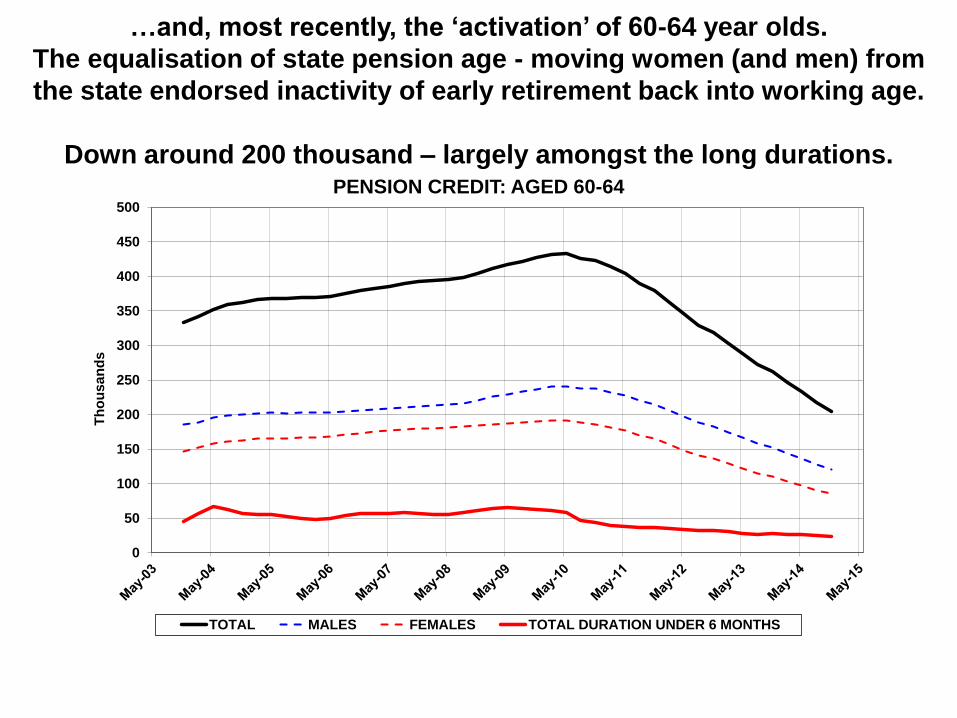
…and, most recently, the ‘activation’ of 60-64 year olds.
The equalisation of state pension age - moving women (and men) from
the state endorsed inactivity of early retirement back into working age.
Down around 200 thousand – largely amongst the long durations.
0
50
100
150
200
250
300
350
400
450
500
Th
ou
san
ds
PENSION CREDIT: AGED 60-64
TOTAL MALES FEMALES TOTAL DURATION UNDER 6 MONTHS
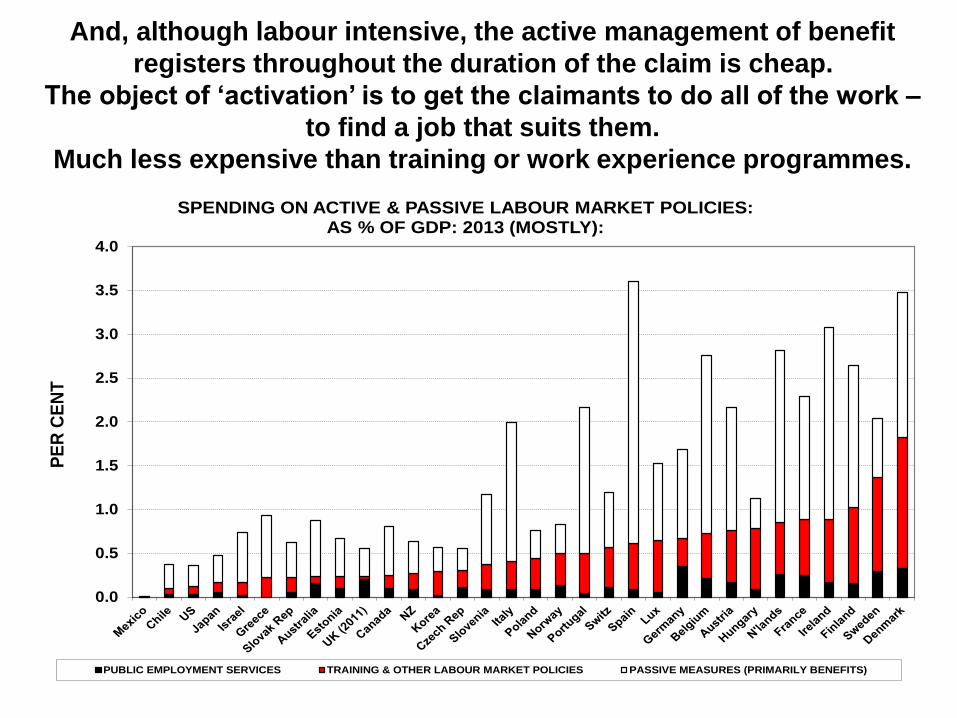
And, although labour intensive, the active management of benefit
registers throughout the duration of the claim is cheap.
The object of ‘activation’ is to get the claimants to do all of the work –
to find a job that suits them.
Much less expensive than training or work experience programmes.
0.0
0.5
1.0
1.5
2.0
2.5
3.0
3.5
4.0
PE
R C
EN
T
SPENDING ON ACTIVE & PASSIVE LABOUR MARKET POLICIES: AS % OF GDP: 2013 (MOSTLY):
PUBLIC EMPLOYMENT SERVICES TRAINING & OTHER LABOUR MARKET POLICIES PASSIVE MEASURES (PRIMARILY BENEFITS)

The improvement in disability benefits has been smaller. It also takes a
different form with little improvement amongst the long durations.
Not surprising given that the active management concentrates on the
start of the claim – not continuous management throughout the claim -
and on measuring claimant’s health status - not promoting jobsearch…
0
400
800
1,200
1,600
2,000
2,400
2,800
3,200
Th
ou
san
ds
DISABILITY BENEFITS (ESTIMATED):TOTAL AND DURATIONEMPLOYMENT SUPPORT ALLOWANCE (ESA),
INCAPACITY BENEFITS (IB) & SEVERE DISABILITY ALLOWANCE (SDA):
0-6 Months (Old Est) 0-12 Months (Old Est) TOTAL ESA/IB/SDA
0-6 Months 0-12 Months
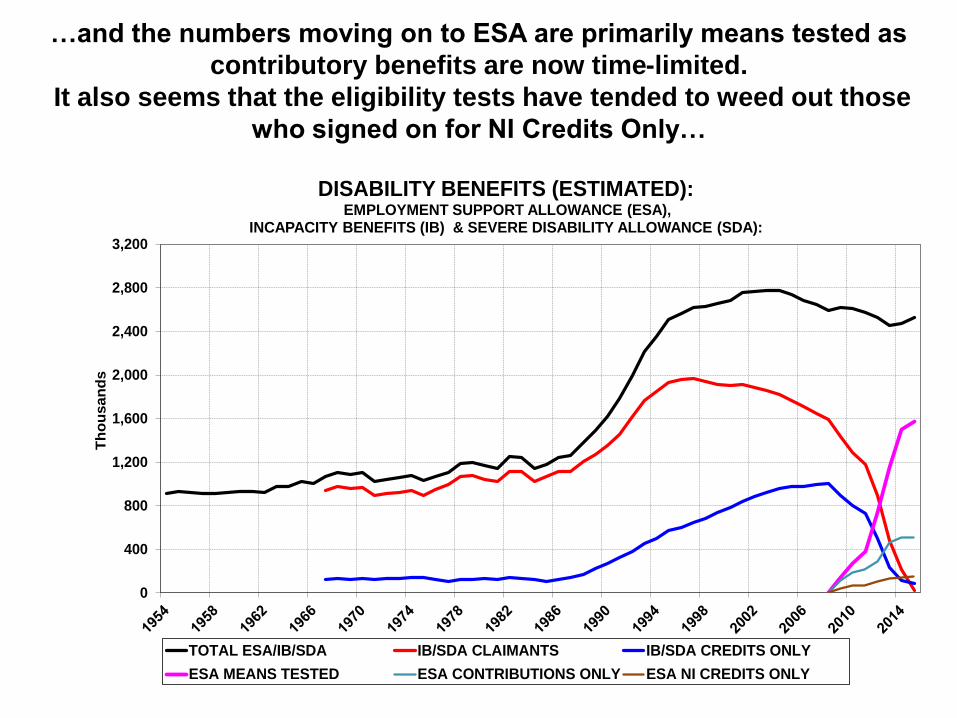
…and the numbers moving on to ESA are primarily means tested as
contributory benefits are now time-limited.
It also seems that the eligibility tests have tended to weed out those
who signed on for NI Credits Only…
0
400
800
1,200
1,600
2,000
2,400
2,800
3,200
Th
ou
san
ds
DISABILITY BENEFITS (ESTIMATED):EMPLOYMENT SUPPORT ALLOWANCE (ESA),
INCAPACITY BENEFITS (IB) & SEVERE DISABILITY ALLOWANCE (SDA):
TOTAL ESA/IB/SDA IB/SDA CLAIMANTS IB/SDA CREDITS ONLY
ESA MEANS TESTED ESA CONTRIBUTIONS ONLY ESA NI CREDITS ONLY

…and administration of ESA is poor. Over 600,000 are either still in the
assessment phase or even unknown - a quarter for more than a year.
And, as the focus is on health not Welfare to Work, most of the 1.67
million who have been assessed – 70% - are in the Support Group.
With nearly 1m already in that group for more than a year..
0
200
400
600
800
1,000
1,200
TH
OU
SA
ND
S
EMPLOYMENT SUPPORT ALLOWANCE (ESA), NUMBERS IN EACH PHASE:
ASSESSMENT PHASE WORK RELATED ACTIVITY GROUP SUPPORT GROUP UNKNOWN

In Northern Ireland since 2008 the JSA position relative to GB has got
much worse. This coincides with a shift away from the GB intervention
regime involving a greater focus on the start of the claim and
employability measures rather than activation/jobsearch. This shift
reverses the trend towards a UK-wide welfare to work approach…
0
1
2
3
4
5
6
7
PER
CEN
T
NORTHERN IRELAND AS % OF GB UNEMPLOYMENT:CLAIMANT COUNT: S.A.
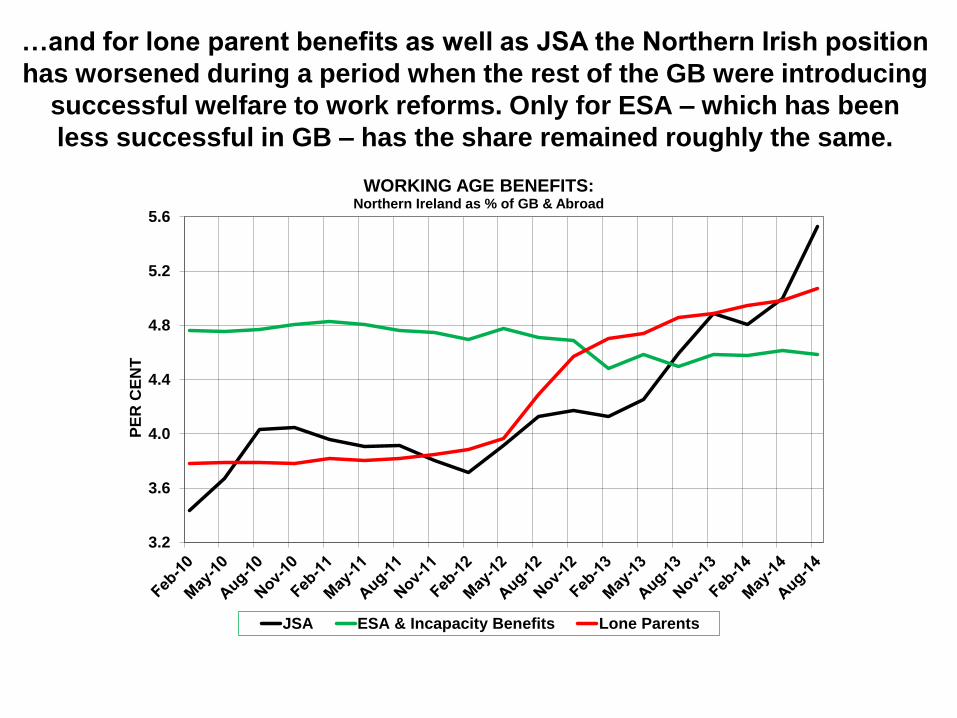
…and for lone parent benefits as well as JSA the Northern Irish position
has worsened during a period when the rest of the GB were introducing
successful welfare to work reforms. Only for ESA – which has been
less successful in GB – has the share remained roughly the same.
3.2
3.6
4.0
4.4
4.8
5.2
5.6
PE
R C
EN
T
WORKING AGE BENEFITS: Northern Ireland as % of GB & Abroad
JSA ESA & Incapacity Benefits Lone Parents
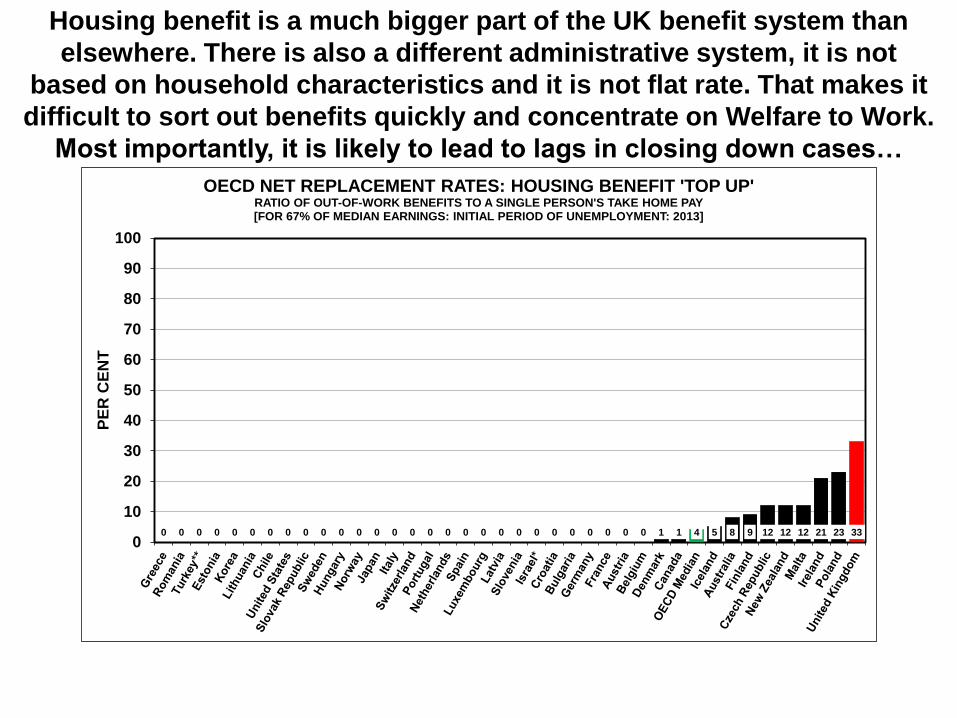
Housing benefit is a much bigger part of the UK benefit system than
elsewhere. There is also a different administrative system, it is not
based on household characteristics and it is not flat rate. That makes it
difficult to sort out benefits quickly and concentrate on Welfare to Work.
Most importantly, it is likely to lead to lags in closing down cases…
0 0 0 0 0 0 0 0 0 0 0 0 0 0 0 0 0 0 0 0 0 0 0 0 0 0 0 0 1 1 4 5 8 9 12 12 12 21 23 33
0
10
20
30
40
50
60
70
80
90
100
PE
R C
EN
T
OECD NET REPLACEMENT RATES: HOUSING BENEFIT 'TOP UP'RATIO OF OUT-OF-WORK BENEFITS TO A SINGLE PERSON'S TAKE HOME PAY[FOR 67% OF MEDIAN EARNINGS: INITIAL PERIOD OF UNEMPLOYMENT: 2013]
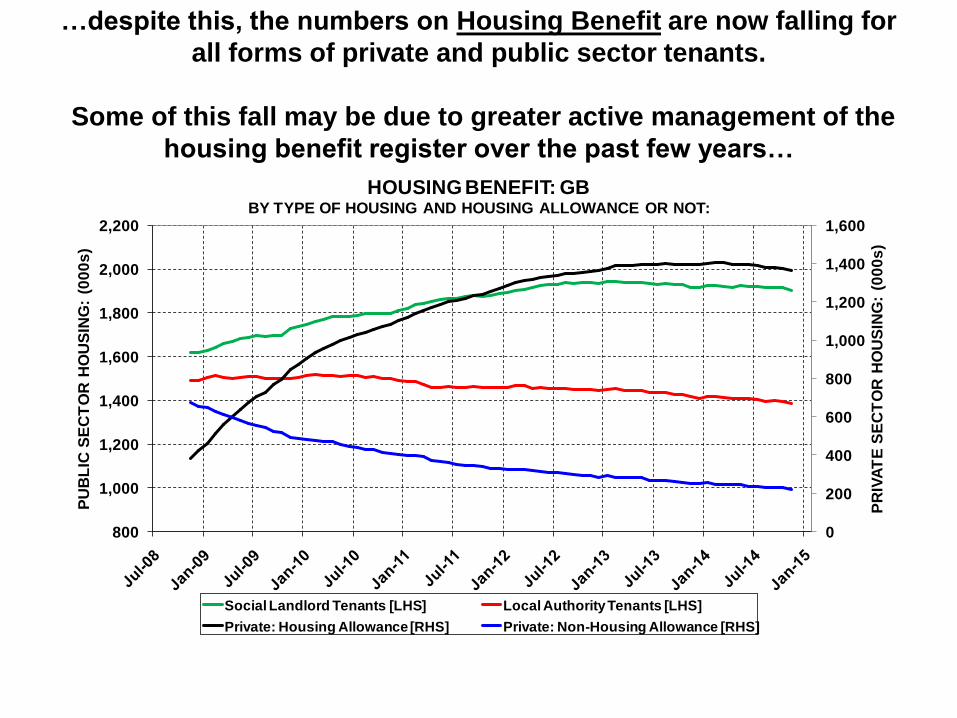
…despite this, the numbers on Housing Benefit are now falling for
all forms of private and public sector tenants.
Some of this fall may be due to greater active management of the
housing benefit register over the past few years…
0
200
400
600
800
1,000
1,200
1,400
1,600
800
1,000
1,200
1,400
1,600
1,800
2,000
2,200
PR
IVA
TE
SE
CT
OR
HO
US
ING
: (0
00
s)
PU
BL
IC S
EC
TO
R H
OU
SIN
G:
(00
0s
)
HOUSING BENEFIT: GBBY TYPE OF HOUSING AND HOUSING ALLOWANCE OR NOT:
Social Landlord Tenants [LHS] Local Authority Tenants [LHS]
Private: Housing Allowance [RHS] Private: Non-Housing Allowance [RHS]
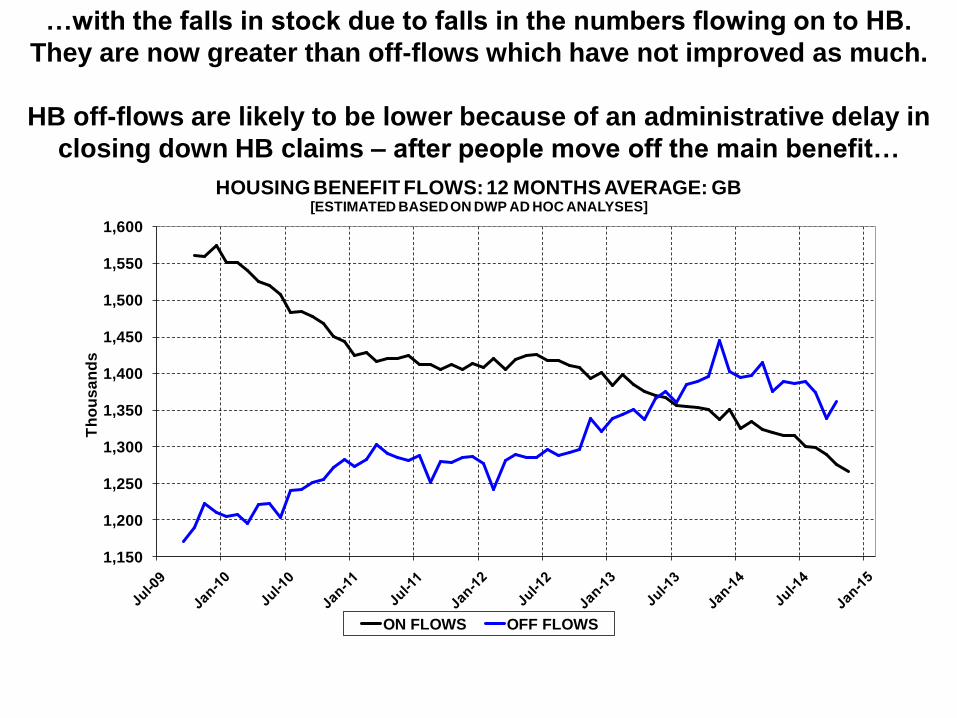
…with the falls in stock due to falls in the numbers flowing on to HB.
They are now greater than off-flows which have not improved as much.
HB off-flows are likely to be lower because of an administrative delay in
closing down HB claims – after people move off the main benefit…
1,150
1,200
1,250
1,300
1,350
1,400
1,450
1,500
1,550
1,600
Th
ou
sa
nd
s
HOUSING BENEFIT FLOWS: 12 MONTHS AVERAGE: GB[ESTIMATED BASED ON DWP AD HOC ANALYSES]
ON FLOWS OFF FLOWS

…and the administrative delay in closing down claims is likely to have
contributed to the continuous rise in HB for those who are in work.
The numbers on Housing Benefits for those Not in Employment have
fallen by over 300 thousand since the start of 2013.
1,600
1,700
1,800
1,900
2,000
2,100
2,200
2,300
2,400
400
500
600
700
800
900
1,000
1,100
1,200
Th
ou
sa
nd
s
Th
ou
sa
nd
s
HOUSING BENEFIT: GBBY WHETHER ATTACHED TO BENEFITS (PASSPORTED) OR NOT:
In Work - Not Attached to Benefits [LHS] HB - Pension Credit Benefits [LHS]
Out of Work - Not Attached to Benefits [LHS] HB - Working Age Out of Work Benefits [RHS]
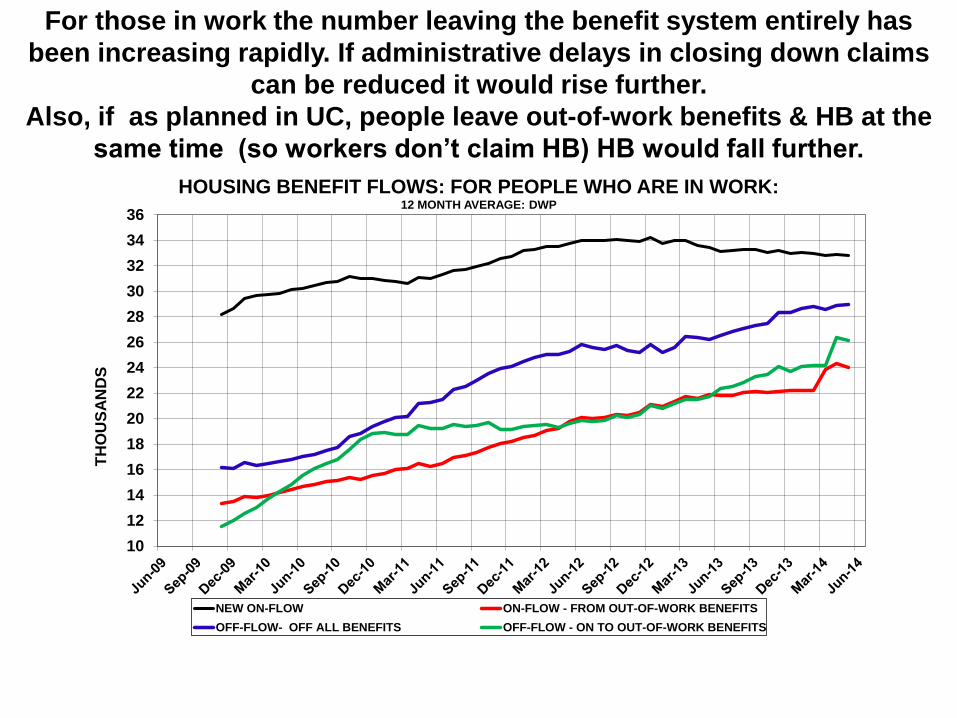
For those in work the number leaving the benefit system entirely has
been increasing rapidly. If administrative delays in closing down claims
can be reduced it would rise further.
Also, if as planned in UC, people leave out-of-work benefits & HB at the
same time (so workers don’t claim HB) HB would fall further.
10
12
14
16
18
20
22
24
26
28
30
32
34
36
TH
OU
SA
ND
S
HOUSING BENEFIT FLOWS: FOR PEOPLE WHO ARE IN WORK:12 MONTH AVERAGE: DWP
NEW ON-FLOW ON-FLOW - FROM OUT-OF-WORK BENEFITS
OFF-FLOW- OFF ALL BENEFITS OFF-FLOW - ON TO OUT-OF-WORK BENEFITS

History suggests that integrating administration of Housing
Benefit with its main benefit might lead to a substantial fall in the
numbers on Housing Benefit for those in work.
• Registrants: >200,000 more than Claimants: Oct 1982
– Despite supposedly measuring the same thing.
• Adult Students: >100,000 in each Autumn1975-88.
– Roughly time when Benefit Offices & Jobcentres were separated
– c. 200,000 1983-85 when did not have to sign on at Jobcentres
in order to get benefit.
• Year after JSA introduced (from Autumn 1986): fell
300-350,000 more than previous year:
– JSA integrated Unemployment Benefit (Contributory) and
Unemployment Benefit (Income Support)
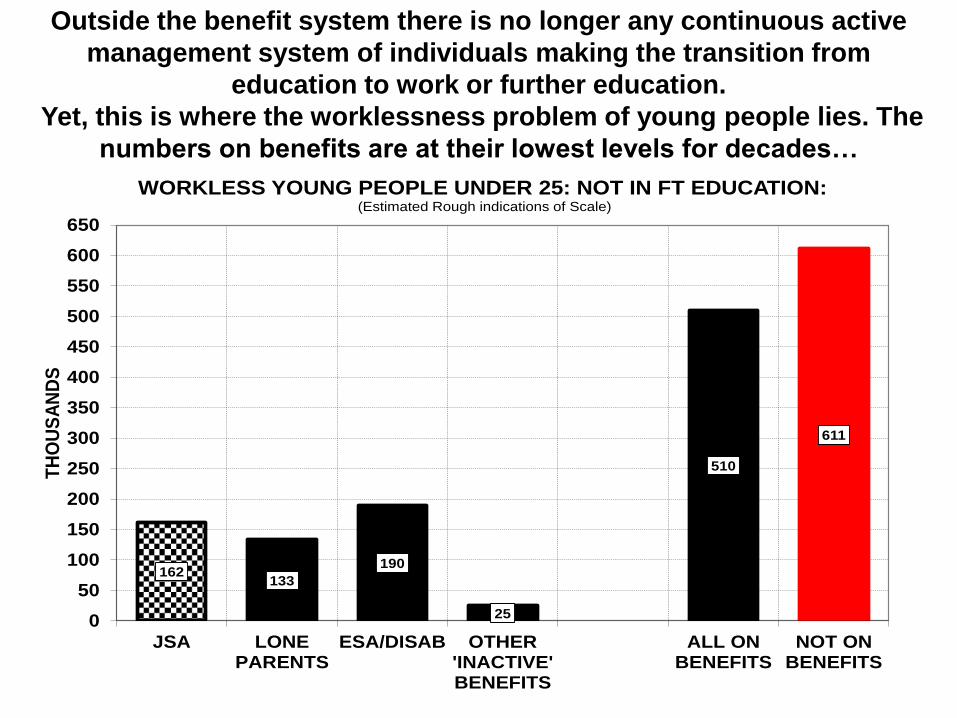
Outside the benefit system there is no longer any continuous active
management system of individuals making the transition from
education to work or further education.
Yet, this is where the worklessness problem of young people lies. The
numbers on benefits are at their lowest levels for decades…
162133
190
25
510
611
0
50
100
150
200
250
300
350
400
450
500
550
600
650
JSA LONEPARENTS
ESA/DISAB OTHER'INACTIVE'BENEFITS
ALL ONBENEFITS
NOT ONBENEFITS
TH
OU
SA
ND
S
WORKLESS YOUNG PEOPLE UNDER 25: NOT IN FT EDUCATION:(Estimated Rough indications of Scale)
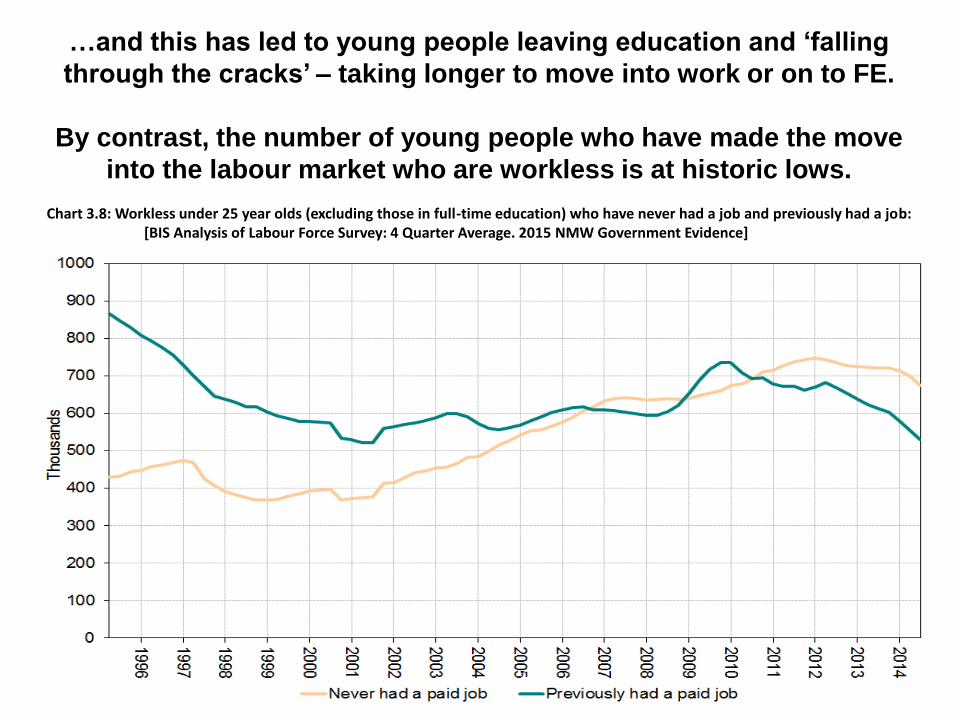
…and this has led to young people leaving education and ‘falling
through the cracks’ – taking longer to move into work or on to FE.
By contrast, the number of young people who have made the move
into the labour market who are workless is at historic lows.
Chart 3.8: Workless under 25 year olds (excluding those in full-time education) who have never had a job and previously had a job: [BIS Analysis of Labour Force Survey: 4 Quarter Average. 2015 NMW Government Evidence]

Also outside the benefit system there is no longer a national job-
matching or career service. For example, not only are students no longer
allowed into Jobcentres but neither are workers looking for better jobs.
This may have contributed to the fall in employment rate of students and
also made it more difficult for workers to move on to better jobs.
-25
-20
-15
-10
-5
0
5
10
PE
RC
EN
TA
GE
PO
INT
S
EMPLOYMENT RATES BY AGE: UNDER 25: IN FULL TIME EDUCATION: %AGE POINT CHANGE SINCE APRIL 1992
16-17 YEARS 18-24 YEARS UNDER 25