binary phase diagrams
TRANSCRIPT

7/16/2019 Binary Phase Diagrams
http://slidepdf.com/reader/full/binary-phase-diagrams-5633867793634 1/90
G. Selvaduray - SJSU
BINARY PHASE DIAGRAMS
Dr. Guna Selvaduray
Materials Engineering ProgramSan Jose State University
San Jose, CA 95192-0086
7/16/2019 Binary Phase Diagrams
http://slidepdf.com/reader/full/binary-phase-diagrams-5633867793634 2/90
G. Selvaduray - SJSU
Utility of Phase Diagrams
Soldering Brazing
Electromigration Diffusion Problems
Kirkendahl Voiding
Corrosion Electrical Resistivity

7/16/2019 Binary Phase Diagrams
http://slidepdf.com/reader/full/binary-phase-diagrams-5633867793634 3/90
G. Selvaduray - SJSU
Limitations to use of PhaseDiagrams
Phase Diagrams are also known asEquilibrium Diagrams
Rate of Transformation is missing
TTT (Time-Temperature-Transformation) diagrams are a
complement to Phase Diagrams

7/16/2019 Binary Phase Diagrams
http://slidepdf.com/reader/full/binary-phase-diagrams-5633867793634 4/90
G. Selvaduray - SJSU
Approach
Approach taken during this course willbe phenomenological
No chemical thermodynamics will beused for derivations

7/16/2019 Binary Phase Diagrams
http://slidepdf.com/reader/full/binary-phase-diagrams-5633867793634 5/90
G. Selvaduray - SJSU
Useful References
1. M. Hansen & K. Anderko, Constitution of Binary Alloys, McGraw-Hill, 1958
2. R.P. Elliot, Constitution of Binary Alloys, First Supplement,McGraw-Hill, 1965
3. F.A. Shunk, Constitution of Binary Alloys, Second Supplement,McGraw-Hill,1969
4. ASM International, ASM Handbook Volume 3: Alloy PhaseDiagrams, 1992
5. R. Hultgren, P.D. Desai, et al, Selected Values of theThermodynamic Properties of Binary Alloys, ASM International,1973

7/16/2019 Binary Phase Diagrams
http://slidepdf.com/reader/full/binary-phase-diagrams-5633867793634 6/90
G. Selvaduray - SJSU
Useful References (cont’d)
6. E.M. Levine, C.R. Robbins & H.F. McMurdie, Phase Diagrams forCeramists, The American Ceramic Society, 1964
7. A. Reisman, Phase Equilibria-Basic Principles, Applications,Experimental Techniques, Academic Press, 1970
8. A. Findlay, The Phase Rule and its Applications, DoverPublications, 1951
9. G. Humpston & D.M. Jacobson, Principles of Soldering and Brazing,ASM International, 1993
7/16/2019 Binary Phase Diagrams
http://slidepdf.com/reader/full/binary-phase-diagrams-5633867793634 7/90
G. Selvaduray - SJSU
What is a “Phase”?
Sand and Salt Coffee and Sugar
Oil and Vinegar
How many phases in each?
7/16/2019 Binary Phase Diagrams
http://slidepdf.com/reader/full/binary-phase-diagrams-5633867793634 8/90
G. Selvaduray - SJSU
What is a “Phase”? (cont’d)
A phase is a homogenous, physically distinct andmechanically separable portion of the material with agiven chemical composition and structure.
For solids: Chemically and structurally distinct
For liquids: Miscibility
For gases: Always 1 phase

7/16/2019 Binary Phase Diagrams
http://slidepdf.com/reader/full/binary-phase-diagrams-5633867793634 9/90
G. Selvaduray - SJSU
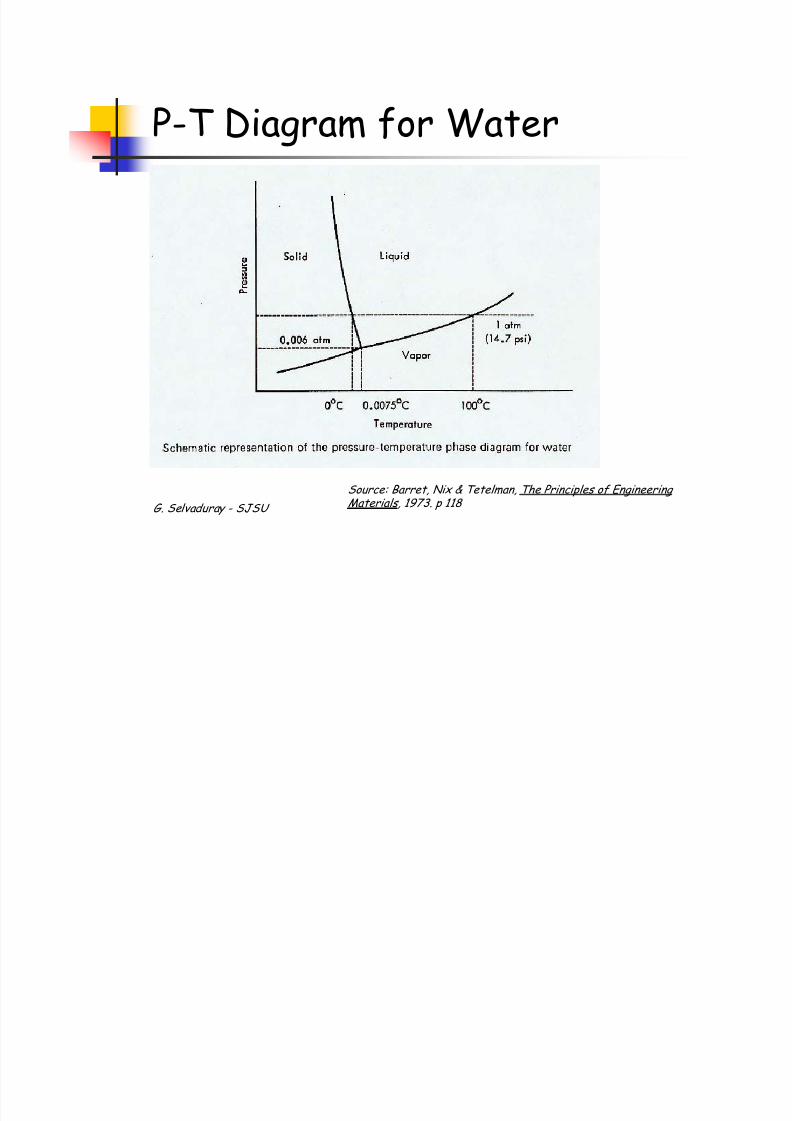
One Component Phase Diagram
The simplest case-WaterAlso known as a P-T diagram
Sign of [dP/dT] for:
Solid-Liquid
Liquid-Gas
Gas-Solidequilibria
7/16/2019 Binary Phase Diagrams
http://slidepdf.com/reader/full/binary-phase-diagrams-5633867793634 10/90
G. Selvaduray - SJSU
P-T Diagram for Water
Source: Barret, Nix & Tetelman, The Principles of Engineering Materials, 1973. p 118
7/16/2019 Binary Phase Diagrams
http://slidepdf.com/reader/full/binary-phase-diagrams-5633867793634 11/90
G. Selvaduray - SJSU
One Component Phase Diagram
Region Number of Phases Degrees of Freedom
The Gibbs Phase Rule
P + F = C + 2

7/16/2019 Binary Phase Diagrams
http://slidepdf.com/reader/full/binary-phase-diagrams-5633867793634 12/90
G. Selvaduray - SJSU
The Quasi-Chemical Approach
Understanding interactions on bond energiesInteraction between 2 species: A and B
A-A and B-B bonds
Thermodynamic Parameter: Melting Point (T)
How does mixing of A-A and B-B bonds affect T?

7/16/2019 Binary Phase Diagrams
http://slidepdf.com/reader/full/binary-phase-diagrams-5633867793634 13/90
G. Selvaduray - SJSU
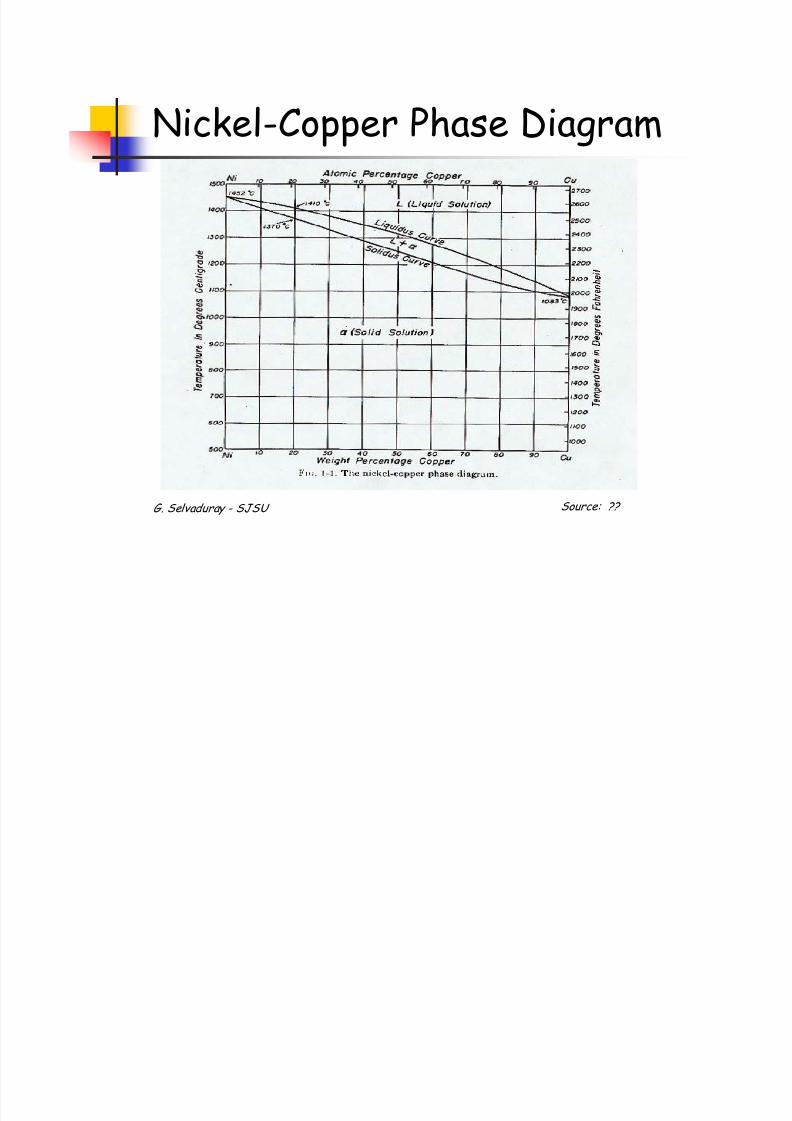
The Ideal Case
(A-B) = x(A-A) + (1-x) (B-B)
Where x is the mole fraction of A in B
T Alloy = T A + x ( T B - T A)
Examples:
Copper – NickelSilicon – Germanium
7/16/2019 Binary Phase Diagrams
http://slidepdf.com/reader/full/binary-phase-diagrams-5633867793634 14/90
G. Selvaduray - SJSU
Nickel-Copper Phase Diagram
Source: ??

7/16/2019 Binary Phase Diagrams
http://slidepdf.com/reader/full/binary-phase-diagrams-5633867793634 15/90
G. Selvaduray - SJSU
Germanium-Silicon PhaseDiagram
Source: Barret, Nix & Tetelman, The Principles of Engineering Materials, 1973. p 125

7/16/2019 Binary Phase Diagrams
http://slidepdf.com/reader/full/binary-phase-diagrams-5633867793634 16/90
G. Selvaduray - SJSU
Hume Rothery Rules
1. Relative Size Ratio ±15%2. Crystal Structure-must be the same
3. Electronegativity Difference – within
± 0.4 e.u.
4. Valence must be the same

7/16/2019 Binary Phase Diagrams
http://slidepdf.com/reader/full/binary-phase-diagrams-5633867793634 17/90
G. Selvaduray - SJSU
Eutectic Behavior
A-B < 0.5 (A-A + B-B)
T Alloy
< T A
, T B
Examples:
Lead - TinGold - Silicon

7/16/2019 Binary Phase Diagrams
http://slidepdf.com/reader/full/binary-phase-diagrams-5633867793634 18/90
G. Selvaduray - SJSU
Tin-Lead Phase Diagram
Source: Barret, Nix & Tetelman, The Principles of Engineering Materials, 1973. p 128

7/16/2019 Binary Phase Diagrams
http://slidepdf.com/reader/full/binary-phase-diagrams-5633867793634 19/90
G. Selvaduray - SJSU
Gold-Silicon Phase Diagram
Hansen & Anderko, Constitution of Binary Alloys, 1958. p. 232

7/16/2019 Binary Phase Diagrams
http://slidepdf.com/reader/full/binary-phase-diagrams-5633867793634 20/90
G. Selvaduray - SJSU
Gold-Germanium Phase Diagram
Hansen & Anderko, Constitution of Binary Alloys, 1958. p. 206

7/16/2019 Binary Phase Diagrams
http://slidepdf.com/reader/full/binary-phase-diagrams-5633867793634 21/90
G. Selvaduray - SJSU
Intermetallic CompoundFormation
A-B > 0.5 (A-A + B-B)
T Alloy
> T A
, T B
Example:
Gallium -Arsenic

7/16/2019 Binary Phase Diagrams
http://slidepdf.com/reader/full/binary-phase-diagrams-5633867793634 22/90
G. Selvaduray - SJSU
Arsenic-Gallium Phase Diagram
Hansen & Anderko, Constitution of Binary Alloys, 1958. p. 165

7/16/2019 Binary Phase Diagrams
http://slidepdf.com/reader/full/binary-phase-diagrams-5633867793634 23/90
G. Selvaduray - SJSU
Working with Phase Diagrams
Overall Composition Solidus Liquidus Limits of Solid Solubility Chemical Composition of Phases at any temperature Amount of Phases at any temperature Invariant Reactions Development of Microstructure Chemical Activity

7/16/2019 Binary Phase Diagrams
http://slidepdf.com/reader/full/binary-phase-diagrams-5633867793634 24/90
G. Selvaduray - SJSU
Copper-Silver Phase Diagram
Source: Callister, Materials Science and Engineering: An Introduction, 2000. p. 256

7/16/2019 Binary Phase Diagrams
http://slidepdf.com/reader/full/binary-phase-diagrams-5633867793634 25/90
G. Selvaduray - SJSU
Solidus and Liquidus
SolidusTemperature at which alloy is completelysolid
Temperature at which liquefaction beginsLiquidusTemperature at which alloy is completely
liquidTemperature at which solidification begins

7/16/2019 Binary Phase Diagrams
http://slidepdf.com/reader/full/binary-phase-diagrams-5633867793634 26/90
G. Selvaduray - SJSU
Overall Composition
Concentration: Relative amounts of eachconstituent
It is the horizontal axis in all binary
phase diagramsThe scale can be in weight %, atomic %or mole %

7/16/2019 Binary Phase Diagrams
http://slidepdf.com/reader/full/binary-phase-diagrams-5633867793634 27/90
G. Selvaduray - SJSU
Chemical Composition of Phases
It is the chemical composition of eachphase in the system
In a system having more than one phase,
each phase will have a unique chemicalcomposition which will be different fromeach other, and will also be different from
the overall compositionNot to be confused with overallcomposition
7/16/2019 Binary Phase Diagrams
http://slidepdf.com/reader/full/binary-phase-diagrams-5633867793634 28/90
G. Selvaduray - SJSU
Solid Solutions
What is a solid solution?
When foreign atoms are incorporated into a crystal structure,whether in substitutional or interstitial sites, the resultingphase is a solid solution of the matrix material (solvent) and
the foreign atoms (solute)Substitutional Solid Solution: Foreign (solute) atoms occupy
“normal” lattice sites occupied by matrix (solvent) atoms,e.g. Cu-Ni;Ge-Si
Interstitial Solid Solutions: Foreign (solute) atoms occupyinterstitial sites, e.g., Fe-C

7/16/2019 Binary Phase Diagrams
http://slidepdf.com/reader/full/binary-phase-diagrams-5633867793634 29/90
G. Selvaduray - SJSU Source: Barret, Nix & Tetelman, The Principles of Engineering Materials, 1973. p 72

7/16/2019 Binary Phase Diagrams
http://slidepdf.com/reader/full/binary-phase-diagrams-5633867793634 30/90
G. Selvaduray - SJSU
Types of Solid Solubility
Unlimited Solid Solubility: Solute and solvent are mutuallysoluble at all concentrations, e.g., Cu-Ni system
Meets the requirements of the Hume-Rothery Rules
Result is a “single phase alloy”
Limited or Partial Solid Solubility: There is a limit to how muchof the solute can dissolve in the solvent before “saturation” isreached, e.g., Pb-Sn and most other systems
Does not meet the requirements of the Hume-Rothery RulesResults in a “multi-phase alloy”

7/16/2019 Binary Phase Diagrams
http://slidepdf.com/reader/full/binary-phase-diagrams-5633867793634 31/90
G. Selvaduray - SJSU
Amount of each phase
Dependent on the Overall Compositionand Temperature
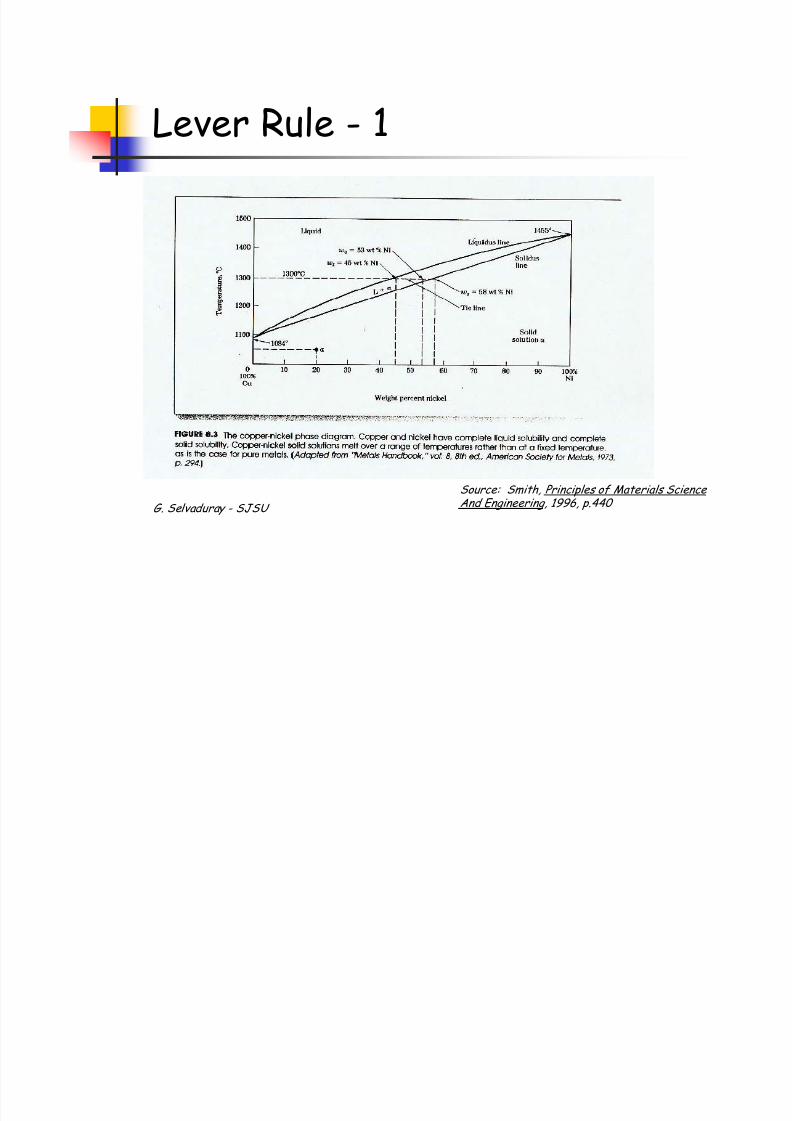
The (Inverse) Lever Rule
Tie-Lines
7/16/2019 Binary Phase Diagrams
http://slidepdf.com/reader/full/binary-phase-diagrams-5633867793634 32/90
G. Selvaduray - SJSU
Lever Rule - 1
Source: Smith, Principles of Materials Science And Engineering, 1996, p.440

7/16/2019 Binary Phase Diagrams
http://slidepdf.com/reader/full/binary-phase-diagrams-5633867793634 33/90
G. Selvaduray - SJSU
Cu-Ni Phase Diagram
Source: Callister, Materials Science and Engineering: An Introduction, 2000. p. 247

7/16/2019 Binary Phase Diagrams
http://slidepdf.com/reader/full/binary-phase-diagrams-5633867793634 34/90
G. Selvaduray - SJSU
Example Problem 1
One kilogram of an alloy of 70% Pb and 30% Sn isslowly cooled from 300ºC. Calculate thefollowing:
a) Weight % of liquid and α at 250ºC
b) Chemical composition of the liquid and α at 250ºC
c) Weight % of the liquid and α just above the eutectictemperature
d) Chemical composition of the liquid and α at just abovethe eutectic temperature

7/16/2019 Binary Phase Diagrams
http://slidepdf.com/reader/full/binary-phase-diagrams-5633867793634 35/90
G. Selvaduray - SJSU
Pb-Sn Phase Diagram
Source: Callister, Materials Science and Engineering: An Introduction, 2000. p. 258

7/16/2019 Binary Phase Diagrams
http://slidepdf.com/reader/full/binary-phase-diagrams-5633867793634 36/90
G. Selvaduray - SJSU
Invariant Reactions
Eutectic: L = α (s) + β (s); e.g., Pb-Sn
Peritectic: α (s) + L = β (s); e.g., Pb-In
Monotectic: L1 = α (s) + L2; e.g., Cu-Pb
Syntectic: L1 + L2 = α (s); e.g., Na-Zn
Metatectic: β (s) + α (s) = L1 e.g., U-Mn

7/16/2019 Binary Phase Diagrams
http://slidepdf.com/reader/full/binary-phase-diagrams-5633867793634 37/90
G. Selvaduray - SJSU
Pb-In Phase Diagram
Hansen & Anderko, Constitution of Binary Alloys, 1958. p. 855

7/16/2019 Binary Phase Diagrams
http://slidepdf.com/reader/full/binary-phase-diagrams-5633867793634 38/90
G. Selvaduray - SJSU
Cu-Pb Phase Diagram
Hansen & Anderko, Constitution of Binary Alloys, 1958. p. 610

7/16/2019 Binary Phase Diagrams
http://slidepdf.com/reader/full/binary-phase-diagrams-5633867793634 39/90
G. Selvaduray - SJSU
Microstructure Development
The microstructure developed depends onthe overall composition and the cooling
rate

7/16/2019 Binary Phase Diagrams
http://slidepdf.com/reader/full/binary-phase-diagrams-5633867793634 40/90
G. Selvaduray - SJSU
Composition dependence ofmicrostructure
Source: Askeland, The Science & Engineering Of Materials, 1984, p 246
d d f

7/16/2019 Binary Phase Diagrams
http://slidepdf.com/reader/full/binary-phase-diagrams-5633867793634 41/90
G. Selvaduray - SJSU
Composition dependence ofmicrostructure
Source: Askeland, The Science & Engineering Of Materials, 1984, p 249
C i i d d f

7/16/2019 Binary Phase Diagrams
http://slidepdf.com/reader/full/binary-phase-diagrams-5633867793634 42/90
G. Selvaduray - SJSU
Composition dependence ofmicrostructure
Source: Askeland, The Science & Engineering Of Materials, 1984, p 248
C i i d d f

7/16/2019 Binary Phase Diagrams
http://slidepdf.com/reader/full/binary-phase-diagrams-5633867793634 43/90
G. Selvaduray - SJSU
Composition dependence ofmicrostructure
Source: Askeland, The Science & Engineering Of Materials, 1984, p 248

7/16/2019 Binary Phase Diagrams
http://slidepdf.com/reader/full/binary-phase-diagrams-5633867793634 44/90
G. Selvaduray - SJSU
Example Problem 2
For the 70% Pb and 30% Sn alloy, calculate:(a) The weight percent of alpha and beta phasesat 100ºC
(b) The chemical composition of the α and βphases at 100ºC
(c) Amount of primary and secondary α
(d) Amount ofα
formed during the eutectic reaction

7/16/2019 Binary Phase Diagrams
http://slidepdf.com/reader/full/binary-phase-diagrams-5633867793634 45/90
G. Selvaduray - SJSU
Chemical Activity
What is activity?
A measure of the “escaping tendency”
Activity = 1 if species is in its standard
state (pure, most stable form, attemperature of interest)
What is the activity of a species in a
solution?Activity (a) =Activity Coefficient x MoleFraction

7/16/2019 Binary Phase Diagrams
http://slidepdf.com/reader/full/binary-phase-diagrams-5633867793634 46/90
G. Selvaduray - SJSU
Activity Determinations
IDEAL CASE: Activity Coefficient = 1
Therefore: Activity = Mole Fraction; e.g., Cu-Ni
NON-IDEAL CASE:
Positive Deviation: a>aid, i.e., activity coefficient>1e.g. Pb-Sn
Negative Deviation: a<aid, i.e., activity coefficient<1
e.g. Ga-As

7/16/2019 Binary Phase Diagrams
http://slidepdf.com/reader/full/binary-phase-diagrams-5633867793634 47/90
G. Selvaduray - SJSU Source: Gaskell, Introduction to Thermodynamics Of Materials, 1973

7/16/2019 Binary Phase Diagrams
http://slidepdf.com/reader/full/binary-phase-diagrams-5633867793634 48/90
G. Selvaduray - SJSU
Example Problem 3
Draw an activity-composition diagram forthe Cu-Ni system at 1200ºC
Draw an activity-composition diagram forthe Ga-As system at 400ºC
SJSU-Selvaduray

7/16/2019 Binary Phase Diagrams
http://slidepdf.com/reader/full/binary-phase-diagrams-5633867793634 49/90
G. Selvaduray - SJSU
Intermetallic Compounds
Line compounds Stoichiometric Ratio
Stoichiometric Range
SJSU-Selvaduray

7/16/2019 Binary Phase Diagrams
http://slidepdf.com/reader/full/binary-phase-diagrams-5633867793634 50/90
G. Selvaduray - SJSU
Au-Sn Phase Diagram
Hansen & Anderko, Constitution of Binary Alloys, 1958. p. 233
7/16/2019 Binary Phase Diagrams
http://slidepdf.com/reader/full/binary-phase-diagrams-5633867793634 51/90
G. Selvaduray - SJSU
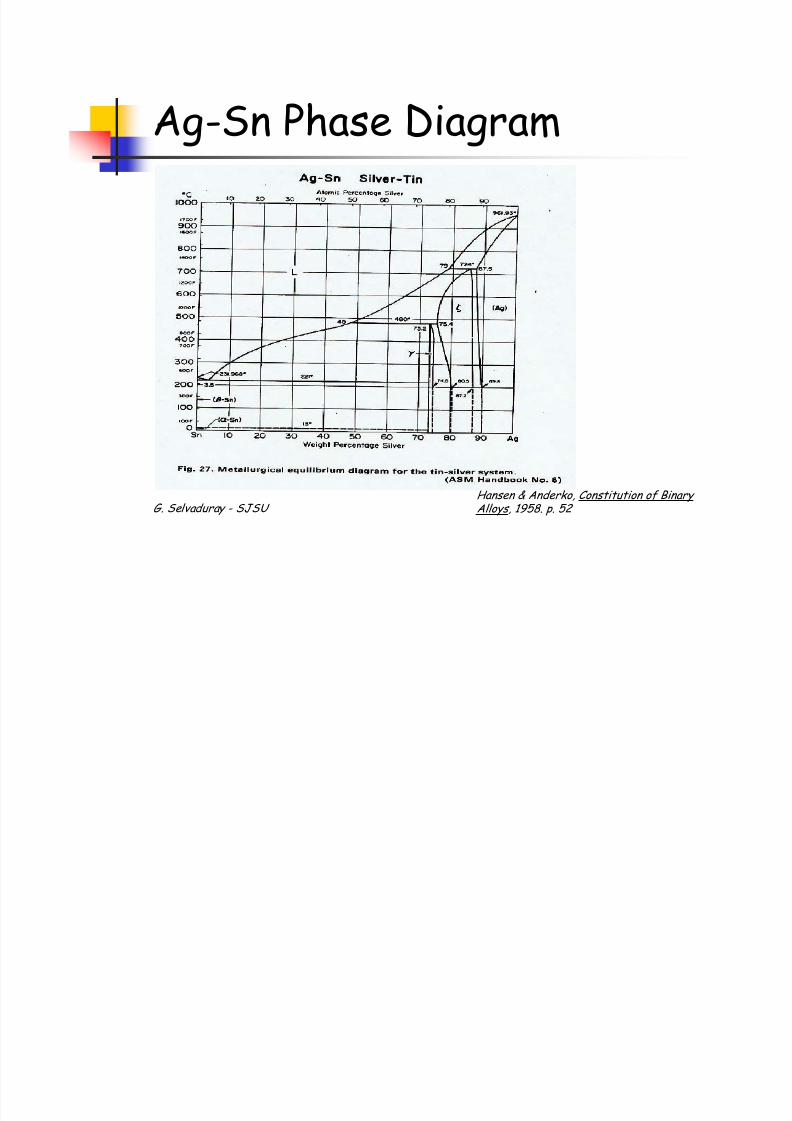
Ag-Sn Phase Diagram
Hansen & Anderko, Constitution of Binary Alloys, 1958. p. 52
U i Ph Di t

7/16/2019 Binary Phase Diagrams
http://slidepdf.com/reader/full/binary-phase-diagrams-5633867793634 52/90
G. Selvaduray - SJSU
Using Phase Diagrams todetermine Heat Treatability
Heat Treatment is based on“controlling” the solid statetransformation rate Heat treatment of steels: control of the
eutectoid reaction Age hardening (precipitation strengthening)
of aluminum alloys: control of precipitation
reaction

7/16/2019 Binary Phase Diagrams
http://slidepdf.com/reader/full/binary-phase-diagrams-5633867793634 53/90
G. Selvaduray - SJSU
Heat Treatment of Steels
The eutectoid reaction Martensite
Austenite
Pearlite TTT diagrams

7/16/2019 Binary Phase Diagrams
http://slidepdf.com/reader/full/binary-phase-diagrams-5633867793634 54/90
G. Selvaduray - SJSU
Fe-C Phase Diagram
Source: Barret, Nix & Tetelman, The Principles of Engineering
Materials, 1973. p 1305
7/16/2019 Binary Phase Diagrams
http://slidepdf.com/reader/full/binary-phase-diagrams-5633867793634 55/90
G. Selvaduray - SJSU
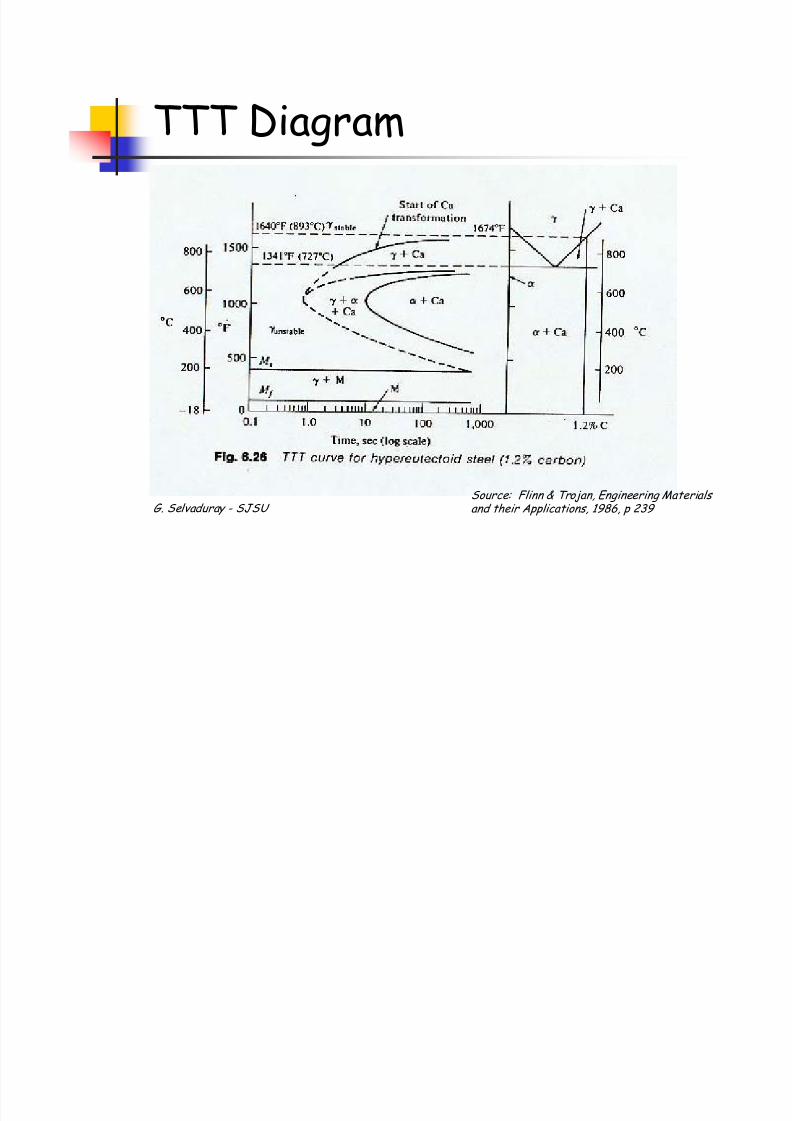
TTT Diagram
Source: Flinn & Trojan, Engineering Materials and their Applications, 1986, p 239
Age Hardening/Precipitation

7/16/2019 Binary Phase Diagrams
http://slidepdf.com/reader/full/binary-phase-diagrams-5633867793634 56/90
G. Selvaduray - SJSU
Age Hardening/PrecipitationStrengthening
Particularly relevant for aluminum alloys,e.g., aluminum lines on ICs
Phase diagrams tell us if an alloy system
is age-hardenable, and the compositionrange over which the alloy system isage-hardenable
Al-Cu system

7/16/2019 Binary Phase Diagrams
http://slidepdf.com/reader/full/binary-phase-diagrams-5633867793634 57/90
G. Selvaduray - SJSU
Age Hardening Al Alloys
Source: Askeland, The Science & Engineering
Of Materials, 1984, p 281

7/16/2019 Binary Phase Diagrams
http://slidepdf.com/reader/full/binary-phase-diagrams-5633867793634 58/90
G. Selvaduray - SJSU
Al-Cu Phase Diagram
Source: Hansen & Anderko, Constitution of Binary Alloys, 1958. p. 85

7/16/2019 Binary Phase Diagrams
http://slidepdf.com/reader/full/binary-phase-diagrams-5633867793634 59/90
G. Selvaduray - SJSU
Heat Treatment vs Strength
Source: ??
7/16/2019 Binary Phase Diagrams
http://slidepdf.com/reader/full/binary-phase-diagrams-5633867793634 60/90
G. Selvaduray - SJSU
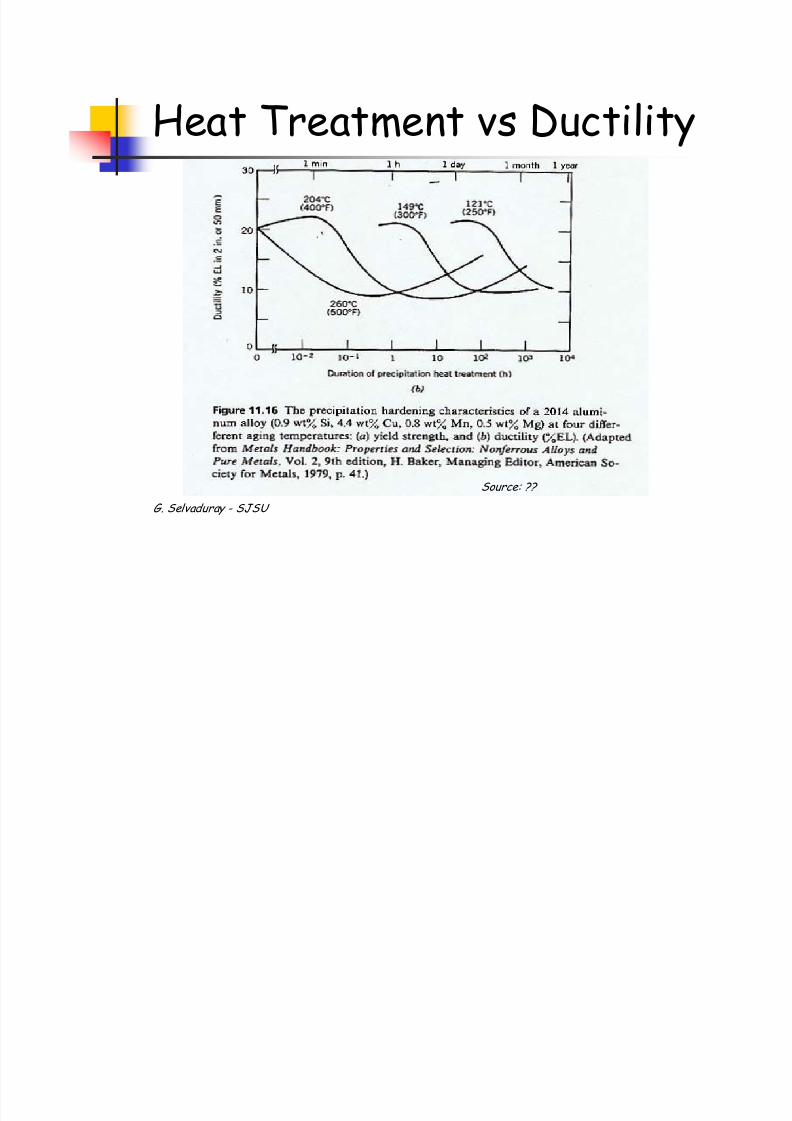
Heat Treatment vs Ductility
Source: ??
Coherent & Incoherent

7/16/2019 Binary Phase Diagrams
http://slidepdf.com/reader/full/binary-phase-diagrams-5633867793634 61/90
G. Selvaduray - SJSU
Coherent & Incoherent
Precipitates
Source: ??
Effect of aging on

7/16/2019 Binary Phase Diagrams
http://slidepdf.com/reader/full/binary-phase-diagrams-5633867793634 62/90
G. Selvaduray - SJSU
Effect of aging onElectromigration
Critical parameter: densityppt vs densitymatrix
If densityppt > densitymatrix
Region of compression is created around the ppt
Driving force is for migration of matrix atoms awayfrom ppt
If densityppt < densitymatrix
Region of tension is created around the ppt
Driving force of for migration of matrix atomstowards the ppt

7/16/2019 Binary Phase Diagrams
http://slidepdf.com/reader/full/binary-phase-diagrams-5633867793634 63/90
G. Selvaduray - SJSU
Lead Frame Alloys
Alloy 42Copper alloy lead frames
Kovar
Lead Frame Alloy

7/16/2019 Binary Phase Diagrams
http://slidepdf.com/reader/full/binary-phase-diagrams-5633867793634 64/90
G. Selvaduray - SJSU
L a Fram y
Compositions
Source: Electronic Materials Handbook Volume 1: Packaging, ASM International, 1989, p. 490

7/16/2019 Binary Phase Diagrams
http://slidepdf.com/reader/full/binary-phase-diagrams-5633867793634 65/90
G. Selvaduray - SJSU
Fe-NiPhaseDiagram
Source: Hansen & Anderko,Constitution of Binary Alloys, 1958. p. 85

7/16/2019 Binary Phase Diagrams
http://slidepdf.com/reader/full/binary-phase-diagrams-5633867793634 66/90
G. Selvaduray - SJSU
Fe-CuPhaseDiagram
Source: Hansen & Anderko,Constitution of Binary Alloys, 1958. p. 581

7/16/2019 Binary Phase Diagrams
http://slidepdf.com/reader/full/binary-phase-diagrams-5633867793634 67/90
G. Selvaduray - SJSU
Source: Hansen & Anderko,Constitution of Binary Alloys, 1958. p. 634
Cu-SnPhase
Diagram
7/16/2019 Binary Phase Diagrams
http://slidepdf.com/reader/full/binary-phase-diagrams-5633867793634 68/90
G. Selvaduray - SJSU
Example Problem 4
Will the age hardening processcharacteristics affect the electricalresistivity (or conductivity) of lead
frames?Will the conductivity increase or decreasewith overaging?
Application of Phase Diagrams
7/16/2019 Binary Phase Diagrams
http://slidepdf.com/reader/full/binary-phase-diagrams-5633867793634 69/90
G. Selvaduray - SJSU
pp g
to Diffusion
Fick’s First Law: J = -D [dc/dx]
[dc/dx] is the concentration gradient anddriving force for diffusion
It this were true, multiphase alloys suchas Pb-Sn alloys must “self-homogenize”over time and transform into a single
phase alloy
Activity: Driving Force for

7/16/2019 Binary Phase Diagrams
http://slidepdf.com/reader/full/binary-phase-diagrams-5633867793634 70/90
G. Selvaduray - SJSU
y g
DiffusionThe driving force for diffusion to occur isthe activity difference
In the case of Pb-Sn alloys, the phases are:
α (Pb rich) and β (Sn rich)Diffusion of a species from one phase intoanother will not occur if:
aSn (beta) = aSn (alpha)aPb (beta) = aPb (alpha)

7/16/2019 Binary Phase Diagrams
http://slidepdf.com/reader/full/binary-phase-diagrams-5633867793634 71/90
G. Selvaduray - SJSU
Relevance of solid solubility limits
Phase diagrams also tell us the maximumextent to which one species can diffuseinto another
This is given by the solid solubility limitsat the temperature of interest
The Cu-Ni example in standardtextbooks is most often not applicable

7/16/2019 Binary Phase Diagrams
http://slidepdf.com/reader/full/binary-phase-diagrams-5633867793634 72/90
G. Selvaduray - SJSU
Kirkendahl Voiding
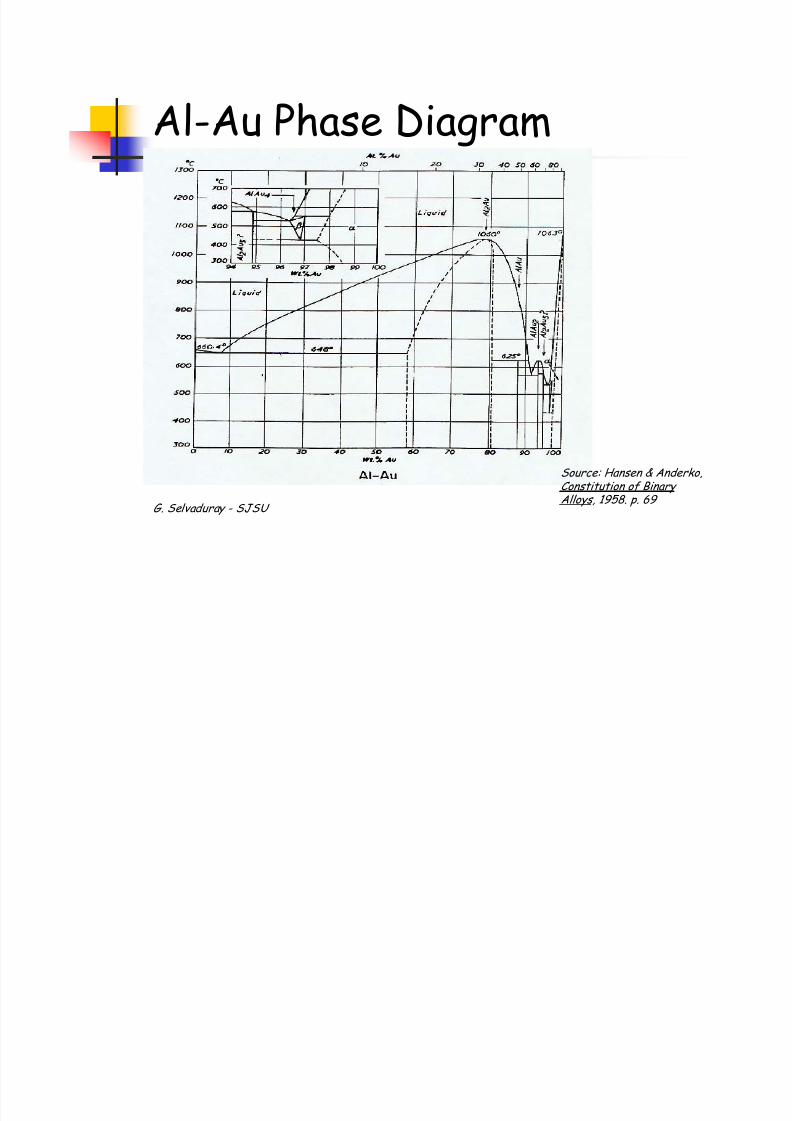
If there is a major difference in solidsolubility limits, voiding can be expected tooccur in the phase that permits less solidsolubility
e.g., the Al-Au system
Interdiffusion does not necessarily occur atthe same rate
7/16/2019 Binary Phase Diagrams
http://slidepdf.com/reader/full/binary-phase-diagrams-5633867793634 73/90
G. Selvaduray - SJSU
Al-Au Phase Diagram
Source: Hansen & Anderko,Constitution of Binary
Alloys, 1958. p. 69
Effect of composition on

7/16/2019 Binary Phase Diagrams
http://slidepdf.com/reader/full/binary-phase-diagrams-5633867793634 74/90
G. Selvaduray - SJSU
p
properties
Mechanical Properties
Electrical Resistivity

7/16/2019 Binary Phase Diagrams
http://slidepdf.com/reader/full/binary-phase-diagrams-5633867793634 75/90
G. Selvaduray - SJSU
Composition vs Strength
Source: ??

7/16/2019 Binary Phase Diagrams
http://slidepdf.com/reader/full/binary-phase-diagrams-5633867793634 76/90
G. Selvaduray - SJSU
Composition vs Resistivity
Source: Askeland, The Science & Engineering
Of Materials, 1984, p 563

7/16/2019 Binary Phase Diagrams
http://slidepdf.com/reader/full/binary-phase-diagrams-5633867793634 77/90
G. Selvaduray - SJSU
Source: Askeland, The Science & Engineering
Of Materials, 1984, p 565
Determination of Phase

7/16/2019 Binary Phase Diagrams
http://slidepdf.com/reader/full/binary-phase-diagrams-5633867793634 78/90
G. Selvaduray - SJSU
Diagrams Cooling Curves Differential Scanning Calorimetry Thermomechanical Analysis Differential Thermal Analysis Metallography/Petrography Energy Dispersive X-ray Spectroscopy Electron Microprobe Analyzer X-ray Diffraction Transmission Electron Microscopy

7/16/2019 Binary Phase Diagrams
http://slidepdf.com/reader/full/binary-phase-diagrams-5633867793634 79/90
G. Selvaduray - SJSU
Cooling Curves
Source: Smith, Principles of Materials Science
And Engineering, 1996, p.441
Experimental measurement of

7/16/2019 Binary Phase Diagrams
http://slidepdf.com/reader/full/binary-phase-diagrams-5633867793634 80/90
G. Selvaduray - SJSU
∆Hm from DSC

7/16/2019 Binary Phase Diagrams
http://slidepdf.com/reader/full/binary-phase-diagrams-5633867793634 81/90
G. Selvaduray - SJSU
Mg-SiPhaseDiagram
Source: Hansen & Anderko,Constitution of Binary Alloys, 1958. p. 917

7/16/2019 Binary Phase Diagrams
http://slidepdf.com/reader/full/binary-phase-diagrams-5633867793634 82/90
G. Selvaduray - SJSU
Al-SiPhaseDiagram
Source: Hansen & Anderko,Constitution of Binary Alloys, 1958. p. 133

7/16/2019 Binary Phase Diagrams
http://slidepdf.com/reader/full/binary-phase-diagrams-5633867793634 83/90
G. Selvaduray - SJSU
Source: Hansen & Anderko,Constitution of Binary Alloys, 1958. p. 106
Al-MgPhaseDiagram

7/16/2019 Binary Phase Diagrams
http://slidepdf.com/reader/full/binary-phase-diagrams-5633867793634 84/90
G. Selvaduray - SJSU
Cr-Mo Phase Diagram
Source: Hansen & Anderko,Constitution of Binary
Alloys, 1958. p. 538
7/16/2019 Binary Phase Diagrams
http://slidepdf.com/reader/full/binary-phase-diagrams-5633867793634 85/90
G. Selvaduray - SJSU
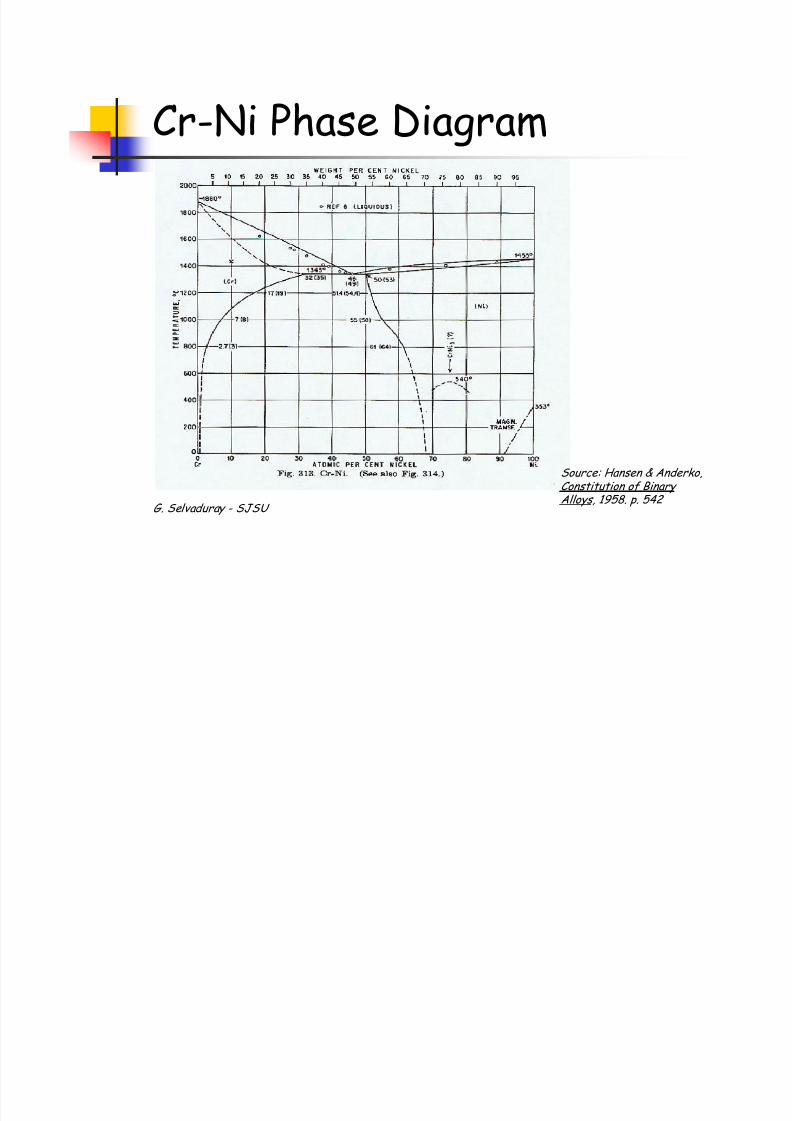
Cr-Ni Phase Diagram
Source: Hansen & Anderko,Constitution of Binary Alloys, 1958. p. 542

7/16/2019 Binary Phase Diagrams
http://slidepdf.com/reader/full/binary-phase-diagrams-5633867793634 86/90
G. Selvaduray - SJSU
Source: Hansen & Anderko,Constitution of Binary Alloys, 1958. p. 968
Mo-NiPhaseDiagram

7/16/2019 Binary Phase Diagrams
http://slidepdf.com/reader/full/binary-phase-diagrams-5633867793634 87/90
G. Selvaduray - SJSU
Au-Si Phase Diagram
Source: Hansen & Anderko,Constitution of Binary Alloys, 1958. p. 232

7/16/2019 Binary Phase Diagrams
http://slidepdf.com/reader/full/binary-phase-diagrams-5633867793634 88/90
G. Selvaduray - SJSU
Source: Hansen & Anderko,Constitution of Binary Alloys, 1958. p. 233
Au-SnPhase
Diagram
T Ph D
7/16/2019 Binary Phase Diagrams
http://slidepdf.com/reader/full/binary-phase-diagrams-5633867793634 89/90
G. Selvaduray - SJSU
Ternary Phase Diagrams
Three components
Overall composition
Number of phases
Chemical composition of each phase Amount of each phase
Solidification sequence
SJSU-Selvaduray
E l P bl 5
7/16/2019 Binary Phase Diagrams
http://slidepdf.com/reader/full/binary-phase-diagrams-5633867793634 90/90
G. Selvaduray - SJSU
Example Problem 5
What is the maximum number of phasesthat can exist in a ternary system?
SJSU-Selvaduray