bio-based polymers in the · pdf filebio-based polymers in the world capacities,production and...
TRANSCRIPT
Market study on
Edited by: Adriana Sanz Mirabal, Lena Scholz, Michael Carus
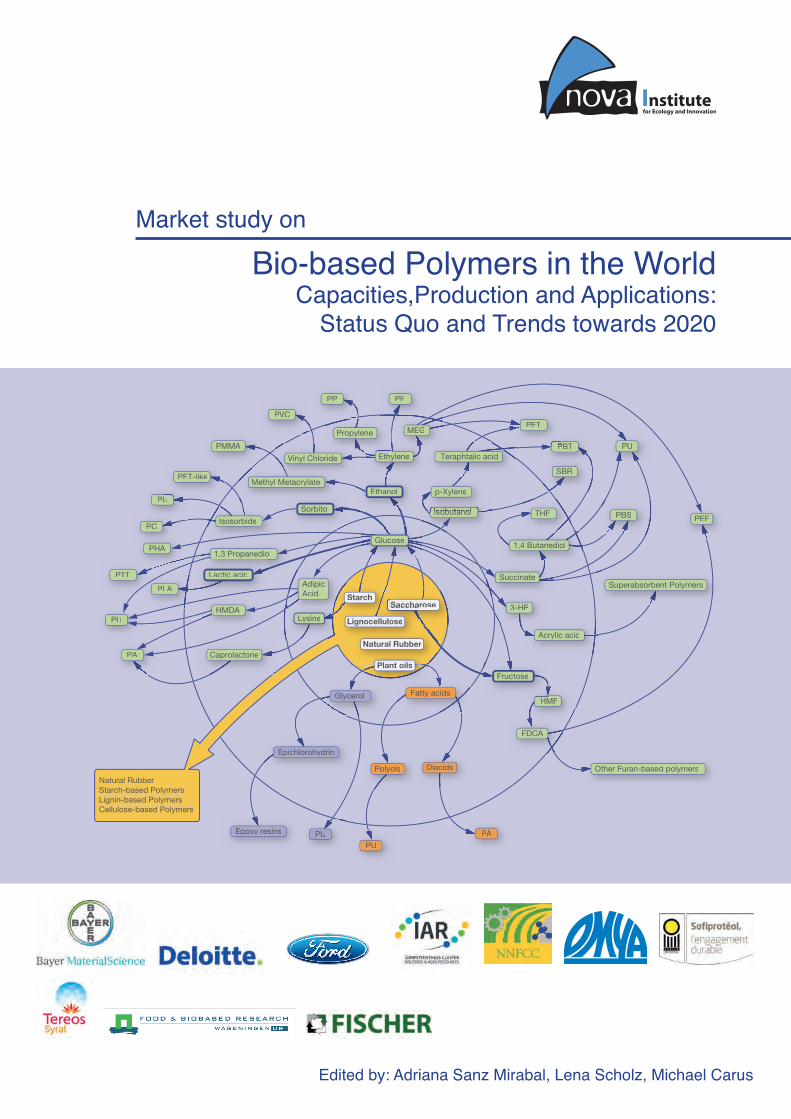
Bio-based Polymers in the WorldCapacities,Production and Applications:
Status Quo and Trends towards 2020
Saccharose
Fatty acids
Diacids
Glycerol
Epichlorohydrin
Epoxy resins
Starch
1,3 Propanediol
Isobutanol
Succinate
Acrylic acid
Superabsorbent Polymers
Other Furan-based polymers
PEF
1,4 Butanediol
Isobutanol
p-Xylene
Ethylene
Propylene
Vinyl Chloride
Methyl Metacrylate
Isosorbide
MEG
SBR
THF
Teraphtalic acidPBT
PBS
PBT
PET
PE
PU
PU
PA
Polyols
PU
PP
PU
PC
PVC
PTT
PLA
HMF
FDCA
PHA
PA
PMMA
HMDA
Caprolactone
AdipicAcid
3-HP
PET-like
Lactic acid
Sorbitol
Ethanol
Saccharose
Lignocellulose
Natural Rubber
Plant oilsFructose
Natural RubberStarch-based PolymersLignin-based PolymersCellulose-based Polymers
Glucose
Lysine
PU

Market study on
Bio-based Polymers in the WorldCapacities,Production and Applications: Status Quo and Trends towards 2020
nova-Institut GmbH
Edited by: Adriana Sanz Mirabal, Lena Scholz, Michael Carus
February 2013

Market study on „Bio-based Polymers in the World“ © nova-Institut 2013
4
The expert team of the Market Study (authors) has made every attempt to ensure the accuracy and reliability of the information provided on this study. The included market and trend analyses and forecasts are
performed to the best of the authors‘ knowledge and beliefs on the basis of the current state of knowledge and the latest research and inquiries. Nevertheless, authors, editors, and publisher do not warrant the information contained in this study, to be free of errors or will prove to be accurate. The information,
conclusions and findings provided in this study are not intended as legal or financial advice. The authors cannot accept liability for actions taken based on the content of this Market Study.
© 2013 nova-Institut GmbH, Germany
Publisher:
Michael Carus (v.i.S.d.P), nova-Institute GmbH, Chemiepark Knapsack, Industriestr. 300, 50354 Huerth Germany, Phone: +49 (0) 2233 48 14 40, Fax: +49 (0) 2233 48 14 50, [email protected],
www.nova-institut.eu
Layout:
ftdesign - kreativ Büro www.ftd-kreativbuero.de
All rights reserved (including those of the translation into other languages).
No part of this publication shall be reproduced, transmitted, displayed, published, broadcast or resold in whole or in part in any form, without the prior written consent of the authors.
Registered names, trademarks, etc. used in this study, even when not specifically marked as such, are not to be considered unprotected by law. The rights remain with the holders of the respective trademarks. The
nomination of product- or service-designations serves exclusively the purposes of identification.
Authors (in alphabetical order)
Wolfgang Baltus, National Innovation Agency (NIA), Thailand
Janpeter Beckmann, nova-Institut GmbH, Germany
Dirk Carrez, Clever Consult, Belgium
Michael Carus, nova-Institut GmbH, Germany
Lara Dammer, nova-Institut GmbH, Germany
Roland Essel, nova-Institut GmbH, Germany
Harald Kaeb, narocon, Germany
Jan Ravenstijn, Jan Ravenstijn Consulting, Netherlands
Adriana Sanz Mirabal, nova-Institut GmbH, Germany
Lena Scholz, nova-Institut GmbH, Germany
Fabrizio Sibilla, nova-Institut GmbH, Germany
Stephan Zepnik, Fraunhofer UMSICHT, Germany

5
Table of Content
Table of Content
1 Executive Summary 6
2 Introduction 12
Market Data
3 Market Data 17
4 Qualitative analyses of selected bio-based Polymers 55
Trend reports
5 Policies impacting bioplastics market development 65
6 Bio-based polymers, a revolutionary change 100
7 Asian markets for bio-based resins 137
8 Environmental evaluation of bio-based polymers and plastics 168
9 Green Premium within the value chain from chemicals to bioplastics 186
10 Brands: Sustainability Strategies and Bioplastics Information from the fast moving consumer goods industries (focus packaging) 206
Company
11 Company Profiles 221
12 Company product index 349
13 List of Acronyms 358

17
Market Data
3 Market Data
Table of Content
3.1. Polyamide (PA) 20
3.2. Polybutylene Adipate Terephthalat (PBAT) 24
3.3. Polybutylene succinate (PBS) 28
3.4. Polyethylene (PE) 31
3.5. Polyethylene Terephthalat (PET) 34
3.6. Polyhydroxy Alkanoate (PHA) 37
3.7. Polylactic acid (PLA) 42
3.8. Polypropylene (PP) 46
3.9. Polyvinyl Chloride (PVC) 48
3.10. Starch Blends 50
55
Market Data
3.11 List of Figures
Figure 1: Evolution of production capacities for Polyamides 2011-2020 20
Figure 2: Actual volume of produced polyamides and name plate capacities for 2011 in the diffe-rent regions 21
Figure 3: Polyamides (PA): Capacities, 2011-2020, America (North) in kt/a 21
Figure 4: Polyamides (PA): Capacities, 2011-2020, Asia in kt/a 22
Figure 5: Polyamides (PA): Capacities, 2011-2020, Europe in kt/a 22
Figure 6: World‘s total capacity of Polyamides 2011 and 2020 23
Figure 7: Application sectors for Polyamides 2011; C: construction polymer, F: functional poly-mer 23
Figure 8: Figure: Evolution of production capacities for Polybutylene Adipate Terephtalat 2011-2020 24
Figure 9: Figure: Actual volume of produced Polybutylene Adipate Terephtalat and name plate capacities for 2011 in the different regions 25
Figure 10: Polybutylene Adipate Terephthalat (PBAT): Capacities, 2011-2020, Asia in kt/a 25
Figure 11: Polybutylene Adipate Terephthalat (PBAT): Capacities, 2011-2020, Europe in kt/a 26
Figure 12: World‘s total capacity of Polybutylene Adipate Terephtalat 2011 and 2020 26
Figure 13: Application sectors for Polybutylene Adipate Terephtalat 2011; C: construction poly-mer, F: functional polymer 27
Figure 14: Evolution of production capacities for Polybutylene succinate 2011-2020 28
Figure 15: Actual volume of produced Polybutylene succinate and name plate capacities for 2011 in the different regions 29
Figure 16: Polybutylene succinate (PBS): Capacities, 2011-2020, Europe in kt/a 29
3.10 List of Tables
Table 1: Companies with (announced) capacities of Polyamides 2011-2020 20
Table 2: Companies with (announced) capacities of Polybutylene Adipate Terephtalat 2011-2020 24
Table 3: Companies with (announced) capacities of Polybutylene succinate 2011-2020 28
Table 4: Companies with (announced) capacities of Polyethylene 2011-2020 31
Table 5: Companies with (announced) capacities of Polyethylene Terephthalat 2011-2020 34
Table 6: Companies with (announced) capacities of Polyhydroxy Alkanoate 2011-2020 37
Table 7: Companies with (announced) capacities of Polylactic acid 2011-2020 42
Table 8: Companies with (announced) capacities of Polypropylene 2011-2020 46
Table 9: Companies with (announced) capacities of Polyvinyl Chloride 2011-2020 48
Table 10: Companies with (announced) capacities of Starch Blends 2011-2020 50
Market study on „Bio-based Polymers in the World“ © nova-Institut 2013
56 Market Data
Figure 17: World‘s total capacity of Polybutylene succinate 2011 and 2020 30
Figure 18: Application sectors for Polybutylene succinate 2011; C: construction polymer, F: func-tional polymer 30
Figure 19: Evolution of production capacities for Polyethylene 2011-2020 31
Figure 20: Actual volume of produced Polyethylene and name plate capacities for 2011 in the dif-ferent region 32
Figure 21: Polyethylene (PE): Capacities, 2011-2020, America South in kt/a 32
Figure 22: World‘s total capacity of Polyethylene 2011 and 2020 33
Figure 23: Application sectors for Polyethylene 2011; C: construction polymer, F: functional poly-mer 33
Figure 24: Evolution of production capacities for Polyethylene Terephthalat equivalents, Monoe-thylene glycol and para-Xylene 2011-2020 34
Figure 25: Actual volume of produced Polyethylene Terephthalat and name plate capacities for 2011 in the different regions 35
Figure 26: Polyethylene Terephthalat (PET): Capacities, 2011-2020, America (North) in kt/a 35
Figure 27: Polyethylene Terephthalat (PET): Capacities, 2011-2020, Europe in kt/a 36
Figure 28: World‘s total capacity of Polyethylene Terephthalat 2011 and 2020 36
Figure 29: Evolution of production capacities for Polyhydroxy Alkanoate 2011-2020 37
Figure 31: Actual volume of produced Polyhydroxy Alkanoate and name plate capacities for 2011 in the different regions 38
Figure 30: Polyhydroxy Alkanoate (PHA): Capacities, 2011-2020, America (North) in kt/a 38
Figure 32: Polyhydroxy Alkanoate (PHA): Capacities, 2011-2020, America (South) in kt/a 39
Figure 33: Polyhydroxy Alkanoate (PHA): Capacities, 2011-2020, Asia in kt/a 39
Figure 34: Polyhydroxy Alkanoate (PHA): Capacities, 2011-2020, Europe in kt/a 40
Figure 35: World‘s total capacity of Polyhydroxy Alkanoate 2011 and 2020 40
Figure 36: Application sectors for Polyhydroxy Alkanoate 2011; C: construction polymer, F: func-tional polymer 41
Figure 37: Evolution of production capacities for Polylactic acid 2011-2020 42
Figure 38: Actual volume of produced Polylactic acid and name plate capacities for 2011 in the different regions 43
Figure 39: Polylactic acid (PLA): Capacities, 2011-2020, America (North) in kt/a 43
Figure 40: Polylactic acid (PLA): Capacities, 2011-2020, Asia in kt/a 44
Figure 41: Polylactic acid (PLA): Capacities, 2011-2020, Europe in kt/a 44
Figure 42: World‘s total capacity of Polylactic acid 2011 and 2020 45
Figure 43: Application sectors for Polylactic acid 2011; C: construction polymer, F: functional po-lymer 45
Figure 44: Evolution of production capacities for Polypropylene 2011-2020 46
Figure 45: Polypropylene (PP): Capacities, 2011-2020, America (South) in kt/a 47
Figure 46: World‘s total capacity of Polypropylene 2011 and 2020 47
57
Market Data
Figure 47: Evolution of production capacities for Polyvinyl Chloride 2011-2020 48
Figure 48: Polyvinyl Chloride (PVC): Capacities, 2011-2020, America (South) in kt/a 49
Figure 49: World‘s total capacity of Polyvinyl Chloride 2011 and 2020 49
Figure 50: Evolution of production capacities for Starch Blends 2011-2020 50
Figure 51: Actual volume of produced Starch Blends and name plate capacities for 2011 in the dif-ferent regions 51
Figure 52: Starch Blends: Capacities, 2011-2020, America (North) in kt/a 51
Figure 53: Starch Blends: Capacities, 2011-2020, America (South) in kt/a 52
Figure 54: Starch Blends: Capacities, 2011-2020, Asia in kt/a 52
Figure 55: Starch Blends: Capacities, 2011-2020, Europe in kt/a 53
Figure 56: Starch Blends: Capacities, 2011-2020, Oceania in kt/a 53
Figure 57: World‘s total capacity of Starch Blends 2011 and 2020 54
Figure 58: Application sectors for Starch Blends 2011; C: construction polymer, F: functional po-lymer 54
Market study on „Bio-based Polymers in the World“ © nova-Institut 2013
68 Policies impacting bioplastics market development
5 Policies impacting bioplastics market development
Dirk Carrez, Clever Consult, Belgium
Lara Dammer, Michael Carus, nova-Institut GmbH, Germany
5.1. Introduction 665.2. Stimulatin market demand 66
5.2.1. Dedicated policies promoting bio-based products and bioplastics 675.2.2. Mandates 715.2.3. Public procurement policies 71
5.3. Overcoming investment barriers: Taxes and Subsidies 735.3.1. US 735.3.2. Brazil 735.3.3. China 745.3.4. Thailand 745.3.5. Malaysia 74
5.4. Productspecificpolicies 745.5. Research and Innovation policies focussing on bio-based products 76
5.5.1. Europe 765.5.2. US 775.5.3. Japan 785.5.4. China 785.5.5. Brazil 795.5.6. South Korea 79
5.6. Non-dedicated policies impacting bioplastics 805.6.1. Europe 805.6.2. Brazil 81
5.7. Other 815.7.1. Feedstock-related policies 815.7.2. Bioenergy related policies 83
5.8. General Bioeconomy Strategies and Policies 885.8.1. Some examples 88
5.9. List of tables 935.10. Listoffigures 935.11. References 94
103Jan Ravenstijn
Bio-based polymers, a revolutionary change
6 Bio-based polymers, a revolutionary change
Jan Ravenstijn, Jan Ravenstijn Consulting, Netherlands
6.1. Introduction 1016.2. Market trends 1026.3. Technology trends 1036.4. Environmental trends 1056.5. Selected biopolymer families 109
6.5.1. Polyhydroxyalkanoates (PHA) 1096.5.2. Polybutylenesuccinates (PBS) 1136.5.3. Natural Oil Polyols and CO2-based polyols for polyurethanes (PUR) 1206.5.4. Polyamides (PA): 126
6.6. Customer views 1316.7. New business concepts 133
6.7.1. PharmafilterBV(TheNetherlands). 1336.7.2. AvantiumTechnologiesB.V.(TheNetherlands). 134
6.8. New value chain 1346.9. Listoffigures 136
Market study on „Bio-based Polymers in the World“ © nova-Institut 2013
140 Asian markets for bio-based resins
7 Asian markets for bio-based resins
Wolfgang Baltus, National Innovation Agency (NIA), Thailand
7.1. Introduction 1387.2. Asian markets for bio-based resins 1387.3. Asia-Pacific region in numbers 1427.4. Feedstock – Key to success in Asia-Pacific 144
7.4.1. Sugarcane 1477.4.2. Cassava 1487.4.3. Threats 1507.4.4. Other feedstock and cost considerations 150
7.5. Policy Development 1517.5.1. Stimulation of investment 1517.5.2. End-of-life policy 152
7.6. Market growth factors 1537.6.1. Environmental factors 1537.6.2. Financial factors 1537.6.3. Technical factors 154
7.7. Selected biopolymer families – limitations, challenges and chances in Asia Pacific 1547.7.1. Polylactic acid (PLA) 1547.7.2. Polybutylenesuccinate (PBS) 1607.7.3. Bio-PE/Bio-PET 1617.7.4. PHA 1637.7.5. Polyamide 163
7.8. Case Study: The National Bioplastics Roadmap in Thailand – Situation and outlook after 4 years in operation 1647.9. List of tables 1667.10. List of figures 166
Market study on „Bio-based Polymers in the World“ © nova-Institut 2013
170 Asian markets for bio-based resins
7.9 List of tables
Table 1: Global and Asian production capacities of selected bio-based polymers 2011 and 2020 142
Table 2: GDP data, population and stage of development for selected countries in Asia-Pacific 145
Table 3: Available Feedstock in Asian regions 148
Table 4: Available Biomass equivalents in Asia 149
Table 5: Main regions of cassava production, total yield and yield per hectare 153
7.10 List of figures
Figure 1: Value chain from PLA/PBS plants (in millions of euros) 141
Figure 2: Municipal waste generation in selected AP countries in 2025. Size of bubble = population size 146
Figure 3: Plastic consumption per capita in selected AP countries versus gross net income per capita in 2010. Size of bubble = population size 146
Figure 4: Polymer value chain in Thailand, 2011 (PTIT 2012) 147
Figure 5: Benchmarking of different feedstocks for PLA in Thailand 148
Figure 6: Available Biomass Simulation (based on APEC, 2008) 149
Figure 7: Value Chain of PLA compared for different biomass input 150
Figure 8: Sugarcane production and yields for selected countries 151
Figure 9: Sugarcane price development 1980 – 2012 in Thailand 151
Figure 10: Prices of Thai domestic cassava compared to crude oil 152
Figure 11: Estimation of PLA demand in Asia 2012 (t/yr) - 2011. Total amount ~ 39,000 t/yr, import ratio for PLA: 71 % 159
Figure 12: NatureWorks LLC dominates the PLA market. 159
Figure 13: The collapse of the local PLA resin production in China 2007-2012. Source: CCM, China 160
Figure 14: Bioplastics market in Japan, 2007 and 2011 (Adapted from JSBI, 2012) 163
Figure 15: Ethylene prices and bio-PE price projections 165
Figure 16: Present PET value chain 166
171Roland Essel and Michael Carus
Environmental evaluation of bio-based polymers and plastics
8 Environmental evaluation of bio-based polymers and plastics
Roland Essel and Michael Carus nova-institut GmbH, Hürth, Germany
8.1. Introduction 1698.2. Results from recent life cycle assessments 169
8.2.1. CO2 emissions and fossil resource depletion 1698.2.2. Other environmental impact categories 173
8.3. Feedstock supply and use of by-products 1748.4. Geneticallymodifiedorganisms 1758.5. Biodiversity 1768.6. Land use 177
8.6.1. Land use change 1788.6.2. Landuseefficiency 180
8.7. Conclusion 1838.8. List of tables 1858.9. Listoffigures 185

Market study on „Bio-based Polymers in the World“ © nova-Institut 2013
188 Environmental evaluation of bio-based polymers and plastics
8.8 List of tables
Table 1: Comparison of non-renewable energy use and greenhouse gas emissions of petrochemical and bio-based polymers 175
8.9 List of figures
Figure 1: Environmental impacts of different polymers in two impact categories: climate change and fossil resource depletion 173
Figure 2: Savings of fossil resources due to the production of bio-based polymers. 174
Figure 3: Reduction of greenhouse gas emissions through production of bio-based polymers. 175
Figure 4: Relative changes in the eco-profile of Ingeo PLA. 176
Figure 5: Average product-specific environmental impacts of bio-based materials in comparison to conventional materials 177
Figure 6: Comparison of greenhouse gas emissions and fossil resource depletion in the production of PHA from different feedstocks (Kim & Dale 2005, Harding et al. 2007) 178
Figure 7: Implications of biodiversity loss 180
Figure 8: Worldwide use of agricultural biomass harvested in 2008 181
Figure 9: Illustration of direct and indirect land-use changes 182
Figure 10: Land use per tonne of bio-based PLA, bio-based PE and bioethanol from five crops valid for both current agricultural practice and if all residues/co-products are used. 183
Figure 11: Avoided NREU per hectare of land for the various bio-based products relative to their fossil based counterparts 184
Figure 12: Annual sugar/starch yield for selected feedstocks. 185
Figure 13: Land use efficiency of photovoltaic panels compared to biofuels 186

189
Green Premium within the value chain from chemicals to bioplastics
Janpeter Beckmann
9 Green Premium within the value chain from chemicals to bioplastics
Janpeter Beckmann and Michael Carus nova-Institut GmbH, Germany
9.1. Introduction 1879.2. GreenPremium-Useanddefinition 187
9.2.1. Introductory market observations 1879.2.2. TypesofperformanceanddefinitionofGreenPremium 1909.2.3. Green Premium market overview 193
9.3. Understanding the reasons for Green Premium prices 1999.3.1. Explanations and individual expert opinions 1999.3.2. Drivers 201
9.4. Summary and conclusions 2029.5. List of tables 2039.6. Listoffigures 2039.7. References 204
209
Brands: Sustainability Strategies and Bioplastics - Information from the fast moving consumer goods industries (focus packaging)
Harald Kaeb
10 Brands: Sustainability Strategies and Bioplastics - Information from the fast moving consumer goods industries (focus packaging)
Harald Kaeb, narocon InnovationConsulting, Germany
10.1. Introduction – Why read this 20610.2. Summary – what strikes the eye 20810.3. List of Drivers – Brand Motivation (not weighed or prioritized) 209
10.3.1. Sustainability targets in general & strategic 20910.3.2.Specificdriversforincreaseduseofbioplastics(additional) 209
10.4. Company-specificaspects 20910.4.1. Coca-Cola 21010.4.2. Danone 21110.4.3. Friesland-Campina 21410.4.4. Henkel 21410.4.5. Nestlé 21610.4.6. Proctor & Gamble 21810.4.7. Unilever 219

Market study on „Bio-based Polymers in the World“ © nova-Institut 2013
224
11 Company Profiles
Table of Content
8.1 Acetati S.p.A. 228
8.2 Amyris 229
8.3 Anhui COFCO Biochemical & GALACTIC Lactic Acid Co., Ltd. 230
8.4 Anellotech Inc. 231
8.5 Anqing Hexing Chemical Co., Ltd. 232
8.6 Arizona Chemical 233
8.7 Arkema SA 234
8.8 Avantium Chemicals BV 236
8.9 BASF SE 237
8.10 Bayer MaterialScience 239
8.11 Bio-On Srl 240
8.12 BioAmber 241
8.13 BioBased Technologies LLC 243
8.14 BioMatera Inc. 244
8.15 Biomer 245
8.16 Biop Biopolymer Technologies AG 246
8.17 Bioplastech 247
8.18 BIOTEC Biologische Naturverpackungen GmbH & Co. KG 248
8.19 Braskem 249
8.20 Cardia Bioplastics Limited 250
8.21 Cargill Inc. 251
8.22 Cathay Industrial Biotech 252
8.23 Casda Biomaterials Co., LTD 253
8.24 Celanese Acetate LLC 254
8.25 Cereplast Inc. 255
8.26 Cerestech Inc. 256
8.27 Chemplast Sanmar Limited 257
8.28 Chengdu Dikang Biomedical Co., Ltd. 258
8.29 China New Materials Holding 259
349
Company product index
Company product index
1,3-Propanediol
DuPont
METabolic EXplorer (METEX)
1,4-Butanediol
BioAmber
China New Materials Holding
Genomatica
Global Bio-Chem
Novamont SpA
Adipic acid
DSM N.V.
Rennovia
Verdezyne
Bio-paraxylene (bioPX)
Anellotech Inc.
Gevo
Global Bioenergies
Honeywell UOP
M&G Group (Gruppo Mossi & Ghisolfi)
Virent
Butanol
Cathay Industrial Biotech
Cellulose acetate
Acetati S.p.A.
Celanese Acetate LLC
Clarifoil
Daicel Chemicals Industries Ltd.
Eastman Chemical Company
Rhodia Acetow
WinGram Industry Co. Ltd. (Great River Qin Xin Plastic Manufacturer Co. Ltd.)

Market study on „Bio-based Polymers in the World“ © nova-Institut 2013
358 List of Acronyms
List of Acronyms
AA Adipic Acid
ABS Acrylonitrile Butadiene Styrene polymer
ADM Archer Daniels Midland
ACHEMA Ausstellungstagung für chemisches Apparatewesen
AG Aktien Gesellschaft
ARD Agro-industrie Recherches et Developpement
ASTM American Society for Testing & Materials
B2B Business to business
BASF Badische Anilin und Soda Fabrik
BCAP Biomass Crop Assistance Programme
BCG Biotechnology Commercialization Grant
BDO Butanediol
BMC Bulk moulding compound
BMBF Bundesministerium für Bildung und Forschung
BMELV Bundesministerium für Ernährung, Landwirtschaft und Verbraucherschutz
BMW Bayerische Motoren Werke
BNDES Brazilian Development Bank
CA Cellulose Acetate
CAP Common Agricultural Policy
CCC Commodity Credit Corporation
CEN European Committee for Standardization
CLIB2021 Cluster Industrielle Biotechnologie e.V.
CO2 Carbon dioxide
DAB Diaminobutane
DG Directorate-General
DMC Double Metal Cyanides (catalyst)
DNP Diversified Natural Products
DOE United States Department of Energy
Drop-in A bio-based polymer with a chemical structure identical to that of its petro-based counterpart
DS Degree of substitution
DSM Dutch State Mines