bioaccumulation of contaminants in fish tissues
TRANSCRIPT

Bioaccumulation of Contaminantsin Fish Tissues
Harbor Island Yacht Basin, looking west from Convair Lagoon


69
Chapter 5Bioaccumulation of Contaminants in Fish Tissues
INTRODUCTION
The bioaccumulation of contaminants in fishes from San Diego Bay is of great public concern since the Bay isa popular fishing location for many people, despite the prevalence of various types of pollutants (see USDoN,SWDIV and SDUPD 2000). Contaminant levels in the tissues of Bay fishes, however, have not been studiedsince the early 1990's (e.g., SDCDH 1990, McCain et al. 1992). To address these concerns, bottom dwelling(i.e., demersal) fishes were collected throughout San Diego Bay to assess more recent levels of contamination.
Contaminants can accumulate in the tissues of fish through various exposure pathways (Tetra Tech 1985).Exposure routes for demersal fishes include adsorption or absorption of dissolved chemical constituents fromambient waters, and the ingestion of pollutant-containing suspended particulate matter or sediment particles.Fish may also accumulate pollutants by directly consuming contaminated plant and animal food sources. Onceincorporated into the tissues of a fish, a contaminant can be transferred to and bioconcentrated in upper trophiclevel predators, including other fish, birds, marine mammals, and humans.
This chapter presents an assessment of contaminant levels in the tissues of fish collected from San Diego Bayin the summer of 1998. These data will provide baseline information against which to measure future trends ofcontamination in Bay fishes. Contaminant levels in whole fish samples of California halibut from San Diego Baywere compared to a) predator protection thresholds established by Environment Canada (1997, 1998), andto b) halibut sampled in other southern California bays and harbors during the Bight'98 regional survey. Inaddition, samples of muscle tissue from various species of sport fish were analyzed to address human healthconcerns, since this is the tissue most often consumed by people.
MATERIALS & METHODS
Sample Collection and Processing
Five species of fish were collected at 24 stations in San Diego Bay during the summer of 1998 and analyzed forthe accumulation of contaminants in their tissues (Figure 5.1, Table 5.1). Whole fish samples of Californiahalibut (Paralichthys californicus) were collected at seven stations and analyzed for the presence of pesticidesand polychlorinated biphenyl congeners (PCBs). Contaminant levels in these fish were compared to those forother bays and harbors in Southern California and to predator protection limits for mammals and birds. Muscletissue samples were collected from sport fish at the remaining 17 stations in San Diego Bay and and analyzedfor the presence of metals, pesticides and PCBs. The results of these analyses were compared to human healthlimits. The fish sampled for muscle tissues included California halibut, calico bass (Paralabrax clathratus),spotted sand bass (Paralabrax maculatofasciatus), barred sand bass (Paralabrax nebulifer), and yellowfincroaker (Umbrina roncador). Muscles tissues were analyzed for these five species because it is the tissuemost often consumed by people, and for which the most consumption limits are available.

70
GFGF
GF
GF
GF
GF
GF
GF
GF
GF
GF
GF
GF
GF
GF
GF
GF
"
"
"
""
"
"
C o r o n a d o
C o r o n a d o
Po
i nt
Lo
ma
Po
i nt
Lo
ma
Shelter
Island
Harbor Island
D o w n t o w nD o w n t o w nS a n D i e g oS a n D i e g o
C h u l a C h u l a V i s t aV i s t a
Pa
ci f
i c
Oc
ea
n
N a t i o n a lN a t i o n a lC i t yC i t y
2225
2223
2439
2434
2229
22592240
2245
22352247
2238
2438
2236
2261
LA2
LA1
LA3
S a
n D
i eg
o
Ba
y
2242
22542256
2233
2262
2244
2436
PARA
DIS
E
LAS
CH
OLL
AS
LA POLETA
SWEETWATER
RIVER
OTAY RIVER
:
0 1 20.5Miles
Sta t i ons bySamp le Type
Muscle tissue only
Whole Fish
GF
"
Figure 5.1San Diego Bay fish tissue stations sampled during 1998.

71
Table 5.1Summary of species of fish sampled by tissue type at each San Diego Bay station during 1998. OT= otter trawl,RF= rig fishing.
CollectionStation Method Tissue Species
2233 OT Whole Fish California halibut2242 OT Whole Fish California halibut2244 OT Whole Fish California halibut2254 OT Whole Fish California halibut2256 OT Whole Fish California halibut2262 OT Whole Fish California halibut2436 OT Whole Fish California halibut2223 RF Muscle Spotted sand bass2225 RF Muscle Spotted sand bass2229 RF Muscle Barred sand bass2235 RF Muscle Spotted sand bass2236 RF Muscle Spotted sand bass2238 RF Muscle Spotted sand bass2240 RF Muscle Spotted sand bass2245 RF Muscle Yellowfin croaker2247 RF Muscle Spotted sand bass2259 RF Muscle Barred sand bass2261 RF Muscle Spotted sand bass2434 RF Muscle Calico bass2438 RF Muscle Spotted sand bass2439 RF Muscle Spotted sand bassLA1* misc. Muscle California halibutLA2* misc. Muscle Spotted sand bassLA3* misc. Muscle Spotted sand bass
* additional fish from Dr. Larry Allen, collected by various methods
California halibut for the whole fish samples were collected from otter trawls conducted as part of Bight'98(see Chapter 4). Only fish in the 5-20 cm size-class range (standard length) were retained for analysis.After collection, all fish were wrapped in aluminum foil, placed into ziplock bags, and then transported tothe lab and stored frozen until processed. Prior to processing, the fish were sorted into composite samplesof six fish each. The fish were then partially defrosted, rinsed in deionized water to remove visible particles,and shaken dry. The standard length (cm) and weight (g) of each fish used in the composite samples wererecorded (Appendix E.1). Additionally, individual fish weights were summed to give a total weight foreach composite sample. The whole fish composites were homogenized in chilled blenders, which consistedof 1-liter glass containers with silicone rubber gaskets and aluminum foil-lined lids. A volume of deionizedwater equal to the composite weight was combined with the fish tissue to facilitate blending. The entiresample was then blended for less than two minutes to obtain a smooth homogenate. The homogenate wasthen placed in glass jars, sealed, labeled, and stored at -20oC prior to chemical analysis for pesticides(e.g., DDT, chlordane) and PCB congeners (see Appendix E.2). All samples were delivered to the Cityof San Diego Wastewater Chemistry Laboratory within six months. All contaminant concentrations resultingfrom these analyses were doubled in order to account for the water added to each sample.

72
Muscle tissues were analyzed for sport fish considered representative of a typical sport fisher's catch using rodand reel type gear at most stations. However, Dr. Larry Allen used several methods to collect fish at the threesites designated LA1-LA3. Only fish > 11 cm in standard length were kept and processed. All fish werewrapped in aluminum foil, placed into ziplock bags, and then transported to the lab and stored frozen untilprocessed. In the lab, various sport fish were sorted into composite samples containing a minimum of three fisheach. The fish were then partially defrosted and cleaned with a paper towel to remove loose scales and excessmucus. The standard length (cm) and weight (g) of the fish used in each composite sample were recorded(Appendix E.1). Muscle tissues were subsequently dissected from all the fish included in each composite.These dissections were carried out on Teflon pads that were cleaned between samples. The muscle sampleswere then placed in glass jars, sealed, labeled, and stored at -20oC. All samples were delivered to the City ofSan Diego Wastewater Chemistry Laboratory within seven days of dissection for the subsequent analysis ofpriority pollutants, including metals, pesticides, and PCBs (Appendix E.3). A detailed description of all analyticalprotocols may be obtained from the City’s W astewater Chemistry Laboratory.
Data Analysis
Prior to any analysis, all values less than method detection limits (MDLs) were eliminated from the dataset.The MDLs for the contaminants analyzed in this study are listed in Appendices E.2 and E.3. Total DDT(tDDT) was calculated as the sum of DDT and its DDD and DDE derivatives. Total PCB (tPCB) wascalculated as the sum of all PCB congeners. Metal and pesticide concentrations in the muscle tissues of fishwere compared to national and international seafood action limits for humans (see Mearns et al. 1991).
Whole fish samples from San Diego Bay, Los Angeles/Long Beach Harbor, Marina Del Rey, NewportHarbor, and Ventura Harbor were compared to predator protection thresholds as determined byEnvironment Canada (1997, 1998). These thresholds are risk-based guidelines for marine mammals andbirds, set at 14.0 ppb for tDDT and 0.79 ng (TEQ)/kg for tPCB, where TEQ is the toxic equivalentquotient. PCB TEQs were calculated separately for each sample as the sum of concentrations of theindividual PCB congeners multiplied by their relative dioxin-like toxicity. The toxicity factors used in thisstudy were those recommended by the World Health Organization for PCB congeners 77, 81, 105, 114,118, 123, 126, 156, 157, 167, 169, and 189, and differ for mammals and birds based on physiologicaldifferences (see Van den Berg et al. 1998).
RESULTS
Contaminants in Muscle Tissues of Fishes from San Diego Bay
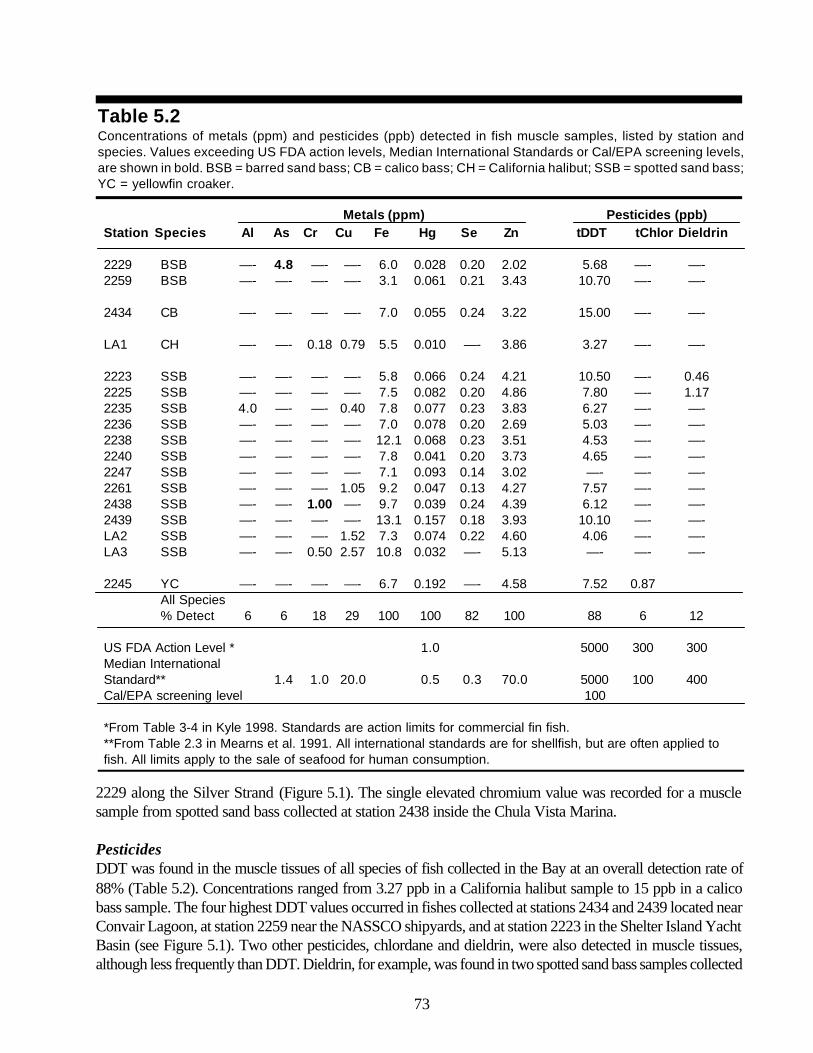
MetalsTrace metal contamination varied in the tissues of fishes captured in San Diego Bay. Detections rates exceeded80% for mercury, zinc, iron and selenium, but were much lower (< 30%) for aluminum, arsenic, chromiumand copper (Table 5.2). In general, most metals that were detected were present at relatively lowconcentrations. Only chromium and arsenic occurred at levels that reached or exceeded USFDA andinternational action limits. These standards represent thresholds that indicate undesirable concentrations infish tissues and are used to prevent the sale of contaminated seafood (Mearns et al. 1991). Arsenic, forexample, exceeded the median international standard in one sample of barred sand bass collected at station
Ecological Assessment of San Diego Bay Bioaccumulation of Contaminants in Fish Tissue
73
Metals (ppm) Pesticides (ppb)Station Species Al As Cr Cu Fe Hg Se Zn tDDT tChlor Dieldrin
2229 BSB —- 4.8 —- —- 6.0 0.028 0.20 2.02 5.68 —- —-2259 BSB —- —- —- —- 3.1 0.061 0.21 3.43 10.70 —- —-
2434 CB —- —- —- —- 7.0 0.055 0.24 3.22 15.00 —- —-
LA1 CH —- —- 0.18 0.79 5.5 0.010 —- 3.86 3.27 —- —-
2223 SSB —- —- —- —- 5.8 0.066 0.24 4.21 10.50 —- 0.462225 SSB —- —- —- —- 7.5 0.082 0.20 4.86 7.80 —- 1.172235 SSB 4.0 —- —- 0.40 7.8 0.077 0.23 3.83 6.27 —- —-2236 SSB —- —- —- —- 7.0 0.078 0.20 2.69 5.03 —- —-2238 SSB —- —- —- —- 12.1 0.068 0.23 3.51 4.53 —- —-2240 SSB —- —- —- —- 7.8 0.041 0.20 3.73 4.65 —- —-2247 SSB —- —- —- —- 7.1 0.093 0.14 3.02 —- —- —-2261 SSB —- —- —- 1.05 9.2 0.047 0.13 4.27 7.57 —- —-2438 SSB —- —- 1.00 —- 9.7 0.039 0.24 4.39 6.12 —- —-2439 SSB —- —- —- —- 13.1 0.157 0.18 3.93 10.10 —- —-LA2 SSB —- —- —- 1.52 7.3 0.074 0.22 4.60 4.06 —- —-LA3 SSB —- —- 0.50 2.57 10.8 0.032 —- 5.13 —- —- —-
2245 YC —- —- —- —- 6.7 0.192 —- 4.58 7.52 0.87All Species% Detect 6 6 18 29 100 100 82 100 88 6 12
US FDA Action Level * 1.0 5000 300 300Median InternationalStandard** 1.4 1.0 20.0 0.5 0.3 70.0 5000 100 400Cal/EPA screening level 100
*From Table 3-4 in Kyle 1998. Standards are action limits for commercial fin fish.**From Table 2.3 in Mearns et al. 1991. All international standards are for shellfish, but are often applied tofish. All limits apply to the sale of seafood for human consumption.
Table 5.2Concentrations of metals (ppm) and pesticides (ppb) detected in fish muscle samples, listed by station andspecies. Values exceeding US FDA action levels, Median International Standards or Cal/EPA screening levels,are shown in bold. BSB = barred sand bass; CB = calico bass; CH = California halibut; SSB = spotted sand bass;YC = yellowfin croaker.
2229 along the Silver Strand (Figure 5.1). The single elevated chromium value was recorded for a musclesample from spotted sand bass collected at station 2438 inside the Chula Vista Marina.
PesticidesDDT was found in the muscle tissues of all species of fish collected in the Bay at an overall detection rate of88% (Table 5.2). Concentrations ranged from 3.27 ppb in a California halibut sample to 15 ppb in a calicobass sample. The four highest DDT values occurred in fishes collected at stations 2434 and 2439 located nearConvair Lagoon, at station 2259 near the NASSCO shipyards, and at station 2223 in the Shelter Island YachtBasin (see Figure 5.1). Two other pesticides, chlordane and dieldrin, were also detected in muscle tissues,although less frequently than DDT. Dieldrin, for example, was found in two spotted sand bass samples collected
74
Tab
le 5
.3C
once
ntra
tions
(ppb
) of P
CB
s de
tect
ed in
mus
cle
tissu
e sa
mpl
es o
f fis
h co
llect
ed in
San
Die
go B
ay d
urin
g 19
98. D
ata
are
pres
ente
d fo
r tot
al P
CB
s (t
PC
B)
and
indi
vidu
al c
onge
ners
. BS
B =
bar
red
sand
bas
s; C
B =
cal
ico
bass
; CH
= C
alifo
rnia
hal
ibut
; SS
B =
spo
tted
sand
bas
s; Y
C =
yel
low
fin c
roak
er.
PC
B C
on
gen
ers
(pp
b)
Sta
tio
nS
pec
ies
tPC
B49
5266
9910
110
511
011
813
814
915
317
018
018
7
2229
BS
B43
.6—
-—
-—
-—
-7.
9—
-—
-8.
19.
6—
-18
.0—
-—
-—
-22
59B
SB
95.5
—-
—-
—-
8.0
11.0
—-
—-
11.0
15.0
8.3
27.0
—-
7.3
7.9
2434
CB
172.
29.
011
.09.
713
.021
.0—
-11
.018
.018
.012
.032
.0—
-7.
99.
6
LA1
CH
—-
—-
—-
—-
—-
—-
—-
—-
—-
—-
—-
—-
—-
—-
—-
2223
SS
B10
6.9
—-
—-
—-
13.0
10.0
—-
—-
16.5
18.5
—-
32.5
—-
8.3
8.2
2225
SS
B10
5.0
—-
—-
—-
11.0
12.0
—-
—-
17.0
17.0
—-
32.0
—-
7.4
8.6
2235
SS
B55
.3—
-—
-—
-7.
97.
6—
-—
-7.
811
.0—
-21
.0—
-—
-—
-22
36S
SB
11.0
—-
—-
—-
—-
—-
—-
—-
—-
—-
—-
11.0
—-
—-
—-
2238
SS
B21
.8—
-—
-—
-—
-—
-—
-—
-—
-6.
8—
-15
.0—
-—
-—
-22
40S
SB
46.4
—-
—-
—-
—-
—-
—-
—-
8.1
11.0
—-
21.0
—-
—-
6.3
2247
SS
B—
-—
-—
-—
-—
-—
-—
-—
-—
-—
-—
-—
-—
-—
-—
-22
61S
SB
55.3
—-
—-
—-
—-
8.3
—-
—-
8.8
10.0
—-
22.0
—-
—-
6.2
2438
SS
B—
-—
-—
-—
-—
-—
-—
-—
-—
-—
-—
-—
-—
-—
-—
-24
39S
SB
133.
43.
33.
86.
08.
514
.45.
04.
120
.517
.74.
830
.52.
96.
55.
5LA
2S
SB
109.
6—
-—
-—
-12
.09.
7—
-—
-15
.020
.0—
-36
.0—
-7.
79.
2LA
3S
SB
7.6
—-
—-
—-
—-
—-
—-
—-
—-
—-
—-
7.6
—-
—-
—-
2245
YC
12.0
—-
—-
—-
—-
—-
—-
—-
—-
—-
—-
12.0
—-
—-
—-
All
Spe
cies
% D
etec
t82
1212
1241
536
1259
6518
826
3547
75
at stations 2223 and 2225 in the Shelter Island Yacht Basin. Additionally, although chlordane is considereda contaminant of concern in San Diego Bay (see USDoN, SWDIV and SDUPD 2000), this pesticide wasfound in only one sample of yellowfin croaker collected at station 2245 near the Silver Strand. All pesticideconcentrations were less than international, federal and state consumption limits.
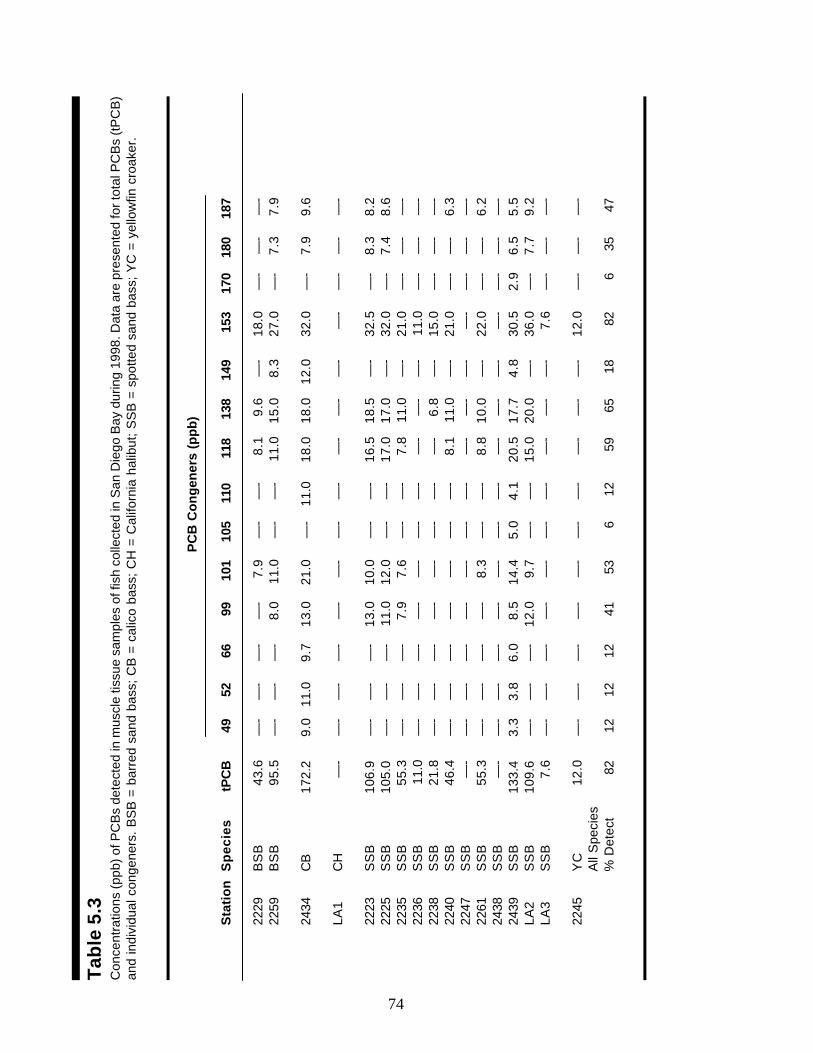
PCBsPCBs were found in the muscle tissues of almost all species of fish collected in the Bay (Table 5.3). Theoverall detection rate was 82%, and tPCB values ranged from 7.6 to 172.2 ppb. For most samples, tPCBwas largely composed of the congeners 153, 138, 118, and 101. Samples with the highest concentrationstended to have the greatest number of congeners present. The highest tPCB concentrations occurred incalico bass and spotted sand bass samples collected at stations 2434 and 2439 near Convair Lagoon, anarea known for high PCB sediment contamination (see Fairey et al. 1996).
Most tPCB concentrations reported herein were much higher than typically reported in the muscle tissuesof flatfish, rockfish and sand bass sampled in offshore waters off of Point Loma and southern San Diego(City of San Diego 1996, 1997, 1998, 1999, 2000a, 2000b, 2000c, 2001a, 2001b, 2002a, 2002b).However, human health thresholds for PCB concentrations in muscle tissues have been established onlyfor PCBs quantified as commercial mixtures (i.e., Aroclors), and therefore could not be applied directlyto the congener data reported here.
Contaminants in Whole Fish from San Diego Bay
PesticidesDDT occurred in all California halibut whole fish samples collected in this study at concentrations rangingfrom 18 to 70 ppb (Table 5.4). The highest DDT concentration was found in fish collected at station2233 located just south of the Coronado Bridge in the middle of the Bay. The lowest concentrationsoccurred in fish collected at stations 2254 and 2262 located along the edges of the Bay (see Figure 5.1).All values exceeded the predator risk threshold of 14 ppb for DDT (see Environment Canada 1997). Nochlordane was detected in any of the whole fish samples analyzed during this study.
PCBsPCBs were also detected in all of the California halibut samples collected in San Diego Bay (Table 5.4).Total PCB concentrations ranged from 63 to 323 ppb, with over 70% of the samples exceeding 200 ppb.The highest PCB value was found in fish collected at station 2242 located mid-channel across from theNaval Station San Diego (see Figure 5.1). The lowest PCB concentration was detected in fish collected atstation 2262, which coincided with one of the lowest levels of DDT found in the halibut samples.
Total PCB was composed primarily of congeners 153, 138 and 101, all of which occurred in 100% ofthe whole fish samples (Table 5.4). PCB 118, the only detected congener with recognized dioxin-liketoxicity (see Van den Berg et al. 1998), was among several other congeners detected in 86% of the fish.Each of the six halibut samples with PCB 118 present had PCB TEQs that were greater than theEnvironment Canada predator protection threshold value for mammals. Because PCB 118 is considered10 times less toxic to birds than to mammals (Van den Berg et al. 1998), none of these samples exceededthe threshold for birds.
Ecological Assessment of San Diego Bay Bioaccumulation of Contaminants in Fish Tissue

76
Table 5.4Concentrations (ppb) of total DDT and PCBs detected in whole fish samples of California halibut from San Diego Bay.
PCB Congeners
tDDT tPCB 99 101 110 118 138 149 151 153 180 187
2233 70 310 27 39 20 28 45 32 7 76 13 242242 40 323 26 36 18 30 52 30 —- 84 19 282244 32 240 20 32 18 22 34 24 —- 60 12 192254 18 248 23 24 14 28 39 21 —- 65 14 212256 42 254 22 32 16 24 36 26 —- 66 12 202262 19 63 —- 14 —- —- 17 —- —- 32 —- —-2436 36 161 17 24 —- 18 26 18 —- 44 —- 14
Freq (%) 100 100 86 100 71 86 100 86 14 100 71 86Min 18 63 17 14 14 18 17 18 7 32 12 14Max 70 323 27 39 20 30 52 32 7 84 19 28Mean 37 226 22 29 17 25 36 25 7 61 14 21
Comparison of San Diego Bay to Other Embayments
PesticidesDDT was detected in 100% of the whole fish samples of California halibut collected from the differentembayments sampled during Bight'98 (Table 5.5). The average tDDT concentration in halibut from San DiegoBay was about twice that of fish from Marina Del Rey, but substantially less than in fish collected in the LosAngeles/Long Beach, Newport, and Ventura harbors. The only sample that had a tDDT concentration lessthen the predator protection threshold for bird and mammal consumers occurred in Marina Del Rey. Althoughchlordane was found in halibut from Los Angeles/Long Beach Harbor, Marina Del Rey and Newport Harbor,this compound was not detected in any whole fish sample from San Diego Bay.
PCBsPCBs were detected in 100% of the whole halibut samples from San Diego Bay, Marina Del Rey and NewportHarbor, in 40% of the samples from Los Angeles/Long Beach Harbor (Table 5.5). No PCBs were detectedin the samples from Ventura Harbor . Fish from San Diego Bay averaged much higher concentrations of PCBsin their tissues than those from the other bays, which was probably due to historically acute PCB sedimentcontamination (USDoN, SWDIV and SDUPD 2000). None of the whole fish samples collected in any SCBembayment had PCB concentrations that exceeded the predator risk threshold for marine birds. In contrast,several values did exceed the threshold for marine mammals, including each of the samples from Newport andVentura Harbors, 86% of the samples from San Diego Bay, and 20% of the samples from Los Angeles/LongBeach Harbor.
SUMMARY & DISCUSSION
Fishes collected in San Diego Bay during 1998 contained many of the ‘contaminants of concern’ reportedpreviously for sediments in the Bay (e.g., chromium, copper, lead, mercury, zinc, tributyltin, chlordane, PCBs)(USDoN, SWDIV and SDUPD 2000). PCBs and the metals mercury and zinc were detected in almost all

77
Table 5.5Concentrations (ppb) of pesticides and PCBs detected in whole fish samples from San Diego Bay compared toother bays and harbors sampled during Bight '98. Sample size in parenthases.
Newport LA/LB Marina VenturaSDBay Harbor Harbor Del Rey Harbor
(7) (1) (5) (4) (1)
Total DDT %Detect 100 100 100 100 100range 18-70 na 26-187 7-35 namean 37 235 71 18 113
Total PCB %Detect 100 100 40 100 0range 63-323 na 16-103 7-50 —-mean 228 35 60 23 —-
TotalChlordane %Detect 0 100 20 25 0
range —- na na na —-mean —- 5 5 2 —-
Total DDT Threshold*%exceed 100 100 100 50 100
PCB Thresholds**Mammals %exceed 86 100 20 0 0Birds %exceed 0 0 0 0 0
* = 14 ppb, predator protection threshold from Environment Canada 1997.** = 0.00079 TEQ ppb predator protection threshold for mammals and birds, where TEQ calculated assummed concentration x toxicity of each congener, determined separately for mammals and birds basedon different physiology (Environment Canada 1998, see also Bight '98 reports).
muscle tissue samples. In contrast, the other contaminants of concern were found much less frequently ornot at all. Additional contaminants found in the muscles of Bay fishes included aluminum, arsenic, iron,selenium and the pesticide DDT. DDT and PCBs were also detected in all of the whole fish samples ofCalifornia halibut collected in the Bay. Tissue contamination levels could not be associated with the sedimentsat specific collection sites since none of the species of fish analyzed demonstrate strong site fidelity, andbecause the overall sample area is relatively small.
Contaminant levels in muscle tissues and whole fish samples were assessed relative to two different typesof thresholds in this study. In order to address human health concerns, concentrations of contaminants inthe muscles of San Diego Bay fishes were compared to both national and international limits. Almost allof these values were below consumption limits. Arsenic and chromium were the only exceptions, witheach exceeding the median international standard in a single sample. In contrast, concentrations of PCBsand DDT in whole fish samples were compared to the more recent mammal and bird predator protectionthresholds (see Environment Canada 1997). All of these samples had PCB and DDT levels that exceededthe limits for mammals, while only concentrations of DDT exceeded the limit for birds.
Levels of PCB and DDT contamination in whole fish samples were compared among the variousembayments sampled during Bight'98. Detection rates and concentrations of PCBs were much higher in

78
halibut samples from San Diego Bay than in the other bays and harbors. In contrast, DDT concentrations anddetection rates were similar in fish from all of the southern California embayments.
It was not possible to determine temporal trends in contamination levels for San Diego Bay fishes. This wasdue to differences between this study and previous surveys in terms of analytical techniques, and the typesof tissues and species analyzed. However, some comparisons were possible between this study in 1998 anda survey performed by the San Diego County Department of Health Services in 1988-1989 using muscletissues from similar species of fish (SDCDH 1990). For example, arsenic levels were slightly higher, chromiumlevels were similar, and concentrations of DDT (i.e., p,p,-DDE in SDCDH 1990), mercury and seleniumwere lower in this survey than in 1989-1989. Comparisons were also possible between fishes collected inSan Diego Bay and those collected in offshore coastal waters off San Diego. While levels of metals andpesticides were similar, PCB concentrations were substantially higher in the muscle tissues of fishes fromSan Diego Bay than typically reported for coastal flatfish, rockfish, and sand bass sampled off Point Lomaand southern San Diego (e.g., City of San Diego 1996, 1997, 1998, 1999, 2000a, 2000b, 2000c, 2001a,2001b, 2002a, 2002b).
LITERATURE CITED
City of San Diego. (1996). 1995 Receiving Waters Monitoring Report for the Point Loma Ocean Outfall. Cityof San Diego Ocean Monitoring Program, Metropolitan Wastewater Department, Environmental Monitoringand Technical Services Division. San Diego, CA.
City of San Diego. (1997). 1996 Receiving Waters Monitoring Report for the Point Loma Ocean Outfall. Cityof San Diego Ocean Monitoring Program, Metropolitan Wastewater Department, Environmental Monitoringand Technical Services Division. San Diego, CA.
City of San Diego. (1998). 1997 Receiving Waters Monitoring Report for the Point Loma Ocean Outfall. Cityof San Diego Ocean Monitoring Program, Metropolitan Wastewater Department, Environmental Monitoringand Technical Services Division. San Diego, CA.
City of San Diego. (1999). 1998 Receiving Waters Monitoring Report for the Point Loma Ocean Outfall. Cityof San Diego Ocean Monitoring Program, Metropolitan Wastewater Department, Environmental Monitoringand Technical Services Division. San Diego, CA.
City of San Diego. (2000a). 1999 Receiving Waters Monitoring Report for the Point Loma Ocean Outfall.City of San Diego Ocean Monitoring Program, Metropolitan Wastewater Department, EnvironmentalMonitoring and Technical Services Division. San Diego, CA.
City of San Diego. (2000b). International Wastewater Treatment Plant Final Baseline Ocean Monitoring Reportfor the South Bay Ocean Outfall (1995-1998). City of San Diego Ocean Monitoring Program, MetropolitanWastewater Department, Environmental Monitoring and Technical Services Division. San Diego, CA.
City of San Diego. (2000c). 1999 Receiving Waters Monitoring Report for the South Bay Ocean Outfall. Cityof San Diego Ocean Monitoring Program, Metropolitan Wastewater Department, Environmental Monitoringand Technical Services Division. San Diego, CA.
Ecological Assessment of San Diego Bay Bioaccumulation of Contaminants in Fish Tissue

79
City of San Diego. (2001a). 2000 Receiving Waters Monitoring Report for the Point Loma Ocean Outfall.City of San Diego Ocean Monitoring Program, Metropolitan Wastewater Department, EnvironmentalMonitoring and Technical Services Division. San Diego, CA.
City of San Diego. (2001b). 2000 Receiving Waters Monitoring Report for the South Bay Ocean Outfall. Cityof San Diego Ocean Monitoring Program, Metropolitan Wastewater Department, Environmental Monitoringand Technical Services Division. San Diego, CA.
City of San Diego. (2002a). 2001 Receiving Waters Monitoring Report for the Point Loma Ocean Outfall.City of San Diego Ocean Monitoring Program, Metropolitan Wastewater Department, EnvironmentalMonitoring and Technical Services Division. San Diego, CA.
City of San Diego. (2002b). 2001 Receiving Waters Monitoring Report for the South Bay Ocean Outfall. Cityof San Diego Ocean Monitoring Program, Metropolitan Wastewater Department, Environmental Monitoringand Technical Services Division. San Diego, CA.
Environment Canada. (1997). Predator-risk Tissue Residue Guidelines. Http://www.ccme.ca/4e-publications/4e.html
Environment Canada. (1998). Canadian Tissue Residue Guidelines for Polychlorinated Biphenyls for theProtection of Wildlife Consumers of Aquatic Biota. Prepared by Guidelines and Standards Division,Environmental quality Branch, Environment Canada, Quebec, Canada.
Fairey, R., C. Bretz, S. Lamerin, J. Hunt, B. Anderson, S. Tudor, C.J. Wilson, F. LeCaro, M. Stephenson, M.Puckett, and E.R. Long. (1996). Chemistry, toxicity, and benthic community conditions in sediments of theSan Diego Bay region. Final Report. State Water Resources Control Board, NOAA, California Departmentof Fish and Game, Marine Pollution Studies Laboratory, and Moss Landing Marine Lab. Sacramento, CA.
Kyle, A. (1998). Contaminanted Catch: The Public Health Threat from Toxics in Fish. Natural ResourcesDefence Council. New York, NY.
Mearns, A.J., M. Matta, G. Shigenaka, D. MacDonald, M. Buchman, H. Harris, J. Golas, and G. Lauenstein.(1991). Contaminant Trends in the Southern California Bight: Inventory and Assessment. NOAA TechnicalMemorandum NOS ORCA 62. Seattle, WA.
McCain, B.B, S-L Chan, M.M. Krahn, D.W. Brown, M.S. Myers, J.T. Landahl, S. Pierce, R.C. Clark, Jr.,and U. Varanasi. (1992). Chemical contamination and associated fish diseases in San Diego Bay. Environ.Sci. Technol. 26:725-733.
SDCDH (San Diego County Department of Health Services). (1990). San Diego Bay Health Rish Study.Prepared for the Port of San Diego. Document No. 25467.
U.S. Department of the Navy, Southwest Division (USDoN, SWDIV) and San Diego Unified Port District(SDUPD). (2000). San Diego Bay Integrated Natural Resources Management Plan, September 2000. SanDiego, Ca. Prepared by Tierra Data Systems, Escondido, CA.
Ecological Assessment of San Diego Bay Bioaccumulation of Contaminants in Fish Tissue

80
Van den Berg, M., L. Birnbaum, A. Bosveld, B. Brunstrom, P. Cook, M. Feeley, J.P. Giesy, A. Hanberg, R.Hasegawa, S.W. Kennedy, T. Kubiak, J.C. Larsen, R. van Leeuwen, D. Liem, C. Nolt, R.E. Peterson, L.Poellinger, S. Safe, D. Schrenk, D. Tillitt, M. Tysklind, M. Younes, F. Waern, and T. Zacharewski. (1998).Toxic equivalency factors (TEFs) for PCBs, PCDDs, PCDFs for humans and wildlife. Environ. HealthPerspectives 106:775-792.
Ecological Assessment of San Diego Bay Bioaccumulation of Contaminants in Fish Tissue