bioaffinity mass spectrometry for screening and
TRANSCRIPT

Bioaffinity mass spectrometry for screening and identification of
contaminants
Payam Aqai

Thesis committee
PromotorProf. Dr M.W.F. NielenProfessor of Analytical Chemistry, with special emphasis for the detection of chemical food contaminantsWageningen University
Co-promotorDr W. HaasnootProject leader and senior scientist, Toxicology and BioassaysRIKILT, Wageningen UR
Other MembersProf. Dr H. Gruppen, Wageningen University Prof. Dr C.G. de Koster, University of AmsterdamProf. Dr C.T. Elliott, Queen’s University Belfast, Northern Ireland, UKProf. Dr M. Honing, VU University Amsterdam
This research was conducted under the auspices of the Graduate School VLAG (Advanced studies in Food Technology, Agrobiotechnology, Nutrition and Health Sciences).

Bioaffinity mass spectrometry for screening and identification of
contaminants
Payam Aqai
ThesisSubmitted in fulfillment of the requirements for the degree of doctor
at Wageningen Universityby the authority of the Rector Magnificus
Prof. Dr M.J. Kropff,in the presence of the
Thesis Committee appointed by the Academic Boardto be defended in public
on Monday 16th of December 2013at 4 p.m. in the Aula.

Payam AqaiBioaffinity mass spectrometry for screening and identification of contaminants
197 pagesPhD thesis, Wageningen University, Wageningen, NL (2013)With references, with summaries in Dutch and English
ISBN 978-94-6173-804-2

Abstract
Our environment is constantly threatened by large amounts and variations of man-made chemicals and natural substances. Parts of these substances accumulate and contaminate soil and surface water, affecting the organisms living in it and eventu-ally contaminate the food chain. The European Union (EU) has imposed regulations and obliged EU member states to monitor for possible contaminants in the environ-ment and food. For this, highly sophisticated mass spectrometry (MS) techniques, which can nowadays screen >100 contaminants in a single run, are applied. For rapid and inexpensive screening of contaminants, bioactivity-based screening as-says are applied, however, identification of compounds based on their chemical-physical properties is not possible. As both methods cannot identify emerging and unknown bioactive contaminants, there is a need for new tools and concepts. In this thesis, new bioaffinity MS (BioMS) concepts, using an antibody, transport pro-teins and a receptor, are presented for the screening and identification of contami-nants. In the first concept, monoclonal antibodies (Mabs) against ochratoxins were coupled to fluorescent labeled paramagnetic microbeads for high-throughput flow cytometric screening of ochratoxins in wheat and cereal. The identification of ochra-toxins with nano-ultra performance liquid chromatography-quadrupole-time-of-flight-MS (nano-UPLC-Q-ToF-MS) was achieved in full scan accurate mass mode. In the second BioMS approach, the flow cytometer was replaced by UPLC-triple quadru-pole (QqQ)-MS for rapid screening of thyroid transporter ligands. For this, thyroid transport protein transthyretin (TTR) was immobilized onto inexpensive non-colored paramagnetic microbeads and a stable isotopic thyroid hormone was used as label in the competitive inhibition format. For the identification of TTR-binding endocrine disrupting chemicals (EDCs) in process water and urine, nano-UPLC-Q-ToF-MS was used. In order to perform high-throughput screening, a microtiter plate-based high-throughput BioMS approach was developed with the same beads but coupled with recombinant human sex hormone-binding globulin (rhSHBG) for the detection of designer steroids in dietary supplements. Following the screening with rhSHBG-based BioMS using LC-QqQ-MS, the rhSHBG bioaffinity extracts were injected onto chip-UPLC-Q-ToF-MS operated in full scan mode and a wide range of steroids were identified. The same approach was applied with the estrogen receptor α (ERα) in which LC-QqQ-MS, instead of the commonly applied GC-MS, was used for the screening of estrogens with a suitable LC-MS-compatible label. The identification of estrogens in ERα-purified supplement extracts was achieved with UPLC-ion mobil-ity (IM)-Q-ToF-MS. These new BioMS concepts present new tools for the screening and identification of emerging yet unknown food and environmental contaminants to ensure consumer’s health and fair play in sports.


List of abbreviations
13C2,15N-Tamo 13C2,15N-tamoxifen
AAS anabolic-androgenic steroids
ABP androgen binding protein
ACN acetonitrile
AF aflatoxin
API atmospheric pressure ionization
BCA bicinchoninic acid
BioMS bioaffinity mass spectrometry
BPA bisphenol A
BSA bovine serum albumin
CCS collision-cross section
CH3COCl acetyl chloride
CHO Chinese hamster ovary
CID collision-induced dissociation
CLAD 4-androsten-4-chloro-3,17-dione
Cl-T 4-chloro-testosterone
dehydroproges. 16-dehydroprogesterone
DES diethylstilbestrol
DHEA dehydroepiandrosterone
DHT dihydrotestosterone
E. coli Escherichia coli
E1 estrone
E3 estriol
EDC N-(3-dimethylaminopropyl)-N’-ethylcarbodiimide
EDCs endocrine disrupting chemicals
EDTA ethylenediaminotetra acetic acid
EFSA European Food Safety Authority

EI electron impact
ERα estrogen receptor α
ERβ estrogen receptor β
ESI electrospray interface
EtOH ethanol
EU European Union
Fab fragment antigen binding site
FB fumonisin B
FCIA multiplex flow cytometric immunoassay
FLD fluorescence detector
FP fluorescent polarization
GABA γ-aminobutyric acid
GC gas-chromatography
HCOOH formic acid
His-tag polyhistidine-tag
HR high resolution
HRMS high resolution MS
hSERT human serotonin transporter
HTS high-throughput screening
IAC immunoaffinity chromatography
Igs immunoglobulins
IM ion mobility
IPs identification points
IT-MS ion trap-MS
IUPAC International Union of Pure and Applied Chemistry
LBD ligand binding domain
LC liquid chromatography
LLE liquid-liquid extraction

LoD limit of detection
LR low resolution
Mabs monoclonal antibodies
Madol 17α-methyl-5α-androst-2-en-17β-ol
MeOH methanol
MES 2-(N-Morpholino)ethanesulfonic acid
MFI mean fluorescent intensity
ML maximum levels
MRM multiple reaction mode
MRL maximum residue level
MRPL minimum required performance limit
MS mass spectrometry
MS/MS tandem mass spectrometry
Na3PO4 tri-sodium phosphate
NaCl sodium chloride
NaH2PO4 sodium dihydrogen phosphate
NaN3 sodium azide
Nar naringenin
NMR nuclear magnetic resonance
NRs nuclear receptors
NSAID non-steroidal anti-inflammatory drug
OTA ochratoxin A
OTB ochratoxin B
OTC ochratoxin C
OTα ochratoxin α
OTβ ochratoxin β
Pabs polyclonal antibodies
PBST phosphate buffered saline with Tween 20

proges. progesterone
QqQ triple quadrupole
Q-ToF quadrupole-time-of-flight
Rabs recombinant antibodies
RAP relative androgenic potency
RB relative binding
RBA relative binding affinity
REACH Registration, Evaluation, Authorization and Restriction of Chemicals
REP relative estrogenic potency
rhSHBG recombinant human sex hormone-binding globulin
R-PE R-Phycoerythrin
RRA radiolabel receptor assay
RT room temperature
rTTR recombinant thyroid transport protein transthyretin
RU response units
SL-A superloop-A
SL-B superloop-B
SPE solid-phase extraction
SPR surface plasmon resonance
SRM single reaction monitoring mode
sulfo-NHS N-hydroxysulfosuccinimide sodium salt
T3 triiodothyronine
T4 L-thyroxine
T-Ac testosterone-17-acetate
Tamo tamoxifen
TBBPA tetrabromobisphenol-A
TBG thyroxine binding globulin
T-cyp testosterone-17-cypionate

T-D3 17β-testosterone-d3
T-dec testosterone-17-decanoate
THG tetrahydrogestrinone
UF ultrafiltration
UPLC ultra-performance liquid-chromatography
WADA World Anti-Doping Agency
WB buffer Wash & Binding buffer
xMAP® MultiAnalyte Profiling
YAB yeast androgen bioassay
YEB yeast estrogen bioassay
yEGFP yeast-enhanced green fluorescent protein
zea zearalenone
α-1-T 17α-1-testosterone
α-bol 17α-boldenone
α-E2 17α-estradiol
α-norT 17α-19-nortestosterone
α-T 17α-testosterone
α-zear α-zearalanol
β-1-T 17β-1-testosterone
β-bol 17β-boldenone
β-E2 17β-estradiol
β-E2-glu 17β-estradiol-3-glucuronide
β-E2-sul 17β-estradiol-3-sulphate
β-norT 17β-19-nortestosterone
β-sito β-sitosterol
β-T 17β-testosterone
β-T-glu 17β-testosterone-glucuronide
β-zear β-zearalanol

Chapter 1 General introduction and thesis outline
Chapter 2 Immunomagnetic microbeads for screening with flow cytometry and identification with nano-liquid chromatography mass spectrometry of ochratoxins in wheat and cereal
Chapter 3 Triple bioaffinity mass spectrometry concept for thyroid transporter ligands
Chapter 4 High-throughput bioaffinity mass spectrometry for screening and identification of designer anabolic steroids in dietary supplements
Chapter 5 Receptor-based high-throughput screening and identification of estrogens in dietary supplements using bioaffinity liquid-chromatography ion mobility mass spectrometry
Chapter 6 General discussion and future perspectives
Summary
Samenvatting
Dankwoord
About the author
Page
13
67
91
115
145
173
183
187
191
193
Table of Contents

1General introduction and thesis outline

Chapter 1
14
Food and environmental contaminants
Due to the needs of our society, large amounts of man-made chemical substances are being produced by the industry. Some of these substances might contaminate the environment by accident or deliberately and can accumulate, contaminating soil and surface water, affecting the organisms living in the environment and entering the food chain [1-4]. The contamination is not only caused by the industry but also by households [5]. Although some substances might not be toxic at low concentra-tions, due to continuous accumulation their concentrations may increase to a point which makes them harmful to the environment and organisms. Next to the apparent adverse health effects, the economic impacts are significant when e.g. contaminated food has to be removed from the market [6]. The costs of an environmental con-tamination incident affect both individuals and the industry and therefore the best policy is to avoid these contaminants from entering the environment and/or food chain. This can be achieved through regulations and through monitoring possible contaminants in environment and food matrices. For this, rapid and inexpensive screening methods are required which must be capable of detecting known and unknown hazardous contaminants [7]. In this research, various relevant food and environmental contaminants were chosen as model compounds. These compounds were used to develop novel bioaffinity mass spectrometric (BioMS) concepts for the screening and identification of known and yet unknown emerging contaminants. In this chapter, these compounds are introduced. The model compounds researched in this study are considered as environmental and/or food contaminants and are divided in groups based on whether they are man-made or naturally occurring. The former group of compounds consists of chemicals derived from an industrial source (industrial contaminants) that enter the food chain through the environment or from their use in household products and influence the endocrine system. In this group also exogenous steroid hormones are included since the man-made steroids are being produced for several specific medical applications, but also for the illegal use in sports and animal farming. The substances in this group could either threaten the consumers’ health through direct uptake or through the contamination of e.g. surface water or soil. The second group includes toxins, such as mycotoxins, which are secondary metabolites from fungi known to contaminate a variety of food and agricultural commodities worldwide. Mycotoxins are recognized as a potential threat to humans and animals through either direct contamination of plants or by carry-over of mycotoxins into animal tissue, milk and eggs after intake of contaminated feed [8].
Endocrine disrupting chemicals
Many industrial xenobiotics are considered endocrine disrupting chemicals (EDCs)

General introduction
15
as they might disrupt the normal functioning of the endocrine system of wildlife or humans [9, 10]. EDCs can mimic or antagonize the effects of the endogenous hor-mones or disrupt the synthesis and metabolism of endogenous hormones and dis-rupt the binding of endogenous hormones to transport proteins. The EDCs enter the marine environment directly through discharges of industrial and sewage wastewa-ter, emissions from various marine activities and oil spills and indirectly through riv-ers, streams and canals that receive untreated wastewater before entering the sea [11]. EDCs can end up in food through the environment but also through migration from e.g. plastic food containers [12]. EDCs may be present in packaging materials as flame retardants, color, flexibility or softness agents. One of these relevant xeno-biotics (i.e. a man-made chemical contaminant), is tetrabromobisphenol-A (TBBPA) which structurally has similarities to natural thyroid hormone L-thyroxine (T4) (See Figure 1).
Figure 1. Molecular structure of TBBPA (A) and T4 (B).
The production and consumption estimates of TBBPA vary from 120,000 [13] to 150,000 tons/year, including TBBPA derivatives [14]. TBBPA is used as a flame re-tardant in many products such as electronics equipment, transportation devices, sports equipment, and furniture parts [15]. There are no restrictions in the EU to produce TBBPA and a preliminary report by the European Food Safety Authority (EFSA) found no risk in using TBBPA as flame retardant [16]. However following an EU survey, TBBPA was reported to be present in fish, birds, air and dust, surface water, plants and food [16]. TBBPA is reported to have a binding affinity equal to or higher than T4 to the transport protein transthyretin (TTR) [17-19]. T4 and its biologi-cally active metabolite, triiodothyronine (T3), are essential for the modulation of the cellular metabolic rate and for the development and differentiation of several organs, especially the brain [20-23]. If T4 is displaced from its transport proteins by e.g. TBBPA, this could have consequences in fetal development and later in adulthood [24, 25]. Another xenobiotic is triclosan (see Figure 2), which is a broad spectrum antimicrobial used widely in e.g. disinfectants, soap, toothpaste and shampoo [26], but also reported to be a member of the group of EDCs as it competes with thyroid hormones for TTR [17].
A B

Chapter 1
16
Figure 2. Molecular structure of triclosan.
Although triclosan has a lower binding affinity towards TTR compared to T4, due to its occurrence at high levels it can compete with T4 [27]. To give an example of the presence of this compound, Calafat et al. described triclosan levels between 2.4 and 3800 µg L-1 in nearly 75% of urine samples collected from a US National Health and Nutrition Examination Survey including subjects ≥ 6 years old [28]. The pres-ence and bioaccumulation of these bioactive chemicals in the food chain and con-sequently in humans is a cause of health concern and there is an increasing need for high-throughput screening and identification methods for chemicals affecting the thyroid system at different levels.
Steroid hormones
The pharmaceutical industry is a source which releases steroid hormones into the environment, but also humans and animals excrete natural steroid hormones which end up in the environment through sewage discharge and animal waste disposal contaminating eventually the surface water [29]. Steroid hormones in the environ-ment may affect not only wildlife and humans but also plants. Steroid hormones can enter the food chain also by the legal and illegal use of steroids as growth promot-ers in livestock. The chemical structure of steroid hormones consists of a polycyclic C17 steran skeleton named cyclopentaneperhydrophenanthrene which has three condensed cyclohexane rings (A, B and C) and a cyclopentane ring (D). Depend-ing on the presence and location of methyl and alkyl side chain groups, the parent steroid structures are classified as pregnane (C21), androstane (C19) or estrane (C18) (Figure 3) [30]. For steroids, systematic as well as trivial names are widely used. Systematic names are applied according to the rules for steroid nomenclature formulated by the International Union of Pure and Applied Chemistry (IUPAC) [31]. In this nomenclature, the parental steroid structure (preg-, androst- and estr-) is the basis for denomination and prefixes and/or suffixes are added to indicate the pres-ence and location of substituents and double bonds.

General introduction
17
A B
C
A B
C
R1 R2 R3
Pregnane CH3 CH3 C2H5
Androstane CH3 CH3 H
Estrane H CH3 H
Figure 3. The cyclopentaneperhydrophenanthrene structure with the parent structures of pregnane, an-
drostane and estrane list [30].
On basis of biological activity and pharmacological effect, steroid hormones are di-vided into two groups. One group is sex hormone steroids producing sex differences which include estrogens, androgens and gestagens. The other group includes corti-costeroids which regulate metabolism and functions in the immune system. Another way of classification is based on whether the steroid hormones are endogenous or exogenous. Endogenous steroid hormones are biosynthesized in the organism and exogenous hormones are foreign compounds which have steroidal effect. The exog-enous can be either man-made or naturally synthesized. In the following paragraph estrogens, androgens and gestagens are described in more detail. Estrogens are the endogenous C18 female sex hormone. They are mainly produced by the reproductive organs and adrenal glands in females and at lower quantities in males. Estrogens are responsible for stimulating the female reproductive system, secondary sexual characteristics and are also important in mineral, fat, sugar and protein metabolism estrogens [32, 33]. The estrogen receptor α and β (ERα and ERβ) mediate the most effects of estrogens. ERα is mainly expressed in the sex organs and ERβ is very important in the bone, urogenital tract, cardiovascular and central nervous systems and the developing brain [34-36]. 17β-estradiol (β-E2), es-trone (E1) and estriol (E3) (see Figure 4) account for the most estrogenic activity in humans, mediated by the estrogen receptor [37].
Figure 4. Molecular structures of (A) 17β-estradiol (β-E2), (B) estrone (E1) and (C) estriol (E3).
However, the estrogen receptors can also bind exogenous hormones and EDCs having ER affinity. Table 1 shows the relative estrogenic potency (REP) values of
A B C

Chapter 1
18
various endogenous and exogenous hormones demonstrating that next to endog-enous estrogens many other exogenous compounds can be estrogenic.
Table 1. Reported relative estrogenic potency (REP) values in the RIKILT yeast estrogenic assay. Table
used with permission [38].
Since natural estrogens are metabolized rapidly in the human body, oral adminis-tration is only effective at very high concentrations. Estrogens can be used to treat menopausal and postmenopausal syndromes and prostate and breast cancers [39]. However, estrogens can also be used illegally as growth promoter in animal farming [40-42]. Androgens are C19 steroids which are important in differentiation and maturation of male reproductive organs and the development of male secondary sex characteris-tics [43]. 17β-testosterone and 5α-dihydrotestosterone are the two most important steroid hormones of adult males (see Figure 5).
Compound REP
17β-estradiol 1
17α-ethinylestradiol 1.2
diethylstilbestrol 1.0
dienestrol 0.56
hexestrol 0.36
estrone 0.20
mestranol 0.11
17α-estradiol 0.093
2-hydroxyestradiol 0.011
17β-estradiol 3-benzoate 0.0086
estriol 0.005
nonylphenol 0.009
coumestrol 0.0057
zearalenone 0.0046
α-zearalenol 0.055
β-zearalenol 0.0026
bisphenol A 0.00005

General introduction
19
Figure 5. Molecular structures of (A) 17β-testosterone and (B) 5α-dihydrotestosterone.
17β-testosterone, which is made in the Leydig cells of the testes and in the adrenal cortex, has both androgenic and anabolic actions in humans and animals as shown in experimental studies [44-47]. The anabolic actions include the inhibition of protein catabolism and stimulation synthesis in the skeletal muscle. Many attempts have been made to make derivatives of 17β-testosterone, also called anabolic-androgenic steroids (AAS), to enhance the anabolic effect while the undesired androgenic effects are reduced [48, 49]. However, since both the AAS and 17β-testosterone bind to the same androgen receptor, the anabolic effects cannot be entirely separated from the androgenic effects [50]. AAS have also medical uses in certain types of anemia and they can help in stimulating sexual development in hypogonadal men [43, 51]. Following the publication of the results of muscle generating treatments, it became obvious that AAS could also be used illegally to enhance the performance of athletes [44, 50]. AAS are still available on the black market as growth promoting agent for animals because AAS cause weight increase and reduce feed conversion ratios, reduce nitrogen retention, increase water retention and fat content [34, 52, 53]. New AAS are being synthesized in order to be able to use the AAS in sports or animal farming while staying unnoticed during screening in the laboratories. For example, the designer steroids tetrahydrogestrinone (13,17-diethyl-17-hydroxy-18,19-dinor-17-pregn-4,9,11-trien-3-one, THG) [54] and 17α-methyl-5α-androst-2-en-17β-ol (Madol) [55] were not detected in routine testing prior to finding the preparations of these designer steroids (these designer steroids were found in a syringe and an oily product respectively). Gestagens are C21 steroids like progesterone and they are excreted by the corpus luteum in the ovary of women, the testes, the adrenal glands and the placenta [34]. Gestagens are used for the treatment of endometriosis and in the management of certain kinds of breast and endometrial cancers [56]. They are also used in oral contraception [40] and have a growth promoting effect in man and animals [57-59]. This effect is caused by the improvement of weight gain and feed efficiency in meat-producing animals [60, 61].
A B

Chapter 1
20
Mycotoxins
Mycotoxins are secondary metabolites produced by a range of fungal species. Fungi of the genus Aspergillus, Penicillium, Fusarium and Alternaria are the predominant mycotoxin producers [62]. More than 300 different mycotoxins have been found to induce signs of toxicity in mammals [63]. It is estimated that 25% of the world’s crop production is contaminated with mycotoxins. High levels of mycotoxins, especially of aflatoxin (AF), fumonisin B (FB) or ochratoxin A (OTA), in food and feed commodities may have adverse effects on human and animal health, inducing different kinds of mycotoxicoses including carcinogenic effects [64]. OTA is a mycotoxin which has carcinogenic, nephrotoxic and teratogenic properties and is produced by Aspergillus and Penicillium fungi [65-68]. The Aspergillus fungus also produces OTA analogues such as the non-chlorinated ochratoxin B (OTB), ochratoxin α (OTα) and ochratoxin β (OTβ) (Figure 6). Most analogues are reported as less toxic than OTA but ochratoxin C (OTC) is considered as toxic as OTA since it is converted into OTA after metabolism [65, 66].
Figure 6. Molecular structures of (A) OTA, (B) OTB, (C) OTα, (D) OTβ and (E) OTC.
A B
C D
E
A B
C D
E

General introduction
21
All analogues are produced approximately 10 times less by the Aspergillus and Penicillium fungi [66, 69]. Regardless of the natural occurrence and toxicity of OTB, OTα, OTβ and OTC, the majority of existing methods are focused on OTA only. OTA is widely found in cereals, wine, coffee, beer, nuts, dried fruits and meat products [67, 70]. Table 2 shows the worldwide contamination of OTA in food commodities [71].
Table 2. Worldwide contamination of OTA in foods (used with permission [71]).
Country Food commodity Levels (ppb) Reference
Argentina Peanut 5.6-130 [72]Belgium Wheat 39E3-823E3 [73]Bulgaria Wheat 1.5-18 [74]Canada Oat-based cereals 0.12-0.4 [75]
Barley-based cereals 0.21-6.9Soy-based cereals 0.15-0.9Rice-based cereals 0.3-2.4
Croatia Wheat 0.02E9-160E9 [76]Corn 0.02E9-40E9Dry beans 0-0.21 [77]
Ethiopia Cereals 54.1-2106 [78]Egypt Corn 9.3-15 [79]India Maize 0-20 [80]
Spices 10-102 [81]Spices 10-120 [82]
Japan Cereal products <39 [83]Korea Rice 0.2-1 [84]Kuwait Coffee 0.6-4.5 [85]Morocco Rice 0.15-4.7 [86]Nigeria Rice 24-1164 [87]Qatar Cereals and cereal products 0.2-4.91 [88]Tunisia Cereal 55-117 [89]Turkey Wheat flour 0.025-10.5 [90]Vietnam Rice 0.75-2.78 [91]
Cereal and cereal products are the main sources of EU consumer exposure to OTA [92]. The maximum levels (ML) established by the EU for OTA in food vary between 0.5 and 10 ng g-1 [93]. The ML in cereal and cereal products is 5 ng g-1 and if the cereal is meant for direct human consumption, the ML is 3 ng g-1. The lowest OTA ML of 0.5 ng g-1 is established for baby food. Guidance values in feed vary between 50 and 250 ng g-1 and for OTA in cereal or cereal products used as feed material 250 ng g-1 is applied [94].

Chapter 1
22
EU legislation related to screening and confirmation methods
To ensure consumer’s health and fair trade, EU countries have to monitor all kinds of contaminants which may occur in food. To control and monitor food contaminants such as steroid hormones or mycotoxins, the EU has introduced regulations which describe at what levels contaminants are not considered a risk and which methods are considered suitable for monitoring various food samples. These regulations are mainly focused on existing known contaminants.
Screening methods
Screening methods are used to detect the absence or presence of a substance or class of substances at the level of interest. Typically, these methods have high-throughput capability and are used to screen large numbers of samples for potential non-compliant results. According to Commission Decision 2002/657/EC, screening methods are specifically designed to avoid false compliant results [95]: screening methods must be validated and have a false compliant rate of < 5 % (β-error) at the level of interest and in the case of suspect non-compliant findings, the result must be confirmed by a confirmatory method. Screening methods can be performed using commercially available (field) test kits. These test kits are rapid and low-cost and mostly based on immunoassays. The results produced by these test kits, are qualitative or at best semi-quantitative and multiplexing (combining different assays) is still rare. Multiplex flow cytometric immunoassay (FCIA) screening methods are described for food contaminants using the flow cytometer of Luminex®. This instrument works with microbeads and biomolecules and it is possible to simultaneously measure up to 100 different biomolecular interactions in a single well [96]. Other distinct advantages are high-throughput capability (<1h/96 tests), versatility, accuracy and reproducibility [97]. More details on the principle of the Luminex®-based screening are described in “Existing methods for the analysis of contaminants”. Multiplex FCIAs are described for the screening of plant proteins, which might be used as adulterants in milk powders [98], pathogens [99], mycotoxins in cereal, wheat and feed [100, 101], sulfonamides in milk [102] and polycyclic aromatic hydrocarbons in fish [103]. An alternative screening approach was developed in this research in which biomolecules such as antibodies, transport proteins or receptor were immobilized onto superparamagnetic beads and LC-MS/MS was used as readout system [27, 104, 105]. More details of such a BioMS screening is described in “Existing Methods for the analysis of contaminants”. Using the BioMS approach, high-throughput screening of EDCs in process water and urine and steroids in dietary supplements was achieved. Indeed, like other conventional screening methods, the non-compliant results had to be subjected to a confirmatory or identification method.

General introduction
23
Confirmation
In Commission Decision 2002/657/EC, confirmatory methods are described as methods that provide full or complementary information enabling the substance to be unequivocally identified and if necessary quantified at the level of interest [95]. Table 3 shows confirmatory methods which are considered suitable according to Commission Decision 2002/657/EC [95].
Table 3. Confirmatory techniques for Group A and B substances according to 2002/657/EC [95].
Measuring technique Substances Annex I Limitations
LC or GC with
mass-spectrometric
detection
Group A and B
Only if following either an on-line or an off-line chromatographic sepa-ration. Only if full scan techniques are used or using at least 3 (group A) or 4 (group B) identification points for techniques that do not record the full mass spectra.
LC or GC with IR
spectrometric detectionGroup A and B
Specific requirements for absorp-tion in IR spectrometry have to be met.
LC full-scan DAD Group BSpecific requirements for absorp-tion in UV spectrometry have to be met.
LC fluorescence Group B
Only for molecules that exhibit na-tive fluorescence and to molecules that exhibit fluorescence after ei-ther transformation or derivatiza-tion.
2D TLC – full scan UV/VIS Group BTwo-dimensional HPTLC and co-chromatography are mandatory.
GC-Electron capture
detectionGroup B
Only if two columns of different po-larity are used.
LC- immunogram Group BOnly if at least two different chro-matographic systems or a second, independent method are used.
LC-UV/VIS (single
wave-length)Group B
Only if at least two different chro-matographic systems or a second, independent method are used.
96/23/EC

Chapter 1
24
Table 4. The numbers of IPs gained by each MS-technique.
MS-technique Identification points
Low resolution (LR) MS 1
LRMSn precursor ion 1
LRMSn product ion 1.5
High resolution (HR) MS 2
HRMSn precursor ion 2
HRMSn product ion 2.5
Confirmatory analysis of for instance veterinary drugs, steroids and mycotoxins are based on the collection of identification points (IPs), see Table 4. For confirmation, three (group B substances, see Table 5) or four IPs (group A substances, see Table 5) are required which could be obtained by using low resolution mass spectrometers such as triple-quadrupole mass spectrometer (QqQ-MS) and ion trap-MS (IT-MS) in combination with a chromatographic separation prior to MS detection. In this way, 1 IP is obtained for the precursor ion and 3 IPs for two product ions, yielding four IPs in total for “unequivocal conformation”. There are more ways to obtain three or four IPs, by using e.g. high resolution MS (HRMS) (≥ 20 000 at FWHM). For high resolution MS (HRMS), 2 IPs are earned for the precursor and 2.5 IPs for each product ion. Mass spectrometers with a resolution of 20,000 and higher can be used for confirmatory analysis when one precursor and one product ion can be recorded.

General introduction
25
Table 5. Overview of substances in group A and B of 96/23/EC.
Group A: Substances having anabolic effect and
unauthorized substances
1) Stilbenes, stilbene derivatives, and their salts and esters
1) Antibacterial substances, including suphonomides, quinolones
2) Antithyroid agents 2) Other veterinary drugs
3) Steroids a) Anthermintics
4) Resorcylic acid lactones including zeranol b) Anticoccidial, including nitroimidazoles
5) Beta-agonists c) Carbamates and pyrethroids
6) Compounds included in Annex IV to Council Regulation (EEC) No 2377/90 of 26 June 1990
d) Sedatives e) Non-steroidal anti-inflammatory drugs (NSAIDs) f) Other pharmacologically active substances
3) Other substances and environmental contaminants
a) Organochlorinc compounds including PcBs
b) Organophosphorus compounds
c) Chemical elements
d) Mycotoxins
e) Dyes
f) Others
In EU Commission Regulation 37/2010, all substances which should be subjected to monitoring are divided into two groups [106]. In this document, all allowed pharmacologically active type B substances with maximum residue levels (MRLs) are described. According to Council Regulation 2377/90, MRL means “the maximum concentration of a residue resulting from the use of a veterinary medicinal product which may be accepted by the Community to be legally permitted or recognized as acceptable in or on a food” [107]. For mycotoxins “maximum levels” (MLs) are used which describe at what level they are allowed to occur. For example, the ML values of mycotoxins (group B substances) in foodstuffs are described in the reference [108]. OTA has ML values between 0.5-10 µg kg-1 depending on the matrix. The ML values of other mycotoxins vary between 0.5-2000 µg kg-1. However, since steroids are categorized as group A substances (i.e. the use is prohibited), no ML or MRL values have been established [109]. This means that in animal farming, the administration of growth-promoting agents, such steroids, through supplements is also prohibited. For the purpose of control of residues of certain substances whose use is prohibited or not authorized in the EU community, the minimum required performance limits (MRPLs) are determined. This means that the monitoring labs should have methods which can detect substances of interest at MRPL levels. If results of analytical tests
Group B:Veterinary drugs and contaminants

Chapter 1
26
are at or above the MRPLs described in Decision 2002/657/EC, the samples are considered non-compliant. In order to achieve fair play, the use of hormones and anabolic steroids in sports are also forbidden by the World Anti-Doping Agency (WADA) [110]. In contrast to Council directive 96/22/EC [109], the WADA published a list of prohibited substances which include all anabolic steroids as well as their precursors. This list not only includes the compounds that control laboratories should screen for, such as exogenous and endogenous steroids, but also “compounds having similar biological activity” must be screened to avoid missing new designer steroids. In the EU, food supplements (certain vitamins and minerals) are covered by Directive 2002/46, and to be able to use these ingredients in dietary supplements, they must be listed in the annex to this legislation. In this list no anabolic compounds are described and therefore their presence in supplements is prohibited [111]. Although TBBPA is registered in the Registration, Evaluation, Authorization and Restriction of Chemicals (REACH), TBBPA and its derivatives are not regulated for food so far by the European Commission [16]. In general, no EU legislation is defined yet concerning EDCs in food or environment [16].
Identification
Although Commission Decision 2002/657/EC contains specific criteria for screening and confirmation, no clear definition is described for the identification of know or unknown substances. Only in the case of a suspect-screened sample, identification criteria by means of confirmation are described. In the literature the terms “identification” and “confirmation” are used interchangeably while the meaning of these are not the same [112]: identification is a qualitative result from a method which provides structural information (e.g. using MS detection or nuclear magnetic resonance (NMR)). In contrast, confirmation is achieved when a combination of two or more analyses that are in agreement and at least one method should meet the confirmation criteria described in “Confirmation” paragraph of 2002/657/EC. For identification purposes, multiple instruments and methods could be used to identify the compound of interest while the confirmatory criteria are not met necessarily. For example, Toorians et al. applied a yeast estrogen bioassay and LC-MS and NMR to identify a compound in a herbal supplement which was marketed to help against prostate cancer [113]. Following a strong response in the yeast estrogen bioassay, indicating the presence of an estrogen, a gradient liquid chromatographic time-of-flight mass spectrometry (LC-ToF-MS) method was used to obtain retention times and accurate mass data in full scan mode. This, together with NMR results, helped to identify the “unknown” compound which turned out to be diethylstilbestrol (DES). Similarly, Rijk et al. used an androgen yeast assay for screening and LC-Q-ToF-MS to identify 1-testosterone which was not acquired during routine LC-QqQ-MS measurement in pre-selected mass mode called multiple reaction mode (MRM) [114].

General introduction
27
In this thesis, identifying known and unknown substances was achieved, following screening, by their chemical physical properties. This was done using e.g. LC-ion mobility (IM)-Q-ToF-MS to obtain retention time, accurate mass measurement in full scan mode, product ions and in one example also specific drift times. Drift times, acquired from ion mobility data from which collision-cross section (CCS) values can be derived, offer an additional orthogonal identification point next to retention time, accurate mass and MS/MS product ion data. All these points of identification were used for unequivocal identification of known and unknown compounds. Still, full structure analysis by 2D-NMR would be desirable but, unfortunately, that technique lacks sensitivity for trace analysis.
Biorecognition elements
A large number of affinity pairs, such as lectin-sugar, antigen-antibody, ligand-receptor and biotin-avidin, are known. In this thesis, different types of interactions are used by immobilizing the protein onto a solid surface (see “Immobilizations of biomolecules” for immobilization approaches) followed by protein-ligand interactions. This was done to achieve rapid bio-isolations of hazardous food and environmental contaminants having affinity towards the selected proteins for screening and identification purposes. In the following paragraph the proteins used in thesis are introduced.
Antibodies
Antibodies belong to the family of proteins called immunoglobulins (Igs) which are present at 12-15 mg mL-1 in blood serum comprising about 20% of its total protein content. There are five Ig classes known in mammals, IgG, IgM, IgA, IgD and IgE with molecular masses ranging from 150,000 to 970,000 Da. IgG represents 70% of the serum immunoglobulins and is responsible for the majority of the secondary immunological response to most antigens. IgG molecules consist of three domains (two Fab domains and one Fc domain) (see Figure 7). The Fab (fragment antigen binding site) domains form two arms of the Y shape and are identical which makes IgG molecules bivalent. The part that is involved in immune regulation is called Fc fragment (this fragment crystallizes) and is the base of the Y structure. The heterogeneity in the Fab regions of antibodies contributes to the capability to respond to a large number of antigens. This means that mammalians are able to generate an immune response with a diversity of up to 105-106 different antibodies. The specific binding between an antibody and an antigen or ligand is based on structural and chemical interactions that occur within the antigen-binding site.

Chapter 1
28
Figure 7. Typical immunoglobulin molecule in which Fab and Fc domains are displayed.
The antigen-antibody interaction is a reversible interaction and involves the formation of non-covalent bonds. The binding between antigen and antibody is the result of a variety of interactions including hydrophobic, ionic, hydrogen bonds, π-π electron interaction and van der Waals forces. These interactions also play a role in the binding of a ligand to other biomolecules such as transport proteins and receptors. Typically, the affinity of antigen towards an antibody increases with the larger number of specific chemical interactions that occur in the antigen binding site. Therefore, the specificity and efficiency of biorecognition of ligands in a sample are heavily influenced by the precise nature of the antigen(ligand)-(biomolecule)antibody binding process. Any small change in antigen structure will affect the affinity of the antibody-antigen interaction and with that the efficiency of any biorecognition procedure. The most applied antibodies for biorecognition isolation procedures are monoclonal antibodies (Mabs), polyclonal antibodies (Pabs) and recombinant antibodies (Rabs). The main difference between these types of antibodies is related to the specificity of the antigen-antibody binding. Mabs allow the isolation of antigens with very high specificity, whereas Pabs could show interactions with multiple epitopes or antigens. Rabs can possess both specific and generic specificity towards antigens, depending on how they were developed (e.g. generic sulfonamides Rabs [115]). Mabs, Pabs and Rabs have been shown to be sensitive, robust and selective biorecognition elements in binding assays. Another main difference is the way of production of Pabs, Mabs and Rabs. Pabs are derived from an immunized animal which produces generally a random number of clonotypes and its antiserum becomes polyclonal. Therefore, it is almost impossible to make reproducible Pabs against any epitope due to batch-to-batch variations. Even antisera from the same animal taken at different times differ in

General introduction
29
their properties. Pabs are typically produced by immunization of a suitable mammal, such as a mouse, rat, guinea pig, hamster, rabbit, goat, sheep, donkey or horse. The concentration of specific antibody in polyclonal sera is typically 50 to 200 μg mL-1, and the range of total IgG concentration in sera is between 5 and 20 mg mL-1 [116]. The preparation of a homogeneous population of Mabs was achieved with the development of the technology for hybridoma production. Köhler et al., developed a technique that allows the growth of clonal populations of cells secreting antibodies with a defined specificity [117]. In this technique an antibody-secreting cell, isolated from an accumulating organ of an immunized animal (e.g. from the spleen), is mixed with a myeloma cell, a type of B-cell tumor. These hybridomas can be prepared by fusing myelomas and antibody-producing cells isolated from different species. The hybridomas can be maintained in vitro and will continue to secrete antibodies with a defined specificity. The antibody concentration in the medium is about 2-50 μg mL-1 [118]. Standard procedures for the preparation, purification and characterization of Mabs are described in literature [119, 120]. The usefulness of Mabs is highlighted in three characteristics: their specificity of binding, their homogeneity and their production in unlimited quantities. The limitations of hybridoma technology include the extensive commitment of time, labor and expense, the requirement for animal use and specialized cell culture facilities and the expertise needed to prepare and screen large number of hybridomas to select the best ones [116]. Rabs are produced by the development of molecular methods for the expression of recombinant antibody fragments in bacteria. The techniques for production and screening of combinatorial libraries make a wide range of opportunities possible for the selection of Rabs and their engineering [121]. The most commonly used technology is phage display [122] which refers to the display of functional foreign peptides, proteins or antibody fragments on the surface of a bacteriophage. This is done by fusion of the DNA coding sequences of the protein to be displayed into the phage genome to the gene encoding one of the phage surface proteins. Surface display of the antibodies allows affinity selection of antibodies by exposing the phage library to immobilized antigen molecules. The captured phage particles can be eluted from the antigen, amplified by infecting Escherichia coli (E. coli) host cells and used in a next round of affinity selection. In the literature, various applications of antibodies are described for screening food and environmental contaminants [123-129]. Antibodies are used in immunoaffinity chromatography (IAC) for the specific isolation from sample materials prior to HPLC or LC-MS analysis [130-132]. However, such IAC columns are voluminous, use high amounts of carrier material with a high risk of non-specific binding. In an alternative approach, Chapter 2 describes the use of Mabs on magnetic beads for the specific isolation of the mycotoxin OTA followed by the identification by LC-MS [100]. Various immunoassays are described for rapid screening of contaminants using Mabs, Pabs or Rabs [123-129]. As rather novel approaches, surface plasmon resonance (SPR)-

Chapter 1
30
biosensor and flow cytometric immunoassays are described for the screening of e.g. sulphonamides (with Rabs) [115] and mycotoxins (with Mabs) [133], respectively. In this thesis, a Mab against the mycotoxin OTA was used to screen for its presence in wheat and cereal with a flow cytometry-based immunoassay and to confirm and identify an OTA analogue with mass spectrometry after immunoaffinity isolation. However, antibodies do not perform well when a group of structurally varied chemicals like steroids or endocrine disrupting chemicals (EDCs) have to be targeted in a single assay or if an effect-based isolation is required. In this case, other biorecognition elements, such receptors or transport proteins, are preferred for generic or effect-based bioaffinity isolation procedures.
Sex hormone-binding globulin (SHBG)
SHBG is a glycoprotein in blood plasma that is produced primarily by the liver (See Figure 8).
Figure 8. The crystal structure of human sex hormone-binding globulin [134].
Expression of the SHBG gene in the testis of several mammals also gives rise to a protein commonly known as the testicular androgen binding protein (ABP), which is thought to play a key role in sperm maturation [135, 136]. Plasma SHBG and testicular ABP bind biologically active androgens and estrogens and play a critical role in regulating the access of these sex steroids to their target cells [137]. Next to sex steroids, SHBG also binds many pharmaceutically important synthetic steroids, flavonoids and xenobiotics which makes this transport protein a very interesting biorecognition element to screen and identify a broad range of compounds [138-142]. Studies of SHBG in blood samples, or after its purification, indicated that its stability (in particular, stability of its dimer) is influenced by the presence of steroid ligands and metal ions [143]. Therefore, during production or purification, it is vital to

General introduction
31
avoid any metal chelating agent (e.g. ethylenediaminetetraacetic acid) and a steroid ligand (e.g. cortisol) must be present to preserve the stability of the protein. In the literature, SHBG has been used in binding assays for screening of its ligands and for determining binding affinities. Typically, no coupling with MS is done and therefore the identity of the binders remains undetermined. Mooney et al. developed an SPR-based biosensor screening assay in which SHBG was used as a bioreagent to indicate the illicitly used growth-promoting agents estradiol benzoate and nortestosterone decanoate during rearing of calves [144]. Plasma from control animals and treated animals were measured and significant reductions of SHBG binding capacity were observed in treated animals only. Jury et al. developed an SHBG-based radioassay which demonstrated binding affinities of numerous compounds [141]. In this thesis, purified recombinant human SHBG (rhSHBG) was used to develop screening and identification approaches for androgens and estrogens with MS. The rhSHBG, produced in Chinese hamster ovary (CHO) cells, contained a polyhistidine-tag (His-tag). This tag, which has affinity towards the metal ion Ni2+, was used to purify the protein and the steroid cortisol was used for stabilization purposes.
Transthyretin (TTR)
TTR is a transport protein which is responsible for transporting thyroids hormones. TTR is a 55 KDa tetramer of identical subunits, each containing 127 amino acids. The four subunits form a symmetrical ß-barrel structure with a double trumpeted hydrophobic channel that traverses the molecule forming the two allosteric iodothyronine binding sites (Figure 9) [145, 146]. Although TTR is bivalent, only one L-thyroxin (T4) molecule is usually bound because the binding affinity of the second site is greatly reduced through a negative cooperative effect [147]. TTR from fish, amphibians, reptiles and birds binds triiodothyronine (T3) with higher affinity, whereas TTR from mammals binds T4 with higher affinity [18, 19]. The TTR used in this thesis, was recombinantly produced by cloning the coding DNA into a vector and transforming the most suitable organism (E. coli) for overexpressing the protein [148]. By using this approach, the supply of the biorecognition element is almost unlimited. Bioaffinity screening assays have been developed for EDCs based on binding with TTR in competition with radiolabeled T4 and yielded IC50 values for specific flame retardants in the range of 60-90 nM [19, 149-151]. However, the use of a radiolabel is a serious disadvantage in binding assays and the methods described did not focus on screening of real samples but just on the determination of binding affinities of EDCs towards TTR.

Chapter 1
32
Figure 9. The crystal structure of human transthyretin [152].
A label-free SPR-based method was published by Marchesini et al. using T4 and TTR to determine binding affinities of EDCs (IC50 10 nM for T4) [17]. Although this method is sensitive and label-free, complex sample materials were not tested so the robustness of that method is yet unknown and no coupling with MS for confirmation and identification was described. In this thesis, rTTR was used to develop new bioaffinity-based procedures for the MS screening and identification of a broad range of compounds such as pharmaceuticals, flame retardants and triclosan.
Estrogens, such as 17β-estradiol, influence the growth, differentiation and functions of many target organs, such as the mammary gland, uterus, vagina, central nervous system and in the cardiovascular system [153]. Estrogens are produced in specialized tissues and are subsequently transported via the blood stream to their effector sites. Steroid hormones, such as estrogens, represent a subgroup mediating their action via a large group of related proteins, the super family of nuclear receptors (NRs) [154, 155]. Estrogen receptor (ER), an intranuclear binding protein, is one of these NRs which is mainly expressed in the sex organs like the mammary gland and the uterus (See Figure 10).
Figure 10. The crystal structure of estrogen receptor [152].

General introduction
33
Once bound by estrogens, the ER undergoes a conformational change, allowing the receptor to bind with high affinity to chromatin and to modulate transcription of target genes. The two ER subtypes, α and β, have slightly different affinity to a range of compounds such as estrogens, some androgens, phytoestrogens, anti-estrogens and environmental estrogens. This makes both subtypes interesting biorecognition elements to develop screening and identification approaches for a broad range of compounds. Jonker et al. developed an online protein-affinity LC-MS method in which ERα was used for screening [156]. However, measurements had to be corrected for activity loss per hour caused by degradation of the ER. Non-immobilized ER tends to be very sensitive to slight changes in e.g. temperature, salt concentration and pH. Usami et al. developed an SPR-based biosensor assay in which 17β-estradiol (β-E2) was used as a ligand, human recombinant ERα for biorecognition and test chemicals as competitors [157]. By means of this biosensor assay, dissociation constants for the binding of estrone (E1), β-E2, estriol (E3), tamoxifen (Tamo), DES, bisphenol A (BPA) and 4-nonylphenol were determined. Blair et al. determined the relative binding affinity (RBA) for a large group of chemicals by using an ERα competitive binding assay [158]. In this radio receptor assay, ER was obtained from rats and [3H]-β-E2 was used as the competing label. The obvious disadvantages of this assay include the use of a radiolabel and the long assay time of 24h. Plotan et al. presented the development of an estrogen responsive reporter gene assay coupled with a solid phase sample preparation enabling the detection of estrogenic constituents in sport supplements [159]. Reporter gene assays are slow (analysis time >2 days) and require a specific lab qualification. The ERα used in this thesis, is a construct corresponding to the receptor binding domain of the ERα which was expressed in E. coli. Due to the His-tag, the ERα was successfully purified by its Ni-affinity followed by size exclusion chromatography, after scouting of several buffer conditions for the various purification steps. The resulting protein had a high degree of purity (>90%) and was immobilized onto paramagnetic beads using two different surface chemistry approaches. Following immobilization, a screening and identification method was developed for estrogens in dietary supplements using MS.
Immobilizations of biomolecules
Both in chemical screening assays based on biorecognition and in bioaffinity MS, biomolecules such as antibodies, transport proteins or receptors, can be immobilized to solid supports in various ways [27, 104, 160-171]. This includes physical adsorption, affinity adsorption and covalent binding onto a solid phase. Physical adsorption of e.g. antibodies onto solid supports is widely employed for coating microtiter plates to be used in immunosorbent assays [165-167]. This approach is based on hydrophobic interaction and ligand or protein leakage may occur if organic modifiers are used.

Chapter 1
34
Therefore, this immobilization approach is considered simple and fast, however, only mild conditions are recommended. Affinity adsorption of antibodies can be done with a solid support containing protein A or protein G which bind to antibodies with high affinity [168-171]. This approach yields oriented immobilization which promotes the binding of the ligand to the binding site. The disadvantages of this approach include steric hindrance caused by protein A or protein G and undesired release of ligand can occur due to the reversible nature of this immobilization approach. Similarly, streptavidin-biotin interactions, one of the strongest non-covalent interaction known in biology, can be used for oriented and non-oriented immobilization manner of proteins [172]. In immunoassays, a 2 to 3 times higher binding signal for site-specifically biotinylated antibody species is reported [172]. Another oriented immobilization approach is to use histidine (His)-tagged biomolecules which show high affinity towards metal ions such as Ni2+ [156, 173]. In this way, the biomolecule is also immobilized in an oriented manner making the binding site better available for the ligand. This approach is simple, fast and can tolerate organic modifiers to some extend, however, the immobilized biomolecule tends to stay stable for a shorter time compared to a covalently immobilized biomolecule. In this thesis, several His-tagged biomolecules, such as transport proteins and a receptor, are immobilized using paramagnetic microbeads containing the Ni2+ metal complex in Chapters 3, 4 and 5. The mechanism of this approach is displayed in Figure 11.
Figure 11. Illustration of non-covalent oriented immobilization of His-tagged (black bars) proteins onto
Ni2+-containing superparamagnetic microbeads.

General introduction
35
Covalent immobilization onto solid surfaces can be achieved through amine groups on the biomolecule [100, 169, 174]. Usually, first a chemical group e.g. N-(3-dimethylaminopropyl)-N’-ethylcarbodiimide (EDC) is attached to the solid support for activation purposes. The EDC reacts with the terminal carboxylate groups from the magnetic bead to highly reactive O-acylisourea derivatives. This is done to form, in a next step, a covalent bond with amine groups on the biomolecule in a non-oriented manner. Following immobilization, the remaining active groups on the solid support are blocked to prevent any non-specific binding during the subsequent assay. Mostly, free amine groups present in the biomolecule are used for immobilization. Other functional groups which could be used for covalent non-oriented immobilization include carboxyl, hydroxyl, thiol and oligosaccharide groups present in the biomolecule of interest [160-164]. Figure 8 shows a typical covalent immobilization using the amine groups in the biomolecule and carboxyl groups present on the solid surface of a paramagnetic microbead. The advantages of such an approach include prolonged stability of the immobilized biomolecule and the increased chance to reuse the biomolecules [27, 175]. Disadvantages include a relatively long immobilization time compared to affinity oriented immobilization approaches (3 h vs <1) and, due to the non-oriented nature of this immobilization approach, the binding sites of the biomolecule will be less available. In this thesis, the amine groups of an antibody, two transport proteins and a receptor were used for covalent immobilization onto paramagnetic microbeads containing carboxyl groups (see Figure 12). By applying both oriented and non-oriented immobilization approaches, the influence of immobilizing proteins on the performance of the assay could be investigated.

Chapter 1
36
Figure 12. Illustration of covalent non-oriented immobilization of a protein onto a superparamagnetic
microbead containing carboxylic acid moieties.
Biorecognition-based isolation of contaminants
Bioaffinity isolations are based on specific reversible interactions of proteins with ligands in which the proteins are either in solution (using cut-off filters) or immobilized to a solid support (e.g. magnetic microparticles, as used in this thesis). Ligands binding to a protein, regardless whether the protein is immobilized or not, can be disrupted by a change in pH, salt, organic liquids, etc which weakens the interactions in protein-ligand complexes [176-179]. In the case that the protein is used in solution, the ligands are dissociated on basis of their size since only the free ligands pass through a cut-off filter. If the protein is immobilized, eluted ligands can be separated from the protein by using a magnet. Typical incubation, wash and elution volumes are 50-200 µL and 100-1500 µL using magnetic beads and cut-off filters respectively. Due to the combination of low-volumes and the specificity of the interaction, bioaffinity isolations can result in a very high enrichment in a single step (10-1000 fold). Apart from the enrichment, biopurified extracts are cleaner compared to chemical sample treatment procedures such as solid-phase extraction (SPE) or liquid-liquid extraction (LLE). This phenomenon is even observed when both types of extracts are measured on a rather specific LC-QqQ-MS system. Figure 13 illustrates the measurement of 17β-testosterone in a biopurified urine extract and

General introduction
37
non-biopurified urine extracts in highly selective single reaction monitoring mode (SRM). Despite the selective detection and the sample pretreatment procedure, co-eluting peaks are still observed in chromatogram B whereas no co-eluting peaks were measured in the biopurified extract depicted in chromatogram A.
Figure 13. Reconstructed chromatograms of 17β-testosterone in biopurified (A) and non-biopurified (B)
urine extract by LC-QqQ-MS in SRM mode. The ion transition m/z 289 à m/z 97 was measured.
Existing methods for the analysis of contaminants
Screening methods can be performed by using commercially available (field) test kits. These test kits are rapid and low cost and mostly based on immunoassays. The results produced by these test kits, are qualitative and multiplexing is in most cases not possible. In another immunoassay format, multiplex flow cytometric immunoassay (FCIA) screening methods have been described for food contaminants using the flow cytometer Luminex® [98, 99, 102, 133]. This instrument uses superparamagnetic or non-magnetic carboxylated polystyrene microbeads (6.5 μm diameter beads). Superparamagnetic means that the beads can easily be magnetized when an external magnetic field is applied and redispersed immediately when the magnet is removed, which enhances both ease-of-use and automation capabilities [180]. The microbeads are internally dyed with a red and an infrared fluorophore and by varying the ratio of the two fluorophores, up to 100 different color-coded bead sets can be distinguished (MultiAnalyte Profiling (xMAP®) technology). Each bead set can be covalently coupled, via its carboxylated surface, to a different biological probe such as antibodies or other (bio)molecules. Therefore, it is possible to simultaneously measure up to 100 different biomolecular interactions in a single well [96, 181]. Other distinct advantages are high-throughput capability (<1h/96 tests), versatility, accuracy and reproducibility [182]. Following screening, all non-complaint results have to be re-measured with a confirmatory method such GC-MS or LC-MS. Although FICAs can perform high-throughput screening on basis of biorecognition, they are unable to determine the identity of the screened compounds. For various contaminants, such as EDCs, a screening method was developed based on competition between EDCs and radiolabeled T4 for the binding sites of the transport

Chapter 1
38
protein TTR [149-151]. However, the use of a radiolabel is a serious disadvantage in binding assays. A label-free SPR-based method was published by Marchesini et al. using T4 and TTR to determine binding affinities of EDCs (IC50 10 nM for T4) [183]. Although this method is sensitive and label-free, complex sample materials were not tested so the robustness of that method is yet unknown and no coupling with MS for confirmation and identification was described. For the analysis of food and environmental contaminants existing methods generally are considered either screening methods or confirmatory/identification methods. In modern laboratories, gas chromatography (GC)-MS and LC-MS are used for the sensitive and specific detection of steroids, veterinary drugs, mycotoxins and pharmaceuticals in food and environmental samples [184-187]. In the literature, the screening of >100 compounds in one chromatographic run by ToF-MS or Orbitrap in full scan mode is reported [188, 189]. However, for quantification and confirmation in accordance with EU legislation and to achieve the highest sensitivity, most labs still use LC-MS and GC-MS in pre-selected ion or ion transition acquisition modes [190]. Figure 14 demonstrates the principle and set-up of such a pre-selected ion transition acquisition.
Figure 14. Principle of highly selective and sensitive electropray ionization (ESI)-QqQ-MS in MRM mode: following ionization, precursor ions are selected in Q1, Q2 is the collision-induced-dissociation cell in which selected precursor ions are fragmented and finally Q3 filters the pre-selected product ions.
The throughput of these methods is affected by long data processing times (each compound yields two ion transition peaks) and time-consuming sample pretreatment procedures such as pressurized liquid extraction, liquid-liquid extraction, solid phase extraction (SPE) and Soxhlet extraction and, more important, they do not provide information about bioactivity. For the screening of (designer) steroids,

General introduction
39
a yeast androgen bioassay (YAB) was developed by Bovee et al. [191]. This assay expresses yeast enhanced green fluorescent protein (yEGFP) of which the fluorescent emission is measured in response to androgens. The identification of androgens was performed by LC-fractionation of the suspect found sample into two 96-well plates after which one 96-well plate was screened again to indicate in which well androgens are present for identification with MS. The YAB demonstrated the presence of the designer steroid THG in spiked urine sample [192] and also the anabolic steroid 1-testosterone (1,(5α)-androsten-17α-ol-3-one), which is chemically closely related to the natural testosterone, but often escapes routine testing, was found in dietary supplements [193]. This work demonstrated the power of using a biorecognition element for screening and MS in full scan mode for identification as a designer steroid was detected and moreover, 1-testoterone was found in a sample which was reported as negative by van Poucke et al. previously [194]. They applied a conventional chemical analysis and used an LC-QqQ-MS in highly selective pre-selected mass mode (i.e. MRM) in which the product ions of 1-testosterone were not acquired. Also the absence of any biorecognition element in their approach, which could help the MS analysis, contributed to report this sample as compliant. Although Bovee et al. were able to provide a more correct picture of the content of the sample, extracts were not biopurified causing more signal suppression in their MS which could influence the detection of any new compound negatively. Moreover, these whole cell bioassays are inherently slow and require at least 2 days. In a similar approach, Nielen et al. identified an unknown β-agonist in feed by LC-bioassay followed by LC-Q-ToF-MS [195]. Bioaffinity-based extraction procedures using e.g. antibodies, transport proteins or receptors in combination with MS are of particular interest since high-throughput screening (HTS) is possible while identification of contaminants remain feasible and these methods might pinpoint the occurrence of emerging yet unidentified but highly relevant contaminants. In next paragraph, the two different approaches, in particular post-column and pre-column bioaffinity MS, and accompanying challenges are described. In the two approaches, a biorecognition element in both screening and identification of contaminants is present.
Post-column bioaffinity mass spectrometry
Several post-column on-line bioaffinity MS methods were described for protein-affinity selection, drug discovery or screening of combinatorial libraries [196-198]. In post-column bioaffinity MS format, the LC effluent is either directly connected to a bioassay which is followed by MS detection or the LC effluent is connected to a bioassay and MS detection setup in parallel. An example of the latter setup is illustrated in Figure 15. Typically, the bioassay is followed by UV or fluorescence detection, however, nowadays MS is the preferred readout system. By using

Chapter 1
40
fluorescent detection, fluorescent labels, if available, are required. In contrast, by using MS, all ligands can be used.
Figure 15. Schematic view of a post-column bioaffinity MS format. Superloop-A (SL-A) and superloop-B (SL-B) are used to deliver enzyme and substrate to the reaction coil, respectively. Ligands are introduced into the system by a gradient reversed phase HPLC system. Any ligands temporarily inhibit the fluorescent product formation, which is monitored by a fluorescence detector (FLD). After HPLC, the make-up pumps produce a counteracting gradient, resulting in a biomolecule compatible constant and relatively low organic modifier concentration. Via a splitter a part is connected to the bioassay and a part flows to an MS [197].
When in post-column bioaffinity MS format the LC effluent is directly connected to a bioassay and MS detection, there are specific issues which make the online post-column bioaffinity MS format challenging to use. Generally, the challenges are related to the ESI-MS detection in which, at least in positive ESI high organic modifier content together with low pH is desirable while these conditions are not compatible with bioassays. Since the effluent of an LC is directly coupled online to a bioassay, the effluent should not contain more than 5-10% organic modifier in order to keep the effluent compatible with most biomolecules such as enzymes or receptors. Therefore, the effluent needs to be diluted by a factor of 10-20, especially when reversed-phase gradients are used which typically end in very high organic modifier composition. Next to the organic modifier content, the use of acids in LC separations needs attention as the pH should be compatible with the bioassay. Usually, this issue is tackled by diluting the LC effluent with bioassay buffer. This buffer should have sufficient capacity, however the MS performance is seriously hampered by the use of high concentration buffers. In some cases, MS-compatible volatile buffers like ammonium formate or acetate can be used, but, these buffers could compromise the performance of the bioassay. The on-line incubation is commonly done in tubing in a continuous flow and, as a result of this, peak broadening takes place and relatively

General introduction
41
long incubation times are not feasible. As an example of post-column bioaffinity MS in which the LC effluent is connected to a bioassay and MS detection setup in parallel, De Vlieger et al. developed an on-line dual post-column receptor affinity assay based on parallel detection by MS (LoD 40 nM) and fluorescence (LoD 4.7 nM) for quantification and identification purposes of estrogenic compounds [196]. The effluent was split to ERα and ERβ fluorescent bioassays and to the MS. In this way, only in the screening a biorecognition element was used. Another disadvantage of the post-column bioaffinity MS format is the wasting of expensive biorecognition elements. This is mainly caused due to the continuous addition of the biorecognition elements throughout the whole chromatographic separation while no binders are present in the beginning of the chromatographic run. Although the online post-column bioaffinity MS format provides both biological and chemical information on the ligands of interest, there are several major drawbacks as neither in the bioassay nor in the MS detection optimal conditions are possible. Due to these challenges, the required limit of detection might not be met and the use of various target biomolecules is limited because only specific buffer conditions are feasible in this format. Pre-column bioaffinity MS
Pre-column bioaffinity MS methods are being used mostly as a tool to determine affinities of compounds towards the chosen target protein [199-205]. This can be achieved in two ways: 1) the compound of interest is measured by LC-MS following incubation with target protein and wash and dissociation steps [203-205], or 2) a stable MS label is used in a competitive inhibition format with other compounds of interest and the label is measured by LC-MS [199-202]. High consumption of target protein and inability to detect multiple compounds having low affinity, are the disadvantages of approach 1). To overcome these issues, several pre-column bioaffinity MS methods in competitive inhibition format 2) are described in the literature. For example, Niessen et al. developed an off-line competitive MS binding assay for determining the binding affinity of dopamine receptor ligands using spiperone as a label (see Figure 16) [200]. That binding assay was presented as a possible alternative to radiolabeled assays; however, since only the unbound fraction of the marker was measured, at best, indirect information was obtained about the bound ligands. Moreover, because of the use of a nonvolatile buffer, an additional SPE step was required prior to LC-MS detection. Due to the SPE step and the absence of microtiter plates, HTS was not feasible. Zepperitz et al. described a competitive MS binding assay in which the γ-aminobutyric acid (GABA) transporter-bound fraction of the label was measured after elution with methanol [202]. Although this method had the potential for high-throughput characterization of new drug candidates, that format was used for kinetic measurements in buffer only and no screening in real

Chapter 1
42
samples was performed. By the lengthy (30-60 min) filtration steps during wash and dissociation steps, the method became longer and less straightforward. In a similar approach Hess et al. determined binding affinities of human serotonin transporter (hSERT) inhibitors [199]. The main change in this method concerned the dissociation step which was performed by displacing the label (fluoxetine) by another ligand (i.e. imipramine) and no methanol was used. This method was able to determine affinities of inhibitors for hSERT. In general, these off-line pre-column bioaffinity MS methods are focused on determining affinities and no screening or identification is performed for food or environmental contaminants. In this thesis, off-line pre-column bioaffinity MS (BioMS) is used for rapid screening and identification of various contaminants in food and environmental samples. Figure 17 displays a schematic overview of the BioMS approach. In this BioMS approach, biomolecules such as antibodies, transport proteins or receptors were immobilized onto paramagnetic beads. The principle of this method is demonstrated in Figure 18.
Figure 16. Binding curves for (+)-butaclamol, as generated by nonlinear regression for competitive MS binding assays. Three binding experiments were carried out for each ligand. The individual points describe nonbound spiperone quantified by LC-ESI-MS-MS from the supernatant of binding samples
(figure is used with permission [200]).

General introduction
43
Figure 17. A schematic overview of pre-column bioaffinity MS (BioMS) for rapid screening and identification.
Figure 18. The principle of the competitive inhibition assay format applied in BioMS screening.
For screening, a stable isotope label can be used to screen indirectly for the presence of any displacing ligands. The competitive inhibition screening assay is based on competition between the stable isotope label and other active contaminants in the sample. Following incubation, wash and dissociation steps, only the isotope label is measured by means of an ultrafast, sensitive and selective UPLC-QqQ-MS system, operating in a dedicated SRM mode. The amount of measured label is reversibly indicative for the amount and affinity of active compounds in the sample. For identification of any known or unknown active contaminants, the same biorecognition element can be used in a bioaffinity isolation procedure in combination with high resolution full scan accurate mass mode. In BioMS, HTS can be achieved since in

Chapter 1
44
screening paramagnetic beads in 96-well plates can be used allowing the use of an automatic magnetic wash station. In Figure 19, the wash station and the principle of the automated wash steps are depicted.
Figure 19. The principle of the magnetic automatic wash station containing 96 small magnets to attract magnetic microbeads and an eight-channel multipipet. In (A) the 96-well plate is placed on the magnet and all microbeads are magnetized against the bottom of each well. In (B) the automatic wash station adds washing solution while the microbeads are on bottom and, in the same way, the added wash solution
is discarded by the wash station.
Note that in post-column bioaffinity MS, methods have been suggested to perform HTS, however, in this thesis, the generally accepted definition of HTS is when the assay time for 96 tests is <2 h while the LC-MS run time is less than a few minutes per sample. As the BioMS approach is off-line, in contrast to post-column formats, the most suitable LC conditions can be selected for the most sensitive MS detection. This applies also to the final biopurified extract which is injected onto the LC-MS system. Typically, the final extract in the BioMS contains organic modifier at low pH to ensure an effective elution of any ligand from the biomolecule while at the same time the extract would be fully MS-compatible. It is noteworthy, that any buffer needed for optimal performance of the bioassay can be used in the BioMS approach, because only the MS-compatible elution solution is injected onto the LC-MS system.
For identification of any known or unknown active contaminants, the same biorecognition element can be used in a bioaffinity isolation procedure in combination with high resolution MS in full scan accurate mass mode. In general, the same BioMS screening approach is used with slight changes, i.e. more coupled beads can be used and the label can be omitted. These changes will enhance the bio-isolation of contaminants. Since biomolecules are expensive, in this thesis, the bioassays are miniaturized by coupling the biomolecules onto paramagnetic microbeads. Due to this, highly enriched low-volume (50 µL) final extracts can be obtained. These low volume extracts can be
Figure 20. An image of the NanoTileTM
containing the analytical column and an integrated ESI emitter (image from Waters website).
A B

General introduction
45
injected into a UPLC-QqQ-MS for screening and for the subsequent identification, the same extract can be injected into an LC-MS system which is able to inject low volumes and operated in full scan accurate mass mode. Therefore, an LC-MS system capable of injecting low volumes is required for identifying compounds. Regarding this system, several critical conditions were considered: the LC-MS identification system should be sensitive (low ng mL-1 levels), able to inject low volumes (0.1-4 µL), provide reproducible retention times, accurate mass, product ions, and possibly provide ion mobility drift times for additional identification points. In this thesis, three different LC-Q-ToF-MS systems, which met these conditions, were used. The first system consisted of a nano-UPLC coupled to a Q-ToF-MS system. In this system, the combination of nano-column and nano flow rate permitted low volume injections of only 4 µL extract while obtaining adequate sensitivity. The advantages of this identification technique were its high sensitivity, small injection volumes, ultralow flow rates, resulting in the low consumption of hazardous chemicals, and the option to operate in full scan accurate mass mode for the identification of unknown compounds based on elemental composition calculated thereof. The disadvantages of nano-LC include undetectable clogging and dead volumes between connections which all contribute to the more difficult handling of the system and/or poor chromatographic performance. The second identification system used consisted of the same nano-UPLC pump coupled to the same Q-ToF-MS system. But in this case, the chromatography was performed on a Waters NanoTileTM containing a C18 column (50 mm × 150 µm I.D., 1.7 µm particles) and having an integrated nano-ESI emitter (See Figure 20). The flow rate is 4 µL min-1 and injection volumes are 1-2 µL. The advantages of this identification system include the absence of dead volumes, superior chromatographic performance and the ease-of-use (“plug-and-play”) while providing adequate sensitivity. The third identification system consisted of a UPLC-pump, compatible with alkaline conditions, which was coupled to an ion mobility (IM)-Q-ToF-MS system equipped with a novel atmospheric pressure ionization source operated in negative ionization mode. With this system reproducible retention times, accurate mass, product ions and ion mobility drift times as additional identification points were obtained while low ppb-level sensitivity was achieved. By using the drift times, experimental collision-cross section (CCS) values could be calculated which could contribute to the identification of contaminants.
Aim and scope of this thesis
Looking at the history of monitoring programs, it is quite imaginable that in sports and animal farming new unknown compounds are being used which are at the moment undetectable in the existing screening or confirmatory methods. Also due to fraudulent use of compounds, unexpected contaminants might end up in food which are not monitored. This means that fair play in sports and the health of consumers

Chapter 1
46
cannot be ensured using the existing methods. Therefore, in this thesis, new bioaffinity mass spectrometry concepts are presented which were used for screening and identification of both known and unknown food and environmental contaminants. Below, the most important objectives of this thesis are summarized.
• The development of bioaffinity isolation procedures using different biorecognition elements such as Mabs, transport proteins (TTR, SHBG) and an estrogen receptor.
• To investigate the influence of immobilization on the performance of the biorecognition elements (i.e. stability, robustness, high-throughput capabilities) by using superparamagnetic microbeads versus cut-off filters.
• The influence of oriented non-covalent immobilization of the biorecognition element compared to non-oriented covalent immobilization in terms of capacity, stability and ease-of-use of the immobilization procedure.
• Set-up of competitive inhibition binding assay format(s) for the rapid screening of contaminants using a non-radioactive stable isotopic label and measuring the label with LC-QqQ-MS in a short run time (e.g. 2 min/sample) in SRM mode.
• Applying different stable isotopic labels with biorecognition elements to develop screening assays for ochratoxins, EDCs and steroids in various food and environmental samples such as wheat, cereal, process water, urine and dietary supplements.
• Use the same biorecognition element as used in screening to develop bioaffinity isolation procedures to obtain biopurified extracts for identification purposes.
• Identify known and unknown contaminants using LC-Q-ToF-MS full scan accurate mass mode.
Outline
This thesis presents novel concepts in bioaffinity mass spectrometry (BioMS) for the screening and identification of known and unknown contaminants in food and environment. In Chapter 1, general information is given about contaminants and their harmful effects on wildlife and humans. In this chapter, the existing conventional bioaffinity-based screening methods and targeted instrumental analysis for identifying contaminants are described including their lack of ability to identify unknown compounds. Due to the emergence of new unknown contaminants, novel BioMS methods are needed to identify these contaminants. In Chapter 2 such a concept is described by using superparamagnetic microbeads coated with anti-ochratoxin A (OTA) monoclonal antibodies (Mabs) in a novel direct inhibition flow cytometric

General introduction
47
immunoassay (FCIA) for high-throughput screening (HTS) of ochratoxins in wheat and cereal samples. The same anti-OTA Mabs-coated beads were used for immunoaffinity isolation prior to identification by nano-ultra performance-liquid chromatography-quadrupole-time-of-flight-mass spectrometry (nano-UPLC-Q-ToF-MS) in full scan accurate mass mode. Retention times, experimental accurate mass data were used as identification points. For the analysis of thyroid transporter ligands, a BioMS concept is described in Chapter 3 with three different analytical purposes: screening, confirmation and identification. In order to avoid the usage of any fluorescent reporter molecule and expensive Luminex®-compatible paramagnetic beads in screening, a stable isotopic thyroid hormone 13C6-L-thyroxine was used as label in competitive inhibition MS binding assay format and the recombinant transthyretin (rTTR) was immobilized onto inexpensive paramagnetic microbeads. For screening and confirmation of EDCs in process water and urine, a fast UPLC- triple quadrupole (QqQ)-MS was used as readout system and for identification nano-LC-Q-ToF-MS in full scan mass mode. All extracts were biopurified using the same biorecognition element in screening, confirmation and identification. Retention times, experimental accurate mass and MS/MS data were used for identification. In Chapter 4, a generic HTS BioMS approach was developed and applied for the screening and identification of known and unknown recombinant human sex hormone-binding globulin (rhSHBG)-binding steroids in dietary supplements. For screening, 17β-testosterone-d3 was used as stable isotopic MS label and the previously described paramagnetic microbeads were used for immobilizing rhSHBG onto the bead surface. The same UPLC-QqQ-MS system was used for screening while for identification chip-UPLC-Q-ToF-MS was used for superior chromatographic performances and sensitivity. Multiple dietary supplements, which were previously analyzed using a conventional LC-MS method in multiple reaction monitoring (MRM) mode, were screened and identified. This chapter demonstrates the limitations of using LC-MS in highly specific MRM mode for confirmation or identification of steroids and highlights the potential of the proposed BioMS methodology. In Chapter 5, another high-throughput bioaffinity LC-MS approach was developed for estrogens in dietary supplements but using the estrogen receptor α (ERα). The highly unstable ERα was stabilized by immobilizing it onto the surface of paramagnetic microbeads using two different surface chemistries. With this method, instead of the normally applied GC-MS, LC-QqQ-MS was used for the screening of estrogens by using a suitable LC-MS-compatible label. By using LC-MS instead of GC-MS, derivatization and long run times were avoided. The identification of estrogens in ERα-purified supplement extracts was achieved by using a UPLC-ion mobility-Q-ToF-MS which gave, next to retention times, experimental accurate mass, MS/MS data, also specific drift times. Finally, Chapter 6 presents general conclusions of the research chapters and future recommendations.

Chapter 1
48
References
1. van der Oost, R., J. Beyer, and N.P.E. Vermeulen, Fish bioaccumulation and biomarkers in environmental risk assessment: a review. ENVIRON TOXICOL PHAR, 2003. 13(2): p. 57-149.
2. Ramesh, A., S.A. Walker, D.B. Hood, M.D. Guillen, K. Schneider, and E.H. Weyand, Bioavailability and risk assessment of orally ingested polycyclic aromatic hydrocarbons. INT J TOXICOL, 2004. 23(5): p. 301-333.
3. Toppari, J., J.C. Larsen, P. Christiansen, A. Giwercman, P. Grandjean, L.J. Guillette, B. Jegou, T.K. Jensen, P. Jouannet, N. Keiding, H. Leffers, J.A. McLachlan, O. Meyer, J. Muller, E. RajpertDeMeyts, T. Scheike, R. Sharpe, J. Sumpter, and N.E. Skakkebaek, Male reproductive health and environmental xenoestrogens. ENVIRON HEALTH PERSP, 1996. 104: p. 741-803.
4. Mozaffarian, D. and E.B. Rimm, Fish intake, contaminants, and human health - Evaluating the risks and the benefits. JAMA-J AM MED ASSOC, 2006. 296(15): p. 1885-1899.
5. Heberer, T., Occurrence, fate, and removal of pharmaceutical residues in the aquatic environment: a review of recent research data. TOXICOL LETT, 2002. 131(1-2): p. 5-17.
6. Wogan, G.N., S.S. Hecht, J.S. Felton, A.H. Conney, and L.A. Loeb, Environmental and chemical carcinogenesis. SEMIN CANCER BIOL, 2004. 14(6): p. 473-486.
7. Kantiani, L., M. Llorca, J. Sanchis, M. Farre, and D. Barcelo, Emerging food contaminants: a review. ANAL BIOANAL CHEM, 2010. 398(6): p. 2413-2427.
8. di Mavungu, J.D., S. Monbaliu, M.L. Scippo, G. Maghuin-Rogister, Y.J. Schneider, Y. Larondelle, A. Callebaut, J. Robbens, C. van Peteghem, and S. de Saeger, LC-MS/MS multi-analyte method for mycotoxin determination in food supplements. FOOD ADDIT CONTAM A, 2009. 26(6): p. 885-895.
9. Colborn, T., F.S.V. Saal, and A.M. Soto, Developmental Effects of Endocrine-Disrupting Chemicals in Wildlife and Humans. ENVIRON HEALTH PERSP, 1993. 101(5): p. 378-384.
10. Diamanti-Kandarakis, E., J.P. Bourguignon, L.C. Giudice, R. Hauser, G.S. Prins, A.M. Soto, R.T. Zoeller, and A.C. Gore, Endocrine-Disrupting Chemicals: An Endocrine Society Scientific Statement. ENDOCR REV, 2009. 30(4): p. 293-342.
11. Arditsoglou, A. and D. Voutsa, Occurrence and partitioning of endocrine-disrupting compounds in the marine environment of Thermaikos Gulf, Northern Aegean Sea, Greece. MAR POLLUT BULL, 2012. 64(11): p. 2443-2452.

General introduction
49
12. Bang, D.Y., M. Kyung, M.J. Kim, B.Y. Jung, M.C. Cho, S.M. Choi, Y.W. Kim, S.K. Lim, D.S. Lim, A.J. Won, S.J. Kwack, Y. Lee, H.S. Kim, and B.M. Lee, Human Risk Assessment of Endocrine-Disrupting Chemicals Derived from Plastic Food Containers. COMPR REV FOOD SCI F, 2012. 11(5): p. 453-470.
13. Hakk, H., G. Larsen, A. Bergman, and U. Orn, Metabolism, excretion and distribution of the flame retardant tetrabromobisphenol-A in conventional and bile-duct cannulated rats. XENOBIOTICA, 2000. 30(9): p. 881-890.
14. Arias, P.A., Brominated flame retardants - An overview. Proceedings, 2nd International Workshop on Brominated Flame Retardants, 2001: p. 17-19.
15. Covaci, A., S. Voorspoels, L. Ramos, H. Neels, and R. Blust, Recent developments in the analysis of brominated flame retardants and brominated natural compounds. J CHROMATOGR A, 2007. 1153(1-2): p. 145-171.
16. Scientific Opinion on the hazard assessment of endocrine disruptors: Scientific criteria for identification of endocrine disruptors and appropriateness of existing test methods for assessing effects mediated by these substances on human health and the environment. EFSA Scientific Committee. EFSA Journal 2013; 11 (3): 3132.
17. Marchesini, G.R., A. Meimaridou, W. Haasnoot, E. Meulenberg, F. Albertus, M. Mizuguchi, M. Takeuchi, H. Irth, and A.J. Murk, Biosensor discovery of thyroxine transport disrupting chemicals. TOXICOL APPL PHARM, 2008. 232(1): p. 150-160.
18. Hamers, T., J.H. Kamstra, E. Sonneveld, A.J. Murk, M.H.A. Kester, P.L. Andersson, J. Legler, and A. Brouwer, In vitro profiling of the endocrine-disrupting potency of brominated flame retardants. TOXICOL SCI, 2006. 92(1): p. 157-173.
19. Meerts, I.A.T.M., J.J. Van Zanden, E.A.C. Luijks, I. Van Leeuwen-Bol, G. Marsh, E. Jakobsson, A. Bergman, and A. Brouwer, Potent competitive interactions of some brominated flame retardants and related compounds with human transthyretin in Vitro. TOXICOL SCI, 2000. 56(1): p. 95-104.
20. Cody, V., Thyroid hormone interactions: molecular conformation, protein binding, and hormone action. ENDOCR REV, 1980. 1(2): p. 140-166.
21. Chauhan, K.R., P.R.S. Kodavanti, and J.D. McKinney, Assessing the Role of ortho-Substitution on Polychlorinated Biphenyl Binding to Transthyretin, a Thyroxine Transport Protein. TOXICOL APPL PHARM, 2000. 162(1): p. 10-21.
22. Yen, P.M., Physiological and molecular basis of Thyroid hormone action. PHYSIOL REV, 2001. 81(3): p. 1097-1142.
23. Bernal, J., A. Guadaño-Ferraz, and B. Morte, Perspectives in the Study of Thyroid Hormone Action on Brain Development and Function. THYROID,

Chapter 1
50
2003. 13(11): p. 1005-1012.24. Porterfield, S.P., Thyroidal dysfunction and environmental chemicals-
potential impact on brain development. ENVIRON HEALTH PERSP, 2000. 108(SUPPL. 3): p. 433-438.
25. Fritsche, E., J.E. Cline, N.H. Nguyen, T.S. Scanlan, and J. Abel, Polychlorinated biphenyls disturb differentiation of normal human neural progenitor cells: Clue for involvement of thyroid hormone receptors. ENVIRON HEALTH PERSP, 2005. 113(7): p. 871-876.
26. Dann, A.B. and A. Hontela, Triclosan: Environmental exposure, toxicity and mechanisms of action. J APPL TOXICOL, 2011. 31(4): p. 285-311.
27. Aqai, P., C. Fryganas, M. Mizuguchi, W. Haasnoot, and M.W.F. Nielen, Triple bioaffinity mass spectrometry concept for thyroid transporter ligands. ANAL CHEM, 2012. 84(15): p. 6488-6493.
28. Calafat, A.M., X. Ye, L.Y. Wong, J.A. Reidy, and L.L. Needham, Urinary concentrations of triclosan in the U.S. population: 2003-2004. ENVIRON HEALTH PERSP, 2008. 116(3): p. 303-307.
29. Ying, G.G., R.S. Kookana, and Y.J. Ru, Occurrence and fate of hormone steroids in the environment. ENVIRON INT, 2002. 28(6): p. 545-551.
30. Chafetz, L., Analysis of steroid hormone drugs. By S. Görög and Gy. Sźasz. Akadémie Kiadó, Budapest, Hungary, and Elsevier Scientific Publishing Co., Amsterdam, The Netherlands. 1978. 426 pp. J PHARM SCI, 1979. 68(5): p. 672-672.
31. IUPAC Commission on the Nomenclature of Organic Chemistry and IUPAC-IUB Commission on Biochemical Nomenclature. Revised tentative rules for nomenclature of steroids. BIOCHIM BIOPHYS ACTA, 1968. 164(3): p. 453-486.
32. Zhu, B.T. and A.H. Conney, Functional role of estrogen metabolism in target cells: Review and perspectives. CARCINOGENESIS, 1998. 19(1): p. 1-27.
33. Hess, R.A., D. Bunick, K.H. Lee, J. Bahr, J.A. Taylor, K.S. Korach, and D.B. Lubahn, A role for oestrogens in the male reproductive system. NATURE, 1997. 390(6659): p. 509-512.
34. Noppe, H., B. Le Bizec, K. Verheyden, and H.F. De Brabander, Novel analytical methods for the determination of steroid hormones in edible matrices. ANAL CHIM ACTA, 2008. 611(1): p. 1-16.
35. Bovee, T.F.H. and M.G. Pikkemaat, Bioactivity-based screening of antibiotics and hormones. J CHROMATOGR A, 2009. 1216(46): p. 8035-8050.
36. Pettersson, K. and J.A. Gustafsson, Role of estrogen receptor beta in estrogen action. ANNU REV PHYSIOL, 2001. p. 165-192.
37. Kuiper, G.G.J.M., B. Carlsson, K. Grandien, E. Enmark, J. Häggblad, S. Nilsson, and J.Å. Gustafsson, Comparison of the ligand binding specificity

General introduction
51
and transcript tissue distribution of estrogen receptors and α and β. ENDOCRINOLOGY, 1997. 138(3): p. 863-870.
38. Bovee, T.F.H., R.J.R. Helsdingen, I.M.C.M. Rietjens, J. Keijer, and R.L.A.P. Hoogenboom, Rapid yeast estrogen bioassays stably expressing human estrogen receptors α and β, and green fluorescent protein: a comparison of different compounds with both receptor types. J STEROID BIOCHEM, 2004. 91(3): p. 99-109.
39. Young, W.F., Whitehouse, P., Johnson, I. and Sorokin, N., Proposed Predicted-No-Effect-Concentrations (PNECs) for Natural and Synthetic Steroid Oestrogens in Surface Waters. R&D Technical Report P2-T04/1. Environmental Agency Bristol.
40. Kuster, M., M. José López De Alda, and D. Barceló, Analysis and distribution of estrogens and progestogens in sewage sludge, soils and sediments. TRAC-TREND ANAL CHEM, 2004. 23(10-11): p. 790-798.
41. Cacciatore, G., S.W.F. Eisenberg, C. Situ, M.H. Mooney, P. Delahaut, S. Klarenbeek, A.C. Huet, A.A. Bergwerff, and C.T. Elliott, Effect of growth-promoting 17β-estradiol, 19-nortestosterone and dexamethasone on circulating levels of nine potential biomarker candidates in veal calves. ANAL CHIM ACTA, 2009. 637(1-2): p. 351-359.
42. Divari, S., C. Mulasso, F. Uslenghi, F.T. Cannizzo, F. Spada, R. de Maria, N. Brina, and B. Biolatti, Progesterone receptor up-regulation: A diagnostic tool for the illicit use of oestrogens in adult beef cattle. FOOD ADDIT CONTAM A, 2011. 28(12): p. 1677-1686.
43. Bhasin, S., G.R. Cunningham, F.J. Hayes, A.M. Matsumoto, P.J. Snyder, R.S. Swerdloff, and V.M. Montori, Testosterone therapy in men with androgen deficiency syndromes: An endocrine society clinical practice guideline. J CLIN ENDOCR METAB, 2010. 95(6): p. 2536-2559.
44. Bahrke, M.S., C.E. Yesalis, 3rd, and J.E. Wright, Psychological and behavioural effects of endogenous testosterone and anabolic-androgenic steroids. An update. SPORTS MED, 1996. 22(6): p. 367-90.
45. Hartgens, F. and H. Kuipers, Effects of androgenic-anabolic steroids in athletes. SPORTS MED, 2004. 34(8): p. 513-54.
46. Wood, R.I., Anabolic-androgenic steroid dependence? Insights from animals and humans. FRONT NEUROENDOCRIN, 2008. 29(4): p. 490-506.
47. Celotti, F. and P. Negri-Cesi, Anabolic-Steroids - a Review of Their Effects on the Muscles, of Their Possible Mechanisms of Action and of Their Use in Athletics. J STEROID BIOCHEM, 1992. 43(5): p. 469-477.
48. Shahidi, N.T., A review of the chemistry, biological action, and clinical applications of anabolic-androgenic steroids. CLIN THER, 2001. 23(9): p. 1355-90.

Chapter 1
52
49. Evans, N.A., Current concepts in anabolic-androgenic steroids. AM J SPORT MED, 2004. 32(2): p. 534-42.
50. Kicman, A.T., Pharmacology of anabolic steroids. BRIT J PHARMACOL, 2008. 154(3): p. 502-21.
51. Yabana, M., M. Kihara, Y. Toya, K. Tamura, K. Matsumoto, N. Takagi, S. Kamijo, M. Ishii, and S. Umemura, Simultaneous improvement of minimal-change nephrotic syndrome and anemia with steroid therapy. NEPHRON, 1999. 81(1): p. 84-8.
52. De Brabander, H.F., S. Poelmans, R. Schilt, R.W. Stephany, B. Le Bizec, R. Draisci, S.S. Sterk, L.A. van Ginkel, D. Courtheyn, N. Van Hoof, A. Macri, and K. De Wasch, Presence and metabolism of the anabolic steroid boldenone in various animal species: a review. FOOD ADDIT CONTAM, 2004. 21(6): p. 515-525.
53. Scippo, M.L., G. Degand, A. Duyckaerts, G. Maghuinrogister, and P. Delahaut, Control of the Illegal Administration of Natural Steroid-Hormones in the Plasma of Bulls and Heifers. ANALYST, 1994. 119(12): p. 2639-2644.
54. Catlin, D.H., M.H. Sekera, B.D. Ahrens, B. Starcevic, Y.C. Chang, and C.K. Hatton, Tetrahydrogestrinone: discovery, synthesis, and detection in urine. RAPID COMMUN MASS SP, 2004. 18(12): p. 1245-1249.
55. Sekera, M.H., B.D. Ahrens, Y.C. Chang, B. Starcevic, C. Georgakopoulos, and D.H. Catlin, Another designer steroid: discovery, synthesis, and detection of ‘madol’ in urine. RAPID COMMUN MASS SP, 2005. 19(6): p. 781-784.
56. Smuc, T., N. Hevir, M. Ribic-Pucelj, B. Husen, H. Thole, and T.L. Rizner, Disturbed estrogen and progesterone action in ovarian endometriosis. MOL CELL ENDOCRINOL, 2009. 301(1-2): p. 59-64.
57. Arts, C.J.M., M.J. Vanbaak, and J.M.P. Denhartog, Control-System for Detection of the Illegal Use of Naturally-Occurring Steroids in Calves. J CHROMATOGR-BIOMED, 1991. 564(2): p. 429-444.
58. Stephany, R.W., Hormonal growth promoting agents in food producing animals. HDB EXP PHARMACOL, 2010(195): p. 355-67.
59. Vanoosthuyze, K., E. Daeseleire, A. Vanoverbeke, C. Vanpeteghem, and A. Ermens, Survey of the Hormones Used in Cattle Fattening Based on the Analysis of Belgian Injection Sites. ANALYST, 1994. 119(12): p. 2655-2658.
60. Mortensen, S.K. and M. Pedersen, Confirmatory analysis of acetylgestagens in plasma using liquid chromatography-tandem mass spectrometry. ANAL CHIM ACTA, 2007. 586(1-2): p. 217-222.
61. Anderson, R.A., C.W. Martin, A.W.C. Kung, D. Everington, T.C. Pun, K.C.B. Tan, J. Bancroft, K. Sundaram, A.J. Moo-Young, and D.T. Baird, 7 alpha-methyl-19-nortestosterone maintains sexual behavior and mood in

General introduction
53
hypogonadal men. J CLIN ENDOCR METAB, 1999. 84(10): p. 3556-3562.62. Koppen, R., M. Koch, D. Siegel, S. Merkel, R. Maul, and I. Nehls,
Determination of mycotoxins in foods: current state of analytical methods and limitations. APPL MICROBIOL BIOT, 2010. 86(6): p. 1595-1612.
63. Fink-Gremmels, J., Mycotoxins: Their implications for human and animal health. VET QUART, 1999. 21(4): p. 115-120.
64. Njobeh, P.B., M.F. Dutton, S.H. Koch, A. Chuturgoon, S. Stoev, and K. Seifert, Contamination with storage fungi of human food from Cameroon. INT J FOOD MICROBIOL, 2009. 135(3): p. 193-198.
65. Ringot, D., A. Chango, Y.J. Schneider, and Y. Larondelle, Toxicokinetics and toxicodynamics of ochratoxin A, an update. CHEM-BIOL INTERACT, 2006. 159(1): p. 18-46.
66. Nielsen, K.F., J.M. Mogensen, M. Johansen, T.O. Larsen, and J.C. Frisvad, Review of secondary metabolites and mycotoxins from the Aspergillus niger group. ANAL BIOANAL CHEM, 2009. 395(5): p. 1225-1242.
67. Hussein, H.S. and J.M. Brasel, Toxicity, metabolism, and impact of mycotoxins on humans and animals. TOXICOLOGY, 2001. 167(2): p. 101-134.
68. Pfohl-Leszkowicz, A. and R.A. Manderville, Ochratoxin A: An overview on toxicity and carcinogenicity in animals and humans. MOL NUTR FOOD RES, 2007. 51(1): p. 61-99.
69. Heussner, A.H., D.R. Dietrich, and E. O’Brien, In vitro investigation of individual and combined cytotoxic effects of ochratoxin A and other selected mycotoxins on renal cells. TOXICOL IN VITRO, 2006. 20(3): p. 332-341.
70. Ventura, M., C. Vallejos, I.N.A. Anaya, F. Broto-Puig, M. Agut, and L. Comellas, Analysis of ochratoxin A in coffee by solid-phase cleanup and narrow-bore liquid chromatography-fluorescence detector-mass spectrometry. J AGR FOOD CHEM, 2003. 51(26): p. 7564-7567.
71. Reddy, K.R.N., B. Salleh, B. Saad, H.K. Abbas, C.A. Abel, and W.T. Shier, An overview of mycotoxin contamination in foods and its implications for human health. TOXIN REV, 2010. 29(1): p. 3-26.
72. Magnoli, C., A. Astoreca, M.L. Ponsone, M.G. Fernández-Juri, C. Barberis, and A.M. Dalcero, Ochratoxin A and Aspergillus section Nigri in peanut seeds at different months of storage in Córdoba, Argentina. INT J FOOD MICROBIOL, 2007. 119(3): p. 213-218.
73. Tangni, E.K. and L. Pussemier, Ochratoxin A and citrinin loads in stored wheat grains: Impact of grain dust and possible prediction using ergosterol measurement. FOOD ADDIT CONTAM, 2006. 23(2): p. 181-189.
74. Vrabcheva, T., E. Usleber, R. Dietrich, and E. Märtlbauer, Co-occurrence of ochratoxin A and citrinin in cereals from bulgarian villages with a history of

Chapter 1
54
Balkan endemic nephropathy. J AGR FOOD CHEM, 2000. 48(6): p. 2483-2488.
75. Lombaert, G.A., P. Pellaers, V. Roscoe, M. Mankotia, R. Neil, and P.M. Scott, Mycotoxins in infant cereal foods from the Canadian retail market. FOOD ADDIT CONTAM, 2003. 20(5): p. 494-504.
76. Puntarić, D., J. Bošnir, Z. Šmit, I. Škes, and Z. Baklaić, Ochratoxin A in corn and wheat: Geographical association with endemic nephropathy. CROAT MED J, 2001. 42(2): p. 175-180.
77. Domijan, A.M., M. Peraica, V. Žlender, B. Cvjetković, Ž. Jurjević, S. Topolovec-Pintarić, and D. Ivić, Seed-borne fungi and ochratoxin A contamination of dry beans (Phaseolus vulgaris L.) in the Republic of Croatia. FOOD CHEM TOXICOL, 2005. 43(3): p. 427-432.
78. Ayalew, A., H. Fehrmann, J. Lepschy, R. Beck, and D. Abate, Natural occurrence of mycotoxins in staple cereals from Ethiopia. MYCOPATHOLOGIA, 2006. 162(1): p. 57-63.
79. Amra, H., Natural occurrence of some mycotoxins in local and imported corn grains (Zea mays L.) in Egypt. TOXICOL LETT, 2007. 172(Suppl. 1).
80. Janardhana, G.R., K.A. Raveesha, and H.S. Shetty, Mycotoxin contamination of maize grains grown in Karnataka (India). FOOD CHEM TOXICOL, 1999. 37(8): p. 863-868.
81. Thirumala-Devi, K., M.A. Mayo, G. Reddy, K.E. Emmanuel, Y. Larondelle, and D.V.R. Reddy, Occurrence of ochratoxin A in black pepper, coriander, ginger and turmeric in India. FOOD ADDIT CONTAM, 2001. 18(9): p. 830-835.
82. Thirumala-Devi, K., M.A. Mayo, G. Reddy, S.V. Reddy, P. Delfosse, and D.V.R. Reddy, Production of polyclonal antibodies against Ochratoxin A and its detection in chilies by ELISA. J AGR FOOD CHEM, 2000. 48(10): p. 5079-5082.
83. Kumagai, S., M. Nakajima, S. Tabata, E. Ishikuro, T. Tanaka, H. Norizuki, Y. Itoh, K. Aoyama, K. Fujita, S. Kai, T. Sato, S. Saito, N. Yoshiike, and Y. Sugita-Konishi, Aflatoxin and ochratoxin A contamination of retail foods and intake of these mycotoxins in Japan. FOOD ADDIT CONTAM A, 2008. 25(9): p. 1101-1106.
84. Park, J.W., S.H. Chung, and Y.B. Kim, Ochratoxin a in Korean food commodities: Occurrence and safety evaluation. J AGR FOOD CHEM, 2005. 53(11): p. 4637-4642.
85. Dashti, B., Screening of mycotoxin contamination in food in Kuwait. Abstracts & Program. The Second Asian Conference on Plant Pathology, 2005, p. 113.
86. Juan, C., A. Zinedine, L. Idrissi, and J. Mañes, Ochratoxin A in rice on the Moroccan retail market. INT J FOOD MICROBIOL, 2008. 126(1-2): p. 83-85.

General introduction
55
87. Dongo, L., R. Bandyopadhyay, M. Kumar, and P.S. Ojiambo, Occurrence of ochratoxin A in Nigerian ready for sale cocoa beans. AGR J, 2008. 3: p. 4-9.
88. Abdulkadar, A.H.W., A.A. Al-Ali, A.M. Al-Kildi, and J.H. Al-Jedah, Mycotoxins in food products available in Qatar. FOOD CONTROL, 2004. 15(7): p. 543-548.
89. Zaied, C., S. Abid, L. Zorgui, C. Bouaziz, S. Chouchane, M. Jomaa, and H. Bacha, Natural occurrence of ochratoxin A in Tunisian cereals. FOOD CONTROL, 2009. 20(3): p. 218-222.
90. Aydin, A., U. Gunsen, and S. Demirel, Total aflatoxin, aflatoxin B1 and ochratoxin a levels in Turkish wheat flour. J FOOD DRUG ANAL, 2008. 16(2): p. 48-53.
91. Nguyen, M.T., M. Tozlovanu, T.L. Tran, and A. Pfohl-Leszkowicz, Occurrence of aflatoxin B1, citrinin and ochratoxin A in rice in five provinces of the central region of Vietnam. FOOD CHEM, 2007. 105(1): p. 42-47.
92. Hernandez, M.J., M.V. Garcia-Moreno, E. Duran, D. Guillen, and C.G. Barroso, Validation of two analytical methods for the determination of ochratoxin A by reversed-phased high-performance liquid chromatography coupled to fluorescence detection in musts and sweet wines from Andalusia. ANAL CHIM ACTA, 2006. 566(1): p. 117-121.
93. Commission Regulation 1881/2006/EC of 19 December 2006, setting maximum levels for certain contaminants in foodstuff. Off. J. Eur. Union, 2006. L364: p. 5-23.
94. The Commission of the European Communities, Commission recommendation of 17 August 2006 on the presence of deoxynivalenol, zearalenone, ochratoxin A, T-2 and HT-2 and fumonisins in products intended for animal feeding. OFF J EUR UNION, 2006. 229: p. 7-9.
95. Implementing Council Directive 96/23/EC concerning the performance of analytical methods and the interpretation of results (2002/657/EC). OFF J EUR COMMUNITY, L221, 2002: p. 8-3.
96. Dunbar, S.A., Applications of Luminex® xMAPTM technology for rapid, high-throughput multiplexed nucleic acid detection. CLIN CHIM ACTA, 2006. 363(1-2): p. 71-82.
97. Liu, N., P. Su, Z. Gao, M. Zhu, Z. Yang, X. Pan, Y. Fang, and F. Chao, Simultaneous detection for three kinds of veterinary drugs: Chloramphenicol, clenbuterol and 17-beta-estradiol by high-throughput suspension array technology. ANAL CHIM ACTA, 2009. 632(1): p. 128-134.
98. Haasnoot, W. and J.G. Du Pré, Luminex-based triplex immunoassay for the simultaneous detection of soy, pea, and soluble wheat proteins in milk powder. J AGR FOOD CHEM, 2007. 55(10): p. 3771-3777.
99. Kim, J.S., C.R. Taitt, F.S. Ligler, and G.P. Anderson, Multiplexed magnetic

Chapter 1
56
microsphere immunoassays for detection of pathogens in foods. SENSING & INSTRUMENTATION FOR FOOD QUALITY & SAFETY, 2010. 4(2): p. 73-81.
100. Aqai, P., J. Peters, A. Gerssen, W. Haasnoot, and M.W.F. Nielen, Immunomagnetic microbeads for screening with flow cytometry and identification with nano-liquid chromatography mass spectrometry of ochratoxins in wheat and cereal. ANAL BIOANAL CHEM, 2011. 400(9): p. 3085-3096.
101. Peters, J., M. Bienenmann-Ploum, T. de Rijk, and W. Haasnoot, Development of a multiplex flow cytometric microsphere immunoassay for mycotoxins and evaluation of its application in feed. MYCOTOXIN RES, 2011. 27(1): p. 63-72.
102. de Keizer, W., M.E. Bienenmann-Ploum, A.A. Bergwerff, and W. Haasnoot, Flow cytometric immunoassay for sulfonamides in raw milk. ANAL CHIM ACTA, 2008. 620(1-2): p. 142-149.
103. Meimaridou, A., K. Kalachova, W.L. Shelver, M. Franek, J. Pulkrabova, W. Haasnoot, and M.W. Nielen, Multiplex screening of persistent organic pollutants in fish using spectrally encoded microspheres. ANAL CHEM, 2011. 83(22): p. 8696-702.
104. Aqai, P., E. Cevik, A. Gerssen, W. Haasnoot, and M.W.F. Nielen, High-Throughput Bioaffinity Mass Spectrometry for Screening and Identification of Designer Anabolic Steroids in Dietary Supplements. ANAL CHEM, 2013. 85(6): p. 3255-3262.
105. Aqai, P., N. Gómez Blesa, H. Major, M. Pedotti, L. Varani, V.E.V. Ferrero, W. Haasnoot, and M.W.F. Nielen, Receptor-based high-throughput screening and identification of estrogens in dietary supplements using bioaffinity ion mobility mass spectrometry. ANAL BIOANAL CHEM, 2013, DOI 10.1007/s00216-013-7384-1, printing.
106. Commission Regulation (EU) No. 37/2010 of 22 December 2009 on pharmacologically active substances and their classification regarding maximum residue limits in foodstuffs of animal origin. OFF J EUR UNION, 2010. L15: p. 1-72.
107. Council Regulation (EEC) 2377/90 laying down a community procedure for the establishment of maximum residue limits of veterinary medicinal products in foodstuffs of animal origin. OFF J EUR UNION COMMUNITIES, 1990. L224: p. 1-8.
108. Commission Regulation 2006/1881/EC of 19 December 2006 setting maximum levels for certain contaminants in foodstuffs. OFF J EUR UNION, 2006.
109. Council Directive 96/22/EC of 29 April 1996 concerning the prohibition on the

General introduction
57
use in stockfarming of certain substances having a hormonal or thyrostatic action and of beta-agonists, and repealing Directives 81/602/EEC, 88/146/EEC and 88/299 EEC. OFF J EUR COMMUNITIES, 1996. L125: p. 3-9.
110. www.wada-ama.org/...list/2013/WADA-Prohibited-List-2013-EN.pdf, accessed on 01-07-2013.
111. Directive 2002/46/EC of the European Parliament and of the Council of 10 June 2002 on the Approximation of the Laws of the Member States Relating to Food Supplements. OFF J EUR COMMUNITIES, 2002. L181: p. 51-57.
112. Lehotay, S.J., K. Mastovska, A. Amirav, A.B. Fialkov, P.A. Martos, A.d. Kok, and A.R. Fernández-Alba, Identification and confirmation of chemical residues in food by chromatography-mass spectrometry and other techniques. TRAC-TREND ANAL CHEM, 2008. 27(11): p. 1070-1090.
113. Toorians, A.W.F.T., T.F.H. Bovee, J. de Rooy, L.A.A.M. Stolker, and R.L.A.P. Hoogenboom, Gynaecomastia linked to the intake of a herbal supplement fortified with diethylstilbestrol. FOOD ADDIT CONTAM A, 2010. 27(7): p. 917-925.
114. Rijk, J.C.W., T.F.H. Bovee, S. Wang, C. Van Poucke, C. Van Peteghem, and M.W.F. Nielen, Detection of anabolic steroids in dietary supplements: The added value of an androgen yeast bioassay in parallel with a liquid chromatography-tandem mass spectrometry screening method. ANAL CHIM ACTA, 2009. 637(1-2): p. 305-314.
115. Haasnoot, W., M. Bienenmann-Ploum, U. Lamminmaki, M. Swanenburg, and H. van Rhijn, Application of a multi-sulfonamide biosensor immunoassay for the detection of sulfadiazine and sulfamethoxazole residues in broiler serum and its use as a predictor of the levels in edible tissue. ANAL CHIM ACTA , 2005. 552(1-2): p. 87-95.
116. Lipman, N.S., L.R. Jackson, L.J. Trudel, and F. Weis-Garcia, Monoclonal versus polyclonal antibodies: distinguishing characteristics, applications, and information resources. ILAR J, 2005. 46(3): p. 258-68.
117. Kohler, G. and C. Milstein, Continuous cultures of fused cells secreting antibody of predefined specificity. NATURE, 1975. 256(5517): p. 495-7.
118. Tijssen, P., Practice and theory of enzyme immunoassays, Laboratory Techniques in Biochemistry and Molecular Biology, (Eds. Burdon, R.H., Knippenberg van, P.H.), Elsevier, Amsterdam – New York – Oxford, 1985, Vol. 15
119. Harlow, E., Lane, D, Antibodies. A laboratory manual, Cold Spring Harbour Laboratory, New York, 1988.
120. Campbell, A.M., Monoclonal antibody technology, Laboratory Techniques in Biochemistry and Molecular Biology, (Eds. Burdon, R.H., Knippenberg van, P.H.), Elsevier, Amsterdam – New York - Oxford, 1984, Vol. 13
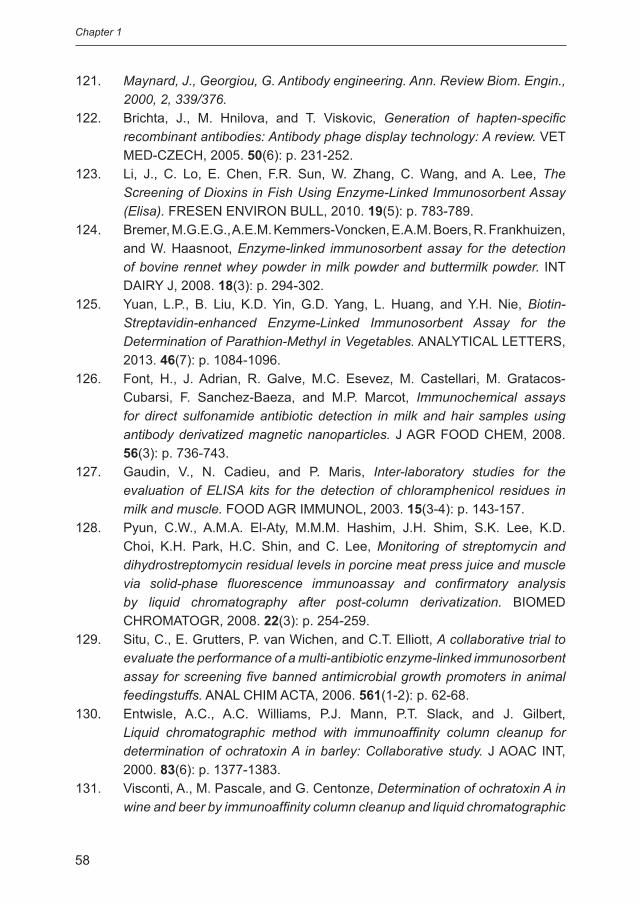
Chapter 1
58
121. Maynard, J., Georgiou, G. Antibody engineering. Ann. Review Biom. Engin., 2000, 2, 339/376.
122. Brichta, J., M. Hnilova, and T. Viskovic, Generation of hapten-specific recombinant antibodies: Antibody phage display technology: A review. VET MED-CZECH, 2005. 50(6): p. 231-252.
123. Li, J., C. Lo, E. Chen, F.R. Sun, W. Zhang, C. Wang, and A. Lee, The Screening of Dioxins in Fish Using Enzyme-Linked Immunosorbent Assay (Elisa). FRESEN ENVIRON BULL, 2010. 19(5): p. 783-789.
124. Bremer, M.G.E.G., A.E.M. Kemmers-Voncken, E.A.M. Boers, R. Frankhuizen, and W. Haasnoot, Enzyme-linked immunosorbent assay for the detection of bovine rennet whey powder in milk powder and buttermilk powder. INT DAIRY J, 2008. 18(3): p. 294-302.
125. Yuan, L.P., B. Liu, K.D. Yin, G.D. Yang, L. Huang, and Y.H. Nie, Biotin-Streptavidin-enhanced Enzyme-Linked Immunosorbent Assay for the Determination of Parathion-Methyl in Vegetables. ANALYTICAL LETTERS, 2013. 46(7): p. 1084-1096.
126. Font, H., J. Adrian, R. Galve, M.C. Esevez, M. Castellari, M. Gratacos-Cubarsi, F. Sanchez-Baeza, and M.P. Marcot, Immunochemical assays for direct sulfonamide antibiotic detection in milk and hair samples using antibody derivatized magnetic nanoparticles. J AGR FOOD CHEM, 2008. 56(3): p. 736-743.
127. Gaudin, V., N. Cadieu, and P. Maris, Inter-laboratory studies for the evaluation of ELISA kits for the detection of chloramphenicol residues in milk and muscle. FOOD AGR IMMUNOL, 2003. 15(3-4): p. 143-157.
128. Pyun, C.W., A.M.A. El-Aty, M.M.M. Hashim, J.H. Shim, S.K. Lee, K.D. Choi, K.H. Park, H.C. Shin, and C. Lee, Monitoring of streptomycin and dihydrostreptomycin residual levels in porcine meat press juice and muscle via solid-phase fluorescence immunoassay and confirmatory analysis by liquid chromatography after post-column derivatization. BIOMED CHROMATOGR, 2008. 22(3): p. 254-259.
129. Situ, C., E. Grutters, P. van Wichen, and C.T. Elliott, A collaborative trial to evaluate the performance of a multi-antibiotic enzyme-linked immunosorbent assay for screening five banned antimicrobial growth promoters in animal feedingstuffs. ANAL CHIM ACTA, 2006. 561(1-2): p. 62-68.
130. Entwisle, A.C., A.C. Williams, P.J. Mann, P.T. Slack, and J. Gilbert, Liquid chromatographic method with immunoaffinity column cleanup for determination of ochratoxin A in barley: Collaborative study. J AOAC INT, 2000. 83(6): p. 1377-1383.
131. Visconti, A., M. Pascale, and G. Centonze, Determination of ochratoxin A in wine and beer by immunoaffinity column cleanup and liquid chromatographic

General introduction
59
analysis with fluorometric detection: Collaborative study. J AOAC INT, 2001. 84(6): p. 1818-1827.
132. Senyuva, H.Z. and J. Gilbert, Immunoaffinity column clean-up techniques in food analysis: A review. J CHROMATOGR B, 2010. 878(2): p. 115-132.
133. Peters, J., D. Thomas, E. Boers, T. de Rijk, F. Berthiller, W. Haasnoot, and M.W. Nielen, Colour-encoded paramagnetic microbead-based direct inhibition triplex flow cytometric immunoassay for ochratoxin A, fumonisins and zearalenone in cereals and cereal-based feed. ANAL BIOANAL CHEM, 2013.
134. PDB (Protein Data Bank), http://www.pdb.org/pdb/explore/explore.do?structureId=1kdk, accessed on 01-08-2013.
135. Joseph, D.R., Structure, function, and regulation of androgen-binding protein/sex hormone-binding globulin. VITAM HORM, 1994. 49: p. 197-280.
136. Hammond, G.L., Access of reproductive steroids to target tissues. OBSTET GYNECOL CLIN NORTH AM, 2002. 29(3): p. 411-23.
137. Siiteri, P.K., J.T. Murai, G.L. Hammond, J.A. Nisker, W.J. Raymoure, and R.W. Kuhn, The serum transport of steroid hormones. RECENT PROG HORM RES, 1982. 38: p. 457-510.
138. Avvakumov, G.V., A. Cherkasov, Y.A. Muller, and G.L. Hammond, Structural analyses of sex hormone-binding globulin reveal novel ligands and function. MOL CELL ENDOCRINOL, 2010. 316(1): p. 13-23.
139. Cherkasov, A., F. Ban, O. Santos-Filho, N. Thorsteinson, M. Fallahi, and G.L. Hammond, An Updated Steroid Benchmark Set and Its Application in the Discovery of Novel Nanomolar Ligands of Sex Hormone-Binding Globulin. J MED CHEM, 2008. 51(7): p. 2047-2056.
140. Cherkasov, A., Z. Shi, M. Fallahi, and G.L. Hammond, Successful in Silico Discovery of Novel Nonsteroidal Ligands for Human Sex Hormone Binding Globulin. J MED CHEM, 2005. 48(9): p. 3203-3213.
141. Jury, H.H., T.R. Zacharewski, and G.L. Hammond, Interactions between human plasma sex hormone-binding globulin and xenobiotic ligands. J STEROID BIOCHEM, 2000. 75(2-3): p. 167-176.
142. Meulenberg, E.P., A new test to identify endocrine disruptors using sex hormone-binding globulins from human serum. EUR J LIPID SCI TECH, 2002. 104(2): p. 131-136.
143. Bocchinfuso, W.P. and G.L. Hammond, Steroid-binding and dimerization domains of human sex hormone-binding globulin partially overlap: steroids and Ca2+ stabilize dimer formation. BIOCHEM, 1994. 33(35): p. 10622-9.
144. Mooney, M.H., A.A. Bergwerff, J.A. van Meeuwen, P.B. Luppa, and C.T. Elliott, Biosensor-based detection of reduced sex hormone-binding globulin binding capacities in response to growth-promoter administrations. ANAL

Chapter 1
60
CHIM ACTA, 2009. 637(1-2): p. 235-240.145. Zhou, A.W., Z.Q. Wei, R.J. Read, and R.W. Carrell, Structural mechanism
for the carriage and release of thyroxine in the blood. P NATL ACAD SCI USA, 2006. 103(36): p. 13321-13326.
146. Tsuzuki, T., S. Mita, S. Maeda, S. Araki, and K. Shimada, Structure of the Human Prealbumin Gene. J BIOL CHEM, 1985. 260(22): p. 2224-2227.
147. Neumann, P., V. Cody, and A. Wojtczak, Structural basis of negative cooperativity in transthyretin. ACTA BIOCHIM POL, 2001. 48(4): p. 867-875.
148. Matsubara, K., M. Mizuguchi, and K. Kawano, Expression of a synthetic gene encoding human transthyretin in Escherichia coli. PROTEIN EXPRES PURIF, 2003. 30(1): p. 55-61.
149. Weiss, J.M., P.L. Andersson, M.H. Lamoree, P.E.G. Leonards, S.P.J. Van Leeuwen, and T. Hamers, Competitive binding of poly- and perfluorinated compounds to the thyroid hormone transport protein transthyretin. TOXICOL SCI, 2009. 109(2): p. 206-216.
150. Lans, M.C., E. Klasson-Wehler, M. Willemsen, E. Meussen, S. Safe, and A. Brouwer, Structure-dependent, competitive interaction of hydroxy-polychlorobiphenyls, -dibenzo-p-dioxins and -dibenzofurans with human transthyretin. CHEM-BIOL INTERACT, 1993. 88(1): p. 7-21.
151. Suzuki, G., H. Takigami, M. Watanabe, S. Takahashi, K. Nose, M. Asari, and S.-I. Sakai, Identification of brominated and chlorinated phenols as potential thyroid-disrupting compounds in indoor dusts. ENVIRON SCI TECHNOL, 2008. 42(5): p. 1794-800.
152. PDB (Protein Data Bank), http://www.pdb.org/pdb/explore/explore.do?structureId=3CBR, accessed on 01-08-2013.
153. Alonso, L.C. and R.L. Rosenfield, Oestrogens and puberty. BEST PRACT RES CL EN, 2002. 16(1): p. 13-30.
154. Brzozowski, A.M., A.C. Pike, Z. Dauter, R.E. Hubbard, T. Bonn, O. Engstrom, L. Ohman, G.L. Greene, J.A. Gustafsson, and M. Carlquist, Molecular basis of agonism and antagonism in the oestrogen receptor. NATURE, 1997. 389(6652): p. 753-8.
155. Zhang, D. and V.L. Trudeau, Integration of membrane and nuclear estrogen receptor signaling. COMP BIOCHEM PHYSIOL, 2006. 144(3): p. 306-15.
156. Jonker, N., A. Kretschmer, J. Kool, A. Fernandez, D. Kloos, J.G. Krabbe, H. Lingeman, and H. Irth, Online Magnetic Bead Dynamic Protein-Affinity Selection Coupled to LC-MS for the Screening of Pharmacologically Active Compounds. ANAL CHEM, 2009. 81(11): p. 4263-4270.
157. Usami, M., K. Mitsunaga, and Y. Ohno, Estrogen receptor binding assay of chemicals with a surface plasmon resonance biosensor. J STEROID BIOCHEM, 2002. 81(1): p. 47-55.

General introduction
61
158. Blair, R.M., H. Fang, W.S. Branham, B.S. Hass, S.L. Dial, C.L. Moland, W. Tong, L. Shi, R. Perkins, and D.M. Sheehan, The estrogen receptor relative binding affinities of 188 natural and xenochemicals: Structural diversity of ligands. TOXICOL SCI, 2000. 54(1): p. 138-153.
159. Plotan, M., C.T. Elliott, M.L. Scippo, M. Muller, J.-P. Antignac, E. Malone, T.F.H. Bovee, S. Mitchell, and L. Connolly, The application of reporter gene assays for the detection of endocrine disruptors in sport supplements. ANAL CHIM ACTA, 2011. 700(1–2): p. 34-40.
160. Balevicius, Z., A. Ramanaviciene, I. Baleviciute, A. Makaraviciute, L. Mikoliunaite, and A. Ramanavicius, Evaluation of intact- and fragmented-antibody based immunosensors by total internal reflection ellipsometry. SENSOR ACTUAT B-CHEM, 2011. 160(1): p. 555-562.
161. Karyakin, A.A., G.V. Presnova, M.Y. Rubtsova, and A.M. Egorov, Oriented immobilization of antibodies onto the gold surfaces via their native thiol groups. ANAL CHEM, 2000. 72(16): p. 3805-3811.
162. Kausaite-Minkstimiene, A., A. Ramanaviciene, J. Kirlyte, and A. Ramanavicius, Comparative Study of Random and Oriented Antibody Immobilization Techniques on the Binding Capacity of Immunosensor. ANAL CHEM, 2010. 82(15): p. 6401-6408.
163. Kang, J.H., H.J. Choi, S.Y. Hwang, S.H. Han, J.Y. Jeon, and E.K. Lee, Improving immunobinding using oriented immobilization of an oxidized antibody. J CHROMATOGR A, 2007. 1161(1-2): p. 9-14.
164. Han, H.J., R.M. Kannan, S.X. Wang, G.Z. Mao, J.P. Kusanovic, and R. Romero, Multifunctional Dendrimer-Templated Antibody Presentation on Biosensor Surfaces for Improved Biomarker Detection. ADV FUNCT MATER, 2010. 20(3): p. 409-421.
165. Price, M.R., M. Sekowski, D.S. Hooi, L.G. Durrant, F. Hudecz, and S.J. Tendler, Measurement of antibody binding to antigenic peptides conjugated in situ to albumin-coated microtitre plates. J IMMUNOL METHODS, 1993. 159(1-2): p. 277-81.
166. Ansari, A.A., N.S. Hattikudur, S.R. Joshi, and M.A. Medeira, ELISA solid phase: stability and binding characteristics. J IMMUNOL METHODS, 1985. 84(1-2): p. 117-24.
167. Galanina, O.E., A.A. Chinarev, N.V. Shilova, M.A. Sablina, and N.V. Bovin, Immobilization of polyacrylamide-based glycoconjugates on solid phase in immunosorbent assays. METHOD MOL BOL, 2012. 808: p. 167-82.
168. Shen, G.Y., C.B. Cai, K. Wang, and J.L. Lu, Improvement of antibody immobilization using hyperbranched polymer and protein A. ANAL BIOCHEM, 2011. 409(1): p. 22-27.
169. Vashist, S.K., C.K. Dixit, B.D. MacCraith, and R. O’Kennedy, Effect of

Chapter 1
62
antibody immobilization strategies on the analytical performance of a surface plasmon resonance-based immunoassay. ANALYST, 2011. 136(21): p. 4431-4436.
170. Turkova, J., Oriented immobilization of biologically active proteins as a tool for revealing protein interactions and function. J CHROMATOGR B, 1999. 722(1-2): p. 11-31.
171. Zengin, A. and T. Caykara, Immobilization of immunoglobulin G in a highly oriented manner on a protein-A terminated multilayer system. APPL SURF SCI, 2011. 257(6): p. 2111-2117.
172. Cho, I.H., J.W. Park, T.G. Lee, H. Lee, and S.H. Paek, Biophysical characterization of the molecular orientation of an antibody-immobilized layer using secondary ion mass spectrometry. ANALYST, 2011. 136(7): p. 1412-1419.
173. Ha, E.J., B.S. Kim, E.K. Park, K.W. Song, S.G. Lee, S.S.A. An, and H.J. Paik, Site-specific reversible immobilization and purification of His-tagged protein on poly(2-acetamidoacrylic acid) hydrogel beads. POLYM ADVAN TECHNOL, 2013. 24(1): p. 75-80.
174. Trilling, A.K., M.M. Harmsen, V.J.B. Ruigrok, H. Zuilhof, and J. Beekwilder, The effect of uniform capture molecule orientation on biosensor sensitivity: Dependence on analyte properties. BIOSENS BIOELECTRON, 2013. 40(1): p. 219-226.
175. Trilling, A.K., J. Beekwilder, and H. Zuilhof, Antibody orientation on biosensor surfaces: a minireview. ANALYST, 2013. 138(6): p. 1619-27.
176. Kummer, A. and E.C.Y. Li-Chan, Application of an ELISA-elution assay as a screening tool for dissociation of yolk antibody-antigen complexes. J IMMUNOL METHODS, 1998. 211(1-2): p. 125-137.
177. Muronetz, V.I. and T. Korpela, Isolation of antigens and antibodies by affinity chromatography. J CHROMATOGR B, 2003. 790(1-2): p. 53-66.
178. Beyer, N.H., M.Z. Hansen, C. Schou, P. Hojrup, and N.H.H. Heegaard, Optimization of antibody immobilization for on-line or off-line immunoaffinity chromatography. J SEP SCI, 2009. 32(10): p. 1592-1604.
179. Kiselyova, E.P., O.V. Tsyganova, I.I. Vashkevich, and O.V. Sviridov, Immunoaffinity chromatography of human thyroid peroxidase: The stability of the three-dimensional structure and immunoreactivity of antigen and antibodies under various elution conditions. APPL BIOCHEM MICRO, 2009. 45(3): p. 334-342.
180. Saiyed, Z., S. Telang, and C. Ramchand, Application of magnetic techniques in the field of drug discovery and biomedicine. BIOMAGN RES TECHNOL, 2003. 1(1): p. 2.
181. Earley, M.C., R.F. Vogt Jr, H.M. Shapiro, F.F. Mandy, K.L. Kellar, R. Bellisario,

General introduction
63
K.A. Pass, G.E. Marti, C.C. Stewart, and W.H. Hannon, Report from a workshop on multianalyte microsphere assays. CLIN CY, 2002. 50(5): p. 239-242.
182. Liu, N., P. Su, Z.X. Gao, M.X. Zhu, Z.H. Yang, X.J. Pan, Y.J. Fang, and F.H. Chao, Simultaneous detection for three kinds of veterinary drugs: Chloramphenicol, clenbuterol and 17-beta-estradiol by high-throughput suspension array technology. ANAL CHIM ACTA, 2009. 632(1): p. 128-134.
183. Marchesini, G.R., E. Meulenberg, W. Haasnoot, M. Mizuguchi, and H. Irth, Biosensor recognition of thyroid-disrupting chemicals using transport proteins. ANAL CHEM, 2006. 78(4): p. 1107-1114.
184. Stolker, A.A.M. and U.A.T. Brinkman, Analytical strategies for residue analysis of veterinary drugs and growth-promoting agents in food-producing animals - a review. J CHROMATOGR A, 2005. 1067(1-2): p. 15-53.
185. Gentili, A., D. Perret, and S. Marchese, Liquid chromatography-tandem mass spectrometry for performing confirmatory analysis of veterinary drugs in animal-food products. TRAC-TREND ANAL CHEM, 2005. 24(7): p. 704-733.
186. Li, P., Z. Zhang, X. Hu, and Q. Zhang, Advanced hyphenated chromatographic-mass spectrometry in mycotoxin determination: Current status and prospects. MASS SPECTROM REV, 2013.
187. Krska, R., P. Schubert-Ullrich, A. Molinelli, M. Sulyok, S. MacDonald, and C. Crews, Mycotoxin analysis: an update. FOOD ADDIT CONTAM A, 2008. 25(2): p. 152-63.
188. Peters, R.J.B., A.A.M. Stolker, J.G.J. Mol, A. Lommen, E. Lyris, Y. Angelis, A. Vonaparti, M. Stamou, C. Georgakopoulos, and M.W.F. Nielen, Screening in veterinary drug analysis and sports doping control based on full-scan, accurate-mass spectrometry. TRAC-TREND ANAL CHEM, 2010. 29(11): p. 1250-1268.
189. Le Bizec, B., G. Pinel, and J.P. Antignac, Options for veterinary drug analysis using mass spectrometry. J CHROMATOGR A, 2009. 1216(46): p. 8016-8034.
190. Gottfried, S. and D. Herebian, Determination of Mycotoxins in Food Matrices Using LC-MS/MS Compared With High-resolution Orbitrap (TM) MS Technology. CURR ANAL CHEM, 2013. 9(1): p. 99-107.
191. Bovee, T.F., R.J. Helsdingen, A.R. Hamers, M.B. van Duursen, M.W. Nielen, and R.L. Hoogenboom, A new highly specific and robust yeast androgen bioassay for the detection of agonists and antagonists. ANAL BIOANAL CHEM, 2007. 389(5): p. 1549-58.
192. Nielen, M.W., T.F. Bovee, M.C. van Engelen, P. Rutgers, A.R. Hamers, J.H. van Rhijn, and L.R. Hoogenboom, Urine testing for designer steroids by

Chapter 1
64
liquid chromatography with androgen bioassay detection and electrospray quadrupole time-of-flight mass spectrometry identification. ANAL CHEM, 2006. 78(2): p. 424-31.
193. Rijk, J.C., T.F. Bovee, S. Wang, C. Van Poucke, C. Van Peteghem, and M.W. Nielen, Detection of anabolic steroids in dietary supplements: the added value of an androgen yeast bioassay in parallel with a liquid chromatography-tandem mass spectrometry screening method. ANAL CHIM ACTA, 2009. 637(1-2): p. 305-14.
194. Van Poucke, C., C. Detavernier, R. Van Cauwenberghe, and C. Van Peteghem, Determination of anabolic steroids in dietary supplements by liquid chromatography-tandem mass spectrometry. ANAL CHIM ACTA , 2007. 586(1-2): p. 35-42.
195. Nielen, M.W., C.T. Elliott, S.A. Boyd, D. Courtheyn, M.L. Essers, H.H. Hooijerink, E.O. van Bennekom, and R.E. Fuchs, Identification of an unknown beta-agonist in feed by liquid chromatography/bioassay/quadrupole time-of-flight tandem mass spectrometry with accurate mass measurement. RAPID COMMUN MASS SP, 2003. 17(14): p. 1633-41.
196. de Vlieger, J.S.B., A.J. Kolkman, K.A.M. Ampt, J.N.M. Commandeur, N.P.E. Vermeulen, J. Kool, S.S. Wijmenga, W.M.A. Niessen, H. Irth, and M. Honing, Determination and identification of estrogenic compounds generated with biosynthetic enzymes using hyphenated screening assays, high resolution mass spectrometry and off-line NMR. J CHROMATOGR B, 2010. 878(7-8): p. 667-674.
197. Kool, J., S.M. van Liempd, S. Harmsen, J. Beckman, D. van Elswijk, J.N.M. Commandeur, H. Irth, and N.P.E. Vermeulen, Cytochrome P450 bio-affinity detection coupled to gradient HPLC: On-line screening of affinities to cytochrome P4501A2 and 2D6. J CHROMATOGR B, 2007. 858(1-2): p. 49-58.
198. Heus, F., F. Vonk, R.A. Otvos, B. Bruyneel, A.B. Smit, H. Lingeman, M. Richardson, W.M.A. Niessen, and J. Kool, An efficient analytical platform for on-line microfluidic profiling of neuroactive snake venoms towards nicotinic receptor affinity. TOXICON, 2013. 61: p. 112-124.
199. Hess, M., G. Hofner, and K.T. Wanner, (S)- and (R)-fluoxetine as native markers in mass spectrometry (MS) binding assays addressing the serotonin transporter. CHEMMEDCHEM, 2011. 6(10): p. 1900-8.
200. Niessen, K.V., G. Hofner, and K.T. Wanner, Competitive MS binding assays for dopamine D2 receptors employing spiperone as a native marker. CHEMMEDCHEM, 2005. 6(10): p. 1769-75.
201. Hofner, G. and K.T. Wanner, Competitive binding assays made easy with a native marker and mass spectrometric quantification. ANGEW CHEM INT

General introduction
65
ED ENGL, 2003. 42(42): p. 5235-7.202. Zepperitz, C., G. Hofner, and K.T. Wanner, MS-binding assays: kinetic,
saturation, and competitive experiments based on quantitation of bound marker as exemplified by the GABA transporter mGAT1. CHEMMEDCHEM, 2006. 1(2): p. 208-17.
203. Hess, M., G. Hofner, and K.T. Wanner, Development and validation of a rapid LC-ESI-MS/MS method for quantification of fluoxetine and its application to MS binding assays. ANAL BIOANAL CHEM, 2011. 400(10): p. 3505-15.
204. Hofner, G. and K.T. Wanner, Using short columns to speed up LC-MS quantification in MS binding assays. J CHROMATOGR B, 2010. 878(17-18): p. 1356-64.
205. Polley, M., G. Hofner, and K.T. Wanner, Development and validation of an LC-ESI-MS/MS quantification method for a potential gamma-aminobutyric acid transporter 3 (GAT3) marker and its application in preliminary MS binding assays. BIOMED CHROMATOGR, 2013. 27(5): p. 641-54.


2Immunomagnetic microbeads for screening with flow cytometry and identification with nano-liquid
chromatography mass spectrometry of ochratoxins in wheat and cereal.
Aqai, P., J. Peters, A. Gerssen, W. Haasnoot, and M.W.F. Nielen, Analytical and Bioanalytical Chemistry, 2011. 400 (9): p. 3085-3096.

Chapter 2
68
Abstract
Multi-analyte binding assays for rapid screening of food contaminants require mass spectrometric identification of compound(s) in suspect samples. An optimal combination is obtained when the same bioreagents are used in both methods; moreover miniaturization is important because of high costs of bioreagents. A concept is demonstrated using superparamagnetic microbeads coated with monoclonal antibodies (Mabs) in a novel direct inhibition flow cytometric immunoassay (FCIA) plus immunoaffinity isolation prior to identification by nano-liquid chromatography-quadrupole-time-of-flight-mass spectrometry (nano-LC-Q-ToF-MS). As a model system, the mycotoxin ochratoxin A (OTA) and cross-reacting mycotoxin analogues were analyzed in wheat and cereal samples, after a simple extraction, using the FCIA with anti-OTA Mabs. The limit of detection for OTA was 0.15 ng g-1, which is far below the lowest maximum level (ML) of 3 ng g-1 established by the European Union. In the immunomagnetic isolation method, a 350 times higher amount of beads was used to trap ochratoxins from sample extracts. Following a wash step, bound ochratoxins were dissociated from the Mabs using a small volume of acidified acetonitrile/water (2/8 v/v) prior to separation plus identification with nano-LC-Q-ToF-MS. In screened suspect naturally contaminated samples, OTA and its non-chlorinated analogue ochratoxin B were successfully identified by full scan accurate mass spectrometry as a proof of concept for identification of unknown but cross-reacting emerging mycotoxins. Due to the miniaturization and bioaffinity isolation, this concept might be applicable for the use of other and more expensive bioreagents such as transport proteins and receptors for screening and identification of known and unknown (or masked) emerging food contaminants.
Screening and identification of ochratoxins
69
Introduction
For the rapid detection of food contaminants, such as mycotoxins, many rapid immunoassays have been developed [1-7]. However, such immunoassays are considered as screening assays due to the risk of false non-compliant results and subsequent confirmation with instruments such as liquid chromatography (LC) combined with mass spectrometry (MS) is compulsory [8]. Screening assays with multi-analyte reagents (group-specific antibodies [9], transport proteins [10] or receptors [11]) are of particular interest since they might pinpoint the occurrence of emerging yet unidentified food contaminants and the subsequent MS identification of the interacting compound(s) is essential. In an ideal situation, to avoid different sample preparations with different selectivities, the screening should be as close as possible to the MS confirmation or identification of unknowns, which could be achieved by using identical bioreagents in both methods. Moreover, miniaturization is important because of the high costs of bioreagents in general. Superparamagnetic carboxylated polystyrene microbeads (MagPlexTM (6.5 μm diameter beads)) might be used in a multiplex flow cytometric immunoassay (FCIA) for screening several mycotoxins including ochratoxin A (OTA). Superparamagnetic means that the beads can easily be magnetized when an external magnetic field is applied and redispersed immediately when the magnet is removed, which enhances both ease-of-use and automation capabilities [12]. These beads are internally dyed with a red and an infrared fluorophore and by varying the ratio of the two fluorophores, up to 80 different color-coded bead sets can be distinguished (MultiAnalyte Profiling (xMAP®) technology). Each bead set can be covalently coupled, via its carboxylated surface modification, to a different biological probe such as antibodies or other (bio)molecules. In combination with a special flow cytometer (Luminex®), it is possible to simultaneously measure up to 80 different biomolecular interactions in a single well [13]. Other distinct advantages are high throughput capability, versatility, accuracy and reproducibility [14]. Multiplex FCIAs were described for the screening of plant proteins, which might be used as adulterants in milk powders [15], pathogens [16], mycotoxins [17], sulfonamides in milk [9] and polycyclic aromatic hydrocarbons in fish [18]. However, all of these are indirect inhibition FCIAs and most of them use non-magnetic beads (MicroPlex®) coated with antigens and fluorescent labeled (secondary) antibodies for detection. OTA is a mycotoxin which has carcinogenic, nephrotoxic and teratogenic properties and is produced by Aspergillus and Penicillium fungi [19]. The Aspergillus fungus also produces OTA analogues such as the non-chlorinated ochratoxin B (OTB), ochratoxin α (OTα) , ochratoxin β (OTβ) and ochratoxin C (OTC) (Figure 1). Most analogues are reported less toxic than OTA but OTC is considered as toxic as OTA since it is converted into OTA after metabolism [19]. All analogues are produced approximately 10 times less by the Aspergillus fungus [20]. Regardless of the natural occurrence and toxicity of OTB, OTα, OTβ

Chapter 2
70
and OTC, the majority of existing methods are focused on OTA only. OTA is widely found in cereals, wine, coffee, beer, nuts, dried fruits and meat products [21]. Cereal and cereal products are the main sources of EU consumer exposure to OTA [22]. The maximum levels (ML) established by the EU for OTA in food [23] vary between 0.5 and 10 ng g-1. The ML in cereal and cereal products is 5 ng g-1 and if the cereal is meant for direct human consumption, the ML is 3 ng g-1. The lowest OTA ML of 0.5 ng g-1 is established for baby food. Guidance values in feed vary between 50 and 250 ng g-1 and for OTA in cereal or cereal products used as feed material 250 ng g-1 is applied [24]. For the detection of OTA and other mycotoxins, immunoaffinity chromatography (IAC) is a common tool for the specific isolation from sample materials prior to HPLC or LC-MS analysis [25-27]. However, such IAC columns are voluminous, use high amounts of carrier material with a high risk of non-specific binding. They consume lots of antibodies and require large volumes of chemicals for extraction and elution, with extra time for evaporation, and sometimes filtration of the sample extracts to remove matrix particles. Several of these disadvantages are overcome by the miniaturized immunoextraction method for OTA as described by Faure et al. [4] using in-situ polymerization of a monolithic stationary phase with highly reactive epoxy groups for protein coupling. However, the crucial polymerization step requires both time (>10 h) and expertise and the antibody immobilization is also time-consuming (>18 h).
Figure 1. Molecular structures, elemental compositions and theoretical exact masses of (A) OTA, (B)
OTB, (C) OTC, (D) OTα and (E) OTβ.
B
A
C20H18ClNO6, 403.0823 Dalton C20H19NO6, 369.1212 Dalton
C22H22ClNO6, 431.1136 Dalton C11H9ClO5, 256.0139 Dalton
C11H10O5, 222.1941 Dalton
C
E
B
D

Screening and identification of ochratoxins
71
and OTC, the majority of existing methods are focused on OTA only. OTA is widely found in cereals, wine, coffee, beer, nuts, dried fruits and meat products [21]. Cereal and cereal products are the main sources of EU consumer exposure to OTA [22]. The maximum levels (ML) established by the EU for OTA in food [23] vary between 0.5 and 10 ng g-1. The ML in cereal and cereal products is 5 ng g-1 and if the cereal is meant for direct human consumption, the ML is 3 ng g-1. The lowest OTA ML of 0.5 ng g-1 is established for baby food. Guidance values in feed vary between 50 and 250 ng g-1 and for OTA in cereal or cereal products used as feed material 250 ng g-1 is applied [24]. For the detection of OTA and other mycotoxins, immunoaffinity chromatography (IAC) is a common tool for the specific isolation from sample materials prior to HPLC or LC-MS analysis [25-27]. However, such IAC columns are voluminous, use high amounts of carrier material with a high risk of non-specific binding. They consume lots of antibodies and require large volumes of chemicals for extraction and elution, with extra time for evaporation, and sometimes filtration of the sample extracts to remove matrix particles. Several of these disadvantages are overcome by the miniaturized immunoextraction method for OTA as described by Faure et al. [4] using in-situ polymerization of a monolithic stationary phase with highly reactive epoxy groups for protein coupling. However, the crucial polymerization step requires both time (>10 h) and expertise and the antibody immobilization is also time-consuming (>18 h).
Figure 1. Molecular structures, elemental compositions and theoretical exact masses of (A) OTA, (B)
OTB, (C) OTC, (D) OTα and (E) OTβ.
B
Applications of bioaffinity superparamagnetic beads are described for extracting and pre-concentrating proteins, lipopolysaccharides [28, 29], hormones and drugs [30] and in proteomic profiling [31]. They can operate in small volumes and simplify sample preparation procedures. MagPlexTM superparamagnetic microbeads coated with antibodies have the extra advantage that they can also be used in the flow cytometric screening assay. Covalent coupling of these beads with proteins (e.g. antibodies) is not laborious (<4 h). In the present research, the concept of using identical bioreagents in both screening and identification methods was investigated by using superparamagnetic microbeads (beads) in a direct inhibition FCIA for the screening of OTA, a relevant model food contaminant, and for the immunomagnetic isolation prior to identification by nano-LC-Q-ToF-MS. This identification technique was used because of its high sensitivity, small injection volumes, ultralow flow rates, resulting in the low consumption of hazardous chemicals, and the option to operate in full scan accurate mass mode for the identification of unknown compounds based on elemental composition calculated thereof. The optimization experiments were performed with high performance-liquid chromatography-triple quadrupole-mass spectrometry (LC-QqQ-MS) due to its high sensitivity and availability. In this research, one set of the paramagnetic beads was coated with monoclonal antibodies (Mabs) against OTA and, for the detection, OTA was coupled to the fluorescent protein R-Phycoerythrin (R-PE) according to a procedure described by Kawamura et al. [32]. As a model, we focused on the development and application of a rapid screening assay for OTA in wheat and cereal for human consumption, which can easily be extended to other mycotoxins in the future. The same Mab-coated beads, but different amounts, were used for the specific miniaturized immunoaffinity isolation of OTA and cross-reacting analogues, prior to the identification with nano-LC-Q-ToF-MS.
Materials and Methods
Materials
Acetonitrile (ACN), methanol (MeOH) and ToF grade water were purchased from Biosolve (Valkenswaards, The Netherlands). Formic acid (HCOOH) and ethylene diamine were from Merck (Whitehouse Station, NJ, USA) and N-(3-dimethylaminopropyl)-N-ethylcarbodiimide hydrochloride (EDC), NaHCO3, Tween-20, OTA, OTB and NaN3 from Sigma-Aldrich Chemie (Zwijndrecht, The Netherlands). Beads (magnetic carboxylated microspheres (MagPlexTM no. 086)) and the sheath fluid were supplied by Luminex Corporation (Austin, TX, USA). Mabs (purified mouse anti-OTA IgG (201051-5G9)) were purchased from Soft Flow Biotechnology (Pécs, Hungary) and water was purified using a Milli-Q system (Millipore, Bedford, MA, USA). Protein LoBind Tubes (1.5 mL) were supplied by Eppendorf (Hamburg,

Chapter 2
72
Germany) and the LoBind 96-wells microplates by Greiner Bio-One B.V. (Alphen a/d Rijn, The Netherlands). The N-hydroxysulfosuccinimide sodium salt (sulfo-NHS) was provided by Fluka Analytical (Steiham, Switzerland). Amicon Ultra Ultracel 50K centrifugal filter units were purchased from Millipore (Bedford, MA, USA) and all BCA reagents were from Thermo Scientific (Rockford, Il, USA). R-PE was from Moss (Pasadena, Maryland, USA). Surface Plasmon Resonance (SPR) biosensor chips (CM5), the amine coupling kit (containing 0.1 M NHS, 0.4 M EDC, and 1 M ethanolamine hydrochloride (pH 8.5)) were from GE Healthcare (Uppsala, Sweden).
Instrumentation
High performance-liquid chromatography-triple quadrupole-mass spectrometry
A Waters (Milford, MA, USA) Acquity Ultra Performance LC (UPLC) system, consisting of a degasser, a binary gradient pump, an autosampler (at 10 °C) and a column oven (at 40 °C), was used. The sample injection volume was 50 µL and the analytical column was an Xbridge 3.5 µm C18, 2.1 mm I.D. × 100 mm from Waters. The UPLC system was coupled to a Micromass (Manchester, UK) Quattro Ultima tandem mass spectrometry (QqQ) system equipped with an electrospray interface (ESI). The two mobile phases used consisted of (A) H2O/HCOOH (99.9/0.1% v/v) and (B) MeOH/HCOOH (99.9/0.1% v/v) and the flow rate was 0.3 mL min-1. The gradient started at 100% A and was kept at this composition for 1 min and decreased linearly to 50% A in 2 min. The mobile composition decrease to 0% A was done in 3 min and kept at 0% A for 7 min and returned to 100% A in 0.5 min with a final hold of 1.5 min. The LC was interfaced with the MS/MS system without a flow split. The mass spectrometer was operated in the positive ESI mode, which was found to be more sensitive than negative ESI in preliminary experiments, at a capillary voltage of 2.5 kV, cone voltage of 30 V, a desolvation gas temperature of 350 °C and source temperature of 120 °C. The desolvation gas was nitrogen (600 L h-1) and the collision-induced dissociation (CID) gas was argon at a pressure of 2.5 x 10⁻³ mbar. The run time was 15 min and data acquisition for OTA was performed in multiple reaction monitoring mode (MRM) at transitions m/z 404.2 → m/z 221.0 and m/z 404.2 → m/z 238.8 using collision energy 35 eV and 30 eV respectively. The absolute limit of detection (LoD) of OTA was determined at 10 pg on-column (S/N > 6).
Nano-liquid chromatography-quadrupole-time-of-flight-mass spectrometry (nano-LC-Q-ToF-MS)
The nanoAcquity UPLC System of Waters consisted of a degasser, a binary gradient pump, a nano-autosampler (at 20 °C) and a column oven (at 60 °C). Lower autosampler temperature induced precipitation of particles in real sample extract causing system overpressure. The trapping column was a nanoAcquity UPLC HSS

Screening and identification of ochratoxins
73
T3 5 µm C8, 180 µm I.D. x 20 mm, and the analytical column was a nanoAcquity UPLC BEH 1.7 µm C18 column, pore size 130 Å, 75 µm I.D. x 100 mm, all from Waters. The nanoAcquity UPLC System was coupled to a Xevo quadrupole-time-of-flight (Q-ToF) (from Waters) mass spectrometry system equipped with a nano-ESI interface without a flow split. The two mobile phases consisted of (A) H2O/HCOOH (99.9/0.1 % v/v) and (B) MeOH/HCOOH (99.9/0.1% v/v) and the flow was 500 nL min-1. After injection (4 µL), the sample was preconcentrated on the trapping column at a flow rate of 10 µL min-1 (100% A). After 3 min trapping time, the gradient started at 99% A and was kept at this composition for 5 min and decreased linearly to 5% A in 5 min. This mobile phase composition was kept for 12 min and returned to 100% A in 1 min with a final hold of 7 min. The total run time was 33 min. The mass spectrometer was operated in the positive ESI mode (again found to be more sensitive than negative ESI in preliminary experiments) at a capillary voltage of 2.8 kV, cone was at 40 V and source temperature was 80 °C. The purge gas was nitrogen (50 L h-1) and cone gas 10 L h-1 and data acquisition was performed in full scan centroid mode. The detector, containing a 4 GHz TDC, was set to accumulate spectra during 0.3 s in full scan mode at a resolution of 10,000 FWHM. The dynamic range enhancement option was applied to achieve accurate mass measurements over a wide concentration range. A 2 ng µL-1 standard solution of leucine-enkephalin was introduced as a lock-mass via the lock-spray needle (capillary voltage 2.8 kV and cone voltage 40 V) at a flow rate of 500 nL min-1.
Other instruments
The Luminex FM-3D flow cytometer with Xponent System 2.0 control software was purchased from Luminex Corporation (Austin, TX, USA). The NanoDrop ND-1000 spectrophotometer was from Thermo Scientific (Rockford, Il, USA) and the Biacore 3000 SPR biosensor from GE Healthcare (Uppsala, Sweden). The automated magnetic wash station BioPlexTM Pro II, with a magnetic carrier, was from BioRad Laboratories B.V. (Veenendaal, The Netherlands) and the magnetic separator rack DynaMag-2TM from Invitrogen Dynal (Oslo, Norway). The microtiter plate vari-shaker was from Dynatech (Alexandria, VI, USA) and the REAX2 head-over-head shaker from Heidolph (Schwabach, Germany). The Eppendorf 5810 R centrifuge, using the A-4-62 rotor, was purchased from VWR International (Amsterdam, The Netherlands) and the test tube rotator from Snijders (Tilburg, The Netherlands).
Methods
SPR biosensor immunoassay
For testing several dissociation conditions of OTA from the Mabs, OTA was immobilized onto the carboxymethylated dextran surface of a CM5 biosensor chip.

Chapter 2
74
For this, the CM5 sensor chip surface was activated with 50 µL of a mixture of 0.4 M EDC and 0.1 M NHS (1:1, v/v) during 15 min at room temperature (RT). The chip surface was washed with water and dried under a stream of nitrogen gas. To the chip, 50 µL of 1 M ethylene diamine (pH 8.5) was added and after 15 min incubation at RT, the chip was washed with water and dried under a stream of nitrogen gas. OTA was immobilized on the activated sensor surface using the following procedure. OTA (1 mg) was dissolved in 0.2 mL ACN/water (80:20, v/v) and 0.2 mL sodium carbonate buffer (pH 9.6) and 50 μL was mixed with 50 μL 0.4 mL EDC and 50 μL NHS and after incubation at RT for 45 min, this mixture (50 μL) was added to the activated chip. After incubation of 45 min at RT, the chip was washed with water, dried under a stream of nitrogen and docked into the Biacore 3000. Mab dilutions in HBS-EP buffer were injected (20 μL at 20 μL min-1) over the chip surface which resulted in OTA-Mab complexes. Several solutions (10 mM HCl, ACN/H2O/HCOOH (20/79/1 % v/v/v), HCOOH/H2O (1/99 % v/v), ACN and MeOH) were injected (10 μL) for testing the dissociation of the Mabs from the sensor chip. The most suitable dissociation solution was used later on during immunoaffinity extraction of OTA from wheat and cereal to dissociate OTA from the immunomagnetic microbeads.
Preparation of the anti-OTA Mab-coated superparamagnetic beads
Superparamagnetic bead set no. 86 was coated with anti-OTA Mabs using the slightly modified two-step carbodiimide coupling protocol provided by Luminex®. This covalent coupling was based on conjugating the amino groups of the anti-OTA Mab to the carboxylic groups on the surface of the beads. In short, the stock of beads (suspension containing 1.25 × 10⁷ beads mL-1) was resuspended by vortexing for 5 min. From this stock, 400 µL (containing 5 × 10⁶ beads) was transferred to a protein LoBind tube in which the beads were concentrated in the magnetic separator rack in 1 min. After gently removing of the supernatant, the pellet was washed by resuspending in 100 µL activation buffer (0.1 M NaH2PO4, pH 6.2). The beads were concentrated in the magnetic separator rack and the supernatant was removed. The pellet was resuspended in 80 µL of activation buffer (0.1 M NaH2PO4, pH 6.2). Solutions of sulfo-NHS and EDC (both at 50 mg mL-1) were prepared just before adding 10 µL of each to the 80 µL bead suspension. The concentrations of both these solutions were 50 mg mL-1 made in H2O. The beads were incubated in the dark at room temperature for 20 min. The activated beads were concentrated by the magnet and washed by adding 250 µL of 100 mM MES (2-N-morpholino ethanesulfonic acid) buffer at pH 5. This wash step was performed twice. To the activated and precipitated beads, first, 100 µL of 100 mM MES buffer was added to prevent the beads from becoming dry then a solution containing 100 µg of the anti-OTA Mab in 400 µL of 100 mM MES buffer was added. The suspension was vortexed shortly and incubated for 2 h under mixing by rotation in a test tube rotator at room temperature in the dark. Following

Screening and identification of ochratoxins
75
the incubation, the supernatant containing unbound anti-OTA Mabs was removed and the beads were washed three times with storage buffer (the first wash with 500 µL, the remaining two steps with 1 mL) consisting of PBS (5.4 mM Na2HPO4, 1.3 mM KH2PO4, 150 mM NaCl, 3 mM KCl, pH 7.4) to which, 0.02% Tween-20 and 0.05% NaN3 were added. Finally, the beads were suspended in 500 µL of the storage buffer and stored at 4 °C in dark until used (counted 3.5 x 10⁶ beads per 500 µL). Usually, after incubation, bovine serum albumin (BSA) is used to block the free activated sites of the bead surface. In this study, no blocking procedure was used because BSA might contribute to non-specific binding of OTA [33]. The possible non-specific binding of OTA to the unblocked bead surface was tested.
OTA-PE conjugation
The OTA-PE conjugate was prepared according to a minor modified protocol of Kawamura et al. [32] and was based on conjugating the carboxylic group of OTA to the amino groups of R-PE. In short, 3.5 mg of R-PE was dissolved in 4 mL of 0.1 M NaCl. To this solution, 50 µL ethanol which contained 1 mg of OTA was added dropwise. To this mixture, 3 mL of 0.1 M phosphate buffer (pH 7) containing 10 mg of EDC was added to initiate the coupling. This reaction was incubated for 24 h at room temperature while stirring in the dark. Following the incubation, the mixture was added to a 50 kD microcon filter to remove uncoupled free OTA from the OTA-PE conjugate by centrifuging at 12.000 g for 10 min after which the OTA-PE was reconstituted in 1 mL PBS buffer. In total, five subsequent wash steps were performed to remove all unbound OTA. Finally, after the last wash step, OTA-PE was reconstituted in 2 mL of PBS buffer containing 0.05% NaN3 and stored in the dark at 4 °C.
Protein analysis
BCA. The BCA protocol consisted of the following steps; 10 µL sample solution was added to a microtiter plate (n=2). Then, 200 µL of a mixture, consisting of an alkaline agent, bicinchoninic acid (BCA) and CuSO4 (reduced to Cu1+ by proteins), was added to the samples and the calibration curve. The reagent is responsible for color change by chelating 2 BCA molecules to Cu1+ ions. The calibration curve was made by diluting an immunoglobulin G (IgG) with PBS buffer. Following the addition of reagents, the microtiter plate was incubated at 37 °C during 30 min after which the microtiter plate was cooled for 5 min at RT and the concentration of proteins was measured using an UV microtiter plate reader at 562 nm.
NanoDrop. First, one blank UV-absorbance measurement with 0.5 µL H2O was performed at 280 nm after which 0.5 µL of sample solution was measured at 280

Chapter 2
76
nm. The samples (antibody solutions), before and after coupling, were measured in the Nanodrop spectrophotometer in duplicate to determine coupling efficiency.
OTA extraction from wheat and cereal samples
One gram of sample (either wheat or cereal) was weighed into a 50 mL tube and 10 mL of a 1% aqueous solution of NaHCO3 (pH 8.1) was added to extract ochratoxins from wheat or cereal samples. The tubes were vortexed for 10 s and placed into the head-over-head shaker (rotating slowly) for 30 min. After shaking, the tubes were centrifuged for 5 min at 3500 rpm. For the FCIA, 40 µL of the supernatant was used (either diluted to fit in the calibration curve or undiluted). For nano-LC-Q-ToF-MS-based identification, instead of 40 µL, 1 mL of extract was used which corresponded to 100 pg OTA from a sample containing 1 ng g-1 OTA.
Flow cytometry immunoassay (FCIA) protocol
First, 40 µL of either sample or standard solution was pre-incubated for 15 min in a well of a LB 96-well microtiter plate to which approximately 2000 beads coated with anti-OTA Mab were added. After the pre-incubation, 10 μL of diluted OTA-PE (125 times diluted in NaHCO3 buffer (pH 8.1)) was added to each well. This mixture was incubated for 30 min on a plate shaker at RT in the dark. After these incubations, a washing step with PBS-Tween 20 (PBST) was applied to remove the excess unbound bioreagents and matrix compounds. The wash step was carried out with the magnetic washing plate carrier of the automated wash station. After washing, the beads were resuspended in 100 µL of PBST and the measurement in the Luminex® was done in <60 s using 75 µL per well. To prepare a dose-response calibration curve in buffer (NaHCO3, pH 8.1) or in blank wheat extract, a dilution series of OTA (0.0001-1000 ng mL-1) was prepared in buffer or in blank wheat extract and the results were fitted using the 5 parameter curve fitting in the GraphPad Prism software of GraphPad Software Inc. (La Jolla, CA, USA).
Immunoaffinity isolations of OTA for LC-MS detection
Of the anti-OTA Mab-coated bead stock suspension (containing 3.5 x 10⁶ beads per 500 µL), 100 µL beads was transferred into a 1.5 mL Eppendorf tube (7.0 x 10⁵). The coated beads were trapped by applying the magnetic separator rack for 60 s and the supernatant was removed. One hundred to 1500 µL of either buffer containing 100-300 pg OTA or sample supernatant was added to the beads after which the incubation (tested 1-60 min) was done under gently vortexing. After the incubation, the magnetic separator rack was applied for 60 s and the supernatant was removed gently. To remove matrix compounds, the trapped beads were washed with 100 µL NaHCO3 buffer (pH 8.1) by vortexing for 5 min. The magnetic separator rack was

Screening and identification of ochratoxins
77
applied for 60 s to concentrate beads followed by removal of supernatant. This wash step was repeated once and after the final wash step, 100 µL of the dissociation solvent (ACN/H2O/HCOOH (20/79/1 % v/v/v)) was added to the trapped beads to dissociate OTA from the beads. This was achieved by gentle vortexing for 5 min after which the magnetic separator rack was applied for 60 s and the supernatant (OTA-containing eluate) was transferred into an LC-QqQ-MS vial. For nano-LC-Q-ToF experiments, 25 µL of dissociation solvent was used.
Results and discussion
Coupling efficiency of anti-OTA Mabs to the beads
For the FCIA and the immunoaffinity isolation, the same beads were coated with the same anti-OTA Mabs ensuring a uniform bioaffinity during the screening and the isolation prior to MS confirmation or identification. Several Mabs were tested in the FCIA (data not shown) and the anti-OTA Mab from Soft Flow was selected because of its highest sensitivity and its cross-reactivity towards OTB. The amount of antibodies immobilized determines the amount of beads needed for isolation purposes. Following the Luminex® coupling protocol for proteins to the MagPlexTM beads, 0.4 mL of 0.25 mg mL-1 anti-OTA Mab was added to 5 x 10⁶ activated beads. To determine the coupling efficiency, antibody concentrations were measured in the solutions before and after six immobilizations by two different protein determination techniques; BCA [34, 35] and NanoDrop [36]. With the BCA method, average protein concentrations of 0.28 ± 0.01 mg mL-1 and 0.17 ± 0.01 mg mL-1 were found in the solutions before and after coupling, respectively (BCA usually overestimates glycoprotein concentration [37]). Therefore, the average coupling efficiency was calculated to be 39%. With the NanoDrop, the coupling efficiency was determined to be 44%. Based on these two different techniques for protein analysis, from the absolute amount of Mab (100 µg) added to 5 x 10⁶ beads, between 39 and 44 µg was coupled.
Flow cytometric screening
For the rapid screening of OTA in wheat and cereal samples, a direct inhibition FCIA with Mab-coated superparamagnetic beads and OTA-PE, as the label for detection, was developed. This direct assay format is less laborious and faster, compared to the indirect assay format developed recently [17], because only two (instead of three) incubation steps and one (instead of two) washing step are required. During the development of the direct inhibition method, various steps and parameters were optimized using an OTA concentration range of 0.0001-1000 ng mL-1. The pre-incubation step was performed at different times (15, 30, 60 min) and 15 min

Chapter 2
78
was found to be sufficient. Omitting the pre-incubation step influenced the precision negatively at low OTA levels. The effect of the amount of beads (1000 or 2000/well) was tested and the latter was optimal. Following this, different dilutions of OTA-PE (250, 125, 62.5 times) were tested and the 125 times dilution was optimal with regard to the sensitivity of the assay and aiming for an average final response of 2000 mean fluorescent intensity (MFI). The optimum OTA-PE incubation time was 30 min (15, 30, 60 min tested). After the incubation, a washing step with PBST in the magnetic washer was performed. Two wash buffers (PBS and PBST) were tested to remove matrix compounds and PBST was found most suitable as wash buffer and the same buffer was used to resuspend the beads. Finally, the measurement in the Luminex was optimized by testing the injection volumes (50 and 75 µL, latter was optimum), injection times (30 and 60 s, latter was optimum) and detector settings (low and high detector voltage, latter was used). For the extraction of ochratoxins from wheat and cereal samples, various ratios of acetonitrile/water and methanol/water with and without formic acid were tested. Further, NaHCO3 buffer (pH 8.1) was tested and was found to be most suitable extraction solution because in contrast to other extraction solutions, no false suspect results were produced with this FCIA. The final protocol with selected optimal conditions is described in the material and methods section. This protocol resulted in a dose-response curve for OTA in buffer with a sensitivity at 50% inhibition (IC50) of 0.3 ng mL-1 (Figure 2a), which is comparable to the sensitivity obtained in the indirect format [17], but more sensitive than ELISAs (IC50 0.45-400 ng mL-1) [38, 39], the used SPR biosensor immunoassay (IC50 around 5 ng mL-1) and the non-instrumental dipstick OTA assay [40] (cut-off level of 3.2 ng mL-1).
0.0001 0.001 0.01 0.1 1 10 100 10000
25
50
75
100
ng/mL OTA
Rel
ativ
e re
spon
se (%
)
ng mL-1 OTA Figure 2a. Average dose-response curves (n=2) of OTA in buffer (■) (IC50 = 0.30 ng mL-1) and in wheat extract (●) (IC50 = 0.09 ng mL-1) obtained in FCIA screening assay.

Screening and identification of ochratoxins
79
0.0001 0.001 0.01 0.1 1 10 100 10000
25
50
75
100
ng/mL OTB
Rel
ativ
e re
spon
se (%
)
ng mL-1 OTB
The dose-response curve in wheat extract (Figure 2a) showed a slightly better sensitivity with an IC50 of 0.09 ng mL-1 or 0.9 ng g-1 in the wheat sample. Due to this matrix effect, (semi-)quantification of OTA in wheat was performed with a dose-response curve in a blank wheat extract which showed good precision and a wide measurement range (0.01 to 1 ng mL-1 or 0.1 to 10 ng g-1) which is adequate for the detection at even the lowest ML levels of 3 or 5 ng g-1. The assay was also tested for cross-reactivity with OTB and Figure 2b presents the dose-response curves in buffer and blank wheat extract. According to the IC50 values for OTB in buffer and wheat extract of 2.1 and 0.13 ng mL-1, respectively, the cross-reactivities compared to OTA were calculated as 14 and 69 %, respectively, which are higher compared to the supplier’s data obtained with ELISA (9.2 % in buffer). Under current buffer condition, the OTB dose-response curve showed a wide measurement range, in which (semi-)quantification is allowed with good precision.
Figure 2b. Average dose-response curves (n=2) of OTB in buffer (■) (IC50 = 2.1 ng mL-1) and wheat extract
(●) (IC50 = 0.13 ng mL-1).
Assigned blank wheat samples (n=11) without and with the addition of OTA (1 and 5 ng g-1) were analyzed with the FCIA screening assay. These blank samples were also analyzed by an in-house validated LC-QqQ-MS method and 10 of them were found negative (<0.6 ng g-1). Figure 3 shows that there are clear differences in responses MFI between those 10 blank wheat samples and the spiked wheat samples at different levels.

Chapter 2
80
Figure 3. Average FICA responses (n=2) obtained with the 10 blank wheat samples (0 ng g-1) and blank
wheat spiked with OTA at 1 and 5 ng g-1.
The results obtained with these 10 blank wheat samples, in combination with calibration curves in a blank wheat extract, were used to calculate the limit of detection (LoD) of the screening method (the concentration at the average maximum response minus 3 x SD) which was calculated as 0.15 ng g-1. The concentrations found in the wheat samples spiked at 1 ng g-1 varied between 0.3 and 0.6 ng g-1 with an average of 0.5 ± 0.08 ng g-1 and in the wheat sample spiked at 5 ng g-1 between 2.5 and 4 ng g-1 with an average of 3.0 ± 0.37 ng g-1. These results show that this screening assay is semi-quantitative and suitable to identify suspect wheat samples at the required ML’s of 3 or 5 ng g-1. The eleventh wheat sample was found suspect in the FCIA screening (5.6 ± 0.9 ng g-1) and the OTA concentration found with the LC-QqQ-MS-based chemical method in MRM mode was 15 ng g-1. Primary extraction recovery of OTA (50-60%) from wheat and cereal remained uncorrected in FCIA procedure. Three naturally OTA contaminated cereal samples from a collaborative study were kindly provided by the IRMM (Geel, Belgium); sample 1 (35 ng g-1), sample 2 (190 ng g-1, from proficiency test) and sample 3 (290 ng g-1). In the semi-quantitative screening method, all incurred cereal samples were found suspect and after analyzing diluted extracts, the concentrations found were 35 ng g-1 (sample 1), 60 ng g-1 (sample 2) and 110 ng g-1 (sample 3). The samples were also re-analyzed with the in-house validated LC-QqQ-MS method and OTA concentrations found were 45 ng g-1 (sample 1), 171 ng g-1 (sample 2) and 397 ng g-1 (sample 3).
0
200
400
600
800
1000
1200
1400
1600
1800
2000
0 1 5
Res
pons
e (M
FI)
Spike level (ng/g)Spike level ng g-1

Screening and identification of ochratoxins
81
Immunoaffinity microbead isolation method
For future identification purposes of OTA and cross-reacting analogues in wheat and cereal sample extracts by means of nano-LC-Q-ToF, a microbead-based immunoaffinity isolation method was developed. For this isolation the same, but different amounts, Mab-coated beads were used as applied in the screening method. Most of the optimization experiments were performed with an LC-QqQ-MS system operated in the MRM mode, because of its high sensitivity (absolute 10 pg of OTA) and wide availability.
Dissociation conditions
In order to find suitable dissociation condition of the immunomagnetic isolated OTA, an SPR-based biosensor (Biacore 3000) was used in combination with a biosensor chip coated with OTA. Note that this SPR set-up is in reversed assay format compared to the applied immunoaffinity isolation method, however, in both methods identical immunochemistry is involved to dissociate the Mab-OTA complex. Injections of anti-OTA Mabs (10 μl of 0.1 mg mL-1) onto this chip resulted in high responses (9400 response units (RU)) of bound antibodies which could be dissociated under mild acidic conditions (e.g. a few injections (10 μL) of 10 mM HCl). Due to this pH shift, protein charge and conformation changed causing the dissociation of the OTA-Mab complex. Alternative solvents, HCOOH/H2O, MeOH (0-100%) and ACN (0-100%) were tested as well (see Method section of SPR biosensor) and the mixture of ACN/H2O/HCOOH (20/79/1 % v/v/v) worked out well and was preferred because of better compatibility with LC-MS. Either 25 µL or 100 µL of this dissociation solution was used in the immunomagnetic microbead isolation method.
Immunoaffinity capture efficiency and capacity
To determine the minimum amounts of immunoaffinity beads necessary to capture a reasonable amount of OTA (100 pg), the capture efficiency had to be determined. This 100 pg of OTA was chosen because it can easily be detected by the MS (LoD of 10 pg) and it corresponds with the amount of OTA in 1 mL of extract of a positive sample incurred at 1 ng g-1 level. For this experiment, 100 pg of OTA was added to different amounts of beads (1.4 x 10⁶, 7.0 x 10⁵, 3.5 x 10⁵, 1.75 x 10⁵, 8.8 x 10⁴ and 0 beads). The 0 beads were used as blank control to prove that OTA was not bound to the test tubes. The 100 pg were offered to the beads in a fixed final volume of 100 μL and incubated for 60 min at RT under mild mixing. After capturing and washing, the captured OTA was dissociated from the beads by the addition of 100 µL ACN/H2O/HCOOH (20/79/1 % v/v/v) dissociation solution of which 50 μL were injected in the LC-QqQ-MS. Figure 4 shows the amounts of OTA dissociated from the various amounts of beads.

Chapter 2
82
Figure 4. Average amounts of OTA (n=3) recovered from different amounts of beads after incubation with
100 pg OTA.
OTA was not found in the control, which proves that the Mab-coated beads are responsible for capturing OTA. To capture most of the 100 pg OTA added, at least 1.75 x 10⁵ beads were necessary. The dissociated amount of OTA decreased with lower amounts of beads (to 64 pg using 8.8 x 10⁴ beads), and the precision decreased significantly. Further, plain beads (3.8 x 10⁵), which were activated but no Mab was added, and plain beads (3.8 x 10⁵) which did not contain Mab but were blocked with BSA were tested with 100 pg OTA and no OTA was found in the dissociated fraction. This indicates that the affinity capture of OTA was Mab-specific and OTA was not captured by BSA when used as blocking agent, probably because a lower amount of BSA (0.1 mg) was used compared to Hong et al [33] who used several milligrams of BSA to capture OTA. The bead capacity was determined with a fixed amount of beads (7.0 x 10⁵) and various amounts of OTA (100, 300, 900 and 2000 pg). Figure 5 shows that the overall capturing plus dissociation efficiency was >75% when 100, 300 and 600 pg was incubated with 7.0 x 10⁵ beads. This recovery decreased to about 65% and <40% with 900 and 2000 pg of OTA, respectively. The maximum amount of OTA which could be bound to and recovered from this amount of beads under the conditions mentioned was estimated to be around 750 pg.
Incubation times and volumes
So far, an incubation time of 60 min was used (also used in the FCIA previously) and
0
20
40
60
80
100
120
140
0 8.8 E4 1.75 E5 3.5 E5 7.0 E5 1.4 E6
Am
ount
of O
TA re
cove
red
(pg)
ax
c
Amount of beads

Screening and identification of ochratoxins
83
the influence of the applied incubation time (1, 5, 30 and 60 min) on the efficiency of 7.0 x 10⁵ beads to capture 100 pg of OTA was determined in duplicate. Minor differences were observed in recovered OTA quantities (92-105 pg), which proves the possible use of a very short incubation time (1 min) for immunoaffinity isolation of OTA from samples. The influence of incubation volumes on the capture efficiency of 7.0 x 10⁵ beads was also tested, because in a real-life situation it is possible that more sample volume is required (> 100 µL) to capture the minimum amount of OTA which is detectable by the LC-MS.
0
100
200
300
400
500
600
700
800
900
100 300 600 900 2000
Amou
nt o
f OTA
reco
vere
d (p
g)
OTA addition (pg)
Figure 5. Average amounts of OTA (n=3) dissociated after the addition of different amounts of OTA to a
fixed number of beads (7.0 x 10⁵).
In this experiment, 100 µL incubation volumes containing 100 pg OTA was used as reference and 50 µL, 500 µL and 1500 µL incubation volumes were tested with an incubation time of 60 min: incubation volumes of 500 and 1500 µL gave similar results as the 100 µL incubation volume. By reducing the incubation volume to 50 µL, the overall recoveries decreased (<40%) and the precision decreased significantly. Possibly, the beads and OTA were not mixed well in 50 µL when vortexed during the incubation step. Therefore, incubation volumes of 100 µL, 500 µL and 1500 µL were considered applicable.

Chapter 2
84
Nano-LC-Q-ToF-MS-based identification of ochratoxins
The three suspect cereal samples and one positive and one blank wheat sample were subjected to the immunoaffinity isolation after which the obtained extracts were injected into the nano-LC-Q-ToF-MS system. Figures 6 shows the chromatogram and mass spectra of cereal 3 sample. Figure 6 demonstrates that OTA was found and identified in cereal 3. This means that the positive response found in the FCIA was indeed caused by OTA, as expected.
Figure 6. Chromatograms and mass spectra of cereal 3 containing OTA (A) and OTB (B).
Moreover, due to the full scan ability of the nano-LC-Q-ToF-MS system, another ochratoxin (OTB) was detected in the extract of cereal 3. The remaining cereal samples (cereal 1 and 2) were also measured. Like the cereal 3 sample, these samples contained both OTA and OTB (results not shown). The wheat sample found suspect in the FCIA screening, was measured with nano-LC-Q-ToF-MS. In agreement with the screening results and LC-QqQ-MS results, OTA was found in this sample. Furthermore, a blank wheat extract which underwent the immunomagnetic isolation method was injected onto the nano-LC-Q-ToF-MS system. In this extract no ochratoxins were found. The chemical identifications of OTA and OTB were achieved by means of accurate mass, retention time and isotopic pattern (see appendix 2.1 and 2.2).
Abu
ndan
ce
Abu
ndan
ce
Time5.00 10.00 15.00 20.00 25.00
%
0
100 15.98
Time5.00 10.00 15.00 20.00 25.00
%
0
100 15.64
m/z404 406
%0
100 404.096
406.092
m/z370 371 372
%0
100 370.135
371.134m/z
403 404 405 406 407 408 409
%
0
100 404.096
406.092405.099
m/z370 371 372
%
0
100 370.135
371.134
A
B
A
B

Screening and identification of ochratoxins
85
Conclusions
In this study, a rapid Luminex®-based immunoaffinity flow cytometric screening assay with Mab-coated superparamagnetic microbeads was developed. The screening assay proved to be suitable for screening OTA in wheat and cereal samples far below the low ML levels (3 and 5 ng g-1) and at high levels after additional dilutions (e.g. 300 ng g-1) and no false suspect or false-compliant results were obtained as confirmed by means of an in-house validated reference method based on LC-QqQ-MS. After running the screening assay, all suspect samples were subjected to the newly developed immunoaffinity isolation method for confirmation and identification purposes with nano-LC-Q-ToF-MS using the full scan accurate mass abilities and both OTA and the mycotoxin analogue OTB were identified. The ratio OTA and OTB found in the cereals (10:1) was in agreement with the literature [20]. OTB was not detected routinely by the LC-QqQ-MS reference method due to the preselected specific MRM data acquisition used. This concept demonstrates the advantages of a miniaturized biospecific-based isolation of mycotoxins to isolate known and unknown or masked analogues which may be overlooked during conventional chemical sample preparation and instrumental analysis. The results presented show the convenience of using the same bioreagents in both the screening and immunoaffinity isolation for MS confirmation and/or identification. For screening food contaminants, MS in MRM mode is widely applied [41-43]. In this concept, nano-LC-Q-ToF in full scan accurate mass mode was used for identification instead. By using nano-LC-Q-ToF, not only the consumption of costly bioreagents decreased significantly, it was also made plausible that unlike targeted MS MRM mode, full scan accurate mass MS is able to detect known and unknown contaminants in affinity purified extracts. Since the extraction procedure is bioactivity-based both known and unknown emerging food contaminants can be detected which is especially important when more generic or mixtures of antibodies are applied in future experiments.
Acknowledgements
The authors thank Dr Joerg Stroka (IRMM, Belgium) for kindly providing incurred cereal samples which were used in this research. The Dutch Ministry of Economic Affairs, Agriculture and Innovation is acknowledged for financing this research. Waters is acknowledged for the loan of a Xevo nano-electrospray QToFMS system.

Chapter 2
86
References
1. De Saeger, S., L. Sibanda, A. Desmet, and C. Van Peteghem, A collaborative study to validate novel field immunoassay kits for rapid mycotoxin detection. INT J FOOD MICROBIOL, 2002. 75(1-2): p. 135-142.
2. Lamberti, I., C. Tanzarella, I. Solinas, C. Padula, and L. Mosiello, An antibody-based microarray assay for the simultaneous detection of aflatoxin B1 and fumonisin B1. MYCOTOXIN RES, 2009. 25(4): p. 193-200.
3. Rebe Raz, S., M.G.E.G. Bremer, M. Giesbers, and W. Norde, Development of a biosensor microarray towards food screening, using imaging surface plasmon resonance. BIOSENS BIOELECTRON, 2008. 24(4): p. 552-557.
4. Faure, K., N. Delaunay, G. Alloncle, S. Cotte, and J.L. Rocca, Optimization of in-situ monolithic synthesis for immunopreconcentration in capillary. J CHROMATOGR A, 2007. 1149(2): p. 145-150.
5. Visconti, A., M. Pascale, and G. Centonze, Determination of ochratoxin A in wine by means of immunoaffinity column clean-up and high-performance liquid chromatography. J CHROMATOGR A, 1999. 864(1): p. 89-101.
6. Shigekuni Noba, U., A. Uyama, and N. Mochizuki, Determination of ochratoxin a in ready-to-drink coffee by lmmunoaffinity cleanup and liquid chromatography-tandem mass spectrometry. J AGRIC FOOD CHEM, 2009. 57(14): p. 6036-6040.
7. Bonel, L., J.C. Vidal, P. Duato, and J.R. Castillo, Ochratoxin A nanostructured electrochemical immunosensors based on polyclonal antibodies and gold nanoparticles coupled to the antigen. ANAL METHODS, 2010. 2(4): p. 335-341.
8. Implementing Council Directive 96/23/EC concerning the performance of analytical methods and the interpretation of results (2002/657/EC). OFF J EUR COMMUNITIES L221, 2002: p. 3-8.
9. de Keizer, W., M.E. Bienenmann-Ploum, A.A. Bergwerff, and W. Haasnoot, Flow cytometric immunoassay for sulfonamides in raw milk. ANAL CHIM ACTA, 2008. 620(1-2): p. 142-149.
10. Marchesini, G.R., E. Meulenberg, W. Haasnoot, M. Mizuguchi, and H. Irth, Biosensor recognition of thyroid-disrupting chemicals using transport proteins. ANAL CHEM, 2006. 78(4): p. 1107-1114.
11. Bovee, T.F.H., G. Bor, I. Becue, F.E.J. Daamen, M.B.M. van Duursen, S. Lehmann, G. Vollmer, R. De Maria, J.E. Fox, H. Witters, S. Bernhoft, K.W. Schramm, R.L.A.P. Hoogenboom, and M.W.F. Nielen, Inter-laboratory comparison of a yeast bioassay for the determination of estrogenic activity in biological samples. ANAL CHIM ACTA, 2009. 637(1-2): p. 265-272.
12. Saiyed, Z.M., S.D. Telang, and C.N. Ramchand, Application of magnetic techniques in the field of drug discovery and biomedicine. BIOMAGN RES

Screening and identification of ochratoxins
87
TECH, 2003. 1: p. 1-8.13. Dunbar, S.A., Applications of Luminex® xMAPTM technology for rapid, high-
throughput multiplexed nucleic acid detection. CLIN CHIM ACTA, 2006. 363(1-2): p. 71-82.
14. Liu, N., P. Su, Z. Gao, M. Zhu, Z. Yang, X. Pan, Y. Fang, and F. Chao, Simultaneous detection for three kinds of veterinary drugs: Chloramphenicol, clenbuterol and 17-beta-estradiol by high-throughput suspension array technology. ANAL CHIM ACTA, 2009. 632(1): p. 128-134.
15. Haasnoot, W. and J.G. Du Pré, Luminex-based triplex immunoassay for the simultaneous detection of soy, pea, and soluble wheat proteins in milk powder. J AGRIC FOOD CHEM, 2007. 55(10): p. 3771-3777.
16. Kim, J.S., C.R. Taitt, F.S. Ligler, and G.P. Anderson, Multiplexed magnetic microsphere immunoassays for detection of pathogens in foods. SENSING & INSTRUMENTATION FOR FOOD QUALITY & SAFETY, 2010. 4(2): p. 73-81.
17. Peters, J., M. Bienenmann-Ploum, T. de Rijk, and W. Haasnoot, Development of a multiplex flow cytometric microsphere immunoassay for mycotoxins and evaluation of its application in feed. MYCOTOXIN RES, 2011 , 27(1): p. 63–72
18. Meimaridou, A., W. Haasnoot, L. Noteboom, D. Mintzas, J. Pulkrabova, J. Hajslová, and M.W.F. Nielen, Color encoded microbeads-based flow cytometric immunoassay for polycyclic aromatic hydrocarbons in food. ANAL CHIM ACTA, 2010. 672(1-2): p. 9-14.
19. Ringot, D., A. Chango, Y.J. Schneider, and Y. Larondelle, Toxicokinetics and toxicodynamics of ochratoxin A, an update. CHEM BIOL INTERACT. 2006. 159(1): p. 18-46.
20. Nielsen, K.F., J.M. Mogensen, M. Johansen, T.O. Larsen, and J.C. Frisvad, Review of secondary metabolites and mycotoxins from the Aspergillus niger group. ANAL BIOANAL CHEM, 2009. 395(5): p. 1225-1242.
21. Ventura, M., C. Vallejos, I.A. Anaya, F. Broto-Puig, M. Agut, and L. Comellas, Analysis of Ochratoxin A in Coffee by Solid-Phase Cleanup and Narrow-Bore Liquid Chromatography-Fluorescence Detector-Mass Spectrometry. J AGRIC FOOD CHEM, 2003. 51(26): p. 7564-7567.
22. Hernández, M.J., M.V. García-Moreno, E. Durán, D. Guillén, and C.G. Barroso, Validation of two analytical methods for the determination of ochratoxin A by reversed-phased high-performance liquid chromatography coupled to fluorescence detection in musts and sweet wines from Andalusia. ANAL CHIM ACTA, 2006. 566(1): p. 117-121.
23. Commission Regulation 1881/2006/EC of 19 December 2006, setting maximum levels for certain contaminants in foodstuff. OFF. J. EUR. UNION,

Chapter 2
88
2006. L364: p. 5-23.24. Commission Recommendation 2006/576/EC of 17 August 2006 on the
presence of deoxynivalenol, zearalenone, ochratoxin A, T-2 and HT-2 and fumonisins in products intended for animal feeding. OFF. J. EUR. UNION, 2006. L229: p. 7-9.
25. Entwisle, A.C., A.C. Williams, P.J. Mann, P.T. Slack, J. Gilbert, P. Burdaspal, E. Eklund, J. Gardikis, B. Hald, M.P. Herry, Jørgensen, K., H. Kandler, R. Maas, M.L. Martins, S. Patel, M. Schuster, M. Solfrizzo, E. Strassmeir, R. Tiebach, and T. Trogersen, Liquid chromatographic method with immunoaffinity column cleanup for determination of ochratoxin A in barley: Collaborative study. J AOAC INT, 2000. 83(6): p. 1377-1386.
26. Visconti, A., M. Pascale, and G. Centonze, Determination of ochratoxin A in wine and beer by immunoaffinity column cleanup and liquid chromatographic analysis with fluorometric detection: Collaborative study. J AOAC INT, 2001. 84(6): p. 1818-1827.
27. Noba, S., A. Uyama, and N. Mochizuki, Determination of ochratoxin a in ready-to-drink coffee by lmmunoaffinity cleanup and liquid chromatography-tandem mass spectrometry. J AGRIC FOOD CHEM, 2009. 57(14): p. 6036-6040.
28. Chen, H.X., J.M. Busnel, A.L. Gassner, G. Peltre, X.X. Zhang, and H.H. Girault, Capillary electrophoresis immunoassay using magnetic beads. ELECTROPHORESIS, 2008. 29(16 SPEC. ISS.): p. 3414-3421.
29. Wang, Z., X. Liu, E. Garduño, R.A. Garduño, J. Li, and E. Altman, Application of an immunoaffinity-based preconcentration method for mass spectrometric analysis of the O-chain polysaccharide of Aeromonas salmonicida from in vitro- and in vivo-grown cells. FEMS MICROBIOL LETT, 2009. 295(2): p. 148-155.
30. Jonker, N., A. Kretschmer, J. Kool, A. Fernandez, D. Kloos, J.G. Krabbe, H. Lingeman, and H. Irth, Online magnetic bead dynamic protein-affinity selection coupled to LC-MS for the screening of pharmacologically active compounds. ANAL CHEM, 2009. 81(11): p. 4263-4270.
31. Gao, X., W. Liu, Q. Yang, B. Liu, L. Cai, J. Li, Z. Zhu, M. Xiang, and M. Yan, Proteomic Profiling of Gastric Cancer in Serum Using Magnetic Bead Based Sample Fractionation and MALDI-TOF-MS. CHIN J CLIN ONCOL 2010. 37(16): p. 933-936.
32. Kawamura, O., S. Sato, H. Kajii, S. Nagayama, K. Ohtani, J. Chiba, and Y. Ueno, A sensitive enzyme-linked immunosorbent assay of ochratoxin A based on monoclonal antibodies. TOXICON, 1989. 27(8): p. 887-897.
33. Hong, C.-Y. and Y.-C. Chen, Selective enrichment of ochratoxin A using human serum albumin bound magnetic beads as the concentrating probes

Screening and identification of ochratoxins
89
for capillary electrophoresis/electrospray ionization-mass spectrometric analysis. J CHROMATOGR A, 2007. 1159(1-2): p. 250-255.
34. Smith, P.K., R.I. Krohn, and G.T. Hermanson, Measurement of protein using bicinchoninic acid. ANAL BIOCHEM., 1985. 150(1): p. 76-85.
35. Kim, S., H.B. Pyo, S.H. Ko, C.S. Ah, A. Kim, and W.J. Kim, Fabrication of anionic sulfate-functionalized nanoparticles as an immunosensor by protein immobilization. LANGMUIR, 2010. 26(10): p. 7355-7364.
36. Desjardins, P., J.B. Hansen, and M. Allen, Microvolume protein concentration determination using the NanoDrop 2000c spectrophotometer. JoVE, 2009(33).
37. Fountoulakis, M., J.-F. Juranville, and M. Manneberg, Comparison of the Coomassie brilliant blue, bicinchoninic acid and Lowry quantitation assays, using non-glycosylated and glycosylated proteins. J BIOCHEM BIOPH METH, 1994. 24(3-4): p. 265-274.
38. Barna-Vetró, I., L. Solti, J. Téren, Á. Gyöngyösi, E. Szabó, and A. Wölfling, Sensitive ELISA Test for Determination of Ochratoxin A. J AGRIC FOOD CHEM 1996. 44(12): p. 4071-4074.
39. Radoi, A., L. Dumitru, L. Barthelmebs, and J.L. Marty, Ochratoxin a in some French wines: Application of a direct competitive ELISA based on an OTA-HRP conjugate. ANAL LETT 2009. 42(8): p. 1187-1202.
40. Goryacheva, I.Y., S. De Saeger, I.S. Nesterenko, S.A. Eremin, and C. Van Peteghem, Rapid all-in-one three-step immunoassay for non-instrumental detection of ochratoxin A in high-coloured herbs and spices. TALANTA, 2007. 72(3): p. 1230-1234.
41. Krska, R., E. Welzig, and H. Boudra, Analysis of Fusarium toxins in feed. ANIM FEED SCI TECH, 2007. 137(3-4): p. 241-264.
42. Payá, P., M. Anastassiades, D. MacK, I. Sigalova, B. Tasdelen, J. Oliva, and A. Barba, Analysis of pesticide residues using the Quick Easy Cheap Effective Rugged and Safe (QuEChERS) pesticide multiresidue method in combination with gas and liquid chromatography and tandem mass spectrometric detection. ANAL BIOANAL CHEM, 2007. 389(6): p. 1697-1714.
43. di Mavungu, J.D., S. Monbaliu, M.L. Scippo, G. Maghuin-Rogister, Y.J. Schneider, Y. Larondelle, A. Callebaut, J. Robbens, C. van Peteghem, and S. de Saeger, LC-MS/MS multi-analyte method for mycotoxin determination in food supplements. FOOD ADDIT CONTAM A, 2009. 26(6): p. 885-895.

Chapter 2
90
Appendix 2.1
Measured retention time and mass error of OTA in 1 ng mL-1 standard and cereal sample.
Theoretical Measurement tR Experimental Mass error Elemental composition*
[M+H]+ (min) [M+H]+ (ppm) [M+H]+
404.0901 standard 15.98 404.0966 -16 C20H19ClNO6
406.0881 (37Cl) 406.0937 -16sample 15.98 404.0958 -14 C20H19ClNO6
406.0924 -11
* OTA was identified on the basis of measured accurate mass and isotopic patterns using the following elemental composition limits: C 1-22, H 1-22, N 1-5, O 1-9 and Cl 1. OTA was the first realistic option within calculated results with reasonable double bond equivalents.
Appendix 2.2
Measured retention time and mass error of OTB in 1 ng mL-1 standard and cereal sample.
Theoretical Measurement tR Experimental Mass error Elemental composition*
[M+H]+ (min) [M+H]+ (ppm) [M+H]+
370.1291 Standard 15.60 370.1350 -16 C20H20NO6
Sample 15.60 370.1351 -16 C20H20NO6
* OTB was identified on the basis of measured accurate mass and isotopic patterns using the following elemental composition limits: C 1-22, H 1-22, N 1-5, O 1-9. OTB was the first realistic option within calculated results with reasonable double bond equivalents.

3Triple bioaffinity mass spectrometry concept for thyroid
transporter ligands
Aqai, P., C. Fryganas, M. Mizuguchi, W. Haasnoot, and M.W.F. Nielen, Analytical Chemistry, 2012. 84 (15): p. 6488-6493

Chapter 3
92
Abstract
For the analysis of thyroid transporter ligands, a triple bioaffinity mass spectrometry (BioMS) concept was developed aiming at three different analytical objectives: rapid screening of any ligand, confirmation of known ligands in accordance with legislative requirements and identification of emerging yet unknown ligands. These three purposes share the same bio-recognition element, recombinant thyroid transport protein transthyretin (rTTR), and dedicated modes of liquid chromatography-mass spectrometry (LC-MS). For screening, a rapid and radiolabel-free competitive inhibition MS binding assay was developed with fast ultra-high-performance-LC-electrospray ionization-triple-quadrupole-MS (UPLC-QqQ-MS) as readout system. It uses the non-radioactive stable isotopic thyroid hormone 13C6-L-thyroxine as label of which the binding to rTTR is inhibited by any ligand such as thyroid drugs and thyroid endocrine disrupting chemicals (EDCs). To this end, rTTR is either used in solution or immobilized on paramagnetic microbeads. The concentration-dependent inhibition of the label by the natural thyroid hormone L-thyroxine (T4), as a model analyte, is demonstrated in water at part-per-trillion and in urine at part-per-billion level. For confirmation of identity of known ligands, rTTR was used for bioaffinity purification for confirmation of naturally present free T4 in urine. As a demonstrator for identification of unknown ligands, the same rTTR was used again, but in combination with nano-UPLC–quadrupole time-of-flight–MS (nano-UPLC-Q-ToF-MS) and urine samples spiked with the model ‘unknown’ EDCs triclosan and tetrabromobisphenol-A. This study highlights the potential of BioMS using one affinity system, both for rapid screening as well as for confirmation and identification of known and unknown emerging thyroid EDCs.

Screening and identification of EDCs
93
Introduction
L-thyroxine (T4) is a hormone produced by the thyroid gland. In the bloodstream, 99% of T4 is bound to carrier proteins such as thyroxine binding globulin (TBG), transthyretin (TTR) and human serum albumin. T4 plays an important role in many physiological processes, such as embryonic development, cell differentiation, metabolism and the regulation of cell proliferation [1, 2]. Patients who suffer from lack of T4 are recommended to use T4 to obtain normal plasma concentrations. Although the measured environmental concentration of T4 is only 19 ng L-1 in waste water, it has been classified as a potential waste water contaminant with remarkably high biological activity [3]. Endocrine disrupting chemicals (EDCs) are exogenous substances that alter functions of the endocrine system and consequently cause adverse health effects in an organism. It has been proven that EDCs have the capacity to compete and inhibit natural thyroid hormones such as T4 in thyroid transport protein-hormone complexes [4]. For example, the abundantly produced flame retardant tetrabromobisphenol-A (TBBPA) is reported to have a binding affinity equal to or higher than T4 to TTR [5-7]. Triclosan is a broad spectrum antimicrobial used widely in e.g. disinfectants, soap, toothpaste and shampoo [8], but also reported to be an EDC that competes with thyroid hormones for TTR [5]. Calafat et al. described triclosan levels between 2.4 and 3800 µg L-1 in nearly 75% of urine samples collected from US National Health and Nutrition Examination Survey who were subjects ≥ 6 years old [9]. For the detection of hazardous compounds in the environment, such as EDCs, many analytical methods have been developed [10-18]. In general analysis techniques for EDCs in environmental samples are based on gas chromatography-mass spectrometry (GC-MS) or liquid chromatography-mass spectrometry (LC-MS). The LoDs of these methods are typically at the low nM levels [18-20]. These methods are low-throughput due to long run-time, data processing time and time-consuming sample treatment procedures such as pressurized liquid extraction, liquid-liquid extraction, solid phase extraction (SPE) and soxhlet extraction and more important, they do not provide information about bioactivity. In contrast, for the monitoring of T4 in environmental samples, such as water, only a few analytical methods have been described. Svanvelt et al. developed a sensitive LC-electrospray ionization-triple-quadrupole-MS (LC-ESI-QqQ-MS) method having an LoD of 1-10 ng L-1 [21]. Next to chemical analysis, in vitro bioaffinity screening assays have been developed for EDCs based on binding with TTR in competition with radiolabeled T4 and yielding IC50 values for specific flame retardants in the range of 60-90 nM. However, the use of a radiolabel is a serious disadvantage in binding assays, besides the methods described did not focus on screening of real samples but just on the determination of binding affinities of EDCs towards TTR [7, 22-24]. A label-free surface plasmon resonance (SPR)-based method was published by Marchesini et al. using T4 and TTR to determine binding affinities of EDCs (IC50 10 nM for T4) [25]. Although this

Chapter 3
94
method is sensitive and label-free, complex sample materials were not tested so the robustness of that method is yet unknown and no coupling with MS for confirmation and identification was described. Bioaffinity-based extraction procedures using e.g. antibodies [26] or receptors [27] in combination with MS are of particular interest since they might pinpoint the occurrence of emerging yet unidentified but highly relevant EDCs. Previously, several on-line bioaffinity MS methods were described for protein-affinity selection [28], drug discovery [29] or screening combinatorial libraries [30] using either filter units or beads. However, in continuous flow formats, binding assay buffer salts and surfactants can cause serious ion suppression and/or must be removed prior to MS detection. De Vlieger et al. developed an on-line dual post-column receptor affinity assay based on parallel detection by MS (LoD 40 nM) and fluorescence (LoD 4.7 nM) for quantification and identification purposes of estrogenic compounds [31]. However, in order not to decrease receptor activity by the LC mobile phase gradient, a make-up gradient had to be added in order to dilute the organic solvent content. Niessen et al. developed an off-line competitive MS binding assay for determining the binding affinity of dopamine receptor ligands by using spiperone as a marker [32]. That binding assay was presented as a possible alternative to radiolabeled assays, however, since only the unbound fraction of the marker was measured, at best indirect information was obtained about the bound ligands. Moreover, because of the use of a non-volatile buffer an additional SPE step was required prior to LC-MS. Zepperitz et al. described a competitive MS binding assay in which the γ-aminobutyric acid (GABA) transporter-bound fraction of the marker was measured after elution with methanol, but that format was used for kinetic measurements in buffer only and no screening in real samples was performed [33]. In the present work, a triple bioaffinity MS (BioMS) concept is presented in which recombinant TTR (rTTR) and MS are used for different analytical objectives, i.e. rapid screening, confirmation and identification. First, a rapid and easy to use radiolabel-free competitive MS binding assay has been developed (in two different formats) in which a stable isotope of a model analyte (13C6-T4) was used as label to screen indirectly for the presence of any EDC having an affinity towards rTTR. Following incubation, wash and dissociation steps, only the isotope-labeled competitor was measured by means of an ultrafast, sensitive and selective ultra-high performance-liquid chromatography-electrospray ionization-triple-quadrupole-MS (UPLC-QqQ-MS) system, operating in a dedicated single reaction monitoring mode (SRM). The amount of measured label is indicative for the amount and affinity of rTTR-active compounds in the sample. Second, for legislative confirmatory analysis requirements of known ligands, the same rTTR biorecognition element was used in a bioaffinity isolation procedure in combination with UPLC-QqQ-MS but operating in a multiple reaction monitoring mode (MRM). Third, for identification of any unknown ligands having rTTR bioaffinity, the same rTTR biorecognition element was used in a

Screening and identification of EDCs
95
bioaffinity isolation procedure in combination with UPLC-Q-TOF-MS operating in the high resolution full-scan accurate mass mode, and having the EDCs triclosan and TBBPA as model unknown substances. See Figure 1 for a schematic overview of the three different BioMS applications.
Figure 1. Schematic presentation of the steps involved in the three different BioMS applications in which
X is (are) the active compound(s) in the sample, ? is (are) the unknown active compound(s), 13C6-T4 is
the label used in the screening only and rTTR is the applied biomolecule. The main differences between
the three applications are the analytes, the MS detection in either SRM, MRM and using time-of-flight-MS
in full scan mode. The screening approach will result in the identification of negative samples or samples
containing compounds with bioaffinity towards rTTR. The confirmation approach is used only to legislative
confirmatory analysis of known bioactive compounds and the identification approach is used to identify
known and unknown rTTR ligands.
Materials and Methods
Materials
T4, triiodo-L-thyronine (T3), TBBPA and triclosan were purchased from Sigma Aldrich Chemie (Zwijndrecht, The Netherlands) and had purities above 95%. 13C6-T4 of 90% purity (no T4 present) was supplied by Cambridge Isotope Laboratories Inc. (Andover, MA, USA) while the His-tagged rTTR was produced and kindly offered by

Chapter 3
96
the Toyama Medical and Pharmaceutical University (Toyama, Japan) [34]. Formic acid (HCOOH), sodium dihydrogen phosphate (NaH2PO4), tri-sodium phosphate (Na3PO4), ethanol (EtOH), sodium chloride (NaCl), acetyl chloride (CH3COCl), sodium azide (NaN3), imidazole and ethylenediaminotetra acetic acid (EDTA) were all purchased from Merck (Darmstadt, Germany). HPLC grade methanol (MeOH) was provided by Biosolve (Valkenswaards, The Netherlands) and water purification was performed using a Milli-Q system (Milipore, Bedford, MA, USA). Microcon Ultracel YM-30 UF units were also from Milipore. Nanosep 30K Omega UF units were from Pall Corporation (Port Washington, NY, USA) and VectaSpin Micro 20K UF units from Whatman International (Maidstone, England). Protein LoBind tubes (0.5 and 1.5 mL) were purchased from Eppendorf AG (Hamburg, Germany). SiMAG-Carboxyl (product number 1402-1, 1 µm diameter) beads were supplied by Chemicell GmbH (Berlin, Germany). The N-hydroxysulfosuccinimide sodium salt (sulfo-NHS) was purchased from Fluka Analytical (Buchs, Germany) while, the 2-(N-Morpholino)ethanesulfonic acid (MES) and N-(3-dimethylaminopropyl)-N-ethylcarbodiimide hydrochloride (EDC) were from Sigma Aldrich Chemie. The BCA reagents were provided with the BCATM Protein Assay Kit from Pierce (Rockford, IL, USA). OASIS® HLB 6 mL cartridges with 200 mg sorbent were purchased from Waters (Milford, MA, USA) and 1 mL Empore C18-SD cartridges were from 3M (Zoeterwoude, The Netherlands). The instruments used in this study are described in appendix 3.1.
Methods
BioMS binding assay using 13C6-T4 as competing label and UPLC-QqQ-MS as a readout system
The competitive inhibition BioMS screening assay was performed both with dissolved rTTR, using UF units, and with immobilized rTTR, using superparamagnetic beads. UF method. The competitive inhibition BioMS assay consisted of the following steps. First, 0.25 µg of rTTR in 100 µL of assay buffer (10 mM phosphate buffer pH 8.5) was added to the UF unit and a centrifugation step was performed at 11,000 g for 10 min at room temperature (RT). Subsequently, the label (13C6-T4) was mixed with the standard or sample and this mixture was added to the UF unit. To construct 0-1000 ng dose-response curves, 750 pg of the label in 90 µL assay buffer was mixed with 10 µL of T4 solutions in 100% MeOH with concentrations from 0 to 100 ng µL-1. Dose-response curves were fitted using the five parameter curve fitting in the GraphPad Prism software of GraphPad Software Inc. (La Jolla, CA, USA). To screen urine sample, 750 pg of the label in 100 µL assay buffer/MeOH (9:1, v/v) was mixed with 50 µL 2 times diluted urine (in assay buffer). To screen water samples, 750 pg of 13C6-T4 in 10 µL assay buffer/MeOH (9:1, v/v) was mixed with 250 µL of 2000 times concentrated water extract. The incubation with rTTR was 15 min at RT under gentle

Screening and identification of EDCs
97
vortexing. A centrifuge step of 10 min was performed in order to remove the unbound 13C6-T4 and T4 by discarding the filtrate. To wash the retentate, 100 μL of washing buffer (assay buffer/MeOH, 9:1, v/v) was added. After two subsequent washing steps, the rTTR complex was resuspended in the UF unit by 100 µL dissociation solution (H2O/MeOH/HCOOH, 49/50/1 %, v/v/v). This dissociation step was performed by vortexing the UF unit for 15 min and a centrifuge step of 10 min was performed to collect the dissociated label plus competing analytes in the filtrate. This filtrate was then transferred to an autosampler vial and injected into the UPLC-QqQ-MS system for screening purposes. The total duration of this bioaffinity purification procedure was 80 min; note that in routine settings, many samples can be handled in parallel within the same time frame.Superparamagnetic beads method. The same protocol as used for the UF units was followed with minor modifications. Instead of using rTTR in solution, 1 µL of rTTR-coated beads were used and the centrifuge step was replaced by a 1 min magnetizing step (the protocols for preparation of rTTR-coated microbeads and determining its immobilization efficiency are described in appendix 3.2). The total length of this procedure was 35 min (approximately twice as fast as with the UF units).
T4 extraction from process water
T4 was extracted and concentrated from process water by applying two consecutive SPE procedures. The first SPE procedure used was based on the protocol described by Svanfelt et al. [21] with minor modifications. In short, first, the pH of 1 L of process water sample was adjusted to pH 2.5 using a few drops of 5 M HCl. The OASIS® HLB SPE cartridges were preconditioned with 6 mL of MeOH followed by 6 mL of acidified distilled water (pH 2.5). The extraction of T4 from 1 L process water was carried out at an approximate flow rate of 5–10 mL min-1. After drying the cartridges by applying vacuum, the analyte was eluted with 4×1 mL of MeOH. This SPE step proved to have >90% T4 recovery. Evaporating the eluate decreased the T4 recovery (<25%). In order to omit this evaporation step, a second SPE procedure was performed in order to concentrate T4 without evaporation using 1 mL Empore C18-SD SPE cartridges. These cartridges were preconditioned with 1 mL of MeOH followed by 1 mL of acidified distilled water (pH 2.5). To the 4 mL eluate from the OASIS® cartridge, 16 mL of acidified distilled water (pH 2.5) was added (in order to reduce the solvent strength) and then this mixture was loaded onto a Empore C18-SD SPE cartridge. After drying the cartridge by applying vacuum, the analytes were eluted with 150 µL of MeOH. Finally, 350 µL of assay buffer was added to the eluate and mixed by vortexing. The second SPE step proved to have 60% T4 recovery. Most likely, this was caused by the relatively high volume (20 mL) which was loaded onto this 1 mL cartridge.

Chapter 3
98
BioMS confirmatory analysis of known rTTR ligands following bioaffinity purification of urine samples
Urine samples from a male hypothyroid patient and a healthy male volunteer were analyzed for T4. First, 100 µg of rTTR was pipetted into a UF unit and concentrated by centrifuging at 11,000 g for 10 min at RT for extraction purposes of T4 from the healthy male volunteer’s urine. A volume of 250 µL of urine was diluted in 250 µL assay buffer and this mixture (500 µL) was added to the rTTR-containing UF unit. The subsequent incubation, wash and dissociation steps were performed as described in the “BioMS binding assay” protocol and the final extract was injected into the UPLC-QqQ-MS system. For quantitative reference analysis of T4 in urine, the described SPE procedure for process water was used with slight modifications; instead of one liter of water, 6 mL of urine (pH 2.5) was applied to preconditioned SPE cartridge and the second SPE procedure was omitted.
BioMS identification of unknown EDCs following bioaffinity purification and nano-UPLC-Q-ToF-MS
Urine samples (500 µL) were spiked with either TBBPA at 1.2 ng mL-1 or with triclosan at 1000 ng mL-1. The spiked urines were added to UF units each containing 10 µg of rTTR. Note that for identification, ten times less rTTR was needed than in confirmatory analysis due to the high spike level of triclosan and the high affinity of TBBPA towards rTTR. The subsequent incubation and wash steps were performed as described in the “BioMS binding assay” protocol. The dissociation step, however, was modified because the acidic dissociation step proved not to be sufficient to dissociate and dissolve triclosan and TBBPA. Two subsequent dissociation steps were performed with 50 µL MeOH/NH4OH (1:1) and 50 µL H2O/MeOH/HCOOH (49/50/1 %, v/v/v). Both dissociation filtrates were collected after two subsequent centrifuge steps (11,000 g for 10 min at RT) and mixed. Finally, 100 µL of H2O/HCOOH (1:1) was added to the eluate mixture to lower the pH to acidic and the MeOH content to 25%. The final extract was injected into the nano-UPLC–quadrupole time-of-flight–MS (nano-UPLC-Q-ToF-MS) for identification purposes.
Results and discussion
BioMS binding assay
During the development of this screening assay, various parameters were optimized. At first, as it influenced the sensitivity of the BioMS screening, the minimum amount of added label necessary for a robust UPLC-QqQ-MS quantification in the SRM mode (m/z 783.7 à m/z 737.7) was determined as 750 pg. In assay buffer and in

Screening and identification of EDCs
99
dissociation solution this and less recovered amounts of the label could easily be detected having a LoD of 25 pg. For the dissociation of the bound label in a small volume of 100 µL of an LC-MS compatible acidified MeOH/H2O mixture (H2O/MeOH/HCOOH, 49/50/1 % v/v/v) was chosen (see appendix 3.3 for optimization details). Typical UPLC-QqQ-MS reconstructed chromatograms of the 13C6-T4 label recovered from rTTR-coated beads are displayed in Figure 2 and illustrate the fast analysis with a total run time of 2 min. In this study, two assay formats ultrafiltration (UF) units and superparamagnetic microbeads were critically compared. Because of observed non-specific binding of the label, several UF units and 96-well filter plates (for high-throughput screening purposes) from different manufacturers (see “Materials” section) were tested for non-specific binding. The filter plates displayed the highest amount of non-specific binding (nearly 100%) and therefore, high-throughput well plate screening with rTTR in solution was not feasible. The Microcon Ultracel YM-30 UF units were selected for this study, because they showed the lowest amount of non-specific binding. Next, the influence of the amount of rTTR on the UPLC-QqQ-MS measured recovery of the added label was determined (see Figure 3).
Figure 2. Reconstructed UPLC-QqQ-MS single reaction monitoring (SRM) chromatograms showing the
peak areas and retention times of the label (13C6-T4) recovered from rTTR-coated beads in the absence
(A) and in the presence of 1 ng of the competing model ligand T4 (B).
Time0.60 0.80 1.00 1.20 1.40 1.60 1.80
%
0
100
0.60 0.80 1.00 1.20 1.40 1.60 1.80
%
0
1001.262077
1.251213
Time (min)
Abu
ndan
ce
Abu
ndan
ce
783.7→737.7
783.7→737.7
A
B

Chapter 3
100
For this experiment, 750 pg of the label in absence of any competitor was added to different amounts of rTTR in UF units. The 0 µg rTTR was used as blank control to prove that the label did not bind to the test tubes. Only a very low amount of the label (<LoD) was found in the control, which proved that rTTR was responsible for capturing the label. The absolute recovered amount of label decreased with decreasing amounts of rTTR (from 532 pg using 10 µg rTTR to 230 pg using 0.25 µg rTTR). Similar results were observed when T4 in the absence of the label was added to rTTR, showing the expected similar affinity of rTTR for the label (13C6-T4) and for T4. The influence of the amount of rTTR on the label recovery was also tested using rTTR-coated beads. In this experiment 0-0.1-1-5-10 µL of beads (corresponding with 0-0.01-0.1-0.5-1 µg of rTTR, respectively) were used to capture 750 pg of the label and similar increasing label recoveries were obtained with increasing amounts of beads (data not shown).
Figure 3. Average amounts (n=2) of with UPLC-QqQ-MS measured 13C6-T4 label recovered from different
amounts of rTTR in the UF unit after incubation with 750 pg of label.
The detailed optimization experiments of the BioMS screening are described in appendix 3.3. It is important to note that by using beads, high-throughput screening in conventional 96-well plate format in combination with an automated magnetic wash device will be feasible. With the BioMS screening assay in UF units, dose-response curves were constructed for T4 in buffer, urine and concentrated process water with sensitivities at 50% inhibiting concentration (IC50) of 0.8 ng (8 ng mL-1 buffer), 7 ng (280 ng mL-1 urine) and 7 ng (14 pg mL-1 process water) respectively, and all curves illustrate good precision of the method (see Figure 4A). Although similar IC50s were obtained in the dose-response curves prepared in urine and process water, both
0
100
200
300
400
500
600
0 0,25 0,5 1 10
13C
6-T4
reco
very
(pg)
rTTR (µg)

Screening and identification of EDCs
101
curves display clearly the influence of matrix when compared to the curves in buffer. Figure 4B demonstrates the results when beads are used and a similar sensitivity was obtained in buffer (IC50 of 1 ng or 10 ng mL-1 buffer) but in urine (IC50 of 1 ng or 40 ng mL-1 urine) and concentrated process water extract (IC50 of 4 ng or 8 pg mL-1 process water) slightly higher sensitivities were achieved. Note that in all displayed dose-response curves, the maximum absolute recovery of the label varied between 100-230 pg depending on the matrix. The IC50 values under buffer conditions indicate that indeed a concentration step is required in order to be able to screen EDCs at the part-per-trillion level in the aquatic environment. The BioMS screening in the two formats showed similar sensitivities versus the label-free SPR-based method (10 nM) [25], but is more sensitive than the post-column bioaffinity MS (40 nM) [31] and radiolabeled assay (61-88 nM) [7, 22, 23]. Note that the targeted LC-ESI-QqQ-MS method of Svanfelt et al. is more sensitive, but no information on the biological relevance of the measured compounds was obtained in that method [21].
BioMS screening of model ligand T4 in process water at ng L-1 level
For screening purposes at the ppt level, one liter of process water was spiked with 50 ng L-1 of T4, which is close to the concentration of T4 found in surface water of 19 ng L-1 [3, 21]. This sample was subjected to the SPE procedures as described in the “Methods” section. Two thousand times concentrated extract was screened in the BioMS assay with UF units and beads and the results showed in both formats (31% and 45% respectively) a higher inhibition with the spiked sample compared to the blank water extract.
BioMS screening of endogenous ligand T4 in urine at ng mL-1 level
In order to broaden the scope of the study and to test the robustness of the developed competitive inhibition BioMS assay, two different urine samples were subjected to the two screening assay formats. The urine of two male volunteers was collected and screened after diluting the urine sample twice. In both formats, the label was inhibited more (recovery 134±15 pg, n=2) by the urine from the healthy subject compared to the urine from the hypothyroid patient (recovery 205±10 pg, n=2). To support these results, both urines were measured with a classical chemical method using an SPE step and UPLC-QqQ-MS method for T4. In the urine extract of the hypothyroid patient, no T4 was detected while T4 was indeed detected in the urine extract of the euthyroid subject. This suggests that the difference in recovery of the label was caused by T4 and probably not by matrix compounds. Additionally, both urine extracts were spiked with 25 ng of T4 and screened again with the competitive BioMS assay. The recovery of label decreased to 50 pg in both urine samples again indicating that the difference in label levels in both urine samples was T4-related.

Chapter 3
102
Figure 4A. Normalized average dose-response curves (n=2) of T4 in buffer (x), in urine matrix (♦) and in
concentrated process water extract (●) obtained by the BioMS screening assay using UF units.
Figure 4B. Normalized average dose-response curves (n=2) of T4 in buffer (x), in urine matrix (♦) and in
concentrated process water extract (●) obtained by the BioMS screening assay using superparamagnetic
beads.
BioMS confirmatory analysis of known rTTR ligands
For confirmatory analysis of known rTTR ligands the endogenous agonist T4 in urine was chosen as a demonstrator and Commission Decision 2002/657/EC [35] as regulatory requirements. A urine sample of an euthyroid volunteer was subjected to the rTTR bioaffinity isolation procedure as described in the “Methods” section. The extract was injected into UPLC-QqQ-MS operated in the MRM mode for confirmatory
0.1 1 10 100 10000
100
IC50
T4 (ng)
13C
6-T4
bin
ding
(%)
0.1 1 10 100 10000
100
IC50
T4 (ng)
13C
6-T4
bin
ding
(%)

Screening and identification of EDCs
103
analysis of T4 on the basis of the identification point concept from 2002/657/EC. By means of two measured MRM transitions (m/z 777 à m/z 731 and m/z 777 m/z 633), the ion ratios obtained for T4 in the urine extract and in standard solutions were calculated as 13.9±0.1% and 13.2±0.1%, respectively, and well within the permitted range (±30%) as described in the regulation. All retention times were 1.23 min and within the tolerances set by the regulation; as a result the identity of the compound in urine was successfully confirmed. The level of naturally present T4 in urine was estimated at 1.1 ng mL-1 which is very close to the expected value of 0.9 ng mL-1
(based on 1.41 µg/day, and assuming 1.5 L urinary excretion/day) [21]. Compared to the BioMS screening method presented above, simply 400 times more rTTR was used to isolate the T4 from the complex urine matrix.
BioMS identification of unknown EDCs having bioaffinity for rTTR by nano-UPLC-Q-ToF-MS
Urine samples were spiked separately with two model EDCs, triclosan (1000 ng mL-
1) and TBBPA (1.2 ng mL-1). Schauer et al. demonstrated that when 0.1 mg/kg/bw TBBPA is administrated orally to humans, around 0.9 ng mL-1 TBBPA-glucuronide can be found in urine [36]. The TBBPA spike level in the present experiment is in the same range and therefore considered realistic. The samples were subjected to rTTR bioaffinity isolation and the obtained extracts were injected into the nano-UPLC-Q-ToF-MS for identification purposes. On basis of accurate mass, retention time and elemental composition both triclosan and TBBPA were found and identified in the urine sample at these relevant levels (see appendix 3.5). The chromatograms and spectra of triclosan and TBBPA urine samples are given in appendix 3.6. See appendix 3.4 also for the identification of T4 in process water.

Chapter 3
104
Conclusions
In this study, a triple BioMS concept is presented in which rapid bioaffinity-based MS screening of thyroid transporter ligands and confirmation and identification with MS are performed following the same rTTR biorecognition. The influence of immobilization of rTTR on binding assay performance was tested by applying UF units and superparamagnetic beads and it was demonstrated that in both formats similar results could be obtained. However, beads are more amenable to high-throughput screening. For screening purposes, a radiolabel-free BioMS binding assay was developed and focused on T4 screening as a model ligand in water. The assay is capable of screening T4 at the part-per-trillion level in water and at the part-per-billion levels in urine samples. In this BioMS binding assay, a stable isotope is used as a marker, therefore this improved method using MS as a readout system can serve as a safe alternative to radiolabel assays. For confirmatory analysis of endogenously present T4 in urine, the developed BioMS method was slightly modified (just 400 times more rTTR and no 13C6-T4 label) and the identification of T4 was successfully confirmed on the basis of ion ratios and retention time. By adjusting the dissociation conditions of the developed assay and using 40 times more rTTR, two EDCs (triclosan and TBBPA) were identified at relevant levels with full scan accurate mass nano-UPLC-Q-ToF-MS. Finally, the developed triple BioMS concept can be used as a screening, confirmatory and identification tool for early warning of known and unknown emerging bioactive EDCs in the environment.
Acknowledgement
We thank the Dutch Ministry of Economic Affairs, Agriculture and Innovation for financing this research (project no. 7260501). Waters is acknowledged for the loan of a Xevo nano-electrospray Q-ToF-MS system.

Screening and identification of EDCs
105
References
1. Bianco, A.C., D. Salvatore, B. Gereben, M.J. Berry, and P.R. Larsen, Biochemistry, cellular and molecular biology, and physiological roles of the iodothyronine selenodeiodinases. ENDOCR REV, 2002. 23(1): p. 38-89.
2. Cao, J., L.H. Guo, B. Wan, and Y. Wei, In vitro fluorescence displacement investigation of thyroxine transport disruption by bisphenol A. J ENVIRON SCI 2011. 23(2): p. 315-321.
3. Kostich, M.S. and J.M. Lazorchak, Risks to aquatic organisms posed by human pharmaceutical use. SCI TOTAL ENVIRON, 2008. 389(2-3): p. 329-339.
4. Lans, M.C., C. Spiertz, A. Brouwer, and J.H. Koeman, Different competition of thyroxine binding to transthyretin and thyroxine-binding globulin by hydroxy-PCBs, PCDDs and PCDFs. EUR J PHARM-ENVIRON 270, 1994: p. 129-136.
5. Marchesini, G.R., A. Meimaridou, W. Haasnoot, E. Meulenberg, F. Albertus, M. Mizuguchi, M. Takeuchi, H. Irth, and A.J. Murk, Biosensor discovery of thyroxine transport disrupting chemicals. TOXICOL APPL PHARM, 2008. 232(1): p. 150-160.
6. Hamers, T., J.H. Kamstra, E. Sonneveld, A.J. Murk, M.H.A. Kester, P.L. Andersson, J. Legler, and A. Brouwer, In vitro profiling of the endocrine-disrupting potency of brominated flame retardants. TOXICOL SCI, 2006. 92(1): p. 157-173.
7. Meerts, I.A.T.M., J.J. Van Zanden, E.A.C. Luijks, I. Van Leeuwen-Bol, G. Marsh, E. Jakobsson, A. Bergman, and A. Brouwer, Potent competitive interactions of some brominated flame retardants and related compounds with human transthyretin in Vitro. TOXICOL SCI, 2000. 56(1): p. 95-104.
8. Dann, A.B. and A. Hontela, Triclosan: Environmental exposure, toxicity and mechanisms of action. J APPL TOXICOL, 2011. 31(4): p. 285-311.
9. Calafat, A.M., X. Ye, L.Y. Wong, J.A. Reidy, and L.L. Needham, Urinary concentrations of triclosan in the U.S. population: 2003-2004. ENVIRON HEALTH PERSP, 2008. 116(3): p. 303-307.
10. Jardim, W.F., C.C. Montagner, I.C. Pescara, G.A. Umbuzeiro, A.M. Di Dea Bergamasco, M.L. Eldridge, and F.F. Sodré, An integrated approach to evaluate emerging contaminants in drinking water. SEP PURIF TECHNOL, 2012. 84(0): p. 3-8.
11. Wang, H.-X., Y. Zhou, and Q.-W. Jiang, Simultaneous screening of estrogens, progestogens, and phenols and their metabolites in potable water and river water by ultra-performance liquid chromatography coupled with quadrupole time-of-flight mass spectrometry. MICROCHEM J, 2012. 100(0): p. 83-94.

Chapter 3
106
12. Lupton, S.J., B.P. McGarrigle, J.R. Olson, T.D. Wood, and D.S. Aga, Analysis of hydroxylated polybrominated diphenyl ether metabolites by liquid chromatography/atmospheric pressure chemical ionization tandem mass spectrometry. RAPID COMMUN MASS SP, 2010. 24(15): p. 2227-2235.
13. Bolger, R., T.E. Wiese, K. Ervin, S. Nestich, and W. Checovich, Rapid screening of environmental chemicals for estrogen receptor binding capacity. ENVIRON HEALTH PERSP, 1998. 106(9): p. 551-557.
14. Sui, Q., J. Huang, S.B. Deng, and G. Yu, Rapid determination of pharmaceuticals from multiple therapeutic classes in wastewater by solid-phase extraction and ultra-performance liquid chromatography tandem mass spectrometry. CHINESE SCI BULL, 2010. 54(24): p. 4633-4643.
15. Huerta-Fontela, M., M.T. Galceran, and F. Ventura, Fast liquid chromatography–quadrupole-linear ion trap mass spectrometry for the analysis of pharmaceuticals and hormones in water resources. J CHROMATOGR A, 2010. 1217(25): p. 4212-4222.
16. Kasprzyk-Hordern, B., R.M. Dinsdale, and A.J. Guwy, Multiresidue methods for the analysis of pharmaceuticals, personal care products and illicit drugs in surface water and wastewater by solid-phase extraction and ultra performance liquid chromatography-electrospray tandem mass spectrometry. ANAL BIOANAL CHEM, 2008. 391(4): p. 1293-1308.
17. Conley, J.M., S.J. Symes, S.A. Kindelberger, and S.M. Richards, Rapid liquid chromatography–tandem mass spectrometry method for the determination of a broad mixture of pharmaceuticals in surface water. J CHROMATOGR A, 2008. 1185(2): p. 206-215.
18. Covaci, A., S. Voorspoels, M.A.E. Abdallah, T. Geens, S. Harrad, and R.J. Law, Analytical and environmental aspects of the flame retardant tetrabromobisphenol-A and its derivatives. J CHROMATOGR A , 2009. 1216(3): p. 346-363.
19. Hajšlová, J., J. Pulkrabová, J. Poustka, T. Čajka, and T. Randák, Brominated flame retardants and related chlorinated persistent organic pollutants in fish from river Elbe and its main tributary Vltava. CHEMOSPHERE, 2007. 69(8): p. 1195-1203.
20. Frederiksen, M., K. Vorkamp, R. Bossi, F. Rigét, M. Dam, and B. Svensmark, Method development for simultaneous analysis of HBCD, TBBPA, and dimethyl-TBBPA in marine biota from Greenland and the Faroe Islands. INT J ENVIRON AN CH, 2007. 87(15): p. 1095-1109.
21. Svanfelt, J., J. Eriksson, and L. Kronberg, Analysis of thyroid hormones in raw and treated waste water. Journal of Chromatography A, 2010. 1217(42): p. 6469-6474.
22. Weiss, J.M., P.L. Andersson, M.H. Lamoree, P.E.G. Leonards, S.P.J. Van

Screening and identification of EDCs
107
Leeuwen, and T. Hamers, Competitive binding of poly- and perfluorinated compounds to the thyroid hormone transport protein transthyretin. TOXICOL SCI, 2009. 109(2): p. 206-216.
23. Lans, M.C., E. Klasson-Wehler, M. Willemsen, E. Meussen, S. Safe, and A. Brouwer, Structure-dependent, competitive interaction of hydroxy-polychlorobiphenyls, -dibenzo-p-dioxins and -dibenzofurans with human transthyretin. CHEM-BIOL INTERACT, 1993. 88(1): p. 7-21.
24. Suzuki, G., H. Takigami, M. Watanabe, S. Takahashi, K. Nose, M. Asari, and S.-I. Sakai, Identification of brominated and chlorinated phenols as potential thyroid-disrupting compounds in indoor dusts. ENVIRON SCI TECHNOL, 2008. 42(5): p. 1794-800.
25. Marchesini, G.R., E. Meulenberg, W. Haasnoot, M. Mizuguchi, and H. Irth, Biosensor recognition of thyroid-disrupting chemicals using transport proteins. ANAL CHEM, 2006. 78(4): p. 1107-1114.
26. Marchesini, G.R., W. Haasnoot, P. Delahaut, H. Gerçek, and M.W.F. Nielen, Dual biosensor immunoassay-directed identification of fluoroquinolones in chicken muscle by liquid chromatography electrospray time-of-flight mass spectrometry. ANAL CHIM ACTA, 2007. 586(1-2 SPEC. ISS.): p. 259-268.
27. Sun, Y., C. Gu, X. Liu, W. Liang, P. Yao, J.L. Bolton, and R.B. Van Breemen, Ultrafiltration tandem mass spectrometry of estrogens for characterization of structure and affinity for human estrogen receptors. J AM SOC MASS SPECTR, 2005. 16(2): p. 271-279.
28. Jonker, N., H. Lingeman, and H. Irth, Direct Dynamic Protein-Affinity Selection Mass-Spectrometry. CHROMATOGRAPHIA, 2010. 72(1-2): p. 7-13.
29. Jonker, N., A. Kretschmer, J. Kool, A. Fernandez, D. Kloos, J.G. Krabbe, H. Lingeman, and H. Irth, Online Magnetic Bead Dynamic Protein-Affinity Selection Coupled to LC−MS for the Screening of Pharmacologically Active Compounds. ANAL CHEM, 2009. 81(11): p. 4263-4270.
30. Van Breemen, R.B., Pulsed ultrafiltration mass spectrometry: A new method for screening combinatorial libraries. ANAL CHEM, 1997. 69(12): p. 2159-2164.
31. de Vlieger, J.S.B., A.J. Kolkman, K.A.M. Ampt, J.N.M. Commandeur, N.P.E. Vermeulen, J. Kool, S.S. Wijmenga, W.M.A. Niessen, H. Irth, and M. Honing, Determination and identification of estrogenic compounds generated with biosynthetic enzymes using hyphenated screening assays, high resolution mass spectrometry and off-line NMR. J CHROMATOGR B, 2010. 878(7-8): p. 667-674.
32. Niessen, K.V., G. Hofner, and K.T. Wanner, Competitive MS binding assays for dopamine D2 receptors employing spiperone as a native marker.

Chapter 3
108
CHEMBIOCHEM, 2005. 6(10): p. 1769-75.33. Zepperitz, C., G. Hofner, and K.T. Wanner, MS-binding assays: kinetic,
saturation, and competitive experiments based on quantitation of bound marker as exemplified by the GABA transporter mGAT1. CHEMBIOCHEM, 2006. 1(2): p. 208-17.
34. Matsubara, K., M. Mizuguchi, and K. Kawano, Expression of a synthetic gene encoding human transthyretin in Escherichia coli. PROTEIN EXPRES PURIF, 2003. 30(1): p. 55-61.
35. Implementing Council Directive 96/23/EC concerning the performance of analytical methods and the interpretation of results (2002/657/EC). OFF J EUR COMMUNITIES L221, 2002: p. 8-3.
36. Schauer, U.M.D., W. Völkel, and W. Dekant, Toxicokinetics of tetrabromobisphenol A in humans and rats after oral administration. TOXICOL SCI, 2006. 91(1): p. 49-58.

Screening and identification of EDCs
109
Appendix 3.1
Instrumentation
UPLC-QqQ-MS
The applied Acquity Ultra Performance Liquid Chromatography (UPLC) system (Waters, Milford, MA, USA) consisted of a degasser, a binary gradient pump, an autosampler at 10 °C and a column oven which was set at 50 °C. The analytical column was an Acquity UPLCTM BEH 1.7 μm C18, 50 mm x 2.1 I.D. from Waters and the injection volume was 10 μL. The UPLC system was coupled to the electrospray (ESI) interface of a Micromass (Manchester, UK), Quattro Ultima Platinum tandem mass spectrometer (QqQ). The two mobile phases consisted of (A) H2O/CH3COOH (99.8/0.2%, v/v) and (B) MeOH/CH3COOH (99.8/0.2%, v/v) and the flow rate was 0.3 mL min-1. By using acetic acid in the mobile phase instead of formic acid, better peak shapes were obtained. The gradient started at 30% B and this composition remained constant for 0.30 min and increased sharply to 95% B in 0.10 min and remained stable at this composition for another 1.10 min. After 0.05 min, the composition of the mobile phase returned to the initial state (70% A and 30% B) with a final hold of 0.45 min. The LC was interfaced with the ESI MS/MS instrument without a flow split. ESI in the positive mode (ESI+) proved to be the most sensitive for the measurements. The total run time was 2 min and data acquisition for 13C6-T4 was performed in single reaction monitoring mode (SRM) at transition m/z 783.7→737.7 using collision energy 20eV. Data acquisition for non-labeled T4 was performed in MRM data acquisition mode, at transitions m/z 777.7 → m/z 731.7 and m/z 777.7 → m/z 633.7 using collision energy 20 eV and 35 eV respectively. The capillary voltage was set at 2.70 kV and the cone voltage was 35 V. The desolvation gas temperature was 350 °C and the source temperature 120 °C. Nitrogen was the desolvation gas (600 L h-1); the collision-induced dissociation gas was argon at a pressure of 2.5×10-
3 mbar. The absolute LoD of 13C6-T4 was determined as 25 pg on-column (S/N>6).
Nano-UPLC–quadrupole time-of-flight–MS (nano-UPLC-Q-ToF-MS)
The nanoAcquity UPLC System of Waters consisted of a degasser, a binary gradient pump, an autosampler (at 10 °C) and a column oven (at 50 °C). The trapping column was a nanoAcquity UPLC HSS T3 5 μm C8, 20 mm x 180 μm I.D. and the analytical column was a nanoAcquity UPLC BEH 1.7 μm C18 column, pore size 130 Å, 100 mm x 75 μm I.D., all from Waters. The nanoAcquity UPLC system was coupled to a Waters Xevo quadrupole time-of-flight (Q-ToF) mass spectrometry system equipped with a nano-ESI interface without a flow split. The two mobile phases consisted of (A) H2O/CH3COOH (99.8/0.2%, v/v) and (B) MeOH/CH3COOH (99.8/0.2%, v/v) and the flow was 1000 nL min-1. After injection (4 μL), the sample was preconcentrated on the

Chapter 3
110
trapping column at a flow rate of 10 µL min-1 (0% B). After a 3 min trapping time, the gradient started at 1% B and was kept at this composition for 1 min and increased linearly to 40% B in 4 min. After 1 min the composition of mobile phase increased to 80% B and in another 1 min to 95% B. This mobile phase composition was kept for 13 min and returned to 1% B in 1 min with a final hold of 5 min. The total run time was 28 min. The MS was operated in the positive ESI mode for identification of T4 and in negative ESI mode for triclosan and TBBPA at a capillary voltage of 3 kV, cone was at 40 V and source temperature was 80 °C. The purge gas was nitrogen (50 L h-1) and cone gas (10 L h-1) and data acquisition was performed in full scan continuum mode. The detector, containing a 4 GHz TDC, was set to accumulate spectra during 0.3 s in full scan mode at a resolution of 10,000 FWHM. A 2 ng μL-1 standard solution of leucine–enkephalin was introduced as a lockmass via the lock-spray needle (capillary voltage 2.8 kV and cone voltage 40 V) at a flow rate of 500 nL min-1.
Other instrumentation
The magnetic separation of the paramagnetic beads was performed with a DynaMagTM Pro 2 separator rack from Invitrogen Dynal (Oslo, Norway). The centrifugal steps were performed in the Eppendorf 5810 R centrifuge purchased from VWR International (Amsterdam, The Netherlands) and in the Model 16K Microcentrifuge supplied by BioRad Laboratories BV (Veenendaal, The Netherlands).
Appendix 3.2
Methods
Preparation of the rTTR-coated superparamagnetic beads
The rTTR was immobilized onto the superparamagnetic SiMAG-carboxyl bead surface by the formation of covalent bonds between amino-groups of the protein and the activated carboxyl groups on the bead surface. This immobilization was performed according to the slightly modified protocol provided by the manufacturer. In short, the stock of beads (containing 50 mg of beads mL-1) was resuspended by vortexing for 15 min. From this stock, 200 µL (containing 10 mg beads) was transferred to a protein LoBind tube in which the beads were concentrated in the magnetic separator rack in 1 min. After gently removing of the supernatant, the pellet was washed by resuspending in 1 mL 0.1 M MES buffer (pH 5). The beads were concentrated in the magnetic separator rack and the supernatant was removed. This wash step was done twice. To activate the bead surface, the pellet was resuspended in 0.25 mL MES buffer containing 10 mg of EDC and mixed for 10 min at room temperature (RT). Subsequently, the activated beads were washed twice with 1 mL MES buffer

Screening and identification of EDCs
111
and resuspended in 0.25 mL MES buffer. A solution containing 50 μg of rTTR in 0.25 mL MES buffer was added to the activated beads. The suspension was vortexed shortly and incubated for 2 h under mixing by rotation in a test tube rotator at RT. Following the incubation, the supernatant containing unbound rTTR was removed and the beads were washed three times with 1 mL of PBS (5.4 mM Na2HPO4, 1.3 mM KH2PO4, 150 mM NaCl, 3 mM KCl, pH 7.4) buffer. Finally, the rTTR-coated beads were resuspended in 0.5 mL of PBS containing 0.05% sodium azide and stored at 4 °C. Usually, after incubation, bovine serum albumin (BSA) should be used to block the free activated sites of the bead surface. In this study, the blocking was omitted because T4 might bind to BSA. The possible non-specific binding of T4 to the unblocked bead surface was tested.
Immobilization efficiency
In this study, the influence of immobilization of rTTR was investigated. The rTTR was used in immobilized state (using SiMAG-Carboxyl superparamagnetic beads) and in solution (using UF units). The amount of rTTR immobilized on beads (or in solution) determines what amount of beads are needed for efficient binding and competition in the binding assay. Therefore, the immobilization efficiency of rTTR to the bead surface was determined using the BCA method. To determine the average immobilization efficiency, rTTR concentrations were measured in the solutions before and after five immobilizations. The BCA analysis showed that 90 ± 10% (n=5) of the 50 µg rTTR added to the beads was immobilized indicating a high coupling efficiency. The rTTR-immobilized beads were stored in 500 µL storage buffer. Consequently, 1 µL of coupled bead stock corresponds approximately to 0.1 µg rTTR. Alternative superparamagnetic beads (6.5 µm MagPlex®-C Magnetic Carboxylated beads from Luminex Corporation, SiMAG-IDA/Nickel particles (1 µm), SiMAG-Carboxyl particles (1 µm) and 200 nm fluid MAG-CMX all from Chemicell GmbH), having different surface chemistry or diameter, were tested. On the basis of immobilization efficiency, ease-of-use and cost, the SiMAG-Carboxyl were found to be the most suitable for this study.
Protein analysis
The BCA protocol consisted of the following steps; 10 μL of sample solution was added in duplicate to a microtiter plate. Then, 200 μL of a mixture, consisting of an alkaline agent, bicinchoninic acid (BCA) and CuSO4 (reduced to Cu1+ by proteins), was added to the samples and the calibration curve. The reagent is responsible for color change by chelating 2 BCA molecules to Cu1+ ions. The calibration curve was made by diluting a BSA stock solution of 1 mg mL-1 with PBS buffer. Following the addition of reagents, the microtiter plate was incubated at 65 °C during 30 min after which the microtiter plate was cooled for 5 min at RT and the concentration of

Chapter 3
112
proteins was measured using an UV/Vis ELx808 absorbance microplate reader at 562 nm from BioTek (Winooski,VT, USA).
Appendix 3.3
Optimizing BioMS binding assay protocol
The optimal sequence of competing 13C6-T4 (label) and model ligand T4 (analyte) addition to the rTTR was determined and showed a great influence on the efficiency of competition. The addition of a mixture of label and ligand was found to be the most optimal: only a low amount of model ligand T4 was needed (± 1 ng) to decrease the recovery of 236 pg competing 13C6-T4 label by 50%. This particular experiment was performed with the same rTTR concentrations as displayed in Figure 3. According to our results, the highest amount of label inhibition with the lowest amount of analyte (1 ng) was observed using 0.25 µg rTTR. The same phenomenon was also observed when beads were used. The optimal amount of beads was found to be 1 µL corresponding to ± 0.1 µg rTTR. Following this experiment, different incubation times (0, 15, 30, 60 min) were tested and 15 min was found optimal. It is important to note that when the incubation volume is larger than 300 µL, the label recovery decreases even in absence of any analyte. Probably, this relatively low amount of rTTR (0.25 µg) cannot capture any ligand efficiently in a relatively high volume of >300 µL. The two wash steps were performed with 100 µL of assay buffer/MeOH (9:1, v/v) to remove all unbound ligands together with hydrophilic matrix compounds. It was found that only a low amount of label (± 10%) was lost in these steps. In order to fully dissociate the label after the wash steps, a solution was selected which could alter the rTTR charge and conformation causing the dissociation of the label-rTTR affinity complex. For this purpose, 100 µL of acidified MeOH was chosen (H2O/MeOH/HCOOH, 49/50/1 % v/v/v) which is also compatible with LC-MS. This solution, dissociated 80% of ligands in one dissociation step and the remaining 20% was dissociated in a second step. When acetic acid was used to dissociate ligands, the dissociation efficiency dropped dramatically. Also different dissociation times (0-15-30-60 min) were tested and again 15 min was found to be optimal. The optimized BioMS binding assay protocol is described in the section “Methods”. Next, the optimized assay was repeatedly applied (40 times with UF units and 10 times with beads) under buffer conditions to determine an average 13C6-T4 recovery in absence of analyte. Similar results were obtained with beads (23% recovery, i.e. 172 ±19 pg) and UF units (31% recovery, i.e. 236 ±15 pg) and both formats showed good precision. In order to demonstrate that the developed competitive inhibition MS binding assay is rTTR-related, two competitors were tested using UF units. The first competitor TBBPA is reported to have a binding affinity equal or higher than T4 to TTR and the second tested competitor T3 is reported to have a binding affinity lower than T4 to TTR. By adding only 1 ng of the strong binder TBBPA,

Screening and identification of EDCs
113
75% of 236 pg bound label was inhibited and by adding eight time more T3 (8 ng) only 20% of the 236 pg bound label was inhibited. In comparison, as shown in Figure 4A, 1 ng of T4 was needed for a 50% inhibition of 236 pg bound label, indicating the high binding affinity of TBBPA and low binding affinity of T3 to TTR. The results are in agreement with the affinities reported in literature and strongly suggest that the developed competitive inhibition BioMS binding assay is rTTR-related.
Appendix 3.4
BioMS identification of model ligand T4 in process water by nano-UPLC-Q-ToF-MS
Following the screening of the model ligand T4 in a two thousand times concentrated process water extract, the same extract was injected into the nano-UPLC-Q-ToF-MS and T4 was identified on the basis of retention time and accurate mass (∆5.9 ppm) and retention time (∆0.01 min).
Appendix 3.5
Theoretical and experimental exact masses, mass errors, retention times and elemental composition of triclosan and TBBPA in standard solutions and in bioaffinity purified and nano-UPLC-ToF-MS analyzed urine extract.
Theoretical Measurement tR Experimental Mass error Elemental composition*
[M-H]- (min) [M-H]- (ppm) [M-H]-
Triclosan286.943 standard 10.60 286.940 -10 C12H6Cl3O2
-
287.947 (13C) 287.945 -7288.940 (37Cl) 288.937 -10290.938 (37Cl2) 290.936 -7
sample 10.63 286.940 -10 C12H6Cl3O2-
287.945 -7288.943 10290.949 38
TBBPA
538.749 standard 10.60 538.751 4 C15H11Br4O2-
540.447 (81Br) 540.749 4542.745 (81Br2) 542.746 2544.743 (81Br3) 544.745 4
546.742 (81Br4) 546.754 22sample 10.60 538.749 0 C15H11Br4O2
-
540.751 7542.748 6
544.745 4 546.736 -11

Chapter 3
114
* Triclosan and TBBPA were identified on the basis of measured accurate mass and isotopic patterns using the following elemental composition limits for triclosan C 10–22, H 5–22, N 0-4, O 1–9 and Cl 1-3. C 10–22, H 8–22, N 0-4, O 1–9 and Br 1-5 for TBBPA. Both EDCs were the first realistic option within calculated results with reasonable double bond equivalents and correct halogen number when halogens were recognized in the isotope cluster.
Appendix 3.6
Nano-UPLC-Q-ToF-MS chromatograms and accurate mass spectra of two bioaffinity purified urine extracts containing 1000 ng mL-1 triclosan (A, the [M-H]- peak corresponds to 286.940 Da) and 1.2 ng mL-1 TBBPA (B, [M-H]- peak of the 81Br2 isotope corresponds to 542.748 Da).
B
A
Time (min)
Abundance
Abundance

* Triclosan and TBBPA were identified on the basis of measured accurate mass and isotopic patterns using the following elemental composition limits for triclosan C 10–22, H 5–22, N 0-4, O 1–9 and Cl 1-3. C 10–22, H 8–22, N 0-4, O 1–9 and Br 1-5 for TBBPA. Both EDCs were the first realistic option within calculated results with reasonable double bond equivalents and correct halogen number when halogens were recognized in the isotope cluster.
Appendix 3.6
Nano-UPLC-Q-ToF-MS chromatograms and accurate mass spectra of two bioaffinity purified urine extracts containing 1000 ng mL-1 triclosan (A, the [M-H]- peak corresponds to 286.940 Da) and 1.2 ng mL-1 TBBPA (B, [M-H]- peak of the 81Br2 isotope corresponds to 542.748 Da).
4High-throughput bioaffinity mass spectrometry for screening
and identification of designer anabolic steroids in dietary supplements
Aqai, P., E. Cevik, A. Gerssen, W. Haasnoot, and M.W.F. Nielen, Analytical Chemistry, 2013. 85 (6): p. 3255-3262.

Chapter 4
116
Abstract
A generic high-throughput bioaffinity liquid chromatography-mass spectrometry (BioMS) approach was developed and applied for the screening and identification of known and unknown recombinant human sex hormone-binding globulin (rhSHBG)-binding designer steroids in dietary supplements. For screening, a semi-automated competitive inhibition binding assay was combined with fast ultra-high-performance-LC-electrospray ionization-triple-quadrupole-MS (UPLC-QqQ-MS). 17β-testosterone-d3 was used as the stable isotope label of which the binding to rhSHBG-coated paramagnetic microbeads was inhibited by any other binding (designer) steroid. The assay was performed in a 96-well plate and combined with the fast LC-MS, 96 measurements could be performed in 4 h. The concentration-dependent inhibition of the label by steroids in buffer and dietary supplements was demonstrated. Following an adjusted bioaffinity isolation procedure, suspect extracts were injected into a chip-UPLC(NanoTileTM)-Q-time-of-flight-MS system for full scan accurate mass identification. Next to known steroids, 1-testosterone was identified in three of the supplements studied and the designer steroid tetrahydrogestrinone was identified in a spiked supplement. The generic steroid-binding assay can be used for high-throughput screening of androgens, estrogens and gestagens in dietary supplements to fight doping. When combined with chip-UPLC-MS, it is a powerful tool for early warning of unknown emerging rhSHBG bioactive designer steroids in dietary supplements.
Screening and identification of steroids
117
Introduction
Dietary supplements are preparations to supplement the diet and provide nutrients, such as vitamins, minerals, fibers, fatty acids or amino acids, that may be missing or may not be consumed in sufficient quantities in a diet. However, several investigations have shown the deliberate and unintentional addition of (pro)hormones to supplements [1-4]. Although, this is banned in the EU and USA, anabolic steroid-containing supplements are still widely available on the internet and easy to order for professional athletes to enhance their performance and for people with certain life styles. In order to achieve fair play, the use of hormones and anabolic steroids in sports are forbidden by the World Anti-Doping Agency (WADA) [5]. Therefore, athletes and their entourage have been searching for new anabolic steroids to evade the doping controls [6]. In modern doping control laboratories, gas chromatography-mass spectrometry (GC-MS) and liquid chromatography (LC)-tandem mass spectrometry (MS/MS) are used for fast, robust, sensitive and specific detection in sport drug testing [7]. In order to achieve the highest sensitivity and selectivity, both GC-MS and LC-MS are set up in pre-selected mass data acquisition modes in which only known steroids can be measured [8-12]. In this way, new designer steroids could escape from routine testing and stay undetected. For example, the designer steroids tetrahydrogestrinone (13,17-diethyl-17-hydroxy-18,19-dinor-17-pregn-4,9,11-trien-3-one, THG) [13] and 17α-methyl-5α-androst-2-en-17β-ol (Madol) [14] were not detected in routine testing prior to finding the preparations of these designer steroids (these designer steroids were found in a syringe and an oily product respectively). Another approach to screen unknown anabolic steroids, is the use of precursor ion scans in triple quadrupole mass spectrometers (QqQ-MS). Since steroids may have similar MS/MS fragmentations, characteristic product ions were used as markers for the identification of unknown steroids [15]. Next to these classical instrumental analysis concepts, biorecognition-based assays are used for rapid screening of anabolic steroids. These assays use antibodies or transport proteins such as sex hormone-binding globulin (SHBG), are rapid and can provide information about the biological relevance; however identification is not possible [16-19]. For example, Mooney et al. developed a surface plasmon resonance (SPR)-based biosensor screening assay in which SHBG was used as a bioreagent to indicate the illicitly used growth-promoting agents estradiol benzoate and nortestosterone decanoate during rearing of calves [16]. Plasma from control animals and treated animals (25 mg estradiol benzoate and 150 mg nortestosterone decanoate) were measured and significant reduction of SHBG binding capacity was observed in treated animals only. In order to determine binding affinity of various SHBG ligands under physiological conditions, Jury et al. developed a radiolabeled-based assay [20]. This assay demonstrated binding affinities of numerous compounds, however, the use of a

Chapter 4
118
radiolabel is a disadvantage and moreover MS-based identification of SHBG ligands was not possible [20]. By applying simply a binding assay or a classical instrumental method, new designer steroids can escape from routine testing and therefore any abuse will stay unnoticed. The combination of bioaffinity extraction with MS detection could serve as a powerful tool for the identification of designer steroids. For the screening of (designer) steroids a yeast androgen bioassay (YAB) was developed by Bovee et al. [21]. This assay expresses yeast enhanced green fluorescent protein (yEGFP) of which the fluorescent emission is measured in response to androgens. The identification of androgens was performed by LC-fractionation of the suspect found sample into two 96-well plates after which one 96-well plate was screened again to indicate in which androgens are present for identification with MS [2, 22]. The YAB demonstrated the presence of designer steroid THG in spiked urine sample [23] and also the anabolic steroid 1-testosterone (1,(5α)-androsten-17α-ol-3-one) which is chemically closely related to the natural testosterone, but often escapes routine testing was found in dietary supplements [2]. The YAB is not generic as for the screening of estrogens a yeast estrogen bioassay is required. Moreover, these whole cell bioassays are inherently slow and require 2 days. In this work, a generic semi-automated high-throughput bioaffinity MS (BioMS) method is presented in which for the first time recombinant human sex hormone-binding globulin (rhSHBG) and dedicated modes of LC-MS are used for screening and identification of androgenic and estrogenic (designer) steroids in dietary supplements. RhSHBG covalently immobilized onto paramagnetic beads was used in a competitive inhibition format for screening and in a slightly adapted bioaffinity isolation format for identification of rhSHBG binders ensuring uniform biorecognition in both screening and identification approaches. For identifying rhSHBG binders, a chip-ultra-performance-LC(NanoTileTM)-quadrupole-time-of-flight mass spectrometry (chip-UPLC-Q-ToF-MS) system with sub 2 µm particles and operating in the high resolution full-scan accurate mass mode was used. The screening and identification results of steroids in dietary supplements obtained with the newly developed MS-binding assay are critically compared with data from LC-QqQ-MS and YAB.
Materials and methods
Materials
All chemicals and their abbreviations are described in appendix 4.1. The LoBind Tubes were provided by Eppendorf (Hamburg, Germany) and the LoBind 96-well micro flat bottom plate (655161) and 96-well micro V-shaped bottom plate (651201) by Greiner Bio-One B.V. (Alphen a/d Rijn, The Netherlands). Water purification was

Screening and identification of steroids
119
performed using a Milli-Q system (Milipore, Bedford, MA, USA). SiMAG-Carboxyl (product number 1402-1, 1 µm diameter) microbeads were supplied by Chemicell GmbH (Berlin, Germany). The Milliplex magnet Handheld Magnetic Separator Block for 96-Well Flat Bottom Plates was purchased from Milipore (Bedford, MA, USA). The microtiter plate vari-shaker was from Dynatech (Alexandria, VI, USA) and the REAX2 head-over-head shaker from Heidolph (Schwabach, Germany). The automatic magnetic wash station BioPlexTM pro II was from BioRad Laboratories B.V. (Veenendaal, The Netherlands).
Instrumentation
High-performance liquid chromatography–triple-quadrupole mass spectrometry
A Waters (Milford, MA, USA) Acquity Ultra-Performance LC (UPLC) system, consisting of a degasser, a binary gradient pump, an auto sampler (at 10 °C) and a column (at 50 °C), was used. The injection volume of the sample was 10 μL and the analytical column was an Acquity UPLCTM BEH 1.7 μm C18, 50 mm x 2.1 mm I.D. from Waters. The UPLC system was coupled to a Micromass (Manchester, UK) Quattro Ultima tandem mass spectrometry (QqQ) system equipped with an electrospray interface (ESI) used in positive mode. The two mobile phases consisted of (A) H2O/HCOOH (99.9/0.1%, v/v) and (B) ACN/HCOOH (99.9/0.1%, v/v) and the flow rate was 0.3 mL min-1. The gradient started at 30% B and this composition remained constant for 0.30 min, increased sharply to 95% B in 0.10 min and remained stable at this composition for another 1.10 min. After 0.05 min, the composition of the mobile phase returned to the initial state (70% A and 30% B) with a final hold of 0.45 min. The total run time was 2 min only. The UPLC was interfaced with the ESI MS/MS instrument without a flow split. The ESI capillary voltage was +2.7 kV and the cone voltage was 30 V. The desolvation gas had a temperature of 350 °C and the source temperature was 120 °C. The desolvation gas was nitrogen (700 L h-1) and the collision-induced dissociation gas was argon at a pressure of 2.5 × 10⁻³ mbar. Data acquisition for 17β-testosterone-d3 (T-D3), used throughout the study as label, was performed in single reaction monitoring (SRM) mode at transition m/z 292 → m/z 97 using collision energy 20eV. The absolute limit of detection (LoD) of T-D3 was determined at 5 pg on-column (S/N > 6).
Chip-ultra-performance liquid chromatography (NanoTileTM) quadrupole-time-of-flight mass spectrometry
Chromatography was performed on a Waters NanoTileTM containing a BEH C18 column (50 mm × 150 µm I.D., 1.7 µm particles) and having an integrated nano

Chapter 4
120
electrospray ionization (ESI) emitter. Solvent was delivered by a nanoAcquity UPLC system from Waters. The NanoTileTM was kept at a temperature 45°C. The autosampler was at 10°C and a volume of 0.5 µL was injected from the 96-well plate. The mobile phase consisted of (A) H2O/HCOOH (99.9/0.1%, v/v) and (B) ACN/HCOOH (99.9/0.1%, v/v). After injection, separation was done using gradient elution at a constant flow rate of 4 µL min-1. The gradient started at 10% B for 0.5 min followed by a linear increase to 20% B in 1.5 min, and from 20 to 50% B in 6 min and from 60 to 95% B in 1 min. The gradient remained for 3 min at 95% B, returned in 0.5 min to 10% B and remained at this level for 3.5 min prior to the next injection. The NanoTileTM was directly interfaced with a Xevo Q-ToF mass spectrometer (Waters) using the Waters TrizaicTM source equipped with a lock mass probe. The system was operated in positive ESI mode. The source temperature was set at 110 °C and a capillary voltage of 3.1 kV and cone voltage of 40 V was applied. In order to get extra structural information MSe was applied, which means simultaneously a scan at low (6 eV) and at high collision energy (ramped from 15 to 35 eV) in separated data acquisition functions. Additionally, in order to measure specific product ions with highest sensitivity, the MS was also operated in accurate product ion scanning mode. As lock mass, a solution of 500 pg mL-1 of leucine-enkephalin was continuously introduced by the lock mass probe at a flow rate of 0.4 μL min-1. For accurate mass calibration of the mass axis, the following lock masses were used m/z 556.2771, 425.1825, 397.1876, 278.1141 (the latter three masses are fragment ions of leucine-enkephalin produced at a collision energy of 21eV in ESI+).
Methods
Covalent immobilization of rhSHBG
SiMAG-carboxyl paramagnetic microbeads of 1 µm (having a maghemite core and a non-porous silica surface containing propyl linkers on which carboxyl groups are immobilized) were used in this study because of their proven high coupling efficiency for proteins [24]. The rhSHBG protein was immobilized randomly by covalent bond formation between its amino groups and the carboxyl groups on the super paramagnetic SiMAG-carboxyl bead surface. For this immobilization, the carbodiimide coupling protocol of Chemicell (“Covalent Coupling Procedure in SiMAG-Carboxyl by Carbodiimide Method”) was used. In short, the beads suspended in storage solution were vortexed for 15 min. Then 200 µL of the bead stock was transferred to a LoBind tube and the tube was placed in the magnetic rack for 1 min. The supernatant was removed and the pellet was washed twice with 1 mL 0.1 M MES buffer (pH 5) using the magnetic rack. For activation of the bead surface, the pellet was resuspended in 0.25 mL MES containing 10 mg EDC (prepared freshly).

Screening and identification of steroids
121
This mixture was mixed for 10 minutes at room temperature (RT). After the activation of the beads, the mixture was washed twice with 1 mL MES buffer and resuspended again in 0.25 mL MES buffer. Subsequently, 50 µg rhSHBG protein was added to the activated beads and this mixture was incubated for 2 h by mixing with the rotator at RT. After incubation, the unbound rhSHBG in the supernatant was removed by using the magnetic rack and the beads with covalently coupled rhSHBG were washed three times with 1 mL PBS (5.4 mM Na2HPO4, 1.3 mM KH2PO4, 150 mM NaCl, 3 mM KCl, pH 7.4). Finally, the rhSHBG-coated beads were resuspended in 0.5 mL of PBS containing 0.05% sodium azide and stored at 4 °C.
Non-covalent immobilization of rhSHBG
SiMAG-IDA/Nickel paramagnetic microbeads of 1 µm (having a maghemite core and a non-porous silica surface on which Ni2+-metal complex is formed with iminodiacetic acid) were used for oriented non-covalent immobilization of rhSHBG. The immobilization is based on the His-tag sequence of rhSHBG which binds to the Ni2+ cations on the beads and the protocol of Chemicell (“Purification of 6xHis-tagged proteins with magnetic SiMAG-IDA/Nickel particles”) was used. In short, the beads were vortexed for 15 min. and then 100 µL of SiMAG-IDA/Nickel bead stock is transferred to a LoBind tube. The tube was placed in the magnetic rack for 1 min. The supernatant was removed and the pellet was washed three times with 0.5 mL Wash & Binding buffer (500 mM NaCl, 100 mM HEPES, 20 mM imidazole, pH 8.0). After the last wash step, the beads were resuspended in 0.5 mL Wash & Binding buffer. Subsequently, 25 µg of rhSHBG was added to the beads and mixed gently for 30 min. at RT. After incubation, the unbound rhSHBG in the supernatant was removed and the beads with non-covalently bound rhSHBG were washed three times with Wash & Binding buffer. Finally, the rhSHBG-coated beads were resuspended in 0.5 mL of PBS containing 0.05% sodium azide and stored at 4 °C.
Sample preparation
The primary extraction procedure of steroids from dietary supplements was based on the procedure described by Rijk et al. [2], which was simplified by omitting the solid phase extraction (SPE) and evaporation steps. The dietary supplements were ground and 0.05 gram was weighed into a 10 mL plastic tube. To this tube, 2 mL MeOH and 2 mL 12.5 mM sodium acetate (pH 4.8) were added for extraction of steroids. First, the tubes were placed in an ultra-sonic bath for 10 min., followed by 15 min. head-over-head mixing. The samples were centrifuged at 3000 x g for 10 min. The supernatant was transferred into glass vials and diluted five times with HBS-EP buffer (2.38 g HEPES, 8.77 g NaCl, 1.12 g EDTA, 50 µL P20 in 1 L H2O) from which 100 µL was used in the BioMS assay.

Chapter 4
122
BioMS screening
As mentioned in literature, the binding sites of SHBG are highly unstable when they are not occupied by any binder [25]. Therefore, the two purchased batches of rhSHBG were either stabilized with the strong binder 17β-testosterone (β-T) or with cortisol (weak binder). During preliminary experiments, the batch of rhSHBG containing β-T was used to determine the optimal conditions to displace the β-T by T-D3 during a pre-incubation. This was determined by measuring displaced β-T in extracts with and without the addition of T-D3 and UPLC-MS/MS in multiple-reaction monitoring (MRM) mode as analysis system. The same optimal displacing conditions were used for the rhSHBG batch containing cortisol. To prevent any chance to obtain false-suspect results for β-T during bioaffinity isolation, the cortisol-stabilized rhSHBG batch was finally used in this study. The first step in the assay was a pre-incubation with an excess of T-D3 (5 ng) label to displace all cortisol from the rhSHBG binding sites. For this pre-incubation step, the stock of T-D3 label was diluted to 50 ng mL-1 using HBS-EP/MeOH (9:1) and 100 µL of this solution was added to a 96-well flat bottom plate, followed by 10 µL of 10 times in assay buffer (HSB-EP) diluted rhSHBG-coated beads. This mixture was pre-incubated for 15 min on the shaker at 550 rpm (Dynatech Alexandria, VI, USA). To remove the unbound T-D3 label and replaced original stabilizers, the automatic magnet wash station was used to wash the 96-well plate three times with HBS-EP buffer. The binding assay incubation of 15 min. was done after addition of 100 µL of competitor solution (either standard for dose-response curves or supplement extracts in HBS-EP/MeOH (9/1)). The second wash cycle (3x) was done by the automatic magnetic wash station to remove unbound T-D3 label and unbound competitor. After the second wash cycle, 70 µL HBS-EP buffer were added to the wells and all bead solutions were mixed and the content of each well was transferred into a new 96-well plate by an eight channel pipette. This was done prior to the dissociation step because at high concentrations, the competitors might bind non-specifically to the wells of the plate. The well-plate was placed on the Milliplex magnetic plate (Milipore, Bedford, MA, USA) and the beads were magnetized against the well wall in one min after which the supernatant was removed. To dissociate all the bound label and competitors, 100 µL of dissociation solution (H2O/MeOH/HCOOH, 49/50/1 %, v/v/v) was added to the plate and the plate was shaken for two min on the shaker (550 rpm). With the help of the Milliplex magnetic plate, the supernatants with all the dissociated compounds were transferred to a V-shape 96-well plate for UPLC-QqQ-MS rapid screening. The total duration of this BioMS assay procedure was 60 min. for 96 samples. Dose-response curves were fitted using the five parameter curve fitting in the GraphPad Prism software of GraphPad Software Inc. (La Jolla, CA, USA).

Screening and identification of steroids
123
Bioaffinity isolation for identification
The bioaffinity isolation procedure is similar to the BioMS screening of supplements, except that ten times more rhSHBG-coated beads are used and no label is added. First, 10 µL of undiluted rhSHBG-coated beads was added to the plate. After diluting the primary supplement extract in HBS-EP/MeOH (9/1), 100 µL were added to the plate, incubated for 15 min and the same procedure was followed as described for the screening, except that the chip-UPLC-Q-ToF-MS was used for identification. The total duration of this bioaffinity purification procedure was <30 min for 96 samples.
Results and discussion
BioMS screening assay
During the development of the semi-automated BioMS screening assay for dietary supplements, various parameters were optimized, such as influence of buffer composition, incubation times and incubation volumes. At first, the limit of detection (LoD) of the label (T-D3) in the UPLC-QqQ-MS was determined at the fastest LC conditions (2 min run time) and found to be 5 pg on-column (S/N > 6). Then, the optimal amount of rhSHBG-coated beads needed for the isolation of a reproducible and detectable quantity of the label was investigated. Also the amount of the label needed to displace all steroidal stabilizers from the binding sites of the rhSHBG was investigated and found to be 5 ng. By displacing all these stabilizers, false suspect results were prevented. The influence of oriented non-covalent immobilization of the His-tagged rhSHBG onto Ni2+-coated paramagnetic beads and non-oriented covalent coupling of rhSHBG onto carboxyl-coated paramagnetic beads was also investigated. As the binding capacity of equivalent amounts of Ni2+-beads was higher than COOH-beads the oriented immobilization of rhSHBG on Ni2+-beads gave slightly higher eluted amounts of T-D3 (20%). However, the non-oriented covalently immobilized rhSHBG on COOH-beads proved to be stable for a longer time (3 weeks vs 1 week) and was chosen for this study. Typical reconstructed UPLC-QqQ-MS chromatograms of the eluted label from non-oriented covalently coupled rhSHBG-coated beads are shown in Figure 1A. This figure illustrates the fast analysis with a total run time of 2 min and the principle of the developed BioMS screening assay: the eluted amount of label decreases if a competing rhSHBG binder, e.g. β-T, is present in a sample. Next, the influence of the amount of rhSHBG on the UPLC-QqQ-MS measured recovery of the isotopic label was determined (see appendix 4.2). For this experiment, 5 ng of the T-D3 label in absence of any competitor was added to different volumes of rhSHBG-coated beads. A well with no rhSHBG-coated beads was used as blank control to prove that the label did not bind to the 96 well-

Chapter 4
124
plate. The amount of the label found in this control was <LoD, which proved that rhSHBG was responsible for capturing the label. The absolute amount of eluted label increased with increasing amounts of rhSHBG-coated beads (from 20 pg using 0.5 µL of rhSHBG-coated beads to 1900 pg using 10 µL of rhSHBG-coated beads) (see appendix 4.2). Further experiments proved that as little as 1 µL of rhSHBG-coupled beads (or 10 µL of 10 times diluted beads) both yielded reproducible results and, in the presence of steroid competitors , good competition (see Figure 1B). With the BioMS screening assay, dose-response curves were constructed for β-bol, β-T, DHT, β-1-T and β-E2 in buffer (Figure 1B). Sensitivities at 50% inhibiting concentration (IC50) were found to range from 1.8 ng mL-1 (0.18 ng absolute) for the strong binder DHT to 55 ng mL-1 (5.5 ng absolute) for the weaker binder β-bol and all curves illustrate good precision of the method. Steroids occurring in dietary supplements and when added intentionally, are typically present at high levels (0.02-2 mg g-1) [11] which would correspond to a final concentration in the BioMS screening assay of 0.04-4 µg mL-1; the IC50 values of the developed BioMS screening are below these levels. The developed BioMS assay showed better sensitivities compared with the receptor-based YAB (10-2000 ng mL-1) [2]. The LoDs of targeted GC-MS and LC-MS-based [11, 26] methods are even better (0.01-20 ng mL-1).
Figure 1. Reconstructed UPLC-QqQ-MS SRM chromatograms showing the peak areas and retention time of the label (T-D3) eluted from 1 µL rhSHBG-coated beads in the absence (•) and in the presence of 1 ng (▼) and 10 ng (▲) of the competing β-T binder (A) and normalized average dose-response curves (n=2) of β-bol (♦), β-T (▼), DHT (▲), β-1-T (○), β-E2 (■) in HBS-EP buffer obtained by the BioMS assay using 1 µL of rhSHBG-coated beads (B).
A
B
A
B
retention time (min)

Screening and identification of steroids
125
Next to IC50 values, the BioMS assay was used to determine relative rhSHBG binding (RB) values for various competitors (see Table 1). The RB values were calculated by comparing the degree of inhibition caused by a competitor with β-T (both at a level of 10 ng), the latter was given a reference value of 1. RB values <1 represent binders having a lower affinity towards rhSHBG than β-T at the 10 ng level. In literature, affinities of SHBG binders were investigated by in silico approaches or by tritium-label displacement methods using SHBG and [3H]-E2 as label [20, 27-29]. The RB values in Table 1 and the values obtained from literature compare generally very well: similar weak and strong binders are found in the BioMS assay (DHT>β-T=β-E2>β-bol>proges.). When the RB values of Table 1 are compared to the Relative Androgenic Potencies (RAP) of various compounds in the YAB [2] larger differences are observed. This is not unexpected since the YAB is not a binding assay but a receptor-based transcription activation assay.

Chapter 4
126
Table 1. Relative binding (RB) and IC50 values of various anabolic steroids in the BioMS assay compared to tritium-label displacement [29] and in silico [27, 28] methods and (RAP) in YAB [2].
Compound BioMS RB
value
IC50 (ng mL-1) IC50 (µM) [29] In silico [27, 28] YAB [2]
BioMS assay Protein-Ligand Dis-sociation*
RAP**
β-T 1 20 5.9E-3 9.20 1
α-T 0.1 - - - 0.0063
β-T-glu 0.4 - - - -
T-Ac 0 - - - -
T-cyp 0 - - - -
Cl-T 1 - - - -
CLAD 0.4 - - - -
β-1-T 1.1 3.5 - - 1.9
α-1-T 0.7 - - - -
β-norT 0.3 - - 6.30 1.6
α-norT 0.1 - - - -
β-E2 0.9 18 5.4E-3 8.83 0.019
α-E2 0.7 - - - -
E1 0.9 - - 8.18 -
β-E2-glu 0 - 3.2E-2 - -
β-E2-sul 0 - - - -
DHT 1.3 1.8 - 9.74 -
4α-androstane-3β-17β-dione
0 - - - -
THG 0.4 - - - -
Zea 0 - 0.32 - -
α-zear 0.2 - - - -
β-zear 0 - - - -
equol 0.6 - - - -
naringenin 0 - 200*** - -
proges. 0.3 - 2.5 6.94 0.038
β-bol 0.6 55 - - 0.18
α-bol 0 - - - -
DHEA 0.3 - - - -
androst-4-ene-3β-17β-diol
1 - - 9 0.049

Screening and identification of steroids
127
BioMS assay Protein-Ligand Dis-sociation*
RAP**
5α-androstane-3β-17α-diol
0.6 - - - -
5α-androstane-3β-17β-diol
1.1 - - 9.17 -
5α-androstane-3α-17β-diol
1.1 - - - -
5α-androstane-3α-17α-diol
0 - - - -
5β-androstane-3β-17α-diol
0 - - - -
5β-androstane-3β-17β-diol
0.7 - - - -
5β-androstane-3α-17β-diol 0 - - - -
5β-androstane-3α-17α-diol 0
- - - -
* Corresponding protein–ligand dissociation parameters produced by QSAR and virtual screening approaches. ** RAP is defined as the ratio between the 50% effective concentration (EC50) of 17β-T and the EC50 of the compound.*** 200 µM naringenin displaced 34% of [3H]-E2 [20].
BioMS screening of steroids in dietary supplements
To investigate the performance of our new BioMS screening, 21 dietary supplements, previously analyzed for the presence of anabolic steroids by YAB [2] and by LC-MS/MS in MRM mode [11] were screened again and the outcome was critically compared. Figure 2 shows the screening results using the newly developed BioMS. Samples 1-14 were previously screened as blanks and samples 15-21 as suspect by YAB [2] and LC-MS [11]. The BioMS assay results show that the blanks gave an average eluted amount of T-D3 of 32±7 SD pg. A decision level calculated from these data (average minus 3 times SD) indicate that T-D3 levels below 11 pg pinpoint to suspect samples. The known suspect samples gave T-D3 eluted amounts of 1±1 pg. These T-D3 data clearly demonstrate that there is a significant difference between blank and suspect samples.
Compound BioMS RB
value
IC50 (ng mL-1) IC50 (µM) [29] In silico [27, 28] YAB [2]

Chapter 4
128
Figure 2. BioMS screening results of dietary supplements measured with UPLC-QqQ-MS (grey bars) and with chip-UPLC-Q-ToF-MS (black bars) earlier screened by the YAB as <LoD (sample nr 1-14) and suspect for the presence of anabolics according to YAB [2] and/or LC-MS/MS [11] (sample nr 15-22). Data are the mean of duplicate analysis.
Since phytosterols may occur in sports supplements, the potential binding of phytosterols to rhSHBG was investigated by re-examining the screening results. The labels of supplements 8 and 13 described the presence of 10 mg of phytosterols β-sitosterol, campesterol and stigmaterol. As these supplements were screened as blanks, no false-suspect results are obtained in the BioMS screening by the presence of 10 mg/pill phytosterol in dietary supplements. Another indication that phytosterols do not bind to rhSHBG or have a low RB in the BioMS, is the comparison of the binding affinity of β-sitosterol and naringenin. In the radiolabel displacement method by Jury et al. [20] both compounds displaced similar amount of the label (i.e. 40%). In the BioMS approach an RB value of 0 was obtained for naringenin.
BioMS identification of known and designer steroids by chip-UPLC-Q-ToF-MS
In this study, a chip-based NanoTileTM UPLC was used because, compared to conventional (UP)LC, chromatographic performance is superior and low volume injections (0.1-2 µL) are feasible. The latter is important in order to be able to inject extracts which were previously injected onto the LC-QqQ-MS for screening. As rather exciting example, Figure 3 shows typical NanoTileTM-UPLC-Q-ToF-MS reconstructed ion chromatograms on a 5 cm chip-column in which excellent efficiency (effective plate numbers 20,000-60,000), peak shape (asymmetry factor at 10% peak height; 0.8-1.3) and separation is displayed, even for isobaric steroid isomers at very low levels (1-10 pg on-column). The same sample extracts used for screening purposes

Screening and identification of steroids
129
were injected onto the chip-UPLC-Q-ToF-MS system. Re-injecting the same bio-purified sample extracts previously used for the BioMS screening assay on this second LC-MS system was possible because the chip-UPLC-Q-ToF-MS system is capable of injecting low sample volume samples (0.1-2 µL) while still providing adequate full scan accurate mass sensitivity. In each sample screened suspect in Figure 2, the strongest rhSHBG-binding steroid was identified on basis of retention time, accurate mass and MS/MS spectra (in accurate product ion scanning mode). In Table 2 the identification results observed by chip-UPLC-Q-ToF-MS are summarized and compared with previous LC-MS/MS [11] and YAB data [2] from literature. In order to identify also additional weaker rhSHBG binders in the sample extracts, all suspect samples were also subjected to a slightly adapted BioMS identification procedure in which ten times more rhSHBG-coated beads was used and without pre-incubation with T-D3 (Table 2).
Figure 3. Reconstructed chip-UPLC-Q-ToF-MS ion chromatograms of (A) the isomers α-bol and β-bol, α-norT and β-norT, α-T and β-T, α-1-T, β-1-T and of THG (all 1 pg on-column) and androst-4-ene-3β-17β-
diol (10 pg on-column), and of (B) β-1-T in suspect sample nr 22.
β-bol α-bol
m/z 287.201
β-norT
α-norT
m/z 275.201
androst-4-ene-3β-17β-diol
m/z 255.211
β-1-T
α-T β-T
m/z 289.217
α-1-T
m/z 313.217
THG
m/z 289.217 β –1-T
retention time (min)
Peak
are
a Pe
ak a
rea
Peak
are
a Pe
ak a
rea
Peak
are
a Pe
ak a
rea
(A)
(B)
β-bol α-bol
m/z 287.201
β-norT
α-norT
m/z 275.201
androst-4-ene-3β-17β-diol
m/z 255.211
β-1-T
α-T β-T
m/z 289.217
α-1-T
m/z 313.217
THG
m/z 289.217 β –1-T
retention time (min)
Peak
are
a Pe
ak a
rea
Peak
are
a Pe
ak a
rea
Peak
are
a Pe
ak a
rea
(A)
(B)
β-bol α-bol
m/z 287.201
β-norT
α-norT
m/z 275.201
androst-4-ene-3β-17β-diol
m/z 255.211
β-1-T
α-T β-T
m/z 289.217
α-1-T
m/z 313.217
THG
m/z 289.217 β –1-T
retention time (min)
Peak
are
a Pe
ak a
rea
Peak
are
a P
eak
area
Pe
ak a
rea
Peak
are
a
(A)
(B)
β-bol α-bol
m/z 287.201
β-norT
α-norT
m/z 275.201
androst-4-ene-3β-17β-diol
m/z 255.211
β-1-T
α-T β-T
m/z 289.217
α-1-T
m/z 313.217
THG
m/z 289.217 β –1-T
retention time (min)
Peak
are
a Pe
ak a
rea
Peak
are
a P
eak
area
Pe
ak a
rea
Peak
are
a
(A)
(B)
β-bol α-bol
m/z 287.201
β-norT
α-norT
m/z 275.201
androst-4-ene-3β-17β-diol
m/z 255.211
β-1-T
α-T β-T
m/z 289.217
α-1-T
m/z 313.217
THG
m/z 289.217 β –1-T
retention time (min)
Peak
are
a Pe
ak a
rea
Peak
are
a P
eak
area
Pe
ak a
rea
Peak
are
a
(A)
(B)
β-bol α-bol
m/z 287.201
β-norT
α-norT
m/z 275.201
androst-4-ene-3β-17β-diol
m/z 255.211
β-1-T
α-T β-T
m/z 289.217
α-1-T
m/z 313.217
THG
m/z 289.217 β –1-T
retention time (min)
Peak
are
a Pe
ak a
rea
Peak
are
a P
eak
area
Pe
ak a
rea
Peak
are
a
(A)
(B)

Chapter 4
130
Table 2 demonstrates that if a weak rhSHBG binder is present (at low levels) among other strong binders in the same sample extract, then only the strong binder is identified in the sample extract previously used for the BioMS screening assay. Note that by applying the adjusted BioMS identification approach in which ten times more rhSHBG was used, more low level and/or low affinity steroids are identified. For example, in the rapid identification approach, only β-norT was identified in sample 16 and no β-bol was found. By applying the adjusted BioMS identification procedure, both steroids were found in sample 16 and in sample 21 the gestagen progesterone was additionally identified. In sample nr 15 however, the combination of a low level of β-bol plus its much lower affinity caused the identification of β-T only, both in the direct analysis and in the adjusted BioMS identification approach. For the same reasons, α-norT was not identified in sample 16. The results in Table 2 also stress the consequences when only LC-MS/MS without rhSHBG is applied to find steroids. Sample 18 was reported as blank by the LC-MS/MS method, however the YAB found a compound having bioaffinity and it was suggested that androst-4-ene-3β-17β-diol was present in the “blank” sample. Both the fast and the adjusted BioMS identification approaches identified androst-4-ene-3β-17β-diol in sample 18. This compound was not found by the targeted LC-MS/MS method as the MRM transitions for this compound were not acquired [11]. Moreover, in sample 19, 20 and 22 the steroid β-1-T was identified by the BioMS identification approach with the chip-UPLC-Q-ToF-MS. This steroid was found in sample 19 following the adjusted BioMS identification procedure (see Table 2). β-1-T was also screened suspect by YAB and subsequently identified with parallel LC-fractionation plus ToF-MS in sample 22, but YAB did not identify β-1-T in samples 19 and 20 because these samples were not subjected to that laborious identification approach. Also an estrogen, 17β-estradiol (E2) was found in sample 19 but only using a very sensitive GC-MS/MS instrument (see appendix 4.4 for GC-MS/MS conditions). Additionally, for the identification of estrogenic compounds in dietary supplements a new BioMS method is being developed which uses the estrogen receptor in combination with GC-MS. A supplement screened negative was spiked with the designer steroid THG in order to demonstrate the potential of the method for early discovery of designer steroids in dietary supplements. First the sample was screened suspect by the BioMS screening. Next, the same extract was injected onto chip-UPLC-Q-ToF-MS and the designer steroid THG was identified based on accurate mass and specific product ions (all identifications results shown in appendix 4.3 and appendix 4.5). Since the chip-UPLC-Q-ToF-MS identification set-up was quite sensitive, its use for BioMS screening was briefly explored. To investigate this, four blank and four suspect sample extracts were injected onto the chip-UPLC-Q-ToF-MS and by measuring the T-D3 product ions in accurate product ion scanning mode, the four blank extracts displayed much higher eluted amounts of T-D3 (30±5 pg) compared to the four suspect samples (5±1 pg) (see Figure 2). These results demonstrate that screening can even be performed using the chip-UPLC-Q-ToF-MS used for identification. However, in this study BioMS screening with UPLC-QqQ-MS was preferred as the run time of the latter is much shorter (2 min vs 15 min).

Screening and identification of steroids
131
sam
ple
LC-M
S/M
S [1
1]YA
B [2
]
B
ioM
S w
ith rh
SHB
G
nr.
(MR
M, c
once
ntra
tions
in m
g g-1
)*S
cree
ning
**Id
entifi
catio
n S
cree
ning
**N
ano
iden
tifica
tion
Nan
o id
entifi
catio
n
(U
PLC
-ToF
-MS
w
ith w
ell p
late
fra
ctio
natio
n)
(d
irect
ly in
sc
reen
ing
extra
ct)
(follo
win
g ad
just
ed
bioa
ffini
ty is
olat
ion)
15β-
bol (
0.02
) , β
-T (0
.14)
+
+β-
Tβ-
T
16β-
bol (
0.26
), β-
norT
(1.1
6)+
+
β-no
rT
β-no
rT, β
-bol
α-
bol (
<LoD
), α-
norT
(0.1
)
17β-
bol (
0.15
), α-
bol (
<LoD
),+
+
β-T
β-T,
β-b
ol
β
-T (1
.68)
18-
+an
dros
t-4-e
ne-
3β-1
7β-d
iol
+an
dros
t-4-e
ne-3
β-17
β-di
ol
andr
ost-4
-ene
-3β-
17β-
diol
19β-
E2
(1.7
9), β
-nor
T (0
.45)
, +
+
β-T
β-T,
β-n
orT,
β-1
-T, *
**β-
E2
β-
T (<
LoD
)
20β-
T (0
.68)
+
+β-
T, β
-1-T
β-T,
β-1
-T
21β-
T (1
.47)
, α-T
(0.2
),+
+
β-T,
α-T
β-T,
α-T
, pro
ges.
de
hydr
opro
ges.
(0,0
4), p
roge
s.
(<Lo
D)
22-
+β-
1-T
+β-
1-T
β-1-
T
Tabl
e 2.
Ove
rvie
w o
f scr
eeni
ng a
nd id
entifi
catio
n re
sults
of s
tero
ids
in d
ieta
ry s
uppl
emen
ts b
y LC
-MS
/MS
[11]
, YA
B [2
], th
e B
ioM
S a
ssay
and
Nan
oTile
TM -U
PLC
-Q-T
oF-M
S.

Chapter 4
132
* LoD of LC-MS/MS is 0.01 mg unit-1 (all LC-MS/MS data were adopted from Van Poucke et al. [11]) ** + = screened suspect, - = screened as negative *** β-E2 identified on basis of retention time and two specific MRM transitions with GC-MS/MS (see appendix 4.4 for GC-MS conditions).
Conclusions
For rapid screening, a novel radiolabel-free BioMS assay was developed for rhSHBG binders in dietary supplements featuring high-throughput (the entire the sample treatment, BioMS assay and measuring time was 4h for 96 tests) and the possibility to use the same biopurified extract for subsequent identification using chip-UPLC-Q-ToF-MS with full scan accurate mass measurement. Any strong binder, including unknown designer steroids, can be successfully identified on basis of retention time, accurate mass and product ion spectra. To identify additionally less potent rhSHBG binders in dietary supplements, ten times more rhSHBG can be applied in an adjusted bioaffinity procedure. Only weakly binding steroids might remain undetected when present at low levels. The steroid β-1-T was identified in three samples previously found negative in targeted LC-MS/MS. In the literature, in field of doping control, various targeted and untargeted proteome profiling strategies and gene reporter assays are described, however, these strategies should be viewed only as a screening tool as their biorecognition elements cannot be applied in identifying previously screened compounds [30]. Our results demonstrate that, in contrast to the proteome profiling strategies and reporter gene assays [2, 31], the presented BioMS approach is generic and very fast as both multiple androgens, an estrogen and a gestagen were identified using solely one transport protein. Thus the bioaffinity screening plus identification approach can be a powerful tool for early warning of unknown emerging rhSHBG bioactive designer steroids in dietary supplements and contribute to fight doping in sports.
Acknowledgement
We thank the Dutch Ministry of Economic Affairs, Agriculture and Innovation for financing this research (project no. 7260501). Waters is acknowledged for the loan of a Xevo Q-ToF-MS system equipped with NanoTileTM and TrizaicTM ion source. We would like to thank C. van Poucke for providing all dietary supplements used in this study.

Screening and identification of steroids
133
References
1. Geyer, H., M.K. Parr, K. Koehler, U. Mareck, W. Schänzer, and M. Thevis, Nutritional supplements cross-contaminated and faked with doping substances. J MASS SPECTROM, 2008. 43(7): p. 892-902.
2. Rijk, J.C.W., T.F.H. Bovee, S. Wang, C. Van Poucke, C. Van Peteghem, and M.W.F. Nielen, Detection of anabolic steroids in dietary supplements: The added value of an androgen yeast bioassay in parallel with a liquid chromatography-tandem mass spectrometry screening method. ANAL CHIM ACTA, 2009. 637(1-2): p. 305-314.
3. Maughan, R.J., Contamination of dietary supplements and positive drug tests in sport. J SPORT SCI, 2005. 23(9): p. 883-889.
4. Van Thuyne, W., P. Van Eenoo, and F.T. Delbeke, Nutritional supplements: Prevalence of use and contamination with doping agents. NUTR RES REV, 2006. 19(1): p. 147-158.
5. http://www.wada-ama.org/Documents/World_Anti-Doping_Program/WADP-Prohibited-list/2012/WADA_Prohibited_List_2012_EN.pdf, accessed on 01-02-2012
6. Diel, P., A. Friedel, H. Geyer, M. Kamber, U. Laudenbach-Leschowsky, W. Schänzer, M. Thevis, G. Vollmer, and O. Zierau, Characterisation of the pharmacological profile of desoxymethyltestosterone (Madol), a steroid misused for doping. TOXICOL LETT, 2007. 169(1): p. 64-71.
7. Thevis, M., A. Thomas, and W. Schänzer, Current role of LC-MS(/MS) in doping control. ANAL BIOANAL CHEM, 2011. 401(2): p. 405-420.
8. Thevis, M., T. Kuuranne, H. Geyer, and W. Schänzer, Annual banned-substance review: Analytical approaches in human sports drug testing. DRUG TEST ANAL, 2011. 3(1): p. 1-14.
9. Rambaud, L., F. Monteau, Y. Deceuninck, E. Bichon, F. André, and B. Le Bizec, Development and validation of a multi-residue method for the detection of a wide range of hormonal anabolic compounds in hair using gas chromatography-tandem mass spectrometry. ANAL CHIM ACTA, 2007. 586(1-2 SPEC. ISS.): p. 93-104.
10. Hansen, M., N.W. Jacobsen, F.K. Nielsen, E. Björklund, B. Styrishave, and B. Halling-Sørensen, Determination of steroid hormones in blood by GC-MS/MS. ANAL BIOANAL CHEM, 2011. 400(10): p. 3409-3417.
11. Van Poucke, C., C. Detavernier, R. Van Cauwenberghe, and C. Van Peteghem, Determination of anabolic steroids in dietary supplements by liquid chromatography–tandem mass spectrometry. ANAL CHIM ACTA, 2007. 586(1–2): p. 35-42.
12. Salvia, M.V., E. Vulliet, L. Wiest, R. Baudot, and C. Cren-Olivé, Development

Chapter 4
134
of a multi-residue method using acetonitrile-based extraction followed by liquid chromatography-tandem mass spectrometry for the analysis of steroids and veterinary and human drugs at trace levels in soil. J CHROMATOGR A, 2012. 1245: p. 122-133.
13. Catlin, D.H., M.H. Sekera, B.D. Ahrens, B. Starcevic, Y.C. Chang, and C.K. Hatton, Tetrahydrogestrinone: discovery, synthesis, and detection in urine. RAPID COMMUN MASS SP, 2004. 18(12): p. 1245-1249.
14. Sekera, M.H., B.D. Ahrens, Y.C. Chang, B. Starcevic, C. Georgakopoulos, and D.H. Catlin, Another designer steroid: discovery, synthesis, and detection of ‘madol’ in urine. RAPID COMMUN MASS SP, 2005. 19(6): p. 781-784.
15. Thevis, M., H. Geyer, U. Mareck, and W. Schänzer, Screening for unknown synthetic steroids in human urine by liquid chromatography-tandem mass spectrometry. J MASS SPECTROM, 2005. 40(7): p. 955-962.
16. Mooney, M.H., A.A. Bergwerff, J.A. van Meeuwen, P.B. Luppa, and C.T. Elliott, Biosensor-based detection of reduced sex hormone-binding globulin binding capacities in response to growth-promoter administrations. ANAL CHIM ACTA, 2009. 637(1-2): p. 235-240.
17. Tort, N., J.P. Salvador, and M.P. Marco, Multiplexed immunoassay to detect anabolic androgenic steroids in human serum. ANAL BIOANAL CHEM, 2012. 403(5): p. 1361-1371.
18. Jiang, J., Z. Wang, H. Zhang, X. Zhang, X. Liu, and S. Wang, Monoclonal antibody-based ELISA and colloidal gold immunoassay for detecting 19-nortestosterone residue in animal tissues. J AGRIC FOOD CHEMISTRY, 2011. 59(18): p. 9763-9769.
19. Brun, E.M., A. Hernández-Albors, R. Ventura, R. Puchades, and A. Maquieira, Enzyme-linked immunosorbent assays for the synthetic steroid gestrinone. TALANTA, 2010. 82(4): p. 1581-1587.
20. Jury, H.H., T.R. Zacharewski, and G.L. Hammond, Interactions between human plasma sex hormone-binding globulin and xenobiotic ligands. J STEROID BIOCHEM, 2000. 75(2-3): p. 167-176.
21. Bovee, T.F.H., R.J.R. Helsdingen, A.R.M. Hamers, M.B.M. Van Duursen, M.W.F. Nielen, and R.L.A.P. Hoogenboom, A new highly specific and robust yeast androgen bioassay for the detection of agonists and antagonists. ANAL BIOANAL CHEM, 2007. 389(5): p. 1549-1558.
22. Nielen, M.W.F., J.J.P. Lasaroms, M.L. Essers, M.B. Sanders, H.H. Heskamp, T.F.H. Bovee, J. van Rhijn, and M.J. Groot, The ultimate veal calf reference experiment: Hormone residue analysis data obtained by gas and liquid chromatography tandem mass spectrometry. ANAL CHIM ACTA, 2007. 586(1-2): p. 30-34.

Screening and identification of steroids
135
23. Nielen, M.W.F., T.F.H. Bovee, M.C. Van Engelen, P. Rutgers, A.R.M. Hamers, J.A. Van Rhijn, and L.A.P. Hoogenboom, Urine testing for designer steroids by liquid chromatography with androgen bioassay detection and electrospray quadrupole time-of-flight mass spectrometry identification. ANAL CHEM, 2006. 78(2): p. 424-431.
24. Aqai, P., C. Fryganas, M. Mizuguchi, W. Haasnoot, and M.W.F. Nielen, Triple bioaffinity mass spectrometry concept for thyroid transporter ligands. ANAL CHEM, 2012. 84(15): p. 6488-6493.
25. Avvakumov, G.V., A. Cherkasov, Y.A. Muller, and G.L. Hammond, Structural analyses of sex hormone-binding globulin reveal novel ligands and function. MOL CELL ENDOCRINOL, 2010. 316(1): p. 13-23.
26. Becue, I., C. Van Poucke, and C. Van Peteghem, An LC-MS screening method with library identification for the detection of steroids in dietary supplements. J MASS SPECTROM, 2011. 46(3): p. 327-335.
27. Cherkasov, A., F. Ban, O. Santos-Filho, N. Thorsteinson, M. Fallahi, and G.L. Hammond, An Updated Steroid Benchmark Set and Its Application in the Discovery of Novel Nanomolar Ligands of Sex Hormone-Binding Globulin. J MED CHEM, 2008. 51(7): p. 2047-2056.
28. Cherkasov, A., Z. Shi, M. Fallahi, and G.L. Hammond, Successful in Silico Discovery of Novel Nonsteroidal Ligands for Human Sex Hormone Binding Globulin. J MED CHEM, 2005. 48(9): p. 3203-3213.
29. Tollefsen, K.E., Interaction of estrogen mimics, singly and in combination, with plasma sex steroid-binding proteins in rainbow trout (Oncorhynchus mykiss). AQUAT TOXICOL, 2002. 56(3): p. 215-225.
30. Pinel, G., S. Weigel, J.P. Antignac, M.H. Mooney, C. Elliott, M.W.F. Nielen, and B. Le Bizec, Targeted and untargeted profiling of biological fluids to screen for anabolic practices in cattle. TRAC-TREND ANAL CHEM, 2010. 29(11): p. 1269-1280.
31. Plotan, M., C.T. Elliott, M.L. Scippo, M. Muller, J.-P. Antignac, E. Malone, T.F.H. Bovee, S. Mitchell, and L. Connolly, The application of reporter gene assays for the detection of endocrine disruptors in sport supplements. ANAL CHIM ACTA, 2011. 700(1–2): p. 34-40.

Chapter 4
136
Appendix 4.1
Chemicals
17α-testosterone (4-androsten-17α-ol-3-one, α-T), 17β-testosterone (4-androsten-17β-ol-3-one, β-T), 17β-testosterone-D3 (4-androsten-17β-ol-3-one-16,16,17-d3, T-D3), 17β-estradiol (1, 3, 5(10)-estratrien-3,17β-diol, β-E2), 17α-estradiol (1, 3, 5(10)-estratrien-3,17α-diol, α-E2), 17β-estradiol-3-glucuronide (1, 3, 5(10)-estratrien-17β-ol-3-glucuronide, β-E2-glu), 17β-estradiol-3-sulphate (1, 3, 5(10)-estratrien-17β-ol-3-sulfate, β-E2-sul), 17β-testosterone-glucuronide (4-androsten-3-one-17β-glucuronide, β-T-glu), dihydrotestosterone (5α-androstan-17β-ol-3-one, DHT), zearalenone (zea) α-zearalanol (α-zear), β-zearalanol (β-zear), 4-chloro-testosterone (4-androsten-4-chloro-17β-ol-3-one, Cl-T), equol (3,4-dihydro-3-(4-hydroxyphenyl)-2H-1-benzopyran-7-ol), estrone (1, 3, 5(10)-estratrien-3-ol-17-one, E1), testosterone-17-acetate (4-androsten-3-one-17β-acetate, T-Ac), testosterone-17-cypionate (4-androsten-3-one-17β-cypionate, T-cyp), testosterone-17-decanoate (4-androsten-3-one-17β-decanoate, T-dec), progesterone (4-pregnen-3,20-dione, proges.), 16-dehydroprogesterone (4,16-pregnadien-3,20-dione, dehydroproges.) and cortisol (4-pregnene-11β,17α,21-triol-3,20-dione) were purchased from Sigma-Aldrich Chemie (Zwijndrecht, The Netherlands). 17α-1-testosterone (1,(5α)-androsten-17α-ol-3-one, α-1-T), 17β-1-testosterone (1,(5α)-androsten-17β-ol-3-one, β-1-T), (4-androsten-4-chloro-3,17-dione, CLAD), 17α-19-nortestosterone (4-estren-17α-ol-3-one, α-norT), 17β-19-nortestosterone (4-estren-17β-ol-3-one, β-norT), 17β-boldenone (1,4-androstadien-17β-ol-3-one, β-bol), 17α-boldenone (1,4-androstadien-17α-ol-3-one, α-bol), dehydroepiandrosterone (5-androsten-3β-ol-17-one DHEA), androst-4-ene-3β-17β-diol, tetrahydrogestrinone 13,17-diethyl-17-hydroxy-18,19-dinor-17-pregn-4,9,11-trien-3-one, THG) and 5α-androstane-3β-17β-diol and its seven other isomers were purchased from Steraloids (Newport, RI, US). Acetonitrile (ACN) and methanol (MeOH) were from Biosolve (Valkenswaards, The Netherlands). Formic acid (HCOOH), ethanol (EtOH), EDTA (Triplex), HEPES, sodium azide (NaN3), imidazole and sodium chloride (NaCl) were purchased from Merck (Whitehouse Station, NJ, USA). The 2-(N-Morpholino) ethanesulfonic acid (MES) and N-(3-dimethylaminopropyl)-N-ethylcarbodiimide hydrochloride (EDC) were from Sigma Aldrich Chemie (Zwijndrecht, The Netherlands). Six times His-tagged full-length recombinant human SHBG (purified, 96 kDa dimer) was purchased from Generi Biotech s.r.o. (Hrdadec Kralove, Czech Republic).

Screening and identification of steroids
137
Appendix 4.2
Average amounts (n=2) of T-D3 label recovered from different volumes of rhSHBG-coated beads after pre-incubation with 5 ng of the label and measured by UPLC-QqQ-MS.

Chapter 4
138
App
endi
x 4.
3Th
eore
tical
and
exp
erim
enta
l exa
ct m
asse
s, m
ass
erro
rs, r
eten
tion
times
and
ele
men
tal c
ompo
sitio
n of
β-n
orT,
α-T
, β-T
, and
rost
-4-
ene-
3β-1
7β-d
iol
and
1-β-
T in
sta
ndar
d so
lutio
ns a
nd i
n bi
opur
ified
die
tary
sup
plem
ent
extra
cts
with
chi
p-U
PLC
-Q-T
oF-M
S
follo
win
g sc
reen
ing.
Mea
sure
men
tt R
Expe
rimen
tal
Theo
retic
alM
ass
erro
rEl
emen
tal
com
posi
tion
Acc
urat
e m
ass
prod
uct i
on s
cann
ing
(m
in)
[M+H
]+[M
+H]+
(ppm
)[M
+H]+
(m/z
)
β-T
stan
dard
6.07
289.
217
289.
217
0C
19H
29O
297
.063
, 109
.065
sam
ple
156.
0728
9.21
6
-3C
19H
29O
297
.061
, 109
.061
β-no
rT
stan
dard
5.52
275.
203
275.
201
+7C
18H
27O
210
9.06
3, 1
45.0
61
sam
ple
165.
5327
5.20
3+7
C18
H27
O2
109.
061,
145
.060
β-T
stan
dard
6.07
289.
217
289.
217
0C
19H
29O
297
.064
, 109
.062
sam
ple
176.
0628
9.21
6
-3C
19H
29O
297
.065
, 109
.065
andr
ost-4
-ene
-3β-
17β-
diol
stan
dard
5.83
273.
221
[M-H
2O+H
]+-4
C19
H29
O1
255.
210,
81.
072
sam
ple
185.
8227
3.22
127
3.22
2-4
C19
H29
O1
255.
209,
81.
073
β-T
stan
dard
6.06
289.
217
289.
217
0C
19H
29O
297
.068
, 109
.064
sam
ple
196.
0628
9.22
0
+10
C19
H29
O2
97.0
67, 1
09.0
66

Screening and identification of steroids
139
β-T
stan
dard
6.06
289.
217
289.
217
0C
19H
29O
297
.065
, 109
.061
sam
ple
206.
0828
9.21
6-3
C19
H29
O2
97.0
67, 1
09.0
63
β-1-
T
stan
dard
6.51
289.
216
289.
217
-3C
19H
29O
218
7.14
5, 2
05.1
55
sam
ple
206.
4928
9.21
6-3
C19
H29
O2
187.
150,
205
.157
β-T
stan
dard
6.08
289.
217
289.
217
0C
19H
29O
297
.064
, 109
.061
sam
ple
216.
0828
9.21
6-3
C19
H29
O2
97.0
67, 1
09.0
67
α-T
stan
dard
6.70
289.
216
289.
217
-3C
19H
29O
297
.063
, 109
.067
sam
ple
216.
7228
9.21
6
-3C
19H
29O
297
.065
, 109
.066
β-1-
T
stan
dard
6.52
289.
217
289.
217
0C
19H
29O
218
7.14
6, 2
05.1
55
sam
ple
226.
4828
9.21
6
-3C
19H
29O
218
7.14
2, 2
05.1
53
THG
stan
dard
7.33
313.
215
313.
217
-6C
21H
29O
224
1.16
1, 1
59.0
83
spik
ed s
ampl
e7.
3531
3.21
5
-6C
21H
29O
224
1.15
5, 1
59.0
86

Chapter 4
140
Appendix 4.4
3800 GC Varian 1200 L GC-MS/MS conditions
Derivatization of β-E2. Twenty-five microliters of N-methyl-N-trimethylsilyltrifluoroacetamide solution was added to dried samples and incubated during 1 hour at 60°C. After incubation the mixture is evaporated to dryness under a stream of nitrogen at 55°C and the residue was dissolved in 50 µL of isooctane.
GC conditions.
• injection 1 µl pulsed splitless at 260°C
• initial oven temperature 110°C (1 minute)
• temperature is increased by 20°C min-1 to 260°C, remaining time: 0.5 minutes.
• increasing 1°C min-1 to 266°C, followed by increasing of 20°C min-1 to 340°C.
Total runtime: 20 minutes.
• temperature transfer line 330°C
• constant flow mode, 1.1 mL min-1 helium
• temperature ion volume 250°C
GC column: stationary phase: VF-17ms, film thickness (µm): 0.25 L (m) x ID (mm) x OD (mm): 30 x 0.25 x 0.39, from Agilent Technologies (Santa Clara, CA, USA).
MS/MS conditions: Electron Impact (EI) source was at -70 eV and 250°C while following multiple reaction monitoring (MRM) transitions were measured for β-E2 using argon as collision-induced dissociation gas; m/z 416.2 → m/z 285.2, m/z 416.2 → m/z 326.2 (using collision energy 7 and 6 V respectively).

Screening and identification of steroids
141
App
endi
x 4.
5Th
eore
tical
and
exp
erim
enta
l exa
ct m
asse
s, m
ass
erro
rs, r
eten
tion
times
and
ele
men
tal c
ompo
sitio
n of
β-b
ol, β
-nor
T, α
-T, β
-T, β
-E2,
1-β
-T, T
HG
, pro
ges.
and
an
dros
t-4-e
ne-3
β-17
β-di
ol in
sta
ndar
d so
lutio
ns a
nd in
bio
purifi
ed d
ieta
ry s
uppl
emen
t ext
ract
s w
ith c
hip-
UP
LC-Q
-ToF
-MS
follo
win
g ad
just
ed B
ioM
S id
entifi
catio
n
proc
edur
e.
Mea
sure
men
tt R
Expe
rimen
tal
Theo
retic
alM
ass
erro
rEl
emen
tal c
ompo
sitio
nA
ccur
ate
mas
s pr
oduc
t ion
sca
nnin
g
(m
in)
[M+H
]+[M
+H]+
(ppm
)[M
+H]+
(m/z
)
β-T
stan
dard
6.07
289.
220
289.
217
-10
C19
H29
O2
97.0
65, 1
09.0
63
sam
ple
156.
0728
9.22
0-1
0C
19H
29O
297
.068
, 109
.065
β-bo
l
stan
dard
5.44
287.
200
287.
201
-3C
19H
27O
213
5.08
2, 1
21.0
63
sam
ple
165.
4428
7.20
4+1
0C
19H
27O
213
5.08
5, 1
21.0
65
β-no
rT
stan
dard
5.52
275.
202
275.
201
+4C
18H
27O
210
9.06
4, 1
45.0
61
sam
ple
165.
5227
5.20
3
+7C
18H
27O
210
9.06
2, 1
45.0
63
β-bo
l
stan
dard
5.44
287.
200
287.
201
-3C
19H
27O
213
5.08
1, 1
21.0
63
sam
ple
17-
--
--
β-T
stan
dard
6.00
289.
217
289.
217
0C
19H
29O
297
.065
, 109
.068
sam
ple
176.
0028
9.21
4
+10
C19
H29
O2
97.0
66, 1
09.0
69

Chapter 4
142
[M-H
2O+H
]+ an
dros
t-4-e
ne-3
β-17
β-di
ol[M
-H2O
+H]+
stan
dard
5.82
273.
221
[M-H
2O+H
]+ -4
C19
H29
O1
255.
211,
81.
074
sam
ple
185.
8127
3.22
027
3.22
2-7
C19
H29
O1
255.
210,
81.
071
β-E
2*
stan
dard
13.6
416.
228
5.2,
326
.2
sam
ple
1913
.628
5.2,
326
.2
β-T
stan
dard
6.04
289.
215
289.
217
-7C
19H
29O
297
.065
, 109
.065
sam
ple
196.
0728
9.21
4-1
0C
19H
29O
297
.067
, 109
.061
β-no
rT
stan
dard
5.51
275.
202
275.
201
+3C
18H
27O
210
9.06
1, 1
45.0
61
sam
ple
195.
5327
5.20
3+7
C18
H27
O2
109.
064,
145
.062
β-1-
T
stan
dard
6.51
289.
214
289.
217
-10
C19
H29
O2
187.
143,
205
.153
sam
ple
196.
4928
9.21
5
-7C
19H
29O
218
7.14
5, 2
05.1
55
β-T
stan
dard
6.00
289.
214
289.
217
-10
C19
H29
O2
97.0
69, 1
09.0
68
sam
ple
206.
0128
9.21
5-7
C19
H29
O2
97.0
66, 1
09.0
64
β-1-
T
stan
dard
6.51
289.
214
289.
217
-10
C19
H29
O2
187.
149,
205
.159

Screening and identification of steroids
143
sam
ple
206.
4928
9.21
6
-3C
19H
29O
218
7.15
0, 2
05.1
60
β-T
stan
dard
6.01
289.
217
289.
217
0C
19H
29O
297
.067
, 109
.062
sam
ple
216.
0128
9.21
9+7
C19
H29
O2
97.0
69, 1
09.0
64
α-T
stan
dard
6.70
289.
216
289.
217
-3C
19H
29O
297
.062
, 109
.069
sam
ple
216.
7228
9.21
8+3
C19
H29
O2
97.0
63, 1
09.0
67
prog
es.
stan
dard
8.06
315.
230
315.
232
-6C
21H
31O
297
.065
, 109
.063
sam
ple
218.
0631
5.23
1
-3C
21H
31O
297
.061
, 109
.061
β-1-
T
stan
dard
6.51
289.
219
289.
217
+7C
19H
29O
218
7.15
1, 2
05.1
53
sam
ple
226.
5128
9.22
0
+10
C19
H29
O2
187.
145,
205
.155
THG
stan
dard
7.32
313.
215
313.
217
-6C
21H
29O
224
1.15
5, 1
59.0
82
spik
ed s
ampl
e7.
3631
3.21
6
-3C
21H
29O
224
1.15
1, 1
59.0
85
* β-E
2 id
entifi
ed o
n ba
sis
of re
tent
ion
time
and
spec
ific
prod
uct i
ons
with
GC
-MS
/MS
follo
win
g de
rivat
izat
ion
with
N-m
ethy
l-N-tr
imet
hyls
ilyltr
ifluo
roac
etam
ide.


5Receptor-based high-throughput screening and
identification of estrogens in dietary supplements using bioaffinity liquid-chromatography ion mobility mass
spectrometry
Aqai, P., N. Gómez Blesa, H. Major, M. Pedotti, L. Varani, V.E.V. Ferrero, W. Haas-noot, M.W.F. Nielen, Analytical and Bioanalytical Chemistry,
2013. 405 (29), pp 9427-9436.

Chapter 5
146
Abstract
A high-throughput bioaffinity liquid chromatography-mass spectrometry (BioMS) approach was developed and applied for the screening and identification of recombinant human estrogen receptor α (ERα) ligands in dietary supplements. For screening, a semi-automated mass spectrometric ligand binding assay was developed applying 13C2,
15N-tamoxifen as non-radioactive label and fast ultra-high-performance–liquid chromatography–electrospray ionization–triple-quadrupole-MS (UPLC-QqQ-MS), operated in the single reaction monitoring mode, as a readout system. Binding of the label to ERα-coated paramagnetic microbeads was inhibited by competing estrogens in the sample extract yielding decreased levels of the label in UPLC-QqQ-MS. The label showed a high ionisation efficiency in positive electrospray ionisation (ESI) mode, so the developed BioMS approach is able to screen for estrogens in dietary supplements despite their poor ionisation efficiency in both positive and negative ESI modes. The assay was performed in a 96-well plate, and all these wells could be measured within 3 h. Estrogens in suspect extracts were identified by full-scan accurate mass and collision-cross section (CCS) values from a UPLC-ion mobility-Q-time-of-flight-MS (UPLC-IM-Q-ToF-MS) equipped with a novel atmospheric pressure ionisation source. Thanks to the novel ion source, this instrument provided picogram sensitivity for estrogens in the negative ion mode and an additional identification point (experimental CCS values) next to retention time, accurate mass and tandem mass spectrometry data. The developed combination of bioaffinity screening with UPLC-QqQ-MS and identification with UPLC-IM-Q-ToF-MS provides an extremely powerful analytical tool for early warning of ERα bioactive compounds in dietary supplements as demonstrated by analysis of selected dietary supplements in which different estrogens were identified.

147
Screening and identification of estrogens
Introduction
In 2006, the nutritional supplement market was worth US$ 60 billion and is growing continuously [1]. Supplements are widely available in local stores and on the Internet and easy to order for (professional) athletes to enhance their performance and for ordinary people. However, several investigations have shown the deliberate and unintentional addition of (pro)hormones to supplements [2-7]. Labels of these supplements are often incomplete or incorrect [4,7]. The presence of anabolic steroids in supplements is banned in the European Union (EU) and USA. Despite this, various supplements are easily accessible to consumers. Geyer et al. described that 21% of supplements purchased in the EU contained anabolic steroids [7]. Generally, they assumed that the presence of steroids in supplements is a result of accidental cross-contamination during either manufacturing or packaging [7]. As an example of deliberate addition of steroids to herbal supplements, Toorians et al. presented in their study the presence of diethylstilbestrol (DES) in a supplement marketed on the Internet for prostate problems [4]. Due to the high intake of DES (4.1 ± 0.1 mg g-1) through these pills, the male consumer of this herbal supplement developed abnormally large mammary glands. In modern laboratories, gas chromatography-mass spectrometry (GC-MS) and liquid chromatography (LC)-tandem mass spectrometry (MS/MS) are used for the fast, sensitive and specific detection of steroids [8-10], appetite suppressors [11], mycotoxins [12] and pharmaceuticals [13] in dietary supplements. In order to achieve the highest sensitivity and selectivity, both GC-MS and LC-MS/MS are set up in pre-selected ion or ion transition acquisition modes [14-17,9]. In this way, only known compounds can be measured, and new estrogenic compounds may escape from routine testing and remain undetected. Alternatively, biorecognition-based assays, using, e.g. the estrogen receptor (ER), are used for rapid screening of estrogenic compounds. However, non-immobilised ER tends to be very sensitive to slight changes in, e.g. temperature, salt concentration and pH [18]. Usami et al. [19] developed a surface plasmon resonance (SPR)-based biosensor assay in which 17β-estradiol (E2) was used as a ligand, human recombinant ERα for biorecognition and test chemicals as competitors. By means of this biosensor assay, dissociation constants for the binding of estrone (E1), β-E2, estriol (E3), tamoxifen (Tamo), DES, bisphenol A (BPA) and 4-nonylphenol were determined. Blair et al. [20] determined the relative binding affinity for a large group of chemicals by using an ERα competitive ligand binding assay. In this radio receptor assay, ER was obtained from rats, and [3H]-E2 was used as the competing label. The obvious disadvantages of this assay include the use of a radiolabel and the long assay time of 24h. The combination of a bioaffinity extraction with MS detection could serve as a powerful tool for the identification of known and unknown estrogenic compounds. Choi et al. developed a screening assay for ligands of the estrogen receptor based on magnetic microparticles and LC-MS [21]. Although this method was capable of

Chapter 5
148
screening genistein and daidzein in botanical extracts, the throughput of this method was low, and a high amount of the costly estrogen receptor was required due to the low affinity of the phytoestrogens [22,23]. De Vlieger et al. [24] developed an on-line dual post-column estrogen receptor affinity assay based on fluorescence (limit of detection (LOD) 4.7 nM) and parallel detection by MS (LOD 40 nM) for quantification and identification purposes of estrogenic compounds. However, in order not to decrease receptor activity by the LC mobile phase gradient, a make-up gradient had to be added post-column in order to dilute the organic solvent content, thus complicating the setup. To decrease protein consumption and to omit the make-up gradient, pre-column bioaffinity MS methods have been described in literature as well [25-28]. Niessen et al. developed an off-line competitive MS binding assay for determining the binding affinity of dopamine receptor ligands using spiperone as a label [27]. That binding assay was presented as a possible alternative to radiolabeled assays; however, since only the unbound fraction of the marker was measured, at best, indirect information was obtained about the bound ligands. Moreover, because of the use of a non-volatile buffer, an additional SPE step was required prior to LC-MS detection. Due to the solid-phase extraction (SPE) step and the absence of microtiter plates, high-throughput screening was not feasible. Zepperitz et al. described a competitive MS binding assay in which the γ-aminobutyric acid transporter-bound fraction of the label was measured after elution with methanol [25]. Although that method had the potential for high-throughput characterisation of new drug candidates, the format was used for kinetic measurements in buffer only, and no screening in real samples was performed. By the lengthy (30-60 min) filtration steps during wash and dissociation steps, the method became longer and less straightforward. In general, these off-line pre-column bioaffinity MS methods are focused on determining affinities, and no screening or identification is performed for food or environmental contaminants [25-28]. In a previous bioaffinity MS (BioMS) study, a mass spectrometric ligand binding assay was presented in pre-column format in which recombinant human sex hormone-binding globulin (rhSHBG) and LC-MS were used for screening and identification of androgenic and estrogenic (designer) steroids in dietary supplements [29]. Although that method was rapid and able to identify (un)known rhSHBG binders in supplements, the screening of estrogens other than β-E2 was not feasible due to the low affinity; moreover, identification of this estrogen could only be achieved following derivatisation and GC-MS/MS. In the present work, a semi-automated high-throughput BioMS method is presented in which the recombinant ligand binding domain (LBD) of human ERα and dedicated modes of fast ultra-high performance liquid chromatography (UPLC)-MS are used for screening and identification of estrogenic steroids in dietary supplements. Since estrogens have poor ionisation efficiencies in both positive and negative electrospray ionisation (ESI) modes [30,31], a label having excellent ionisation efficiency in ESI

149
Screening and identification of estrogens
is required for the rapid screening of estrogens. Therefore, a mass spectrometric ligand binding assay was developed based on 13C2,15N-tamoxifen as label, which has a high ionisation efficiency in positive ESI and fast UPLC-electrospray ionisation-triple-quadrupole-MS (UPLC-QqQ-MS), operated in the single reaction monitoring (SRM) mode, as readout system for the detection and quantification of the non-radioactive label. The LBD of ERα was immobilised covalently and non-covalently onto paramagnetic microbeads using two different surface chemistries. To identify the estrogens, a UPLC-ion mobility-Q-ToF-MS equipped with a novel atmospheric pressure ion source [32] was used to obtain adequate ionisation efficiency, retention time, collision cross-section (CCS) values and high-resolution full-scan accurate mass data. This novel ion source was evaluated for the first time in negative ion mode. Several dietary supplements were screened for ER binders, and, in suspect samples, different estrogens were identified to demonstrate the applicability of this newly developed ERα-based BioMS approach.
Materials and method
Materials
Tamoxifen (2-{4-[ (1Z)-1,2-diphenylbut-1-en-1-yl] phenoxy}-N,N-dimethylethanamine, Tamo), 13C2,15N-tamoxifen (tamoxifen-15N,N,N-dimethyl-13C2 (13C2,15N-Tamo)), zearalenone (Zon), BPA, naringenin (Nar), β-sitosterol (β-Sito), 2-(N-morpholino) ethanesulfonic acid (MES) and N-(3-dimethylaminopropyl)-N-ethylcarbodiimide hydrochloride (EDC) were purchased from Sigma-Aldrich Chemie (Zwijndrecht, The Netherlands). 17β-estradiol (β-E2), 17α-estradiol (α-E2), 17α-ethinyl estradiol (EE2), estrone (E1) and diethylstilbestrol (DES) were purchased from Steraloids (Newport, RI, US). Acetonitrile (ACN) and methanol (MeOH) were from Biosolve (Valkenswaard, The Netherlands) and formic acid (HCOOH), EDTA (Triplex), HEPES, sodium azide (NaN3), imidazole and sodium chloride (NaCl) from Merck (Whitehouse Station, NJ, USA). The purified recombinant his-tagged wild-type ligand binding domain (LBD) of the human estrogen receptor α (ERα, 25 kD) was kindly provided by Dr Luca Varani of the Institute for Research in Biomedicine (Bellinzona, Switzerland). The LBD was over-expressed in E.Coli, refolded from inclusion bodies and purified with His-tag affinity and size exclusion chromatography. LoBind Tubes were provided by Eppendorf (Hamburg, Germany) and LoBind 96-well micro flat bottom plates (655161) and 96-well micro V-shaped bottom plates (651201) by Greiner Bio-One B.V. (Alphen a/d Rijn, The Netherlands). Water purification was performed using a Milli-Q system (Milipore, Bedford, MA, USA). SiMAG-Carboxyl microbeads (product number 1402-1, 1 µm diameter) and SiMAG-IDA/Nickel microbeads

Chapter 5
150
(product number 1512-1, 1 µm diameter) were supplied by Chemicell GmbH (Berlin, Germany). The Milliplex magnet Handheld Magnetic Separator Block for 96-well flat-bottom plates was purchased from Milipore, the microtiter plate vari-shaker from Dynatech (Alexandria, VI, USA), the REAX2 head-over-head shaker from Heidolph (Schwabach, Germany) and the automatic magnetic wash station BioPlexTM pro II from BioRad Laboratories B.V. (Veenendaal, The Netherlands).
Instrumentation
Ultra-high performance liquid chromatography–triple-quadrupole mass spectrometry
A Waters (Milford, MA, USA) Acquity Ultra-Performance LC (UPLC) system, consisting of a degasser, a binary gradient pump, an auto sampler (at 10 °C) and a column oven (at 50 °C), was used. The injection volume was 10 μL and the analytical column an Acquity UPLCTM BEH 1.7 μm C18, 50 x 2.1 mm I.D. from Waters. The UPLC system was coupled to a Micromass (Manchester, UK) Quattro Platinum tandem mass spectrometry (QqQ) system equipped with an ESI source used in positive ion mode. The two mobile phases consisted of (A) H2O/HCOOH (99.9/0.1%, v/v) and (B) ACN/HCOOH (99.9/0.1%, v/v) and the flow rate was 0.3 mL min-1. The gradient started at 30% B for 0.30 min, increased sharply to 95% B in 0.10 min with a hold for 1.10 min and returned to the initial state in 0.05 min with a final hold of 0.45 min. The total run time was 2 min only. The UPLC was interfaced with the ESI MS/MS instrument without a flow split. The ESI capillary voltage was +2.7 kV, and the cone voltage was 30 V. The desolvation gas was nitrogen (700 L/h) with a temperature of 350 °C, the source temperature was 120 °C, and the collision-induced dissociation gas was argon at a pressure of 2.5 × 10⁻³ mbar. Data acquisition for 13C2,15N-Tamo, which was used as label in this study, was performed in SRM mode at transition m/z 375.2→ m/z 75.3 using collision energy 25eV.
Ultra-high performance liquid chromatography–ion mobility–quadrupole–time-of-flight mass spectrometry
Chromatography was performed on an Acquity UPLC system consisting of a degasser, a binary gradient pump, an auto sampler (at 10 °C) and a column oven at 50 °C. The UPLC system was coupled to a Synapt G2-S (Waters) ion mobility-quadrupole-time-of-flight-MS (IM-Q-ToF-MS) system equipped with a novel atmospheric pressure ionisation (API) source. In this API source design [32], a high-velocity droplet stream is impacting on a high-voltage electrode (see also appendix 5.2). The injection volume of the sample from a 384-well plate was 10 μL and the

151
Screening and identification of estrogens
analytical column was an Acquity UPLCTM BEH 1.7 μm C18, 50 x 2.1 mm I.D. from Waters. The mobile phase consisted of (A) H2O/NH4OH (99.9/0.1%, v/v) and (B) MeOH/NH4OH (99.9/0.1%, v/v), in order to support negative ion formation for estrogens. After injection, separation was done using gradient elution at a constant flow rate of 0.6 mL min-1. The gradient started at 30% B for 0.3 min followed by a linear increase to 95% B in 0.1 min with a hold of 1.1 min and from 95% to 30% B in 0.05 min with a hold of 0.45 min, prior to the next injection. The prototype ion source was operated in the negative ion mode at 150 °C and a voltage of -4 kV with a cone voltage of -40 V. In order to get extra structural information, MSe was applied, which means simultaneous scans at low (20 eV) and high collision energy (ramped from 20 to 55 eV) in separated data acquisition functions. Additionally, in order to measure specific product ions at the highest sensitivity, the Q-ToF-MS was also operated in accurate mass product ion scanning mode. The ion mobility separation was performed under the following conditions: trap collision energy -4.0 V, transfer collision energy -2.0 V, IM gas N2, IMS gas flow 90 mL min-1; IM wave height -40 V; IM wave velocity 800 m/s. As lock mass, a solution of leucine-enkephalin was continuously introduced by a separate lock mass probe at a flow rate of 10 μL min-
1. For accurate mass calibration of the m/z axis, m/z 554.2615 was used as a lock mass in negative ion mode.
Methods
The protocols for immobilisation of the ERα LBD on the two types of paramagnetic beads are described in appendix 5.1
Sample preparation
The primary extraction of steroids from dietary supplements was based on the procedure described by Rijk et al. [33], which was simplified by omitting the SPE and evaporation steps. The dietary supplements were ground, and 0.05 gram was weighed into a 10 mL plastic tube. To this tube, 2 mL MeOH and 2 mL H2O were added for extraction of steroids. First, the tubes were placed in an ultra-sonic bath for 10 min, followed by 15 min head-over-head mixing. The tubes were centrifuged at 3000 x g for 10 min, the supernatant was transferred into glass vials and diluted five times with PBST buffer (9 g NaCl, 0.76 g Na2HPO4, 0.17g KH2PO4, 2 mL Tween-20 25% in 1 L H2O) from which 100 µL was used in the BioMS assay for screening and identification purposes.

Chapter 5
152
BioMS screening
First, 100 µL of PBST was added to each well of a 96-well flat-bottom plate, followed by the addition of 6 µL of ERα-coated Ni2+- or COOH-beads. Then, the Milliplex magnetic plate (Millipore, Bedford, MA, USA) was used to magnetise the beads against the well wall in one min after which the supernatants were removed. Next, 0.5 ng of label (13C2,15N-Tamo) in 100 µL PBST (with or without addition of competing estrogens) was added to the wells. To construct dose-response curves, various competitors were added between 0 and 1000 ng. In case of screening of supplement extracts, 0.5 ng of label in 100 µL supplement extract (five times diluted) was added to the beads in the wells. Following the addition of the label, the mixture was incubated for 15 min on a shaker at 500 rpm (Dynatech Alexandria, VI, USA). To remove the unbound label and unbound competitors, the automatic magnet wash station was used to wash the 96-well plate three times with PBST buffer. After the wash cycle, 70 µL PBST buffer were added to each well, and the content of each well was transferred by an eight-channel pipette into a new 96-well flat-bottom plate. This step was done prior to the elution step, in order to exclude non-specific binding of competitors to the surface of the well-plate. The well-plate was placed on the magnetic plate, and after 1 min, the supernatants were removed. To elute all bound label and bound competitors, 50 µL of elution solution (H2O/ACN/HCOOH, 49/50/1 %, v/v/v) was added to the wells, and the plate was shaken for 2 min (500 rpm). With the help of the magnetic plate, the supernatants with all the eluted compounds were transferred to a 384-well plate for rapid UPLC-QqQ-MS screening. The total duration of this BioMS assay procedure was 30 min for 96 samples. Dose-response curves were fitted using the five-parameter curve fitting in the GraphPad Prism software of GraphPad Software Inc. (La Jolla, CA, USA).
Bioaffinity isolation prior to chemical identification
The bioaffinity isolation procedure deviates from the BioMS screening by the use of five times more ERα-coated beads without label. So, 30 µL of ERα-coated beads (either Ni2+ or COOH) was added to the plate. After diluting the primary supplement extract in PBST, 100 µL were added to the plate, incubated for 15 min, and the same procedure was followed as described for the screening, except that the UPLC-IM-Q-ToF-MS was used for identification. The total duration of this bioaffinity purification procedure was <30 min for 96 samples.

153
Screening and identification of estrogens
Results and Discussion
BioMS screening assay
The principle of the BioMS screening assay is based on competition between the 13C2,15N-Tamo label and any known or unknown estrogenic compound in a sample for binding to the LBD of the ERα coupled to paramagnetic microbeads. The amount of label recovered by the elution solution decreases if a competing ERα binder, e.g. β-E2, is present in a sample. The limit of detection (LOD) of the 13C2,15N-Tamo label in the UPLC-QqQ-MS was determined as 500 fg on-column (S/N > 6). This estrogenic compound was chosen because of its very high ionisation efficiency in ESI+ due to the high proton affinity of its tertiary amine substructure. This is in sharp contrast to other estrogens, of which most are phenolic and show poor ionisation in both ESI+ and ESI–. During the development of the semi-automated BioMS screening assay, various parameters were optimised, such as LC conditions for the label, relative amounts of label and receptor required for reproducible measurements, influence of buffer composition and incubation, wash and elution conditions. After testing different amounts of label with different amounts of beads and elution solvents (data not shown), the optimum amount of added label was 0.5 ng per test when using H2O/ACN/HCOOH (49/50/1 %, v/v/v) as the elution solvent. The optimum amounts of the two types of beads, oriented non-covalent immobilised His-tagged ERα onto Ni2+-coated paramagnetic beads versus non-oriented covalent coupled ERα onto COOH-coated paramagnetic beads, were investigated (see appendix 5.3). The absolute eluted amounts of label increased with increasing amounts of the two types of ERα-coated beads (from 1 to 45 pg using 2 to 10 µL of ERα-coated Ni2+-beads and from 2 to 55 pg using 2 to 10 µL of ERα-coated COOH-beads). The amount of label found in a negative control without any ERα-coated beads was close to the LOD, which proved that only the ER was responsible for capturing the label. The results in appendix 5.3 demonstrate that, when ERα is immobilised in a non-oriented covalent manner, slightly higher label yields are obtained. It is important to note that the immobilisation procedure of Ni2+-beads is shorter than with COOH-beads (1 versus 3 h, see the appendix 5.1). The stability of ERα-coated beads stored at 4 °C was determined to be 2 weeks for both bead types, which is in sharp contrast to non-immobilised ERα, which is stable for <1 day at 4 °C [18]. Further experiments proved that 6 µL of both types of ERα-coupled beads yielded reproducible label recoveries and, in the presence of estrogens, good competition. This means that, with each immobilised bead stock, 83 tests can be performed, however, multiple bead stocks can easily be prepared in parallel. Typical reconstructed UPLC-QqQ-MS chromatograms of the eluted label from non-oriented covalently coupled ERα-coated beads (Figure 1) illustrate the fast analysis, with a total run time of 2 min, and the effect of a competitor on the amount of label measured with the BioMS screening assay.

Chapter 5
154
Figure 1. Reconstructed UPLC-QqQ-MS SRM chromatograms showing the peak areas and retention time of the label (13C2,15N-Tamo) eluted from 6 µL of ERα-coated COOH beads in the absence (▲) and in
the presence of 1 ng (▼) and 10 ng (•) of β-E2 as the competitor.
Dose-response curves were constructed with ERα-coated COOH-beads for different estrogenic compounds in buffer (Figure 2).
Figure 2. Normalized average dose-response curves (n=2) for α-E2 (▲), β-E2 (▼), EE2 (●), DES (x) and BPA (+) in PBST buffer obtained by the BioMS screening assay using 6 µL of ERα-coated COOH beads
and UPLC-QqQ-MS.
Sensitivities at 50% inhibiting concentration (IC50) were found to range from 4 ng mL-1 (0.4 ng absolute) for EE2 as the strongest binder to 550 ng mL-1 (55 ng absolute) for BPA as the weakest binder, and all curves illustrate good precision of the method. For clarity, the dose-response curves of E1, E3, Tamo, Zon and Nar are not shown in this figure, but the calculated IC50 values are given in Table 1. The same dose-response curves were made with Ni2+-beads and in Table 1, all IC50 values are summarised.
Retention time (min)
Are
a 13
C2,15
N-T
amo
Competitor (ng)
Bin
ding
of 13
C2,15
N-T
amo
(%)

155
Screening and identification of estrogens
Tabl
e 1.
IC50
val
ues
and
rela
tive
bind
ing
(RB
) of v
ario
us E
Rα
com
petit
ors
in th
e B
ioM
S a
ssay
as
mea
sure
d by
13C
2,15N
-Tam
o la
bel r
espo
nse
in th
e U
PLC
-QqQ
-M
S c
ompa
red
with
lite
ratu
re d
ata
from
oth
er a
ssay
s (F
P co
mpe
titiv
e in
hibi
tion
assa
y [3
4], S
PR
-bas
ed b
iose
nsor
[19]
, the
YE
B [2
2] a
nd ra
diol
abel
rece
ptor
ass
ay
(RR
A) [
20,3
5,36
].
B
ioM
SFP
[34]
SP
R [1
9]Y
EB
[22]
R
RA
[20]
Ni2+
bea
dsC
OO
H b
eads
Com
petit
orIC
50R
BIC
50R
BIC
50R
B
KD
aE
C50
RE
Pb
IC50
RB
(ng
mL-1
)
(ng
mL-1
)
(ng
mL-1
)
(nM
)(n
g m
L-1)
(n
g m
L-1)
EE
28
1.25
41.
25
0.15
1.2
0.15
1.7
β-E
210
15
13.
61
0.4
0.14
-0.2
81.
00.
251
α-E
260
0.17
200.
25
1.96
0.07
8.1
0.03
E1
200.
56
0.83
146
0.02
4.29
0.76
0.2
3.0
0.08
E3
550.
1830
0.17
0.8
350.
012.
70.
09
DE
S14
0.71
70.
72.
91.
180.
10.
161.
00.
055,
2,4
[35]
Tam
o45
0.22
150.
3310
00.
0322
Zon
700.
1412
0.42
33
5E-3
BPA
400
3E-3
550
9E-3
14E
34E
-413
.5E
3
5E
35E
-5
Nar
250
4E-3
300.
17
2.5
E4
<1E
-5
0.
01-0
.07
[36]
β-S
ito–
––
–
– [2
3]–
–
[36]
En
dash
mea
ns n
o IC
50 v
alue
obt
aine
d as
no
bind
ing
was
obs
erve
d w
ithin
the
conc
entra
tion
rang
e te
sted
.a D
isso
ciat
ion
cons
tant
s (K
D) o
f ER
α an
d es
troge
ns o
btai
ned
with
SP
R b
iose
nsor
(the
low
er th
e K
D va
lue,
the
high
er th
e af
finity
).
b Rel
ativ
e es
troge
nic
pote
ncy
(RE
P) o
f com
poun
ds w
ith E
Rα.

Chapter 5
156
In dietary supplements, intentionally added estrogenic compounds are typically present at high levels (60 to 1,800 µg g-1) [4,9] which would correspond to final concentrations in the BioMS screening assay between 0.15 and 4.5 µg mL-1 which is far above the IC50 values obtained with the estrogens in the BioMS screening. The developed BioMS assay showed in general lower sensitivities compared with alternative receptor-based assays in the literature, such as the yeast estrogen bioassay (YEB), the tritium-label displacement method and the fluorescent polarisation (FP) competitive inhibition assay [22,34,20,35,36]. However, the BioMS sensitivities are more than adequate for the screening of estrogenic compounds in dietary supplements. Relative binding (RB) values for various ERα competitors (see Table 1) were calculated by dividing the IC50 value of β-E2 (RB=1) by those of other competitors and RB values <1 represent binders having lower affinity towards ERα. In literature, affinities of ERα binders were investigated by the FP competitive inhibition assay, the SPR-based biosensor assay, the YEB and tritium-labelled displacement approaches [22,34,20,35,36]. The calculated RB values from our BioMS screening method and the values obtained from literature compare generally well (Table 1): Similar weak and strong binders are found in the BioMS assay (EE2>β-E2>DES=E1>E3>BPA). The slightly lower IC50 values obtained with COOH-beads than those with the Ni2+-beads are possibly due to the influence of the different immobilisation approaches.
BioMS screening of estrogens in dietary supplements
To investigate the performance of our new BioMS screening, 13 different dietary supplements, previously analyzed for the presence of estrogens by another BioMS method using sex hormone-binding globulin (SHBG) as a biorecognition element [29] and LC-MS/MS [9] or LC-Q-ToF-MS [4], were screened again using the newly developed BioMS screening method based on ERα (Figure 3). From the 13 dietary supplements, samples 1-10 were previously screened as blanks, and samples 11-13 were expected to contain estrogenic compounds. Sample 11 is a herbal food supplement marketed as ‘a non-estrogenic mixture’ for the treatment of mild prostate cancer and is described by its manufacturer as a pharmaceutical that is tested for toxicity in a trial with prostate cancer patients. However, this supplement showed a strong effect in the yeast estrogen bioassay [4] and by using LC-ToF-MS method, this was caused by very high levels of DES (4.1 ± 0.1 mg g-1). Sample 12 is a suspect dietary supplement that was ordered via the Internet, intercepted by the Belgian inspection at the post-office and when analyzed with conventional LC-MS/MS, the results revealed the presence of several steroids including β-E2 [9]. Indeed that steroid was also screened suspect with the SHBG-based BioMS approach [29]. The third suspect sample (sample 13) was a birth control pill containing 30 µg EE2 per pill.

157
Screening and identification of estrogens
Figure 3. BioMS screening results of blank (sample 1 to 10) and positive (sample 11 to 13) dietary supplements (using ERα-coated Ni2+- (black bars) and COOH-beads (grey bars)). Data are the mean of
duplicate analysis (dash line shows the level of decision for both bead types).
Figure 3 shows the screening results of the BioMS using both ERα-coated Ni2+- and COOH-beads. The BioMS assay results show that the blanks gave average eluted amounts of label of 51±10 and 42±7 pg using ERα-coated COOH- and Ni2+-beads, respectively. Decision levels calculated from these data (average minus 3 times SD) indicate that label levels below 21 pg pinpoint to suspect samples for both types of beads. Indeed, the known suspect samples gave eluted amounts of label below that decision level (7±4 and 6±2 pg for the ERα COOH- and Ni2+-beads, respectively). Since phytosterols and phytoestrogens may occur in sports supplements, the potential binding of these compounds to ERα was investigated. The labels of supplements 3 and 8 declared the presence of 10 mg of phytosterols β-sitosterol, campesterol and stigmaterol. As these supplements were screened as blanks, no false-positive results are obtained in the BioMS screening by the presence of 10 mg/pill phytosterol in dietary supplements. The affinities of phytoestrogens such as daidzein, genistein, enterolactone and equol are reported to range from very low affinity to no affinity towards ERα [22,23] causing no false positive results in the BioMS screening. Phytoestrogens such as genistein and daidzein bind to ERα when high amounts of ERα are used (e.g. 20 µg) [21], however in the BioMS screening, <0.6 µg was used. The results show that the BioMS screening assay using 13C2,15N-
( )Sample (nr)
Elu
ted
amou
nt o
f 13C
2,15N
-Tam
o (p
g)

Chapter 5
158
Tamo as a label and fast UPLC-QqQ-MS as a read-out system is fit for purpose of screening any (un)known estrogens in dietary supplements.
BioMS chemical identification of estrogens
In this study, a UPLC-IM-Q-ToF-MS system equipped with a novel API source was used. The ionisation mechanism is based on a high-velocity droplet stream impacting on a high-voltage electrode. An image of the novel ion source is included in appendix 5.2. A major advantage of such a “multi-source” is that it ionises a wide range of polarities in a single chromatographic run without switching between ESI and APCI. Compared to state-of-the-art ESI, higher ionisation efficiencies were obtained in both negative (see appendix 5.4) and positive ion modes [32]. The UPLC-IM-Q-ToF-MS system also acquires ion mobility drift time data from which CCS values can be derived, which offer an additional orthogonal identification point next to retention time, accurate mass and MS/MS data. The experimental CCS values and can be compared with the theoretical CCS values from modelling software (e.g. MOBCAL). As an example, Figure 4 shows typical UPLC-IM-Q-ToF-MS reconstructed accurate mass ion chromatograms, highlighting the fast and good separation, even for isobaric estrogen isomers, including the accompanying ion mobility drift times. Additionally, Figure 5 illustrates a 3D view of retention times and ion mobility drift times of a standard mixture of DES, EE2 and β-E2.

159
Screening and identification of estrogens
Figure 4. Reconstructed UPLC-IM-Q-ToF-MS ion chromatograms (within ± 0-2 ppm window) of (A) DES, (B) EE2 and (C) the isomers β-E2 and α-E2 (all standards, 1 ng on-column) and of DES (D) in the extract
of suspect sample nr 11.
(A)
(B)
(C)
(D)
Pea
k ar
eaP
eak
area
Pea
k ar
eaP
eak
area
Retention time (min)

Chapter 5
160
Figure 5. 3D view of retention and ion mobility drift times (within m/z 200-350) of a standard mixture of 10
ng mL-1 β-E2, EE2 and DES analyzed by the UPLC-IM-Q-ToF-MS system.
In Table 2, all identification results for estrogens in the suspect dietary supplements obtained by UPLC-IM-Q-ToF-MS are summarised and compared with literature data [4,9]. All suspect samples were subjected to identification using both ERα-coated Ni2+- and COOH-beads, and two different biopurified extracts were prepared: “screening extracts” (using the normal amount of beads plus label) and “dedicated identification extracts” (i.e. five times more beads without the addition of label). The screening extracts were used for rapid identification, and the identification extracts were prepared to increase the chance to detect compounds having very low RB values in the BioMS approach. In the three positive samples of Figure 3, β-E2, EE2 and DES were identified on basis of retention time, accurate mass and MS/MS spectra (in accurate product ion scanning mode), ion mobility drift times and CCS values.

161
Screening and identification of estrogens
Tabl
e 2.
The
oret
ical
exa
ct m
asse
s, e
lem
enta
l com
posi
tion
and
expe
rimen
tal a
ccur
ate
mas
s, m
ass
erro
rs, r
eten
tion
times
, drif
t tim
es a
nd C
CS
val
ues
of E
E2,
β-E
2
and
DE
S in
sta
ndar
d so
lutio
ns a
nd in
die
tary
sup
plem
ent,
affin
ity e
xtra
cted
with
two
Bio
MS
pro
toco
ls a
nd id
entifi
ed u
sing
UP
LC-IM
-Q-T
oF-M
S.
Mea
sure
men
tTy
pe o
f E
Rα
Ext
ract
t RE
xper
imen
tal
Theo
retic
alM
ass
erro
rE
lem
enta
l co
mpo
sitio
nA
ccur
ate
mas
s pr
oduc
t ion
sc
anni
ng
Drif
t tim
esC
CS
Exp
CC
STh
eory
(Sam
ple
nr)
Bea
ds(m
in)
[M-H
]-[M
–H]-
(ppm
)[M
–H]-
(m/z
)(m
s)(Å
2 ) (Å
2 )
EE
2-
Sta
ndar
dN
.A.
N.A
.1.
8129
5.16
6929
5.16
690
C20
H23
O2
145.
071,
15
9.08
62.
7596
.36
EE
2 pi
ll (1
3)N
i2+S
cree
ning
ex
tract
1.81
295.
1669
0C
20H
23O
214
5.07
1,
159.
085
2.84
98.5
6
EE
2 pi
ll (1
3)C
OO
HS
cree
ning
ex
tract
1.81
295.
1669
0C
20H
23O
214
5.06
5,
159.
083
2.84
98.5
6
EE
2 pi
ll (1
3)N
i2+Id
entifi
catio
n ex
tract
1.82
295.
1668
0.4
C20
H23
O2
145.
071,
15
9.08
52.
7997
.46
EE
2 pi
ll (1
3)C
OO
HId
entifi
catio
n ex
tract
1.82
295.
1669
0
C20
H23
O2
145.
065,
15
9.08
42.
7997
.46
β-E
299
.38a
Sta
ndar
dN
.A.
N.A
.1.
7927
1.16
9627
1.16
980.
7C
18H
23O
214
5.06
5,
183.
080
2.57
92.2
7
β-E
2 pi
ll (1
2)N
i2+S
cree
ning
ex
tract
1.79
271.
1696
0.7
C18
H23
O2
145.
065,
18
3.08
12.
5792
.27
β-E
2 pi
ll (1
2)C
OO
HS
cree
ning
ex
tract
1.79
271.
1696
0.7
C18
H23
O2
2.57
92.2
714
5.06
5,
18
3.08
1

Chapter 5
162
β-E
2 pi
ll (1
2)N
i2+Id
entifi
catio
n ex
tract
1.79
271.
1696
0.7
C18
H23
O2
145.
071,
18
3.08
22.
5291
.13
β-E
2 pi
ll (1
2)C
OO
HId
entifi
catio
n ex
tract
1.79
271.
1696
0.
7C
18H
23O
214
5.06
5,
183.
079
2.57
92.2
7
DE
S-
Sta
ndar
dN
.A.
N.A
.1.
8526
7.13
8426
7.13
850.
3C
18H
19O
225
1.11
3,
237.
087
2.52
91.2
0
DE
S p
ill (1
1)N
i2+S
cree
ning
ex
tract
1.85
267.
1384
0.3
C18
H19
O2
251.
112,
23
7.08
62.
4890
.06
DE
S p
ill (1
1)C
OO
HS
cree
ning
ex
tract
1.85
267.
1384
0.3
C18
H19
O2
251.
113,
23
7.08
62.
5291
.20
DE
S p
ill (1
1)N
i2+Id
entifi
catio
n ex
tract
1.85
267.
1389
1.4
C18
H19
O2
251.
113,
23
7.08
72.
5792
.34
DE
S p
ill (1
1)C
OO
HId
entifi
catio
n ex
tract
1.85
267.
1384
0.
3C
18H
19O
225
1.11
2,
237.
086
2.57
92.3
4
N.A
., no
t app
licab
le
a The
oret
ical
val
ue o
f CC
S fr
om S
him
izu
et a
l [39
] cal
cula
ted
usin
g M
OB
CA
L an
d Tr
ajec
tory
Met
hod.

163
Screening and identification of estrogens
Table 2 demonstrates that both in screening and identification extracts, β-E2 (in sample 12), EE2 (in sample 13) and DES (in sample 11) were identified. This means that, for screening and identification of strong ERα-binders, the leftover from the screening extract is sufficient for unambiguous identification. Only a slight difference was observed between the results obtained with screening and identification extracts. Measuring the screening extracts in MSe mode, only the most abundant product ion was detected for β-E2, EE2 and DES (m/z 145.065, 145.071 and 251.113, respectively). However, when the identification extracts were measured in MSe mode, two specific ion products were detected for β-E2 (m/z 145.065, 183.080), EE2 (m/z 145.071, 159.086) and DES (m/z 251.113, 237.087) [37,38]. In contrast to the MSe results, in accurate mass product ion scanning mode, the two specific product ions for each estrogen were measured in both screening and identification extracts. Furthermore, no significant difference was observed between the identification results obtained with ERα-coated Ni2+- or COOH-beads. By using the drift times, experimental CCS values were calculated based on polyalanine calibration and compared with theoretical CCS value for β-E2 (Table 2). The latter was adapted from Shimizu et al. [39] who used MOBCAL with Trajectory Method to calculate a theoretical CCS value of 99.38 Å2, only 7% higher than the experimentally determined CCS value for β-E2 (92.27 Å2) in this work. It is important to note that the theoretical CCS values are significantly affected by error ratios in the modelling, especially for small molecules [40,41]. The experimental CCS values of the estrogens in standard solutions were similar to the experimental CCS values in the suspect samples (only 1–2% deviation). Increasing CCS values were calculated for increasing larger molecules: DES (m/z 267.1385: 91.20 Å2), β-E2 (m/z 271.1698: 92.27 Å2) and EE2 (m/z 295.1169: 96.36 Å2). Although CCS values for DES and β-E2 are close to each other, further discrimination between these estrogens was easily achieved with the help of retention time and accurate mass acquired in full-scan mode with UPLC-IM-Q-ToF-MS.

Chapter 5
164
Conclusions
In this study, we demonstrated that, by using 13C2,15N-Tamo as ESI+ label in a mass spectrometric ligand binding assay, the developed BioMS approach is able to screen (un)known estrogens despite their poor ionisation efficiency in ESI [31,30]. For rapid screening, ERα was successfully immobilised using either oriented or non-oriented approaches onto paramagnetic microbeads, and the BioMS assay was successfully demonstrated by screening for the ERα ligands DES, EE2 and β-E2 in dietary supplements. The method features ultrahigh-throughput (the entire sample treatment, BioMS assay and measuring time was <3h for 96 tests) and the possibility to use even the leftover from the BioMS screening extract for subsequent rapid (<5h for 96 tests) identification using UPLC-IM-Q-ToF-MS. This instrument provided excellent sensitivity using a novel API source and an additional identification point (experimental CCS value) next to retention time, accurate mass and MS/MS data. Thus, the combination of rapid bioaffinity screening using UPLC-QqQ-MS and identification with UPLC-IM-Q-ToF-MS is an extremely powerful analytical tool for early warning of ERα bioactive steroids in dietary supplements.
Acknowledgements
Waters (UK) is acknowledged for the use of the Synapt G2-S system equipped with the novel ion source prototype. The research leading to these results has received funding from the European Research Council under the European Union’s Seventh Framework Programme (FP7/2007-2013)/ERC grant agreement no [265721]. The Dutch Ministry of Economic Affairs (RIKILT project number 72825.02) is acknowledged for partially financing this project.

165
Screening and identification of estrogens
References
1. Crowley, R. and L.H. FitzGerald, The impact of cGMP compliance on consumer confidence in dietary supplement products. TOXICOLOGY, 2006. 221(1): p. 9-16.
2. Kohler, M., A. Thomas, H. Geyer, M. Petrou, W. Schänzer, and M. Thevis, Confiscated black market products and nutritional supplements with non-approved ingredients analyzed in the cologne doping control laboratory 2009. DRUG TEST ANAL, 2010. 2(11-12): p. 533-537.
3. Plotan, M., C.T. Elliott, M.L. Scippo, M. Muller, J.-P. Antignac, E. Malone, T.F.H. Bovee, S. Mitchell, and L. Connolly, The application of reporter gene assays for the detection of endocrine disruptors in sport supplements. ANAL CHIM ACTA, 2011. 700(1–2): p. 34-40.
4. Toorians, A.W.F.T., T.F.H. Bovee, J. de Rooy, L.A.A.M. Stolker, and R.L.A.P. Hoogenboom, Gynaecomastia linked to the intake of a herbal supplement fortified with diethylstilbestrol. FOOD ADDIT CONTAM A, 2010. 27(7): p. 917-925.
5. Maughan, R.J., Contamination of dietary supplements and positive drug tests in sport. J SPORT SCI, 2005. 23(9): p. 883-889.
6. Judkins, C.M.G., P. Teale, and D.J. Hall, The role of banned substance residue analysis in the control of dietary supplement contamination. DRUG TEST ANAL, 2010. 2(9): p. 417-420.
7. Geyer, H., M.K. Parr, K. Koehler, U. Mareck, W. Schänzer, and M. Thevis, Nutritional supplements cross-contaminated and faked with doping substances. J MASS SPECTROM, 2008. 43(7): p. 892-902.
8. Becue, I., C. Van Poucke, and C. Van Peteghem, An LC-MS screening method with library identification for the detection of steroids in dietary supplements. J MASS SPECTROM., 2011. 46(3): p. 327-335.
9. Van Poucke, C., C. Detavernier, R. Van Cauwenberghe, and C. Van Peteghem, Determination of anabolic steroids in dietary supplements by liquid chromatography–tandem mass spectrometry. ANAL CHIM ACTA, 2007. 586(1–2): p. 35-42.
10. Van Thuyne, W. and F.T. Delbeke, Validation of a GC-MS screening method for anabolizing agents in solid nutritional supplements. BIOMED CHROMATOGR, 2004. 18(3): p. 155-159.
11. Park, S.r., J.G. Lee, S.H. Roh, G. Kim, C.H. Kwon, H.R. Park, K.S. Kwon, D. Kim, and S.W. Kwon, Determination of PDE-5 inhibitors and appetite suppressants in adulterated dietary supplements using LC/PDA and LC/MS. FOOD ADDIT CONTAM B, 2012. 5(1): p. 29-32.
12. Di Mavungu, J.D., S. Monbaliu, M.L. Scippo, G. Maghuin-Rogister, Y.J.

Chapter 5
166
Schneider, Y. Larondelle, A. Callebaut, J. Robbens, C. van Peteghem, and S. de Saeger, LC-MS/MS multi-analyte method for mycotoxin determination in food supplements. FOOD ADDIT CONTAM A 2009. 26(6): p. 885-895.
13. Liang, Q., J. Qu, G. Luo, and Y. Wang, Rapid and reliable determination of illegal adulterant in herbal medicines and dietary supplements by LC/MS/MS. J PHARMACEUT BIOMED, 2006. 40(2): p. 305-311.
14. Hansen, M., N.W. Jacobsen, F.K. Nielsen, E. Björklund, B. Styrishave, and B. Halling-Sørensen, Determination of steroid hormones in blood by GC-MS/MS. ANAL BIOANAL CHEM, 2011. 400(10): p. 3409-3417.
15. Rambaud, L., F. Monteau, Y. Deceuninck, E. Bichon, F. André, and B. Le Bizec, Development and validation of a multi-residue method for the detection of a wide range of hormonal anabolic compounds in hair using gas chromatography-tandem mass spectrometry. ANAL CHIM ACTA, 2007. 586(1-2 SPEC. ISS.): p. 93-104.
16. Salvia, M.V., E. Vulliet, L. Wiest, R. Baudot, and C. Cren-Olivé, Development of a multi-residue method using acetonitrile-based extraction followed by liquid chromatography-tandem mass spectrometry for the analysis of steroids and veterinary and human drugs at trace levels in soil. J CHROMATOGR A, 2012. 1245: p. 122-133.
17. Thevis, M., T. Kuuranne, H. Geyer, and W. Schänzer, Annual banned-substance review: Analytical approaches in human sports drug testing. DRUG TEST ANAL, 2011. 3(1): p. 1-14.
18. Jonker, N., A. Kretschmer, J. Kool, A. Fernandez, D. Kloos, J.G. Krabbe, H. Lingeman, and H. Irth, Online Magnetic Bead Dynamic Protein-Affinity Selection Coupled to LC−MS for the Screening of Pharmacologically Active Compounds. ANAL CHEM, 2009. 81(11): p. 4263-4270.
19. Usami, M., K. Mitsunaga, and Y. Ohno, Estrogen receptor binding assay of chemicals with a surface plasmon resonance biosensor. J STEROID BIOCHEM, 2002. 81(1): p. 47-55.
20. Blair, R.M., H. Fang, W.S. Branham, B.S. Hass, S.L. Dial, C.L. Moland, W. Tong, L. Shi, R. Perkins, and D.M. Sheehan, The estrogen receptor relative binding affinities of 188 natural and xenochemicals: Structural diversity of ligands. TOXICOL SCI, 2000. 54(1): p. 138-153.
21 Choi Y, Van Breemen RB, Development of a screening assay for ligands to the estrogen receptor based on magnetic microparticles and LC-MS. COMB CHEM AND HIGH T SCR, 2008. 11(1): p. 1-6.
22. Bovee, T.F.H., R.J.R. Helsdingen, I.M.C.M. Rietjens, J. Keijer, and R.L.A.P. Hoogenboom, Rapid yeast estrogen bioassays stably expressing human estrogen receptors α and β, and green fluorescent protein: a comparison of different compounds with both receptor types. J STEROID BIOCHEM, 2004. 91(3): p. 99-109.
23. Bovee, T.F.H., W.G.E.J. Schoonen, A.R.M. Hamers, M.J. Bento, and

167
Screening and identification of estrogens
A.A.C.M. Peijnenburg, Screening of synthetic and plant-derived compounds for (anti)estrogenic and (anti)androgenic activities. ANAL BIOANAL CHEM, 2008. 390(4): p. 1111-1119.
24. de Vlieger, J.S.B., A.J. Kolkman, K.A.M. Ampt, J.N.M. Commandeur, N.P.E. Vermeulen, J. Kool, S.S. Wijmenga, W.M.A. Niessen, H. Irth, and M. Honing, Determination and identification of estrogenic compounds generated with biosynthetic enzymes using hyphenated screening assays, high resolution mass spectrometry and off-line NMR. J CHROMATOGR B, 2010. 878(7-8): p. 667-674.
25. Zepperitz, C., G. Hofner, and K.T. Wanner, MS-binding assays: kinetic, saturation, and competitive experiments based on quantitation of bound marker as exemplified by the GABA transporter mGAT1. CHEMMEDCHEM, 2006. 1(2): p. 208-17.
26. Hess, M., G. Hofner, and K.T. Wanner, (S)- and (R)-fluoxetine as native markers in mass spectrometry (MS) binding assays addressing the serotonin transporter. CHEMMEDCHEM, 2011. 6(10): p. 1900-8.
27. Niessen, K.V., G. Hofner, and K.T. Wanner, Competitive MS binding assays for dopamine D2 receptors employing spiperone as a native marker. CHEMMEDCHEM, 2005. 6(10): p. 1769-75.
28. Hofner, G. and K.T. Wanner, Competitive binding assays made easy with a native marker and mass spectrometric quantification. ANGEW CHEM INT ED ENGL, 2003. 42(42): p. 5235-7.
29. Aqai, P., E. Cevik, A. Gerssen, W. Haasnoot, and M.W.F. Nielen, High-Throughput Bioaffinity Mass Spectrometry for Screening and Identification of Designer Anabolic Steroids in Dietary Supplements. ANAL CHEM, 2013. 85(6): p. 3255-3262.
30. Athanasiadou, I., Y.S. Angelis, E. Lyris, and C. Georgakopoulos, Chemical derivatization to enhance ionization of anabolic steroids in LC-MS for doping-control analysis. TrAC-Trend. ANAL CHEM, 2013. 42(0): p. 137-156.
31. Wong, C.H.F., D.K.K. Leung, F.P.W. Tang, J.K.Y. Wong, N.H. Yu, and T.S.M. Wan, Rapid screening of anabolic steroids in horse urine with ultra-high-performance liquid chromatography/tandem mass spectrometry after chemical derivatisation. J CHROMATOGR A, 2012. 1232: p. 257-265.
32. Major, M., Bajic, S., Bristow, A., Ray, A., A novel source design for the analysis of both polar and non-polar species. Poster presentated at the 60th American Society for Mass Spectrometry conference, Vancouver, May 2012, http://www.waters.com/waters/library.htm?locale=en_US&lid=134684811, accessed on 01-03-2013.
33. Rijk, J.C.W., T.F.H. Bovee, S. Wang, C. Van Poucke, C. Van Peteghem, and M.W.F. Nielen, Detection of anabolic steroids in dietary supplements: The added value of an androgen yeast bioassay in parallel with a liquid chromatography-tandem mass spectrometry screening method. ANAL CHIM

Chapter 5
168
ACTA, 2009. 637(1-2): p. 305-314. 34. Bolger, R., T.E. Wiese, K. Ervin, S. Nestich, and W. Checovich, Rapid
screening of environmental chemicals for estrogen receptor binding capacity. ENVIRON HEALTH PERSP, 1998. 106(9): p. 551-557.
35. Kuiper, G.G.J.M., J.G. Lemmen, B. Carlsson, J.C. Corton, S.H. Safe, P.T. Van Der Saag, B. Van Der Burg, and J.Å. Gustafsson, Interaction of estrogenic chemicals and phytoestrogens with estrogen receptor β. ENDOCRINOLOGY, 1998. 139(10): p. 4252-4263.
36. Matthews, J., T. Celius, R. Halgren, and T. Zacharewski, Differential estrogen receptor binding of estrogenic substances: a species comparison. J STEROID BIOCHEM, 2000. 74(4): p. 223-234.
37. Shao, B., R. Zhao, J. Meng, Y. Xue, G. Wu, J. Hu, and X. Tu, Simultaneous determination of residual hormonal chemicals in meat, kidney, liver tissues and milk by liquid chromatography–tandem mass spectrometry. ANAL CHIM ACTA, 2005. 548(1–2): p. 41-50.
38. Guo, F., Q. Liu, G.-b. Qu, S.-j. Song, J.-t. Sun, J.-b. Shi, and G.-b. Jiang, Simultaneous determination of five estrogens and four androgens in water samples by online solid-phase extraction coupled with high-performance liquid chromatography–tandem mass spectrometry. J CHROMATOGR A, 2013. 1281(0): p. 9-18.
39. Shimizu, A., T. Ohe, and M. Chiba, A novel method for the determination of the site of glucuronidation by ion mobility spectrometry-mass spectrometry. DRUG METAB DISPOS, 2012. 40(8): p. 1456-1459.
40. Campuzano, I., M.F. Bush, C.V. Robinson, C. Beaumont, K. Richardson, H. Kim, and H.I. Kim, Structural characterization of drug-like compounds by ion mobility mass spectrometry: Comparison of theoretical and experimentally derived nitrogen collision cross sections. ANAL CHEM, 2012. 84(2): p. 1026-1033.
41. Knapman, T.W., J.T. Berryman, I. Campuzano, S.A. Harris, and A.E. Ashcroft, Considerations in experimental and theoretical collision cross-section measurements of small molecules using travelling wave ion mobility spectrometry-mass spectrometry. INT J MASS SPECTROM, 2010. 298(1-3): p. 17-23.

169
Screening and identification of estrogens
Appendix 5.1
Covalent immobilisation of ERα
SiMAG-carboxyl paramagnetic microbeads of 1 µm (having a maghemite core and a non-porous silica surface containing propyl linkers on which carboxyl groups are immobilised) were used in this study because of their proven high coupling efficiency for proteins. The LBD of the ERα was immobilised randomly by covalent bond formation between its amino groups and the carboxyl groups on the bead surface. For this immobilisation, the carbodiimide coupling protocol of Chemicell (“Covalent Coupling Procedure in SiMAG-Carboxyl by Carbodiimide Method”) was used. In short, the beads suspended in storage solution were vortexed for 15 min and 200 µL of the bead stock was transferred to a LoBind tube which was then placed in the magnetic rack for 1 min. The supernatant was removed and the pellet was washed twice with 1 mL 0.1 M MES buffer (pH 5) using the magnetic rack. For activation of the bead surface, the pellet was resuspended in 0.25 mL MES containing 10 mg EDC (prepared freshly). This mixture was mixed by rotating for 10 min at room temperature (RT). After the activation of the beads, the mixture was washed twice with 1 mL MES buffer and resuspended again in 0.25 mL MES buffer. Subsequently, 50 µg of the LBD of ERα was added to the activated beads and this mixture was incubated for 2 h by mixing with the rotator at RT. After incubation, the unbound ERα in the supernatant was removed by using the magnetic rack and the beads with covalently coupled ERα were washed three times with 1 mL PBS (5.4 mM Na2HPO4, 1.3 mM KH2PO4, 150 mM NaCl, 3 mM KCl, pH 7.4). Finally, the ERα-coated beads were resuspended in 0.5 mL of PBS containing 0.05% sodium azide and stored at 4 °C.
Non-covalent immobilisation of ERα SiMAG-IDA/Nickel paramagnetic microbeads of 1 µm (having a maghemite core and a non-porous silica surface on which Ni2+-metal complex is formed with iminodiacetic acid) were used for oriented non-covalent immobilisation of the LBD of ERα. The immobilisation is based on the His-tag sequence of the ER which binds to the Ni2+ cations on the beads. The protocol of Chemicell (“Purification of 6xHis-tagged proteins with magnetic SiMAG-IDA/Nickel particles”) was used with slight modifications. In short, the beads were vortexed for 15 min and then 1 mL of the SiMAG-IDA/Nickel bead stock is transferred to a LoBind tube which was then placed in the magnetic rack for 1 min. The supernatant was removed and the pellet was washed three times with 0.5 mL Wash & Binding buffer ((WB buffer) 500 mM NaCl, 100 mM HEPES, 20 mM imidazole, pH 8.0). After the last wash step, the beads were resuspended in 0.5 mL of WB buffer. Subsequently, 50 µg of ERα was added to the beads and mixed gently for 30 min at RT. After incubation, the unbound ERα in the supernatant was removed and the beads with non-covalently bound ERα were washed three times with WB buffer. Finally, the ERα-coated beads were resuspended in 0.5 mL of PBS containing 0.05% sodium azide and stored at 4 °C.

Chapter 5
170
Appendix 5.2
Photograph of a novel API source prototype showing the high-velocity droplet stream impacting on a high-voltage electrode.
Appendix 5.3
Average eluted amounts (n = 2) of 13C2,15N-Tamo label from different volumes of ERα-coated Ni2+-beads (black bars) and COOH-beads (grey bars) suspensions incubated with 0.5 ng of the label and measured by UPLC-QqQ-MS.

171
Screening and identification of estrogens
Appendix 5.4
Peak areas obtained with the novel API source in negative ionisation mode (grey bar) relative to ESI in negative mode (black bars) for estrogen standards at the 10 ng mL-1 level.


6General discussion and future perspectives

Chapter 6
174
General discussion
Looking at the history of monitoring programs, it is quite imaginable that in sports and animal farming new unknown compounds are being used which are at the moment undetectable in the existing screening or confirmatory methods [1-5]. Therefore, the main goal in this thesis was to develop bioaffinity mass spectrometry (BioMS) concepts for the screening and identification of known and unknown contaminants in the environment and food. In Chapter 2, such a concept is described by using fluorescent labeled superparamagnetic microbeads coated with specific anti-ochratoxin A (OTA) monoclonal antibodies (Mabs) in a novel direct inhibition flow cytometric immunoassay (FCIA) for high-throughput screening (HTS) of ochratoxins in wheat and cereal samples at relevant levels. The same anti-OTA Mabs-coated beads were used for immunoaffinity isolation prior to identification by nano-ultra performance-liquid chromatography-quadrupole-time-of-flight-mass spectrometry (nano-UPLC-Q-ToF-MS) in full scan accurate mass mode. In this mode, next to OTA, the analogue ochratoxin B was identified in cereal samples. By using nano-UPLC-Q-ToF-MS, not only the consumption of costly bioreagents decreased significantly, it was also made plausible that unlike targeted MS MRM mode, full scan accurate mass MS is able to detect known and unknown contaminants in affinity purified extracts. Next to the advantages of this approach, there was the serious issue of the expensive Luminex®-compatible paramagnetic beads. For screening, the consumption of the antibody-bound beads was negligible (1000 beads or €0.04/sample). However, this amount of beads did not capture ochratoxins at detectable amounts for the nano-UPLC-Q-ToF-MS system. Therefore, 350 times more coupled beads had to be used for the identification which raised the bead costs to €14/sample excluding the Mabs costs. In that approach, the nano-UPLC-Q-ToF-MS system was used after an immunoaffinity extraction and that system presented several challenges which included leakages (which were not detectable due to the low flow rate), clogging and serious dead volumes between connections which all contributed to difficult handling of the system and relatively poor chromatographic performance. For screening multiple mycotoxins, such as fumonisins, zearalenone and aflatoxins, in one assay, Mabs for each mycotoxin could be used for specific bioisolation. These Mabs can be immobilized on different Luminex®-bead sets making the simultaneous screening of several mycotoxins possible. Following the screening, the same Mabs-coated beads could be used in a simultaneous bioisolation procedure of the mycotoxins for identification purposes with LC-MS. Similarly, the described screening method may be extended to screen masked or conjugated mycotoxins, which can escape routine methods [6, 7], by using other or additional biorecognition elements. For the analysis of thyroid transporter ligands, a BioMS concept is described in Chapter 3 with three different analytical purposes: screening, confirmation and identification. In order to avoid the usage of any fluorescent reporter

Discussion and perspectives
175
molecule and expensive Luminex®-compatible paramagnetic beads, a stable isotopic thyroid hormone 13C6-L-thyroxine was used as label in a competitive inhibition format and the biomolecule recombinant transthyretin (rTTR) was used immobilized onto inexpensive paramagnetic microbeads and in solution using cut-off filters. For screening and confirmation of endocrine disrupting chemicals (EDCs) in process water (at ppt level) and urine (at ppb level), a fast UPLC-triple quadrupole (QqQ)-MS was used as readout system and for identification nano-UPLC-Q-ToF-MS in full scan mass mode. All extracts were biopurified using the same biorecognition element in screening, confirmation and identification. However, due to the use of test tubes in the assay, HTS was not feasible regardless whether rTTR-coated beads were used or cut-off filters. In best case, 40 samples could be assayed and measured in 8 hours despite the short runtime of the measurement (2 min/sample) with UPLC-QqQ-MS. This problem could be overcome by switching to 96-well plate assay format. Another challenge in this method was to screen thyroxine (T4) in water at ppt level (i.e. ng L-1). The IC50 values of T4 obtained with the competitive inhibition assay was 1000 times too high for screening at ppt level. This challenge was tackle by applying a lengthy solid-phase extraction (SPE) procedure consisting of two different SPE columns to concentrate T4 from ppt level to ppb level. Although this SPE procedure made the screening of T4 possible, the total sample preparation time was increased significantly as the procedure including evaporation steps needed >5 hours. Since the same nano-UPLC-Q-ToF-MS system was used as described in Chapter 2, the same issues with the nano-UPLC were experienced for the identification of EDCs in full scan accurate mass mode. In this research, the screening of several EDCs is demonstrated while the list of hazardous EDCs found in the environment is long. For example, recently, the German section of Friends of the Earth published a study which concluded that nearly a third of cosmetic products in Germany, Austria and Switzerland contain EDCs such as parabens [8]. The described screening method should be extended to a large group of EDCs. This could be achieved by using new TTR types. By using different mutant types of TTR, a wide range of EDCs could be detected while maintaining the single-isotope label based screening approach. By using mutant types of TTR, the detection of new emerging EDCs will be possible while the measurement time is kept short (i.e. 2 min/sample) by using LC-MS for screening instead of conventional GC-MS. In Chapter 4, a generic high-throughput BioMS approach was developed and applied for the screening and identification of known and unknown recombinant human sex-hormone binding globulin (rhSHBG)-binding designer steroids in dietary supplements. In this method, screening was performed using 17β-testosterone-d3 as stable isotopic MS label and the previously described paramagnetic microbeads were used for immobilizing rhSHBG onto the bead surface. The same UPLC-QqQ-MS system was used for screening while for identification chip-UPLC-Q-ToF-MS was used for superior chromatographic

Chapter 6
176
performances and sensitivity. The latter system did not have the typical practical issues as the nano-LC system. The entire sample treatment, BioMS assay and measuring time was 4h for 96 tests. Next to multiple androgens, an estrogen and a gestagen, also the steroid β-1-T was screened and identified in three samples previously found negative in targeted LC-MS/MS. Additionally, the designer steroid tetrahydrogestrinone was screened and identified in a spiked dietary supplement. Any strong binder was successfully identified on basis of retention time, accurate mass and product ion spectra. To identify additionally less potent rhSHBG binders in dietary supplements, ten times more rhSHBG was applied in an adjusted bioaffinity procedure. This BioMS approach is generic and very fast as multiple androgens, an estrogen and a gestagen were identified using solely one transport protein. To test the applicability of this BioMS approach to screen and identify SHBG binders in bovine urine, the affinity of various natural occurring hormones in bovine urine were tested. It was found that some of these natural compounds have high affinity towards SHBG. Due to this, screening bovine or human urine for steroids is not possible, but, screening of calf urine should be feasible since the calf urine contains natural hormones at lower levels [9]. The screening of calf urine using SHBG was not tested yet in this research. Further, it was found that steroid metabolites in bovine urine, cannot be screened as they showed very low or no affinity towards SHBG. Another matrix, which could contain SHBG binders making the screening of steroids impossible, is feed. This matrix contains large amount of ingredients originating from plants which contain equol [10, 11]. This compound is a metabolite from the isoflavone daidzein and showed a relative binding affinity of 0.4 towards SHBG while 17β-testosterone has a relative binding affinity of 1. As a future experiment, the coupling of the TrizaicTM interface to an UPLC-QqQ-MS should be investigated. By this coupling, superior chromatographic performances and sensitivities can be achieved for e.g. steroids, while confirmatory or quantification analysis in agreement with EU legislation is feasible. Since SHBG was able to bind few estrogens, another high-throughput bioaffinity LC-MS approach was developed in Chapter 5 for estrogens in dietary supplements using the estrogens receptor α (ERα). The highly unstable ERα was stabilized by immobilizing it onto the surface of paramagnetic microbeads and with this method, instead of GC-MS, UPLC-QqQ-MS was used for the screening of estrogens by using a suitable LC-MS-compatible label. In this way derivatization and a long run time, which are related to GC-MS, were avoided [12, 13]. The identification of estrogens in ERα-purified supplement extracts was achieved by using a UPLC-ion mobility (IM)-Q-ToF-MS which gave next to retention times, experimental accurate mass, MS/MS data also specific drift times. To extend this BioMS to other matrices such as bovine urine or feed, there are serious limitations which are similar to the SHBG BioMS method. Both in bovine urine and in feed, there are ERα-binders, i.e. natural hormones in bovine urine and phytoestrogens in feed, which could interfere
Discussion and perspectives
177
with the screening. Moreover, if the ERα is not produced in-house or delivered by partners, the assay costs of this method are very high. The commercial price of 50 µg ERα is >€1000 which can be used for screening of only 80 samples. The use of IM helps to identify known and unknown compounds. Not only, the commercially available UPLC-IM-Q-ToF-MS system adds an additional identification point in drift times, it also proved to be simple in use. Another advantage is the separation of isomers of contaminants by IM which could make the chromatographic separation of compounds less important [14, 15]. By this, fast chromatography could be feasible which contributes to high-throughput measurement.
Future Perspectives
Generally, the described BioMS methods were able to screen contaminants at >10 ppb level. Only compounds having high affinity towards the biorecognition element could be screened at <10 ppb level. Regarding the EU legislation for certain compounds, screening at low ppb levels is required. To improve the sensitivity of the BioMS screening methods, there are two major factors which influence the sensitivity. The sensitivity of the screening instrument is important. The lower the limit of detection (LoD) of the isotope label is, the lower amount of the biorecognition element is required during screening. When the amount of biorecognition element is decreased during screening, lower amounts of competing contaminants are needed to compete with the label. In this thesis, the LoDs of isotope labels were generally at the low pg levels and the concentration of the used biorecognition element were at low nM levels. If the label LoD would be at <fg levels and with that the biorecognition element concentration at <pM, screening at 1 ppb level might be achieved. Another way to improve the BioMS screening sensitivity is to choose an isotope label which has low relative binding (RB) affinity towards the biorecognition element. In the BioMS screening of SHBG-binders, 17β-testosterone-d3 was used as label which was one of the strongest binders (RB value of 1). By selecting a weaker binder, e.g. β-boldenone having an RB value of 0.6 as label, lower amounts of competing SHBG-binders are needed to compete with the label which could improve the screening sensitivity. It is important to note that the choice of isotope label having a low RB value and the amount of biorecognition element could increase the rate of false non-compliant results. In order to be able to screen feed samples, which contain high levels of phytoestrogens, for steroids, a specific sample treatment step is required to separate the phytoestrogens from the steroids. Since phytoestrogens have similar molecular structures as 17β-estradiol or other steroids, it is difficult to separate them during a chemical extraction procedure. Therefore, following a primary extraction of the feed sample, a bioaffinity extraction procedure could be applied which can isolate the most abundant phytoestrogens such as isoflavones or coumestans. After this

Chapter 6
178
procedure, the feed extract which should contain low amounts of phytoestrogens can be subjected to the BioMS screening methods. To investigate the feasibility of BioMS to screen steroid metabolites, the affinity of testosterone-glucuronide or estradiol-sulphate which are present in bovine urine were determined. It was found that these metabolites had no affinity or very low affinity towards SHBG or ERα. A specific hydrolysis step, which converts the metabolites back to the parent compound, might enable the screening of steroid metabolites [16-18]. In general, all the concepts presented in this thesis, can easily be extended for screening and identification of a wide range of contaminants. In a next research, to develop a comprehensive screening method, combining various biorecognition elements in one assay is an interesting next step. Coccidiostats are the only veterinary drugs still permitted to be used as feed additives to treat poultry for coccidiosis. Currently, LC-MS is used for multi-analyte screening of coccidiostats in chicken liver [19], eggs and feed [20, 21]. In the literature a five-plex flow cytometric-based screening assay is described for coccidiostats in eggs and feed which used polyclonal antibodies [22]. These antibodies could be used in a BioMS screening for coccidiostats at relevant levels. This BioMS screening method could use one kind of paramagnetic beads on which five different polyclonal antibodies are immobilized separately. Each antibody-coated bead assay requires an isotope label which can be measured with a fast UPLC-QqQ-MS system for screening of known and unknown cross-reacting coccidiostats. The subsequent identification could be performed, following a bioisolation procedure using the same antibody-coated beads in combination with an LC-MS in full scan accurate mass mode. A multi-sulfonamide antibody having equal affinity towards sulfamethoxazole and sulfadiazine was used to develop a biosensor screening assay for serum and plasma samples obtained from the broilers [23]. This multi-sulfonamide antibody proved to have affinity towards ten sulfonamides in total which makes it an interesting biorecognition element. Using this antibody immobilized onto magnetic beads for BioMS screening of sulfonamides, only one suitable isotope label is required. This means that the UPLC-QqQ-MS run time remains short (e.g. 2 min/sample) making high-throughput screening more feasible. After screening, the same antibody-coated beads can be used for isolating the sulfonamides for identification purposes. The β2-adrenergic receptor binds several β-agonists including clenbuterol, salmeterol and salbutamol [24]. At RIKILT, a radiolabel assay is developed for the screening of β-agonists in feed. To avoid the use of radiolabel, this method could be replaced by a BioMS screening assay. As isotope label clenbuterol-d6 could be used which can be measured at pg level with UPLC-QqQ-MS and LC-MS operated full scan accurate mass mode could be used for identifying β2-adrenergic receptor binders in biopurified feed extracts. By using anti-mycotoxin Mabs, TTR, β2-adrenergic receptor and SHBG and their accompanying MS labels, the bioactivity-based screening of mycotoxins, EDCs, β-agonists, androgens, estrogens and gestagens

Discussion and perspectives
179
could be feasible by measuring merely several labels in single reaction monitoring (SRM) mode. This approach will be rapid not only in terms of assay time but also the LC-MS run time could be 2 min/sample while the screening of a wide range of compounds is achieved. In this way, also the rapid screening of contaminants which are not LC-MS compatible will be possible avoiding any derivatization or lengthy GC-MS run time. This comprehensive BioMS screening method is able to screen both known and unknown cross-reactive contaminants in food and environmental samples. The same biorecognition elements as in screening could be used for subsequent identification of contaminants using chip-UPLC-IM-Q-ToF-MS. The results described in this thesis demonstrate the power of bioactivity-based screening combined with mass spectrometric identification. This ideal combination proved to be suitable to screen and identify contaminants which otherwise would be missed by conventional instrumental analysis. By further improving these bioaffinity mass spectrometry concepts, by multiplexing and validation, existing food and environmental contaminants can be monitored comprehensively while maintaining the abilities to detect new emerging contaminants. Consequently, these new bioaffinity mass spectrometry concepts present new tools for the screening and identification of emerging yet unknown food and environmental contaminants to ensure consumer’s health and fair play in sports.

Chapter 6
180
References
1. Nielen, M.W., C.T. Elliott, S.A. Boyd, D. Courtheyn, M.L. Essers, H.H. Hooijerink, E.O. van Bennekom, and R.E. Fuchs, Identification of an unknown beta-agonist in feed by liquid chromatography/bioassay/quadrupole time-of-flight tandem mass spectrometry with accurate mass measurement. RAPID COMMUN MASS SP, 2003. 17(14): p. 1633-41.
2. Aqai, P., E. Cevik, A. Gerssen, W. Haasnoot, and M.W.F. Nielen, High-Throughput Bioaffinity Mass Spectrometry for Screening and Identification of Designer Anabolic Steroids in Dietary Supplements. ANAL CHEM, 2013. 85(6): p. 3255-3262.
3. Aqai, P., J. Peters, A. Gerssen, W. Haasnoot, and M.W.F. Nielen, Immunomagnetic microbeads for screening with flow cytometry and identification with nano-liquid chromatography mass spectrometry of ochratoxins in wheat and cereal. ANAL BIOANAL CHEM, 2011. 400(9): p. 3085-3096.
4. Catlin, D.H., M.H. Sekera, B.D. Ahrens, B. Starcevic, Y.C. Chang, and C.K. Hatton, Tetrahydrogestrinone: discovery, synthesis, and detection in urine. RAPID COMMUN MASS SP, 2004. 18(12): p. 1245-1249.
5. Sekera, M.H., B.D. Ahrens, Y.C. Chang, B. Starcevic, C. Georgakopoulos, and D.H. Catlin, Another designer steroid: discovery, synthesis, and detection of ‘madol’ in urine. RAPID COMMUN MASS SP, 2005. 19(6): p. 781-784.
6. Berthiller, F., C. Dall’Asta, R. Schuhmacher, M. Lemmens, G. Adam, and R. Krska, Masked mycotoxins: determination of a deoxynivalenol glucoside in artificially and naturally contaminated wheat by liquid chromatography-tandem mass spectrometry. J AGRIC FOOD CHEM, 2005. 53(9): p. 3421-5.
7. Berthiller, F., R. Schuhmacher, G. Adam, and R. Krska, Formation, determination and significance of masked and other conjugated mycotoxins. ANAL BIOANAL CHEM, 2009. 395(5): p. 1243-52.
8. Friend of the Earth International, http://www.foei.org/en/what-we-do/land-grabbing/latest-news/endocrine-disruptors-in-cosmetics-almost-one-third-of-products-affected-friends-of-the-earth-germany-publishes-study-and-iphone-app, accessed on 7-08-2013.
9. Nielen, M.W.F., J.J.P. Lasaroms, M.L. Essers, M.B. Sanders, H.H. Heskamp, T.F.H. Bovee, J.H. van Rhijn, and M.J. Groot, The ultimate veal calf reference experiment: Hormone residue analysis data obtained by gas and liquid chromatography tandem mass spectrometry. ANAL CHIM ACTA, 2007. 586(1-2): p. 30-34.
10. Nielsen, T.S., J.V. Norgaard, S. Purup, X.C. Frette, and E.C. Bonefeld-Jorgensen, Estrogenic activity of bovine milk high or low in equol using

Discussion and perspectives
181
immature mouse uterotrophic responses and an estrogen receptor transactivation assay. CANCER EPIDEM, 2009. 33(1): p. 61-68.
11. Miyahara, M., H. Ishibashi, M. Inudo, H. Nishijima, T. Iguchi, L.J. Guillette, and K. Arizono, Estrogenic activity of a diet to estrogen receptors -alpha and -beta in an experimental animal. J HEALTH SCI, 2003. 49(6): p. 481-491.
12. Quintana, J.B., J. Carpinteiro, I. Rodriguez, R.A. Lorenzo, A.M. Carro, and R. Cela, Determination of natural and synthetic estrogens in water by gas chromatography with mass spectrometric detection. J CHROMATOGR A, 2004. 1024(1-2): p. 177-185.
13. Yang, L., T. Luan, and C. Lan, Solid-phase microextraction with on-fiber silylation for simultaneous determinations of endocrine disrupting chemicals and steroid hormones by gas chromatography-mass spectrometry. J CHROMATOGR A, 2006. 1104(1-2): p. 23-32.
14. Dear, G.J., J. Munoz-Muriedas, C. Beaumont, A. Roberts, J. Kirk, J.P. Williams, and I. Campuzano, Sites of metabolic substitution: Investigating metabolite structures utilising ion mobility and molecular modelling. RAPID COMMUN MASS SP, 2010. 24(21): p. 3157-3162.
15. Lapthorn, C., F. Pullen, and B.Z. Chowdhry, Ion mobility spectrometry-mass spectrometry (IMS-MS) of small molecules: Separating and assigning structures to ions. MASS SPECTROM REV, 2013. 32(1): p. 43-71.
16. Fotsis, T. and H. Adlercreutz, The multicomponent analysis of estrogens in urine by ion exchange chromatography and GC-MS--I. Quantitation of estrogens after initial hydrolysis of conjugates. J STEROID BIOCHEM, 1987. 28(2): p. 203-13.
17. Gosetti, F., E. Mazzucco, M.C. Gennaro, and E. Marengo, Ultra high performance liquid chromatography tandem mass spectrometry determination and profiling of prohibited steroids in human biological matrices. A review. J CHROMATOGR B Analyt Technol Biomed Life Sci, 2013. 927: p. 22-36.
18. Cavalcanti, G.D., F.D. Leal, B.C. Garrido, M.C. Padilha, and F.R.D. Neto, Detection of designer steroid methylstenbolone in “nutritional supplement” using gas chromatography and tandem mass spectrometry: Elucidation of its urinary metabolites. STEROIDS, 2013. 78(2): p. 228-233.
19. Olejnik, M., T. Szprengier-Juszkiewicz, and P. Jedziniak, Multi-residue confirmatory method for the determination of twelve coccidiostats in chicken liver using liquid chromatography tandem mass spectrometry. J CHROMATOGR A, 2009. 1216(46): p. 8141-8148.
20. Mortier, L., E. Daeseleire, and C. Van Peteghem, Liquid chromatographic tandem mass spectrometric determination of five coccidiostats in poultry

Chapter 6
182
eggs and feed. J CHROMATOGR B, 2005. 820(2): p. 261-270.21. Chico, J., A. Rubies, F. Centrich, R. Companyo, M.D. Prat, and M. Granados,
Use of gel permeation chromatography for clean-up in the analysis of coccidiostats in eggs by liquid chromatography-tandem mass spectrometry. ANAL BIOANAL CHEM, 2013. 405(14): p. 4777-4786.
22. Bienenmann-Ploum, M.E., A.C. Huet, K. Campbell, T.L. Fodey, U. Vincent, W. Haasnoot, P. Delahaut, C.T. Elliott, and M.W.F. Nielen, Development of a five-plex flow cytometric immunoassay for the simultaneous detection of six coccidiostats in feed and eggs. ANAL BIOANAL CHEM, 2012. 404(5): p. 1361-1373.
23. Haasnoot, W., M. Bienenmann-Ploum, U. Lamminmaki, M. Swanenburg, and H. van Rhijn, Application of a multi-sulfonamide biosensor immunoassay for the detection of sulfadiazine and sulfamethoxazole residues in broiler serum and its use as a predictor of the levels in edible tissue. ANAL CHIM ACTA, 2005. 552(1-2): p. 87-95.
24. Danyi, S., G. Degand, C. Duez, B. Granier, G. Maghuin-Rogister, and M.L. Scippo, Solubilisation and binding characteristics of a recombinant beta(2)-adrenergic receptor expressed in the membrane of Escherichia coli for the multianalyte detection of beta-agonists and antagonists residues in food-producing animals. ANAL CHIM ACTA, 2007. 589(2): p. 159-165.

Summary – Samenvatting

184
Summary
Our environment is constantly threatened by large amounts of man-made chemicals and natural substances. Parts of these substances accumulate and contaminate soil and surface water, affecting the organisms living in it and eventually contaminate the food chain. The European Union (EU) has imposed regulations and obliged EU member states to monitor for possible contaminants in the environment and food. For this, highly sophisticated mass spectrometry (MS) techniques are developed which can screen >100 contaminants in a single run. For rapid and inexpensive screening of contaminants, bioactivity-based screening assays are applied, however, identification of compounds based on their chemical-physical properties is not possible. As both methods cannot identify emerging and unknown bioactive contaminants, there is a need for new tools and concepts. This thesis describes new bioaffinity mass spectrometry concepts for the screening and identification of food and environmental contaminants. For this, various biorecognition elements, such as an antibody, transport proteins and a receptor were used for bioaffinity isolation procedures of contaminants from various matrices. Several liquid-chromatography MS (LC-MS) systems were used in either pre-selected mass mode for screening or in full scan accurate mass mode for identification of contaminants. In Chapter 2, a concept is demonstrated using superparamagnetic microbeads coated with monoclonal antibodies (Mabs) in a novel direct inhibition Luminex® flow cytometric immunoassay (FCIA) plus immunoaffinity isolation prior to identification by nano-ultra-performance-LC-quadrupole-time-of-flight-MS (nano-UPLC-Q-ToF-MS). As a model system, the mycotoxin ochratoxin A (OTA) and cross-reacting mycotoxin analogues were analyzed in wheat and cereal samples, after a simple extraction, using the FCIA with anti-OTA Mabs coated microbeads. In the immunomagnetic isolation method, a higher amount of beads was used to trap ochratoxins from sample extracts. Following a wash step, bound ochratoxins were dissociated from the Mabs prior to separation plus identification with nano-UPLC-Q-ToF-MS system. In screened suspect naturally contaminated samples, OTA and its non-chlorinated analogue ochratoxin B were successfully identified by full scan accurate mass spectrometry as a proof of concept for identification of unknown but cross-reacting emerging mycotoxins. Due to the miniaturization and bioaffinity isolation, this concept might be applicable for the use of other and more expensive bioreagents such as transport proteins and receptors for screening and identification of known and unknown (or masked) emerging food contaminants. In another study, a new competitive inhibition concept was developed in which LC-MS was used for both screening and identification. In this concept, Luminex was no longer used for screening as Luminex®-compatible microbeads are expensive and the use of the fluorescent reporter molecule was a disadvantage. Therefore, in Chapter 3 new inexpensive paramagnetic beads were used together with a stable isotopic mass

185
spectrometric label for the analysis of thyroid transporter ligands. A triple bioaffinity mass spectrometry (BioMS) concept was developed aiming at three different analytical objectives: rapid screening of any ligand, confirmation of known ligands in accordance with legislative requirements and identification of emerging yet unknown ligands. These three purposes shared the same bio-recognition element, recombinant thyroid transport protein transthyretin (rTTR), and dedicated modes of LC-MS. For screening, a rapid and radiolabel-free competitive inhibition MS binding assay was developed with fast UPLC-electrospray ionization-triple-Q-MS (UPLC-QqQ-MS) as readout system. It used the non-radioactive stable isotopic thyroid hormone 13C6-L-thyroxine as label of which the binding to rTTR is inhibited by any ligand such as thyroid drugs and thyroid endocrine disrupting chemicals (EDCs). The rTTR was either used in solution or immobilized on paramagnetic microbeads. The concentration-dependent inhibition of the label by the natural thyroid hormone L-thyroxine (T4), as a model analyte, was demonstrated in water at part-per-trillion and in urine at part-per-billion level. For confirmation of identity of known ligands, rTTR was used for bioaffinity purification for confirmation of naturally present free T4 in urine. As a demonstrator for identification of unknown ligands, the same rTTR was used again, but in combination with nano-UPLC-Q-ToF-MS and urine samples spiked with the model ‘unknown’ EDCs triclosan and tetrabromobisphenol-A. This study highlighted the potential of BioMS using one affinity system, both for rapid screening as well as for confirmation and identification of known and unknown emerging thyroid EDCs. However, this BioMS concept was considered low-throughput. Therefore, in Chapter 4, a switch was made from low-throughput to high-throughput screening and identification. A generic high-throughput BioMS approach was developed and applied for the screening and identification of known and unknown recombinant human sex hormone-binding globulin (rhSHBG)-binding steroids in dietary supplements. For screening, a semi-automated competitive inhibition binding assay was combined with fast UPLC-QqQ-MS. The assay was performed in a 96-well plate and combined with the fast LC-MS, 96 measurements could be performed in 4 h. The concentration-dependent inhibition of the label by steroids in dietary supplements was demonstrated. Following an adjusted bioaffinity isolation procedure, suspect sample extracts were injected into a chip-UPLC (NanoTileTM)-Q-ToF-MS system for full scan accurate mass identification. Next to known steroids, 1-testosterone was identified in three of the supplements studied and the designer steroid tetrahydrogestrinone was identified in a spiked supplement. The generic steroid-binding assay can be used for high-throughput screening of androgens, estrogens and gestagens in dietary supplements to fight doping. When combined with chip-UPLC-MS, it is a powerful tool for early warning of unknown emerging rhSHBG bioactive designer steroids in dietary supplements. In Chapter 5, another high-throughput BioMS method was developed and applied for the screening

186
and identification of recombinant human estrogen receptor α (ERα) binders in dietary supplements. For screening, a semi-automated competitive inhibition binding assay was developed based on 13C2,15N-tamoxifen as a label and using fast UPLC-QqQ-MS operated in the single reaction monitoring (SRM) mode as a readout system. The label, showed a high ionization efficiency in positive electrospray ionization (ESI) mode, so the developed BioMS approach was able to screen for estrogens in dietary supplements despite their poor ionization efficiency in both positive and negative ESI modes. The assay and the LC-MS measurements could be performed within 3 h for 96 tests. Estrogens in suspect extracts were identified by full scan accurate mass and collision-cross section (CCS) values from a UPLC-ion mobility (IM)-Q-ToF-MS equipped with a novel atmospheric pressure ionization source. Thanks to the novel ion source, this instrument provided picogram sensitivity for estrogens in the negative ion mode and an additional identification point (experimental CCS values) next to retention time, accurate mass and MS/MS data. The developed combination of bioaffinity screening with UPLC-QqQ-MS and identification with UPLC-IM-Q-ToF-MS provides an extremely powerful analytical tool for early warning of ERα bioactive compounds in dietary supplements as demonstrated by analysis of real-life supplement samples. In the last chapter (Chapter 6) the results obtained in this research are summarized and discussed and the future perspectives of the developed concepts are described. All the concepts presented in this thesis, can easily be extended for screening and identification of a wide range of contaminants. In a next research, to develop a comprehensive screening method, combining various biorecognition elements in one assay should be investigated. The results in this thesis demonstrate the power of bioactivity-based screening combined with mass spectrometric identification. This combination proved to be suitable to screen and identify contaminants which otherwise would remain undetected by conventional instrumental analysis. By Improving these bioaffinity mass spectrometry concepts, by multiplexing and validation, existing food and environmental contaminants can be monitored comprehensively while maintaining the abilities to detect new emerging contaminants.

187
Samenvatting
Ons milieu wordt constant bedreigd door grote hoeveelheden door de mens geproduceerde chemicaliën en natuurlijke stoffen. Bepaalde delen van deze stoffen accumuleren en contamineren de grond en oppervlaktewater waardoor organismen die in dit milieu leven worden getroffen en hierdoor wordt ook de voedselketen gecontamineerd. De Europese Unie (EU) heeft verplichte wetgeving opgelegd aan de EU-lidstaten om mogelijke contaminanten in voedsel en milieu te monitoren. Ten behoeve hiervan zijn er uiterst geavanceerde massaspectrometrie (MS) technieken ontwikkeld die >100 contaminanten kunnen screenen in een enkele meting. Voor snelle en goedkope screening van contaminanten worden doorgaans bioactiviteit-gebaseerde screening testen toegepast die de identiteit van componenten niet kunnen vaststellen op basis van chemisch-fysische eigenschappen. Beide methoden kunnen opkomende onbekende bioactieve contaminanten niet identificeren en daarom is er behoefte aan nieuwe tools en concepten. Dit proefschrift beschrijft nieuwe bioaffiniteit MS concepten voor de screening en identificatie van voedsel- en milieucontaminanten. Hiervoor zijn verschillende bioherkenningselementen, zoals een antilichaam, transporteiwitten en een receptor gebruikt voor de bioactieve isolatie van contaminanten uit verscheidene matrixen. Meerdere vloeistofchromatografie-MS (LC-MS) systemen zijn gebruikt of in vooraf geselecteerde massa mode voor het screenen of in full scan accurate massa mode voor het identificeren van contaminanten. In Hoofdstuk 2 is een concept gedemonstreerd waarin superparamagnetische microbeads, die bedekt waren met monoklonale antilichamen (Mabs), werden gebruikt in een nieuwe directe verdringings Luminex® flow cytometrische immunoassay (FCIA) en dezelfde microbeads werden ook toegepast in een immunoaffiniteits isolatiemethode voor identificatie met nano-ultra-performance-LC-quadrupool-time-of-flight-MS (nano-UPLC-Q-ToF-MS). Als een modelsysteem zijn de mycotoxine ochratoxine A (OTA) en de kruis-reagerende mycotoxine analogen geanalyseerd in tarwe en ontbijtgranen na een simpele extractie waarin de FCIA en anti-OTA Mabs bedekte microbeads werden gebruikt. In de immunomagnetische isolatiemethode werden grotere hoeveelheden beads gebruikt om de ochratoxinen te extraheren uit het monster. Na een wasstap werden de gebonden ochratoxinen gedissocieerd van de Mabs voorafgaande de scheiding en identificatie met het nano-UPLC-Q-ToF-MS systeem. In de verdacht gescreende natuurlijk gecontamineerde monsters, werden OTA en zijn niet-gechloreerde analoog ochratoxine B geïdentificeerd met behulp van full scan accurate MS als bewijs van het concept voor de identificatie van onbekende maar kruis-reagerende mycotoxines. Door de miniaturisatie en de bioaffiniteitisolatie, kan dit concept toegepast worden met andere bioreagentia zoals transporteiwitten en receptoren voor de screening en identificatie van bekende en onbekende (gemaskeerde) voedselcontaminanten. In een andere studie, werd een nieuw competitieve verdringingsconcept ontwikkeld

188
waarin LC-MS zowel voor screening als voor identificatie werd gebruikt. In dit concept, werd Luminex® niet meer toegepast voor de screening, vanwege de hoge prijzen van de Luminex®-compatibele microbeads en daarnaast was het gebruik van een fluorescente reporter molecuul ook een nadeel. Derhalve, werden in Hoofdstuk 3 nieuwe goedkope paramagnetische beads gebruikt in combinatie met een stabiel isotoop MS label voor de analyse van thyroide transporter liganden. Een drievoudig bioaffiniteit MS (BioMS) concept werd ontwikkeld gericht op drie verschillende analytische doeleinden: snelle screening van elke ligand, bevestiging van bekende liganden in overeenstemming met de wettelijke vereisten en identificatie van aankomende onbekende liganden. Deze drie doeleinden deelden samen hetzelfde bioherkenningselement, het recombinante thyroide transporteiwit (rTTR), en specifieke LC-MS modes. Voor screening, werd een snelle radiolabel-vrije competitieve MS binding verdringingsassay ontwikkeld met snelle UPLC-electrospray ionisatie-triple-Q-MS (UPLC-QqQ-MS) als detectiesysteem. Deze methode gebruikte het niet-radioactieve isotopische thyroide hormoon 13C6-L-thyroxine als label waarvan de binding met rTTR verdrongen kon worden door elke ligand zoals thyroide medicijnen of thyroide hormoonverstorende chemicaliën (EDCs). De rTTR werd zowel in oplossing als geïmmobiliseerd op paramagnetische microbeads gebruikt. De concentratie-afhankelijke verdringing van het label, door het natuurlijke thyroide hormoon L-thyroxine (T4) als model analyt, is gedemonstreerd op part-per-trillion (ppt) niveau en in urine op part-per-billion (ppb) niveau. Voor bevestiging van de identiteit van bekende liganden werd rTTR gebruikt voor een bioaffiniteit zuivering voor de bevestiging van het natuurlijk aanwezige vrije T4 in urine. Ter demonstratie van identificatie van onbekende liganden werd hetzelfde rTTR wederom gebruikt in combinatie met nano-UPLC-Q-ToF-MS en urinemonsters gespiket met de model ‘onbekende’ EDCs triclosan en tetrabromobisfenol-A. Deze studie benadrukte de potentie van BioMS waarin een affiniteitssysteem werd gebruikt voor snelle screening, bevestiging en identificatie van bekende en onbekende aankomende thyroide EDCs. Echter, dit BioMS concept was als low-throughput beschouwd en daarom werd in Hoofdstuk 4 een omschakeling gemaakt van low-throughput naar high-throughput screening en identificatie. Een generieke high-throughput BioMS methode werd ontwikkeld en toegepast voor de screening en identificatie van bekende en onbekende recombinante human sex hormone-binding globulin (rhSHBG) gebonden steroïden in voedingssupplementen. Voor screening werd een semi-geautomatiseerde competitieve verdringings bindingassay gecombineerd met een snelle UPLC-QqQ-MS. De assay werd uitgevoerd in een 96-wellsplaat en gecombineerd met de snelle LC-MS konden 96 metingen worden gedaan binnen 4 uur. De concentratie-afhankelijke verdringing van de label door steroïden in voedingssupplementen is gedemonstreerd. Na een aangepaste bioaffiniteits isolatieprocedure werden verdachte monsterextracten geïnjecteerd op een chip-

189
UPLC (NanoTileTM)-Q-ToF-MS systeem voor full scan accurate massa identificatie. Naast de bekende steroïden, werd 1-testosterone geïdentificeerd in drie voedingssupplementen en de designer steroïde tetrahydrogestrinon werd geïdentificeerd in een gespikete supplement. De generieke steroïde-binding assay kan gebruikt worden voor high-throughput screening van androgenen, estrogenen en gestagenen in voedingssupplementen om doping tegen te gaan. Wanneer de test gecombineerd kan worden met chip-UPLC-MS, is deze een sterke tool voor vroegtijdige waarschuwing voor aankomende onbekende rhSHBG bioactieve designer steroïden in voedingssupplementen. In Hoofdstuk 5 werd een andere high-throughput BioMS methode ontwikkeld en toegepast voor de screening en identificatie van recombinante human estrogene receptor α (ERα) binders in voedingssupplementen. Voor screening werd een semi-geautomatiseerde competitieve verdring bindingassay ontwikkeld gebaseerd op 13C2,15N-tamoxifen als label en snelle UPLC-QqQ-MS ingesteld op single reaction monitoring (SRM) mode als detectiesysteem. Het gebruikte label vertoonde een hoge ionisatie-efficiëntie in positieve electrospray ionisatie (ESI) mode en daarom kon de ontwikkelde BioMS methode estrogenen screenen in voedingssupplementen ondanks hun slechte ionisatie-efficiëntie in zowel negatieve als positieve (ESI) modes. De assay samen met de LC-MS metingen konden worden uitgevoerd binnen 3 uur voor 96 monsters. Estrogenen in verdachte extracten werden geïdentificeerd met behulp van full scan accurate massa en collision-cross section (CCS) waarden werden verkregen van een UPLC-ion mobility (IM)-Q-ToF-MS voorzien van een nieuwe atmosferische druk ionisatiebron. Dankzij deze nieuwe ionisatiebron werden met dit instrument gevoeligheden op pictogram niveau behaald in negatieve ionisatie mode met een additionele identificatiepunt (experimentiele CCS waarden), naast retentietijden, accurate massa en MS/MS data. De ontwikkelde combinatie van bioaffiniteit screening met UPLC-QqQ-MS en identificatie met UPLC-IM-Q-ToF-MS verschaft een zeer sterke analytische tool voor vroegtijdige waarschuwing voor ERα bioactieve componenten in voedingssupplementen zoals het gedemonstreerd werd door de analyses van real-life supplementen. In het laatste hoofdstuk (Hoofdstuk 6) zijn alle behaalde resultaten in dit onderzoek samengevat en bediscussieerd en toekomstige perspectieven van de ontwikkelde concepten zijn beschreven. Alle gedemonstreerde concepten in dit proefschrift kunnen gemakkelijk uitgebreid worden voor de screening en identificatie van een breed scala aan contaminanten. In een volgend onderzoek, dient het combineren van verschillende bioherkenningselementen in één test onderzocht te worden voor omvangrijke screening en identificatie van contaminanten. De beschreven resultaten in dit proefschrift demonstreerden de kracht van bioactiviteit-gebaseerde screening gecombineerd met MS identificatie. Deze combinatie toonde aan dat het geschikt is voor screening en identificatie van contaminanten die anders gemist zou worden door conventionele instrumentele

190
analyses. Door verdere verbetering van deze bioaffiniteits-MS concepten door multiplexen of validatie, kunnen bestaande voedsel- en milieucontaminanten uitgebreid worden gemonitord terwijl de capaciteiten voor de detectie van nieuwe aankomende contaminanten worden behouden.

191
Dankwoord

192
Na 8,5 jaar in verschillende groepen gewerkt te hebben, is de tijd gekomen om iedereen te bedanken voor hun bijdrage.
Ik heb gedurende mijn HLO- en Master-opleiding 4.5 jaar in het DBM cluster gewerkt om aan mijn stage en twee afstudeeropdrachten te werken. Tijdens deze periode hebben de mensen van DBM mij veel geholpen om mijn Bachelor of Applied Science en Master of Science diploma’s te behalen. Met name mijn begeleiders Bjorn Berendsen, Tina Zuidema en Linda Stolker wil ik bedanken voor hun bijdragen. Na mijn Master-opleiding werd ik aangenomen als AIO in het BD cluster van Willem Haasnoot. Willem werd mijn co-promotor en Michel Nielen mijn promotor. Ik wil Willem bedanken voor zijn geduld zodat ik allerlei nieuwe technieken en denkwijzen kon leren binnen het BD cluster. Michel, jou wil ik bedanken omdat jij altijd een onuitputtelijke bron van nieuwe ideeën bent geweest. Elke keer als een probleem onoplosbaar leek, had jij een idee waar ik verder mee kwam.
Uiteraard wil ik al mijn collega’s binnen het BD cluster bedanken: Jeroen Peters, Natalie Smits, Dick Hooijerink, Monique Bremer, Anniek Kemmers-Voncken, Monique Bienenmann-Ploum, Susann Ludwig, Sabine Rebe, Anastasia Meimaridou, Laura Lopez en Ana Frangolho Trindade E Silva. Verder mag ik de collega’s buiten het BD cluster niet vergeten te bedanken: Marco Blokland, Paul Zoontjes, Danny Samsons, Hans van Egmond, Arjen Gerssen en Guillaume ten Dam (succes met je onvermijdelijke toekomstige PhD project J).
Next to my colleagues, I’d like also to thank my interns: Alex Shevchuk (thanks for helping me with my first paper), Christos Fryganas (thanks for the practical work for my second paper and good luck with your PhD project and rock on), Ebru Cevik (bedankt voor je bijdrage aan mijn derde artikel), Natalia Gomez (thank you for your contribution to my fourth paper and this thesis).
Ik wil ook mijn vrienden, ouders, zusjes, broertje, zwager, oma en oom bedanken omdat ze mij altijd hebben gesteund en zonder hun steun was ik niet zo ver gekomen. At last but certainly not the least, wil ik Denisse bedanken voor jouw emotionele steun en de vele nuttige wetenschappelijke discussies waarmee jij mij altijd hebt geholpen. Ik kijk er naar uit om nieuwe horizonnen met jou te verkennen.
Payam

193
About the author

194
Curriculum Vitae
Payam Aqai was born on 21th of April 1984 in Iran (Tehran). In 2003, he finished his school for higher general secondary education (HAVO) at the Pallas Athene College in Ede. This was followed by starting his Bachelors in Chemistry at the Hogeschool van Utrecht. During his bachelors, two internships were done, one at TNO in Zeist and one at RIKILT in Wageningen. At TNO, he learned how to perform sample treatment for analysis of pesticides and vitamins with LC-UV/FLU. At RIKILT, he learned how work with LC-MS for monitoring veterinary drugs in food and feed. Following the internship, Payam did also his bachelor thesis at RIKILT which was on developing an LC-MS-based method for the analysis of aminoglycosides in feed. This work was presented as a poster during the EuroResidue VI conference and he received his diploma in 2007. In the same year, he started his Masters of Analytical Sciences at the VU in Amsterdam while working at RIKILT three days a week. In 2009, he started his master thesis which consisted of two parts; influence of sample pre-treatment on the analysis of steroid esters in bovine hair and the influence of extraction procedure on the analysis of beta-agonists. The first part of the thesis yielded a peer reviewed publication and Payam received his masters diploma in 2009. In the same year he started his PhD project which resulted, after four years, in this thesis.

195
List of publications
Peer-reviewed papers related to this thesis:
Aqai, P., Peters, J., Gerssen, A., Haasnoot, W., Nielen, M.W.F. Immunomagnetic microbeads for screening with flow cytometry and identification with nano-liquid chromatography mass spectrometry of ochratoxins in wheat and cereal. Analytical and Bioanalytical Chemistry, Volume 400, Issue 9, July 2011, Pages 3085-3096
Aqai, P., Fryganas, C., Mizuguchi, M., Haasnoot, W., Nielen, M.W.F. Triple bioaffinity mass spectrometry concept for thyroid transporter ligands. Analytical Chemistry, Volume 84, Issue 15, 7 August 2012, Pages 6488-649
Aqai, P., Cevik, E., Gerssen, A., Haasnoot, W., Nielen, M.W.F. High-throughput bioaffinity mass spectrometry for screening and identification of designer anabolic steroids in dietary supplements. Analytical Chemistry, Volume 85, Issue 6, 19 March 2013, Pages 3255-3262.
Aqai, P., Gómez Blesa, N., Major, H., Pedotti, M., Varani, L., Ferrero, V.E.V., Haasnoot, W., Nielen, M.W.F. Receptor-based high-throughput screening and identification of estrogens in dietary supplements using bioaffinity liquid-chromatography ion mobility mass spectrometry. Analytical and Bioanalytical Chemistry, November 2013. Volume 405, Issue 29, Pages 9427-9436.
Other peer-reviewed paper:
Aqai, P., Stolker, A.A.M., Lasaroms, J.J.P. Effect of sample pre-treatment on the determination of steroid esters in hair of bovine calves. Journal of Chromatography A, November 2009, Volume 1216, Issue 46, Pages 8233-8239

196
Overview of completed training activities
Discipline specific activities
Annual conferences NWO CW Studiegroep Analytical Chemistry, Lunteren, The Netherlands, poster presentation/flash presentation (2009-2012)
NVMS annual meetings, The Netherlands, poster presentations (2009-2012)
CRL Workshop, Bilthoven, The Netherlands, oral presentation (2009)
Course Advanced Food Analysis, VLAG, Wageningen, The Netherlands, poster presentation (2010)
International Symposium of Recent Advances in Food Analysis, Prague, Czech Republic, poster presentation (2011)
8th annual LC/MS/MS workshop on environmental applications and food safety, Barcelona, Spain, award winning oral presentation (2012)
General courses
Cell Biology, Wageningen UR, The Netherlands (2009)
PhD week, VLAG, Wageningen, The Netherlands (2010)
PhD Assessment, VLAG, Wageningen, The Netherlands (2010)
Academic English, L. McPhee, Wageningen, The Netherlands (2010)
Philosophy and Ethics of Food Science and Technology, award for debating, VLAG, Wageningen, The Netherlands (2011)
Interpersonal communication for PhD student, VLAG, Wageningen, The Netherlands (2011)
Project- and time management, VLAG, Wageningen, The Netherlands (2011)
Optionals
Seminars, RIKILT, Wageningen, The Netherlands (2009-2013)
Cluster meetings, RIKILT, Wageningen, The Netherlands (2009-2013)
Organic Chemistry Colloquia, Wageningen University, The Netherlands (2009-2013)
MLW excursions, RIKILT, Wageningen, The Netherlands (2011-2013)

197
The research described in the thesis was financially supported by the Dutch Ministry of Economic Affairs and the European Commission.
Financial support from Wageningen University and Research centre for printing this thesis is gratefully acknowledged.
The cover was designed by the author.
Printed by Print Service Ede BV, Ede, The Netherlands