biochemical and functional characterization of plastidial
TRANSCRIPT

Biochemical and Functional Characterization of Plastidial ADP-glucose Transporter
HvBT1 in Barley
by
Atta S. Soliman
A Thesis submitted to the Faculty of Graduate Studies of
The University of Manitoba
in partial fulfilment of the requirements for the degree of
DOCTOR OF PHILOSPHY
Department of Plant Science
University of Manitoba
Winnipeg, Manitoba
Canada
Copyright © 2014 by Atta S. Soliman

II
ACKNOWLEDGEMENT
I am so grateful to my supervisor Dr. Fouad Daayf for his unlimited support and
encouragements during my study program. I would like to thank my committee members
Dr. Belay Ayele and Dr. Marta Izydorczyk for their helpful advices and support. Also, I
would like to thank the Crop Technology Centre (CTC) lab members for the time I have
spent working with them. I would like to thank members of the Department of Plant
Science, the main office and greenhouse staff for their help.
I would like to give special thanks to Mr. Lorne Adam, Dr. Daayf`s technician, for his
kindly help during my program. I would like to convey my gratitude to the Government
of Egypt for the scholarship to conduct my Ph.D. research program in Canada, and The
Natural Sciences and Engineering Research Council of Canada (NSERC) and the Agri-
Food Research & Development Initiative (ARDI) for research grants that supported my
thesis project.
I would like to thank my beloved wife and my lovely kids for their unconditional love
and support during all these years. I thank my parents and all my family members for their
support and encouragement.
III
TABLE OF CONTENTS
Title ............................................................................................................................... I
Acknowledgments ........................................................................................................ II
Table of contents ......................................................................................................... III
List of tables ................................................................................................................. X
List of figures ............................................................................................................. XI
Abbreviations ........................................................................................................... XIII
Forward ..................................................................................................................... XV
Abstract ................................................................................................................... XVI
CHAPTER1: INTRODUCTION AND REVIEW OF LITERATURES
1.1. Introduction ........................................................................................................... 1
1.1.1. Objectives .......................................................................................................... 4
1.2. Literature review ................................................................................................... 5
1.2.1. Barley (Hordeum vulgare L.) ............................................................................. 5
1.2.2. Grain composition .............................................................................................. 6
1.2.2.1. Starch content .......................................................................................... 6
1.2.2.2. Protein content ........................................................................................ 6
1.2.2.3. β-glucan content ...................................................................................... 7
1.2.2.4. Lipid content ........................................................................................... 7
1.2.3. Starch biosynthesis enzymes .............................................................................. 7
1.2.3.1. ADP-glucose pyrophosphorylase (AGPase) .......................................... 7
1.2.3.2. Starch synthase ....................................................................................... 9

IV
1.2.3.2.1. Granule-bound starch synthase (GBSS) ............................... 10
1.2.3.2.2. Soluble starch synthase (SS) ................................................. 10
1.2.3.2.2.1. Starch synthase I (SSI) ......................................... 10
1.2.3.2.2.2. Starch synthase I (SSII) ...................................... 11
1.2.3.2.2.3. Starch synthase III (SSIII) ................................... 12
1.2.3.2.2.4. Starch synthase IV (SSIV) ................................... 13
1.2.3.4.. Starch branching enzymes (SBE) ....................................................... 13
1.2.3.5.. Starch debranching enzymes (DBE).................................................. 14
1.2.3.5.1. Isoamylase (ISA)..................................................14
1.2.3.5.2. Pullulanase (PUL).................................................15
1.2.3.6. Starch phosphorylase (Pho).................................................................16
1.2.4. Sugar transporter .............................................................................................. 16
1.2.4.1. Sucrose transporter .............................................................................. 16
1.2.4.2. Adenine nucleotide transporter ........................................................... 18
1.2.4.3. ADP-glucose transporter ..................................................................... 19
1.2.4.3.1. Structure and function ............................................................ 19
1.2.4.3.2. Characterization of ADP-glucose transporter ........................ 20
1.2.5. Plant transformation ......................................................................................... 21
1.2.5.1. Transformation techniques ................................................................... 21
1.2.5.1.1. Direct gene transfer .............................................................. 21
1.2.5.1.1.1. Biolistic DNA transfer system .............................. 21
1.2.5.1.1.2. PEG-mediated transformation .............................. 22
V
1.2.5.1.1.3. Electroporation-mediated transformation ............. 23
1.2.5.1.2. Indirect gene transfer ......................................................... 24
1.2.5.1.2.1. Agrobacterium-mediated transformation .............. 24
1.2.5.1.2.1.1. Factors affect Agrobacterium infection . 25
1.2.5.1.2.1.2. Optimization of Agrobacterium-mediated
transformation ..................................... 26
CHAPTER 2: BIOCHEMICAL AND MOLECULAR CHARACTERIZATION
OF BARLEY PLASTIDIAL ADP-GLUCOSE TRANSPORTER (HvBT1)
2.1. Abstract ............................................................................................................... 29
2.2. Introduction ......................................................................................................... 30
2.3. Materials and methods ........................................................................................ 32
2.3.1. Plant materials ............................................................................................ 32
2.3.2. Amplification and cloning of HvBT1 ........................................................ 32
2.3.3. Southern blot analysis ................................................................................ 33
2.3.4. Quantitative Real-time RT-PCR ................................................................ 33
2.3.5. Cellular localization of HvBT1 transcripts ................................................ 34
2.3.6. Subcellular localization of HvBT1 protein ................................................ 34
2.3.7. HvBT1 codon optimization ........................................................................ 36
2.3.8. Escherichia coli strains and growth conditions ......................................... 36
2.3.9. Inhibitory effect of the expressed HvBT1.................................................. 37
2.3.10. Membrane protein extraction and SD-PAGE .......................................... 37

VI
2.3.11. Transport assay using E. coli C43 (DE3) strain harboring pET16b::HvBT1
(opc) ...................................................................................................................... 38
2.3.12. Bioinformatics analysis ........................................................................... 40
2.4. Results ................................................................................................................. 40
2.4.1. Bioinformatics analysis of HvBT1 ............................................................ 40
2.4.2. Southern blot analysis of HvBT1 ............................................................... 44
2.4.3. Expression analysis of HvBT1 ................................................................... 45
2.4.4. Cellular and subcellular localization of HvBT1 ......................................... 46
2.4.5. Heterologous expression of HvBT1 in E. coli cells ................................... 47
2.4.6. [α-32
P] ADP-Glucose transport assay ........................................................ 49
2.5. Discussion ......................................................................................................... 54
CHAPTER 3. THE IMPACT OF PLASTIDIAL ADP-GLUCOSE TRANSPORTER
(HvBT1) EXPRESSION ON STARCH SYNTHESIS IN BARLEY
3.1. Abstract ............................................................................................................... 60
3.2. Introduction ......................................................................................................... 61
3.3. Materials and Methods ........................................................................................ 63
3.3.1. Plant material .............................................................................................. 63
3.3.2. RNA extraction and cDNA synthesis .......................................................... 63
3.3.3. Quantitative qRT-PCR analysis ................................................................... 64
3.3.4. ADP-glucose pyrophosphorylase (AGPase) activity .................................. 64
3.3.5. Grain yield and physical parameters ............................................................ 66
3.3.6. Grain composition ........................................................................................ 66
VII
3.3.6.1. Starch, amylose and B-glucan contents .................................................... 66
3.3.6.2. Protein content .............................................................................................. 67
3.3.6.3. Lipid content ................................................................................................. 67
3.3.6.4. Water soluble carbohydrate content .............................................................. 68
3.3.7. Statistical analysis ............................................................................................ 68
3.4. Results ................................................................................................................. 68
3.4.1. ADP-glucose transporter (HvBT1) ............................................................. 68
3.4.2. ADP-glucose pyrophosphorylase (AGPase) ............................................... 70
3.4.2.1. AGPase Large Subunits (LSUs) .................................................... 70
3.4.2.2. ADP-glucose pyrophosphorylase small subunits (SSU) ................ 70
3.4.2.3. Granule-bound starch synthase (GBSS) ........................................ 71
3.4.2.4. Soluble-starch synthase (SS) .......................................................... 74
3.4.2.5. Starch branching enzyme 1 (SBE1) ............................................... 75
3.4.3. ADP-glucose pyrophosphorylase (AGPase) activity ................................... 78
3.4.4. Grain yield and physical parameters ............................................................ 79
3.4.5. Grain composition ........................................................................................ 79
3.4.5.1. Starch and amylose contents .......................................................... 79
3.4.5.2. β- glucan and protein contents ....................................................... 80
3.4.5.3. Lipids content…………………………………………………….81
3.4.5.4. Waster-soluble carbohydrates ........................................................ 81
3.5. Discussion ........................................................................................................... 84
3.6. Conclusion .......................................................................................................... 87

VIII
CHAPTER4. DOWN-REGULATION OF THE PLASTIDIAL ADP-GLUCOSE
TRANSPORTER (HvBT1) IMPAIRS STARCH ACCUMULATION AND ALTERS
GRAIN COMPOSITION IN BARLEY.
4.1. Abstract ............................................................................................................... 88
4.2. Introduction ......................................................................................................... 89
4.3. Materials and Methods ........................................................................................ 92
4.3.1. Plant material and immature embryo isolation ........................................... 92
4.3.2. Cloning of antisense HvBT1 and binary plasmid construct ....................... 92
4.3.3. Agrobacterium strain and binary plasmid transformation .......................... 94
4.3.4. Agrobacterium inoculation and co-cultivation ........................................... 94
4.3.5. Selection of transgenic plants ..................................................................... 95
4.3.6. PCR analysis of transgenic lines ................................................................. 96
4.3.7. Northern blot analysis ................................................................................. 96
4.3.8. Grain morphology and cross section ........................................................... 97
4.3.9. Analysis of grain composition .................................................................... 97
4.3.9.1. Starch content .................................................................................. 97
4.3.9.2. Amylose content ............................................................................. 98
4.3.9.3. Protein content ................................................................................ 98
4.3.9.4. β-glucan content .............................................................................. 98
4.3.9.5. Lipid extraction and thin layer chromatography (TLC).................. 98
4.3.9.6. Water soluble carbohydrate content ................................................ 99
4.3.10. Analysis of grain yield parameters ................................................................ 99
4.3.11. Quantitative qRT-PCR of starch synthesis related genes ............................. 99

IX
4.3.12. Starch granule morphology .......................................................................... 100
4.3.13. Statistical analysis ........................................................................................ 100
4.4. Results ............................................................................................................... 100
4.4.1. Generation and characterization of transgenic barley plants .................... 100
4.4.2. Grain morphology and cross- section ....................................................... 102
4.4.3. Grain composition ..................................................................................... 104
4.4.3.1. Starch content ............................................................................... 104
4.4.3.2. Amylose/amylopectin content ..................................................... 104
4.4.3.3. β-glucan content ........................................................................... 104
4.4.3.4. Protein content ............................................................................. 105
4.4.3.5. Lipid content ................................................................................ 105
4.4.3.6. Water soluble carbohydrate (WSC) ............................................. 106
4.4.4. Starch granule morphology ........................................................................ 108
4.4.5. Grain yield parameters ............................................................................... 109
4.4.6. Expression of starch biosynthesis-related genes ........................................ 109
4.5. Discussion ......................................................................................................... 115
4.6. Conclusion ........................................................................................................ 120
CHAPTER 5: SUMMARY AND CONCLUSION ............................................. 121
REFFERENCES ................................................................................................... 127
APPENDICES ........................................................................................................ 157

X
LIST OF TABLES
Table 2.1 Effect of different metabolites on [α-32P] ADP-glucose transport
activities of HvBT1 .................................................................................................... 53
Table 3.1 Starch biosynthase-related genes specific primer sequences and accession
numbers ...................................................................................................................... 65
Table 3.2 Grain yield-related traits ........................................................................ 79
Table 3.3 Grain composition ................................................................................... 81
Table 4.1 Grain composition .................................................................................. 105
XI
LIST OF FIGURES
Figure 2.1. Phylogenetic analysis of BT1 proteins ................................................... 42
Figure 2.2. Southern blot analysis of barley HvBT1 ................................................ 44
Figure 2.3. Real-time PCR analysis of HvBT1 in different barley tissues ................ 45
Figure 2.4. Cellular localization of HvBT1 ............................................................... 46
Figure 2.5. Subcellular localization of HvBT1::YFP.............................................. 47
Figure 2.6. SDS-PAGE analysis of HvBT1 protein .................................................. 48
Figure 2.7. Transport activity of HvBT1 in intact E. coli cells ................................. 50
Figure 2.8. Exchange of intracellular radiolabeled substrates .................................. 52
Figure 3.1. Expression analysis of the plastidial ADP-glucose transporter (HvBT1) 69
Figure 3.2. Expression of AGPase-encoding genes (AGP) ..................................... 72
Figure 3.3. Expression of granule-bound starch synthase-encoding genes (GBSS) . 73
Figure 3.4. Expression of soluble starch synthase-encoding genes (SSs) ................ 76
Figure 3.5. Expression of starch branching enzyme 1 (SBE1) .................................. 77
Figure 3.6. ADP-glucose pyrophosphorylase (AGPase) activity ............................. 78
Figure 3.7. Stereoscopic analysis of the whole and cross-sectioned grains .............. 80

XII
Figure 3.8. Total lipids content and thin layer chromatography (TLC) ................... 82
Figure 3.9. Water-soluble carbohydrates of barley grains ....................................... 83
Figure 4.1. Map of pBract214::HvBT1 antisense construct .................................... 93
Figure 4.2. PCR and northern blot analysis of barley lines… ............................... 102
Figure 4.3. Grain morphology and cross-section ................................................... 103
Figure 4.4. Total lipids content and thin layer chromatography (TLC) ................. 106
Figure 4.5. Quantification of water-soluble carbohydrates in barley grains .......... 107
Figure 4.6. Starch granule morphology ................................................................. 108
Figure 4.7. Grain yield-related traits of barley wild type and transgenic lines ...... 110
Figure 4.8. Expression analysis of ADP-glucose pyrophosphorylase ................... 112
Figure 4.9. Expression analysis of granule-bound starch synthase genes.............. 113
Figure 4.10. Expression analysis of soluble starch synthase genes ....................... 114

XIII
ABBREVIATIONS
AGPase: ADP-glucose pyrophosphorylase
ADP-Glc: ADP-Glucose
BT1: brittle 1
MCF: mitochondrial carrier family
DAA: days after anthesis
PBS: phosphate buffer saline
ORF: open reading frame
RC: rare codon
IPTG: isopropyl β-D-1-thiogalactopyranoside
3-PGA: 3- phosphoglyceric acid
FITC: fluorescein isothiocyanate
METS: mitochondrial energy transfer signature.
HvBT1: barley plastidial ADP-glucose transporter
SS: starch synthase
GBSS: granule-bound starch synthase
LSU: large subunit
SSU: small subunit
TLC: thin layer chromatography
RF: rate of flow
SEM: scanning electron microscope
WSC: water-soluble carbohydrate
3-PGA: 3-phosphogryceic acid
CTAB: cetyl tri-methyl ammonium bromide

XIV
SS: starch synthase
GBSS: granule-bound starch synthase
SBE1: starch branching enzyme1
PPi: inorganic phosphate
HPLC: high performance liquid chromatography
TLC: thin layer chromatography
HPAEC: high performance anion exchange chromatography

XV
FOREWORD
The thesis has been written in manuscript format as outlined by the Department of Plant
Science, Faculty of Agriculture and Food Sciences, University of Manitoba. The thesis is
divided into five parts; general introduction and literature review followed by three
manuscripts that contain the research parts in the thesis. Each manuscript contains an
abstract, materials and methods, results and discussion. In addition, a general summary
and conclusion, a list of references and appendices are included. The first manuscript
(chapter #2), “Biochemical and molecular characterization of barley plastidial ADP-
glucose transporter (HvBT1)”, has been published in PloSOne
(doi:10.1371/journal.pone.0098524). The second manuscript (chapter #3) and the third
(chapter #4) have been submitted to Plant physiology and biochemistry and BMC Plant
Biology, respectively.

XVI
ABSTRACT
Biochemical and Functional Characterization of Plastidial ADP-glucose Transporter
HvBT1 in Barley
Atta Soliman. Ph.D, University of Manitoba, September, 2014.
Supervisor: Dr. Fouad Daayf.
Starch is the main storage biopolymer in cereal plants. Several enzymes and carrier
proteins are involved in the starch biosynthesis process. ADP-glucose pyrophosphorylase
(AGPase) has been characterized as a key factor in this process, which catalyzes the
conversion of glucose 1-phosphate into ADP-glucose in the cytosol of the endospermic
cell. The freshly synthesized ADP-glucose must be transported into amyloplasts by the
activity of ADP-glucose transporter. In the current research, we have characterized
HvBT1 biochemically in E. coli system. HvBT1 shows high affinity to ADP-glucose as a
transport substrate in counter-exchange with ADP with affinities of 614 and 334 µM,
respectively. The cellular and subcellular localization of HvBT1 indicated its target the
amyloplasts envelopes. The comparison between two barley cultivars; Harrington and
Golden Promise shed some light on the impact of HvBT1 on starch accumulation. Higher
expression of AGPase and HvBT1 (10 fold) provide an ideal combination for improving
starch yield, where starch content was higher by 2.5% in Harrington. Unlike Harrington,
the expression of soluble starch synthase encoded genes was higher in Golden Promise
which accumulates less starch. This result provided evidence of the importance of HvBT1
in starch synthesis process along with AGPase. Down-regulation of HvBT1 also provided
a cement evidence of its effect on the starch accumulation process, where the knock down
XVII
lines showed 17% lower starch and altered starch composition. Also, as a result of
decreasing starch, protein content increased in the transgenic grains by 4-5 % of its
content in the wild type, while β-glucan was 37% lower than the wild type control.
Down-regulation of HvBT1 led to decrease the grain yield by ~ 30% as a result of
increase the grain size. Also, it seems to have pleotropic effects on other starch synthesis
genes, where AGPLs was down-regulated while the plastidial SSU genes, AGPS1b and
S2 were up-regulated. Soluble starch synthases SS2a and SS3a were down-regulated,
while SS2b was up-regulated in the transgenic plants. The accumulated evidences
indicated that HvBT1 is a key factor in starch biosynthesis process.
1
CHAPTER 1: INTRODUCTION AND LITERATURE REVIEW
1.1. Introduction
Starch is considered to be the main storage form of carbohydrates in plants. As storage
compound, starch has unique features which make it a more preferable compound for
short and long term storage than soluble sugars. These features are the osmotic inactivity,
storability in granules and difficulty to convert into a soluble phase, making it a stable
molecule. Starch is synthesized and stored in the old leaves during the day time to be
used later at night time for metabolic reactions and energy production (Geiger et al.
2000). Furthermore, starch has several benefits for human health; one of them being the
development of resistant starches. Resistant starch is a fraction of starch or its
degradation products which are transported from the small intestine into the large bowel.
Starch is fermented in the large bowel by gut bacteria that produce short fatty acids'
chains which decrease colon cancer (Topping and Clifton, 2001). Resistant starch is also
important for human health since its digestion is slow providing the blood stream by
modulate flow of glucose which reduces the insulin demand (Morell and Myers, 2005).
Most starch that is being used in human diet comes from cereal grains. Starch yield is
tightly controlled by grain filling stage during normal plant development. Cereal grain
development can be divided into two large stages; the enlargement stage and the filling
stage. During the enlargement stage, the cell division is accelerated for zygote and
endosperm and water influx into the cell, while in the second stage, the cell division
slows down and storage molecules start to accumulate (Emes et al. 2003). Starch consists
2
of two major compounds; amylose and amylopectin, both consisting of glucose polymers.
In amylose, the glucose monomers bind together by α 1,4- glucosidic bonds and produce
a linear polymer, while amylopectin has another type of bonds; α 1,6- glucosidic bonds
which make branches in the glucose polymers (Martin and Ludewig, 2007). Polyglucans
are renewable and biodegradable compounds used by different industries. The most
important and challenging issue for industry nowadays is to identify and characterize
factors that enhance the effectiveness of starch accumulation and increase starch yield
(Baroja-Fernandez et al. 2004). The increased demand on cereals reflects their
importance worldwide for energy production, human and animal consumption, as well as
other related food applications. The bioethanol production industry is growing and it is a
worldwide concern (Morell and Myers, 2005).
The main source of the carbon which is used for the starch biosynthesis in plants
comes from ADP-glucose. ADP-glucose is synthesized by ADP-glucose
pyrophosphorylase enzyme (AGPase) in the cytosol of endospermic plants especially in
the storage tissues and then imported into the amyloplasts through ADP glucose
transporter protein localized at the amyloplast membrane. Moreover, ADP glucose sugar
is imported in counter exchange with ADP (Bowsher et al. 2007). The majority of
AGPase activity takes place in the plastids in non-endospermic species, but in cereals and
some graminaceous species, 85–95 % of the AGPase activity takes place in the cytosol of
endospermic cells in storage tissues, so the extra-plastidial form of AGPase results into
ADP-glucose production in the cytosol (James et al. 2003). Starch biosynthesis requires
the nucleotide sugar ADP-glucose which is considered as the glucosyl donor in the
reaction catalyzed by starch synthase enzyme (Leorch et al. 2005). ADP-glucose
3
transporter protein is a transmembrane protein located in the amyloplast envelopes
membrane and the polypeptide responsible for the binding site for the substrate (ADP-
Glucose) is a 38 KDa fragment. Recent approaches focused on the low starch mutants
from maize (Brittle 1) and barley (Lys5) which accumulate ADP glucose in the
endospermic cell cytosol, have shown mutations in one or more of the amyloplast
envelop transmembrane polypeptide (Browsher et al. 2007). In maize, the brittle 1 gene
(ZmBT1) which belongs to the mitochondrial carrier family (MCF), has a great effect on
starch accumulation in cereals, particularly in maize (Kirchberger et al. 2007). The maize
mutant that is deficient in ZmBT1 gene accumulates 12 fold higher levels of ADP glucose
in the endospermic cell cytosol than its wild type endosperm (Pien et al. 1996). There is
also a maize homolog in potato (Solanum tuberosum) (StBT1) that has been identified and
functionally characterized as a specific adenine nucleotide uniporter. The main function
of this protein is to provide the cytosol and other cell compartments with ATP which is
originally synthesized in the plastids (Leorch et al. 2005). In barley, the isolated plastids
from lys5 mutants were able to synthesize starch using glucose-1-phosphate, but they
could not synthesize starch using ADP glucose sugar. This suggests that there is a lesion
in the lys5 locus for the plastidial ADP- glucose transporter protein. The gene which
encodes for ADP glucose transporter (HvNST) belongs to carrier family proteins. In this
approach, the most abundant plastidial envelopes membrane proteins isolated and
purified showed homology with maize ADP glucose transporter Brittle1. These findings
suggest a vital role of HvNST in starch accumulation (Patron et al. 2004). The existence
of ADP glucose transporters in some cereal species such as maize and barley points to the
existence of these transporters in all endospermic species (Martin and Ludewig, 2007).

4
1.1.1. Objectives of the work
1- Biochemically and molecular characterization of the barley plastidial ADP-
glucose transporter HvBT1, using an E. coli expression system, and study the
expression and localization of HvBT1.
2- Investigate the possible impact of HvBT1 expression on other starch biosynthesis-
related genes and starch accumulation in two malting barley cultivars; Harrington
and Golden Promise.
3- Investigate the impact of down-regulation of HvBT1 in barley Golden Promise
using antisense approach on grain composition.

5
Literature Review
1.1.2. Barley
Barley (Hordeum vulgare L.) is one of the oldest cereal grain crops worldwide. It is
believed that, in the most authentically reports, barley (Hordeum spontaneum) is the
ancestor of our cultivated barley (Hordeum vulgare L). It is also believed that barley was
domesticated in the Fertile Crescent in the Near East region that represents a part from
Palestine, Israel, Turkey, Syria, Iraq and Iran (Harlan, 1978). There are more evidences
for the multicentre of origin of cultivated barley includes North Africa and Asia. The
DNA marker approaches have been applied to the remains of barley grains in
archaeological sites Near Crescent to investigate the genetic divergences among different
populations. The results indicated that Israel-Jordon region is the site of barley
domestication and the Himalayan region could be the centre of diversifications of
cultivated barley (Badr et al. 2000).
Barley was presumably first used as human food in ancient civilizations alongside
with wheat, and it was considered as “the poor’s men bread “. Thousands of years ago,
barley has been cultivated in the old world such as North Africa, Asia and Europe and
brought to North America by Columbus in 1494 (Newman and Newman 2006). Because
of the prominence of wheat and rice, barley has been used for feed, malting and brewing.
Recently, about two-thirds of the barley crop has been used for feed, one-third for
malting and about 2% for food directly.
In Canada, Barley is growing mainly in the Prairie Provinces; Alberta, Saskatchewan
and Manitoba, and the average annual production of barley in Canada is around 12.5

6
million tons. Barley products have much potential on the human health. Barley β-glucans
act in lowering blood cholesterol and glycemic index. Barley is a rich source of tocols,
including tocopherols and tocotrienols, which are known to reduce serum LDL
cholesterol through their antioxidant properties. In addition, barley flour now is used to
improve the nutritional quality of wheat bread without affecting the bread appearance and
volume. Recently, barley research is refreshed to introduce barley cultivars serving in
different industries for use of the starch and non-starch components in biofuel production
and for human health benefits, respectively.
1.1.3. Grain composition
1.1.3.1. Starch content
Starch is the most important biopolymer in higher plants, which is used in human food
additives and various industries such as bioethanol production as a raw material. Starch
mainly contains two components; amylose and amylopectin. Amylose is a linear polymer
of ɑ- 1,4 linked D-glucopyranose and also some ɑ- 1,6 linked glucan chain (Curá et al.
1995), while amylopectin is branched molecules composed of ɑ- 1,4 linked glucose
chains connected by ɑ- 1,6 linkages (Hood, 1982).
1.1.3.2. Protein content
Barley grains contain approximately 8-13 % proteins on dry matter basis. There is a
negative correlation between starch and protein contents in cereal grains. Seebauer et al.
(2010) reported about inbred maize lines that accumulated high protein contents
accompanied with low starch and high kernel weight. Also, Clarke et al. (2008) reported
that the protein content increased in barley SS2a mutant, which accumulated less starch.
7
1.1.3.3. Β- glucan content
Barley grain contains a wide range of β-glucans that may constitute 3 to 20% of the
grain dry weight, depending on the genotypes and environmental effects (Munck et al.
2004; Fincher and Stone 1986). The cell wall of barley endosperm contains around 75%
of the total β-glucan found in grains (Fincher and Stone 1986) which has high potentials
in reducing blood cholesterol and improve human health (Kalra and Joad 2000; Léon et
al. 2000). However, β-glucan has disadvantages in brewing process.
1.1.3.4. Lipid content
In cereal grains, lipids are found in various compartments such as aleurone layer,
endosperm, embryos and represents 1-3% of the total grain weight (Morrison 1978;
Joacobsen et al. 2005). In barley, lipids are mainly concentrated in the embryos (Price
and Parsons 1979) and also make a complex with amylose especially lysophospholipids
(Morrison 1993).
1.1.4. Starch biosynthesis enzymes
1.1.4.1. ADP-Glucose pyrophosphorylase (AGPase)
In cereals, ADP-Glucose pyrophosphorylase (AGPase) is located in the cytosol and
plastids of the endospermic cells, whereas the activity of AGPase was reported to take
place only in the plastids in other plant species. The total activity of AGPase in the
cytosol is about 85-95 % in the cereal endosperm (Beckles et al. 2001). In the cytosol,
AGPase converts glucose 1-phosphate using ATP into ADP-Glucose which represents
the building blocks of starch synthesis (Stark et al. 1992). AGPase is a heterotetrameric
enzyme that contains two small subunits (SSU) and two large subunits (LSU). The two
8
types of subunits are very essential for the normal activity of AGPase. The highest
AGPase activity occurs in the plastids of the most plant cells (Bae et al. 1990). AGPase
activity in the endosperm was confirmed in the most important cereal crops (Denyer et al.
1996; Sikka et al. 2001; Thorbjørnsen et al. 1996 and Tetlow et al. 2003). In case of the
absence of the large subunits, the small subunits are able to perform the normal enzyme
function but lack the allosteric regulation of the heterotetrameric form (Ballicora et al.
1995). The small subunits are catalytic subunits, whereas the large subunits are thought to
modulate the enzymatic regulatory prosperities. In barley (Hordeum vulgare L.), AGPase
small subunits are encoded by HvAGPS1 gene. This gene encodes for two different
transcripts for the small subunits of the ADP-Glucose pyrophosphorylase enzyme.
Previously, it was assumed that HvAGPS1a encodes for small subunits in the cytosol,
whereas HvAGPS1b encodes for plastidial small subunits (SSU). Another AGPase small
subunit gene HvAGPS2 was identified as the main gene responsible for the plastidial
AGPase small subunits and has a role in AGPase activity in leaves (Rösti et al. 2006).
Low starch barley mutant, Risø 16, showed 80% less starch as compared to the normal
starch level in the parental line. This mutant has 31% of the normal activity of the
AGPase (Johnson et al. 2003). The starch content has been greatly affected in maize
mutants’ shrunken-2 and btrittle-2 which have less than 2% of the normal AGPase
activity and accumulate less than 25% of the normal starch yield (Tsai and Nelson 1996).
In non-photosynthetic organs, starch is synthesized from the dominant photosynthetic
molecule (sucrose) which is imported into the cytosol of developing storage organs.
Sucrose is catabolised in the cytosol and mitochondria to produce starch synthesis
precursors, glucose 6- phosphate and ATP (Comparot-Moss and Denyer 2009). Both

9
molecules are imported into the plastids via glucose phosphate/phosphate transporter and
ATP/ADP transporter (Neuhaus and Wagner 2000).
1.1.4.2. Starch synthases
Starch synthase (SS) exist in all plants in multiple isoforms. Starch synthase isoforms
have conserved functional domains. The C-terminal domain has two ADP-glucose (ADP-
Glc) binding sites and a glucosyle transferase domain (Denyer et al. 2001). The N-
terminal varies among isoforms and species. The main function of starch synthase (SS) is
to catalyze the transfer of the glucosyle unit of ADP-Glc to the non-reducing end of the
elongated glucan chain (Jeon et al. 2010). Those isoforms are also expressed in maize and
wheat endosperm (Gao et al. 1998; Li et al. 2000). Those isoforms are encoded by
multiple genes in cereals and their expressions are tissue-dependent. In maize, SSII has
two isoforms (SSIIa and SSIIb) which are encoded by different genes. SSIIa gene is
expressed mainly in the endosperm, while SSIIb is expressed in leaves. The Granule-
bound starch synthase I (GBSSI) is expressed in different tissues by multiple genes (Harn
et al. 1998; Tomlinson and Denyer, 2003). In wheat, there are multiple tissue-specific
isoforms of GBSSI. Those isoforms are encoded by two types of genes; one gene is
expressed in the endosperm and pollen grains, while the other one is expressed in the
pericarp (Vrinten and Nakamura 2000). In Arabidopsis, there are four starch synthase
isoforms (GBSS1, SS1, SSII, SSIII and SSIV) have been identified. Ten starch synthase
isoforms have been characterized in rice (Hirose and Terao 2004; Ohdan et al. 2005).
1.1.4.2.1. Granule-bound starch synthase (GBSS)

10
In cereals, there are two forms of GBSSs; GBSSI and GBSSII. This class of starch
synthases is associated with the starch granules unlike other classes of starch synthases
which are found partially or entirely in the soluble phase in the plastids (Tomlinson and
Denyer 2003). The main function of this class of SS is to elongate the amylose chains in
the growing starch granules. Moreover, GBSSI has a role in amylopectin biosynthesis
through elongating the long glucans in potato and rice (Denyer et al. 1996; Hanashiro et
al. 2008). GBSSI is expressed mainly in storage organs, while the GBSSII is expressed
in non-storage tissues and is responsible for transitory starch accumulation (Vrinten and
Nakamura, 2000). In cereal, GBSSI is encoded by genes located in waxy locus.
Mutations in waxy locus led to change in starch composition but not in starch content.
The loss of GBSS activity results in low amylose content or lacking amylose completely
in starch and produce waxy starch (Fujita et al. 2001; Visser et al. 1991). In barley, the wx
mutants showed about 9% reduction of amylose content. This reduction is a result of the
deletion of a part of wx promoter and 5’ untranslated region of GBSSI gene in some low
amylose cultivars. On the other hand, amylose is completely undetectable in starch in
some barley waxy mutants (Patron et al. 2002).
1.1.4.2.2. Soluble starch synthase
1.1.4.2.2.1. Starch synthase I (SSI)
Starch synthase I (SSI) unlike other starch synthases, is unique and there is no known
isoforms for it. Using anion exchange chromatography analysis, SSI represented the
major soluble proteins in rice endosperm, where its activity was about 70% of the total
SS activity (Fujita et al. 2006). The main role of SSI is to elongate the short amylopectin
chains with DP < 10. Studies on cereal mutants and transgenic plants demonstrated that

11
SSI shows high affinity to the short amylopectin chains and work on chains A and B1 as
substrates until reach a critical length (Commuri et al. 2001; Guan et al. 1998; Jeon et al.
2010). Analysis of some rice SSI mutants showed reducing of the chains DP 8-12, while
the chains with DP 6-7 and 16-19 increased. These data demonstrate that SSI works only
on the short chains with DP 6-7 and generates chains with DP 8-12 (Fujita et al. 2006).
Analysis of Arabidopsis SSI mutants showed that the deficiencies in the SSI activity had
no effect on starch granules, seed size, or shape (Delvalié et al. 2005). These results
demonstrate that there are other SS isoforms which are able to compensate the reduction
of the SSI activity. In cereal, SSI is expressed in the early stage of seed development (5-
10 DAP). The decreasing activity of SSI is assumed to be a result of entrapping of the
proteins in the growing granules, which would make it not accessible to the substrates
(Peng et al. 2001).
1.1.4.2.2.2. Starch synthase II (SSII)
In monocot, there are two isoforms of SSII; SSIIa and SSIIb. SSIIa is functional in
endospermic tissues while SSIIb is mostly functional in photosynthetic tissues (Tetlow
and Emes 2011). SSII isoforms are located in the granules along with GBSSI in different
cereal species. In maize, two SSII isoforms are characterized in vitro, which showed
affinity to different substrates and kinetic properties (Imparl-Radosevich et al. 2003).
Studies on different cereal crops demonstrated that the loss of function of SSII reduced
the starch content and affect the amylopectin chain length and granule morphology. The
loss of SSII activity results in alternations of the granule size and shape in wheat sgp1
and barley sex6 mutants (Morell et al. 2003; Yamamori et al. 2000). Maize sugary2 (su2)
mutant which lack SSIIa activity showed increased frequency of short chains of the

12
amylopectin (DP 6-11) and decreasing of the abundance chains (DP 13-20). The same
effect has been observed in different mutants of barley and wheat (Morell et al. 2003;
Zhang et al. 2004; Yamamori et al. 2000).
1.1.4.2.2.3. Starch synthase III (SSIII)
Starch synthase III is the second abundant SS in terms of the activity in the
endosperm of maize and rice (Cao et al. 1999). In rice, two isoforms of SSIIIs were
identified; SSIIIa and SSIIIb, which are expressed in endosperm and leaf tissues,
respectively (Dian et al. 2005). The main role of the SSIIIs is to elongate the long glucan
chains of amylopectin molecules (Fujita et al. 2007). The rice ssIIIa mutant showed
reduction of glucan chains with DP 6-8, DP 16-20 and DP ≥ 30 and increase in the
intermediate chains. The analysis of the rice ssIIIa mutants revealed that SSIIIs are
involved in amylopectin synthesis from intermediate chains (Ryoo et al. 2007; Fujita et
al. 2007). In maize, the du1 mutants produced endosperm with a dull appearance. The
glassy endosperm phenotype leads to the abnormal starch granule morphology (Gao et al.
1998). On the other hand, changes in the starch granule morphology and crystallinity,
along with a reduction in the distribution of long-glucan chains, have been observed
(Ryoo et al. 2007). This observation demonstrates the role of SSIII in amylopectin
synthesis through elongating the long glucan chains. In potato, expressing the antisense
from SSIII led to change in the long glucan chain distribution and affects the amylopectin
structure and consequently starch granule morphology (Abel et al. 1996; Lioyd et al.
1999).
1.1.4.2.2.4. Starch synthase IV (SSIV)
13
The complete function of the SSIV in the contribution of the glucan chain length in
cereals is still unknown. In rice, two genes of SSIV; SSIVa and SSIVb have been
identified and expressed constantly during grain filling. This finding suggested the
possible role of these genes in starch synthesis in the endosperm (Hirose and Terao 2004;
Dain et al. 2005). In Arabidopsis, ssIV/dull mutant has been identified but not in other
plant species. This mutant showed severe growth deficiency and display not only
reduction in the number of starch granules per plastid but also increasing the starch
granule size. These results suggested that possible role of SSIV in the priming of starch
granule formation (Roldán et al. 2007). Another study on Arabidopsis ssIV mutant
reported that SSIV is necessary for establishing and priming new starch granules. The
function of SSIV in priming the starch granules can be partially compensated by SSIII.
The loss of function of both SSIV and SSIII results in inhibition of starch granules
(Szydlowski et al. 2009).
1.1.4.2.3. Starch branching enzymes (SBEs)
The function of this type of enzymes is to catalyze the formation of branch points by
cleaving the- (1, 4) polyglucan linkage and connect the chains via α- (1, 6) linkage. BEs
belong to α- amylase superfamily and able to create α- (1, 6) linkages on the glucan
chains (Jespersen et al. 1993). There are two major classes of SBEs: SBEI (SBEb) and
SBEII (SBEa). The differences between the two classes result in the glucan chain length
and substrate specificity. SBEI shows high affinity to branching amylose molecules,
while SBEII shows high affinity to amylopectin (Guan and Preiss 1993). Analysis of
SBEIa mutant (sbe) in rice showed significant reduction in the abundance of long glucan
chains of amylopectin, while short and intermediate glucan chains increased. On the other

14
hand, the sbe1 mutant starch showed high resistance to gelatinization because of higher
proportion of long glucan chains (Satoh et al. 2003). In cereal, there are two isoforms of
SBEII; SBEIIa and SBEIIb. SBEIIa is expressed mainly in photosynthetic tissues, while
SBEIIb is expressed in the endosperm. In wheat, the double mutant of SBEIIa and SBEIIb
produced high amylose starch phenotype (Regina et al. 2005). High amylase starch
phenotype in maize has been produced as a result of a mutation in SBEIIb (Yun and
Matheson 1993). Suppression of all SBE genes in barley produces amylose only starch
(Carciofi et al. 2012) that indicates the essential role of the SBE in amylopectin synthesis
and structure.
1.1.4.2.4. Starch de-branching enzymes (DBEs)
Two classes of starch branching enzymes (DBEs) have been characterised; isoamylase
(ISA) and pullulanase (PUL). These types of enzymes hydrolyze the ɑ-1.6 linkages of
polyglucans. Both groups of enzymes have preferred substrates.
1.1.4.2.4.1.Isoamylase (ISA)
The impact of isoamylase on starch granules has been investigated via mutations in
ISA genes. In maize, the sugary1 (su1) mutant, which is deficient in ISA1 activity was
isolated from cDNA of developing kernels that showed effect on the endosperm, where
more short chains of amylopectin were detected along with phytoglycogen accumulation
(James et al. 1995; Burton et al. 2002; James et al. 2003). In rice, transgenic plants
expressing antisense of ISA1 produced sugary-amylopectin as in maize. The su1 function
was restored by transforming rice su1 mutant with the wheat ISA gene, where the access
phytoglycogen was substituted by amylopectin (Fujita et al. 2003; kubo et al. 2005). An

15
Arabidopsis mutant lacking all DBE proteins was not capable of forming starch granules,
but highly branched glucans (Streb et al. 2008). It has been reported that the main
function of ISA was to edit the highly branched chains or remove the unappropriate
positioned branches of amylopectin and maintain cluster structures (Buléon et al. 1998;
Nakamura 2002).
1.1.4.2.4.2.Pullulanase (PUL)
Pullulanase (PUL) debranches pullulan and amylopectin, unlike ISA, which
debranches phytoglycogen and amylopectin (Nakamura et al. 1996). PUL is assumed to
act on starch degradation during grain germination. Recent data from rice and maize
indicated that PUL has been detected in developing grains, where PUL gene showed high
expression during grain development (Nakamura et al. 1996; Beatty et al. 1999). Gene
expression data indicated that PUL is involved in the starch biosynthesis process as ISA.
Confirmation of PUL’s function was obtained from rice PUL-deficient mutants. The
double mutant pul/su1 showed higher increase in the short chains than pul mutant alone
(Fujita et al. 2009). In maize, the PUL-deficient mutant zpu1-204 did not show significant
differences in starch composition, while the double mutant zpu-2041/su1 showed high
accumulation of phytoglycogen in the endosperm (Dingers et al. 2003). Starch
composition has not been affected by mutations in ISA or PUL on equal foot, but PUL is
assumed to compensate for ISA and is involved in starch biosynthesis in cereal
endosperm (Jeon et al. 2010).
1.1.4.2.5. Starch phosphorylase

16
There are two types of starch phosphorylase enzymes in plants, plastidial Pho1 and
cytosolic Pho2. This group of enzymes catalyzes the removal of glucosyl units from the
non-reducing ends of amylopectin chains and the forming of glucose 1-phosphate.
Generally, starch phosphorylase is assumed to act on the degradation of phosphorolytic
glucan (Steup 1988). Recently, Pho1 has been assumed to function on the surface of the
starch granule, modifying starch structure and releasing glucose 1-phosphate to be
recycled by starch synthase in building glucan chains (Tetlow et al. 2004). In rice, pho1
mutant showed abnormal endosperm by accumulating small starch granules (Satoh et al.
2008). In wheat, starch phosphorylase Pho1 proteins increased in conjunction with other
starch branching and starch synthase protein levels (Tickle et al. 2009). Pho1 synthesizes
long chain malto-oligosaccharides (MOS) from glucose 1-phosphate, which provide
evidence for its function in the glucan initiation process (Jeon et al. 2010).
1.1.5. Sugar transporters
1.1.5.1. Sucrose transporters
Sucrose is the primary product of photosynthesis in plants. It is partitioned from the
synthesis location and assimilated to sink and storage tissues. Sucrose could be stored in
form of starch or fatty acids or degraded into various metabolites. Sucrose moves
passively from cell to cell through plasmodesmata or positively in different tissues
through a sucrose transporter protein (Sauer 2007). Sucrose transporter is essential for
plant growth and development, where it works for allocation of assimilates from sources
to sinks. Sucrose transporter proteins could interact with other metabolic pathways and
other developmental process to coordinate the whole plant communication. Studying the

17
function of sucrose transporter, sucrose facilitator and sucrose-like proteins has opened a
new area of research for the role of cell compartmentations on metabolism and signalling
of sucrose transporter in plants (Kühn, 2010). The genome sequence analysis and
phylogenetic approaches provided more information about the members of the Major
Facilitator Superfamily (MFS). Different sucrose transporter genes have been identified
form different species. Nine sucrose transporter genes from Arabidopsis and five form
rice have been identified (Aoki et al. 2003). The genome sequence analysis of some
monocotyledonous plants has divided the sucrose transporter into five groups. The
monocot sucrose transporter has been classified into two distinct groups (VI and V)
(Braun and Slewinski 2009). The monocot sucrose transporter proteins are highly
specific, unlike dicot SUTs (Sivitz et al. 2007). Many SUT genes have been identified and
characterized from sugarcane, barley and rice. In sugarcane, SUT gene is expressed in
maturing stems and assumed that it plays an essential role of sucrose accumulation in
stalks (Reinders et al. 2006). In rice, down-regulation of OsSUT1 using antisense
technique affected the gain weight, germination and seedlings development (Furbank et
al. 2001; Ishimaru et al. 2001). OsSUT1 is involved in retrieving of sucrose from
apoplasm (Scofeid et al. 2007). The monocot sucrose transporter group I was functionally
characterized in different cereal plants. The barley sucrose transporters HvSUT1 and
HvSUT2 are responsible for sucrose loading in phloem and sink tissues (Weschke et al.
2000).
1.1.5.2. Adenine nucleotide transporter
The most important differences between photosynthetic and non-photosynthetic
plastids are the presence and absence of the photophosphorylation process, respectively.
18
Heterotrophic plastids require ATP energy molecules which can be generated from
cytosolic organelles by substrate phosphorylation (Emes and Neuhaus 1997). ATP/ADP
transporter was identified as a second type of eukaryotic adenylate carrier proteins
(Kampfenkel et al. 1995). ATP/ADP transporter from Arabidopsis (AtAAPT1) was
characterized biochemically in E. coli which confirmed the functional prosperities of
transporting ATP in counter exchange with ADP (Tjaden et al. 1998). Plastidial
ATP/ADP transporter proteins possess 11 to 12 membrane domains and exist in all
higher and lower plant species (Winlker and Neuhaous 1999; Linka et al. 2003). In potato
(Solanum tuberosum), a homolog of BT1 was identified as a mitochondrial carrier protein
by phylogenetic analysis. The difference between BT1 from maize and potato is that
maize ZmBT1 has been characterized as ADP-Glucose transporter protein, while StBT1
has been characterized as adenine nucleotide uniporter that can transport various types of
nucleotides; AMP, ADP and ATP. Expression of StBT1 in E. coli system led to
functional integration of StBT1 protein in the E. coli cell membrane and transport of
adenine nucleotides (Leorch et al. 2005). Arabidopsis plant (Arabidopsis thaliana)
possesses two isoforms of ATP/ADP transporter (AtNTT1 and AtNTT2). AtNTT1 is a
sugar induced form expressed mainly in stems and roots, whereas AtNTT2 is expressed in
various Arabidopsis tissues (Reiser et al. 2004). Recently, a new Arabidopsis ATP
transporter (AtPM-ANT1) has been identified and characterized. The function of this
transporter was identified as exporting ATP molecules that work as extracellular signal
molecules. These signal molecules are required for pollen maturation and anther
dehiscence (Rieder and Neuhaous 2011)
1.1.5.3. ADP-Glucose transporters

19
1.1.5.3.1. Structure and function
The ADP-glucose transporter is a member of the mitochondrial carrier family. This
family works as carriers for different metabolites. ADP-glucose transporter does not
show high similarities at the DNA or protein levels with the nucleotide sugar transporters
which belong to drug metabolite transporter super family (Patron et al. 2004; Tjaden et al.
2004). The prediction of the ADP-glucose transporter protein structure showed that the
protein is one polypeptide chain and works as a monomer. It contains six membrane
domains connected by inter loops inside and outside the membrane. The N- and C-
terminals are located in the cytosolic side of the membrane (Swissprot data base). In the
endospermic cell, the majority of ADP-glucose is synthesized in the cytosol and `should
be imported to amyloplasts for starch biosynthesis (Comparot-Moss and Denyer 2009).
ADP-glucose transporter is assumed to be a key factor in starch biosynthesis process. It
has a potential effect on the plastidial ADP-glucose content in the amyloplasts and
subsequently on the starch accumulation and quality (Tjaden et al. 1998; Clarke et al.
1999). Importing ADP-glucose into amyloplasts cannot be carried out by ATP/ADP
transporter, because it is highly specific to nucleotides but not to nucleotides sugars
(Emes et al. 2003). The BT1 locus in maize encodes a protein with 38-42 kDa localized
in maize amyloplast envelopes and is believed to have a role in the transport of ADP-
glucose (Sullivan et al. 1995; Shannon et al. 1998). Study on wheat endosperm
amyloplasts has demonstrated the presence of the ADP-glucose transporter proteins in the
amyloplast envelopes (Emes et al. 2001). Different barley low-starch mutants were tested
for starch accumulation. It was assumed that the ADP-glucose transporter gene is located
in the Lys5 locus on the chromosome 6H. Two of the low starch mutants showed an
20
amino acid substitution in the conserved domain for all members of the carrier proteins
family of. This finding strongly supports the idea of the ADP-Glucose transporter gene is
located in the Lys5 locus. Starch analysis of the low starch mutants showed high
accumulation of ADP-Glucose in the endospermic cell cytosol (Patron et al. 2004).
1.1.5.3.2. Characterization of ADP-Glucose transporter
The transport activity of different phosphorylated sugars was investigated using the
amyloplast envelop membrane. The maize amyloplast envelop proteins were functionally
reconstituted in the proteoliposomes. The results showed that the amyloplasts are able to
transport glucose 6-phosphate, hexose phosphate and ADP-glucose which work as
substrates for starch biosynthesis (Möhlmann et al. 1997). Maize ADP-glucose
transporter (ZmBT1) was the first characterized homolog in cereal plants. The
heterologous expression of this gene in E. coli led to functional integration of the
expressed protein to the plasma membrane of E. coli cells. The transport assay with the
radiolabeled substrate; (14
C) ADP-Glc showed that the ability of the expressed protein to
transport the substrate in in counter exchange of ADP with affinity of 850 and 465 µM of
ADP-Glc and ADP, respectively (Kirchberger et al. 2007). In wheat, ADP-glucose
transporter was characterized using the reconstituted amyloplast envelops proteins in
proteolosomes. The uptake of the ADP-glucose was correlated with the ADP and AMP as
in counter-exchange substrates (Bowsher et al. 2007).
1.1.6. Plant transformation
Transformation of cereal crops is still genotype-dependent. A few numbers of cultivars
from different cereal crops are suitable for transformation process. Barley Golden
21
Promise is one of the model cultivars which can be used to study the function of different
pathways in cereals. The advantages of using barley for transformation are the less
genomic complexity than wheat and high callus induction and regeneration. The most
elite cereal cultivars are still recalcitrant for transformation because of their resistance to
Agrobacterium infection and tissue culture (Emes et al. 2001). Successful transformation
depends on the gene expression cassette, the technique of DNA transfer and the tissue
culture techniques which used to produce fertile transgenic plants (Repellin et al. 2001).
1.1.6.1. Transformation techniques
1.1.6.1.1. Direct gene transfer
1.1.6.1.1.1. Biolistic DNA transfer system
The biolistic transformation or particle bombardment was the most common method
for transformation of cereal crops. The main objective of this technique is to investigate
the transient gene expression. Successful transformation of cereal crops using this method
has been reported to produce stable transgenic plants (Danilova, 2007). The
transformation of the woody plants using Agrobacterium has many limitations because of
the bacterial host range and poor tissue culture conditions. The biolistic transformation
can overcome the first barrier of Agrobacterium transformation. A successful attempt of
using biolistic-mediated transformation was performed on a fruit tree (Feronia limonia
L.). Transient expression of GUS gene and stable transgenic plants have been obtained by
Purohit et al. (2007).
One of the disadvantages of the biolistic delivery system is the high copy number in
the transgenic plants. The high copy number in the genome of same cell leads to gene
22
silencing and instability. In maize, the transgenic plants obtained from using the biolistic
gene delivery system resulted in copy number from 1-20 copies. The best performance
was found in maize plants that carried copies ranging from 1- 4 (Walters et al. 1992) and
3-8 copies (Brettschneider et al. 1997). The size of the introduced genes is another
limiting factor of using the biolistic gene delivery system. The DNA fragments larger
than 10 kb could be difficult to be introduced by this system because of poor adhering to
the gold particle and damage during the bombardment. However, transformation of DNA
fragments smaller than 10 kb showed high rate of success in many studies (Register et al.
1994; Tang et al. 2000). Commercial barley cultivars are still difficult to use as a material
for transformation. Improving transformation approaches can help dragging the elite
cultivars to genetic transformation. Shoot meristematic culture was used for biolistic-
mediated transformation of oat and barley commercial cultivars. The transgenic plants
showed stability over generations (Zhang et al. 1999).
1.1.6.1.1.2. PEG – mediated transformation
The first transgenic cereal plant was produced by the direct DNA transfer using the
protoplast (Toriyama et al. 1988). The use of protoplast cells eliminates the barriers
related to some properties of plant cells. Stable transformed plants from different cereal
plants have been produced via protoplast transformation. Stable transformation from
barley (Hordeum vulgare L.) was first obtained using PEG-mediated DNA transfer. Cell
suspension is the relevant plant material to obtain protoplasts for stable transformation
(Lazzeri et al. 1991; Nobre et al. 2000). In rice, fertile transgenic plants were obtained
using PEG-mediated transformation of protoplast from cell suspension (Kayashimoto et
al. 1990). Chloroplasts have also been used for PEG-mediated DNA transfer in tobacco.
23
1.1.6.1.1.3. Electroporation- mediated transformation
Electroporation is a direct method of introducing DNA into plant protoplasts. The
potential advantages of electroporation are high DNA delivery rate, the viability of the
electroporated cells, applicable for single cell (protoplast) and cell clusters and low cost
over other transformation techniques (Prasanna et al. 1997; Sorokin et al. 2000). The
disadvantage of using electroporation is the high rate of damage to the DNA constructs
due to the electric pulsing (Danilova, 2007) and undesirable mutations (Somaclonal
variations) in the culture of cell suspension and protoplasts (Lorz and Lazzeri 1992). The
great success obtained using electroporation led the use of more plant materials other than
protoplasts. Different parameters were optimized to improve the efficiency of
electroporation such as mechanical wounding and enzymatic treatment of the explants to
facilitate the DNA uptake (Vain et al. 1995). Several optimizations were conducted to
increase the efficiency of electroporation method. Gürel and Gozukimizi (2000)
investigated the optimal conditions for electroporation of barley mature embryos. The
conditions for successful mature barley embryo electroporation are found to be 500 v/cm
and 500 µFd capacitance, as these conditions produced healthy geminating seedlings.
Other parameter tested is culture duration of the embryos before electroporation. The best
culture duration was found to be 3 days-old culture that produced the highest germination
frequency. Other studies on main cereal crops indicated the potentials of the
electroporation as a method for plant transformation. Successful transformation has been
obtained using electroporation of rice embryos (Tada et al. 1990), maize embryos and
pollen grains (Songstad et al. 1993; Leedell et al. 1997) and wheat embryos (Kloti et al.
1993; He and Lazzeri, 1998). Further optimization of electroporation-mediated
24
transformation has been conducted on rice immature embryos, which indicated the
possible application of this technique for genetic transformation as well as to investigate
the genetic regulation in embryos (Yu-jun and Jie, 2008).
1.1.6.1.2. Indirect gene transfer
1.1.6.1.2.1. Agrobacterium-mediated transformation
Agrobacterim tumefaciens is a soil-born plant pathogen which mainly infects
dicotyledonous plant species. It infects plant roots and produces crown gall tumor
disease. The genus of Argrobacterium contains different species which have different
host range disease symptoms: for example, A. tumefaciens causes crown gall disease, A.
radiobacter is avirulent species, A. rhizogenes causes root hairy disease, while A. rubi
cause cane gall disease. Another Agrobacterium species; A. vitis was recently
investigated that makes disease in grape and other limited plant species (Gelvin, 2003;
Otten et al. 1996). Agrobacterium tumefaciens has high ability to transfer a foreign DNA
(T-DNA) to the plant cell nucleus. This T-DNA integrates to host cell genome (Binns and
Thomashaw 1988). Agrobacterium T-DNA contains different genes: oncogenes and
opine synthesis genes. The oncogenes encode enzymes that are involved in hormone
synthesis that enhance tumor formation. Opine synthesis genes encode for enzymes that
involve in opine biosynthesis. Opines are mixture of amino acids and sugars used by
Agrobacteriun cells as carbon and nitrogen sources (Gustavo et al. 1998; Zupan and
Zambrysky, 1995). Ti plasmid is the major genetic factor which determines the host
range (Thomashow et al, 1980). Different vir genes are known on Ti plasmid which
determines the plant host range for each species. In maize, virH gene increases the ability
25
of Agrobacterium to induce infection. Other vir genes induce hypervirulance in some
other strains (Jarshow et al. 1991).
1.1.6.1.2.2. Factors affecting Agrobacterium infection
Different factors affect Agrobacterium-plant interaction. Vir genes in Agrobacterium
cells are activated during the co-cultivation with the plant cells. This type of signalling
genes are constitutively expressed in Agrobacterium cells at low levels. Vir genes mainly
include two distinct genes; VirA and VirG (Satchel and Nester 1986; Winans et al. 1988).
VirA genes encode membrane-bound sensor kinase proteins that are autophosphorylated
at conserved histidine residues and transfer the phosphate to the VirG proteins that act as
a cytoplasmic regulator. The VirA/VirG system can be auto-controlled or controlled by
the host plant using different exudates (Brencic and Winans 2005). Phenolic compounds,
pH and monosaccharaides in the co-cultivation media contribute to the efficiency of
Agrobacterium-plant interaction. Co-cultivation temperature is also essential for the
transfer of the T-DNA from Agrobacterium cells into plant cells. Studies on
Agrobacterium-plant interaction revealed that the efficiency of T-DNA transfer is higher
at low temperature (19 °C) and reduced significantly at high temperature (31°C) (Fullner
and Nester 1996). Acteosyringone, a phenolic compound, plays an important role in
increasing the T-DNA transfer efficiency. In dicotyledonous species, mechanical damage
such as wounding causes the release of phenolic compounds, which act as inducers for
the Vir genes in Agrobacterium. These phenolic exudates help Agrobacterium cells to
recognize the host plant and transfer T-DNA into the plant cells. In monocot species,
Agrobacterium does not recognize the host because monocots fail to produce phenolic
compounds which Agrobacterium cells need to recognize the host. So adding

26
acetosyringone to the cultivation media improves the transformation efficiency in
monocotyledonous cells (Messens et al. 1990). It is reported that low pH and low PO4 can
induce the Vir genes and increase the transformation (Winans 1990). Another factor that
affects Agrobacterium-plant interaction and increase transformation efficiency is the
surfactant, i.e., silwet L77 (Whalen et al 1991).
1.1.6.1.2.3. Optimization of Agrobacterium-mediated transformation
Agrobacterium-mediated transformation is the relevant choice for plant
transformation. This method has many advantages over other methods regarding to the
low copy number, more stability over generations and reduces gene silencing associated
with the integration position of the T-DNA ( Shou et al. 2004; Barkat et al. 1997).
Agrobacterium-mediated transformation has advantage of introducing different constructs
in the same cell. This feature helps to remove the antibiotic marker genes from the
transgenic plants and eliminate the restriction of marketing the transgenic plants (Miller
et al. 2002; Matthews et al. 2001).
There are still restrictions of using Agrobacterium-mediated transformation approach
in cereal crops. The transformation in cereal crops is still genotype-dependent and
restricted to certain tissues as explants (mature and immature embryos) (Shrawat and
Lorz 2006). Also the culture conditions of Agrobacterium and plant tissue culture need
more improvement to allow transformation of recalcitrant cultivars (Cheng et al. 2004).
Most barley transformations are done on immature embryos, derived calli and
microspores as explants, due to their high regeneration capacity (Zhang et al. 2000).
Another application of Agrobacterium-mediated transformation in barley is sequence
27
analysis of T-DNA and barley genomic DNA junctions. This approach helps to
understand the mechanism of integration of the foreign DNA to plant genome. On the
other hand, it allows tracking the T-DNA in plant cells to study its fate and the factors
which affect the DNA delivery (Fang et al. 2002). Improving the regenerability and
decrease the albinism were the main objectives of the study by Cho et al. (1998). The loss
of regenerability and production of albino plants are the main obstacles for improving the
plant transformation of the North American barley cultivars such as Harrington cultivar.
In this study, the tissue culture conditions were optimized to increase the regenerability
due to change in the developmental status in the culture. Increasing the concentration of
ammonium nitrate in the growth medium led to increase efficiency of Agrobacterium-
mediated transformation (Boyko et al. 2009). Different protocols have been established
for Agrobacterium- mediated transformation in different cereals. In wheat, high
transformation efficiency has been obtained using Agrobacterium tumefaciens AGL1
strain. Immature embryos are the best explants that can be used to generate transgenic
wheat plants. The transformation protocol is relevant for durum, spring and winter wheat
cultivars. The transformation efficiency which has been calculated based on the PCR
reaction on the transgenic wheat lines was ranged between 0.3–9 % (Wu et al. 2009). In
barley, the protocol for Agrobacterium-mediated transformation has been optimized by
Harwood et al. (2009). In this protocol, barley immature embryos as explants and
Agrobacterium tumefaceins AGL1 strain have been used. The importance of this
protocol comes from the number of the fertile transgenic barley plants obtained that
allows studying the gene function. Other protocols have been established for wheat
transformation using Agrobacterium via floral dip and in planta inoculation. The

28
transformation ratios obtained from Floral dip and in planta inoculation are 0.9 – 10 %
and 5%, respectively (Agarwal et al. 2009; Risacher et al. 2009).

29
CHAPTER 2: BIOCHEMICAL AND MOLECULAR CHARACTERIZATION OF
BARLEY PLASTIDIAL ADP-GLUCOSE TRANSPORTER (HVBT1)
2.1 Abstract
In cereals, ADP-glucose transporter protein plays an important role in starch
biosynthesis. It acts as a main gate for the transport of ADP-glucose, the main precursor
for starch biosynthesis during grain filling, from the cytosol into the amyloplasts of
endospermic cells. In this study, we have shed some light on the molecular and
biochemical characteristics of barley plastidial ADP-glucose transporter, HvBT1.
Phylogenetic analysis of several BT1 homologues revealed that BT1 homologues are
divided into two distinct groups. The HvBT1 is assigned to the group that represents BT
homologues from monocotyledonous species. Some members of this group mainly work
as nucleotide sugar transporters. Southern blot analysis showed the presence of a single
copy of HvBT1 in barley genome. Gene expression analysis indicated that HvBT1 is
mainly expressed in endospermic cells during grain filling; however, low level of its
expression was detected in the autotrophic tissues, suggesting the possible role of HvBT1
in autotrophic tissues. The cellular and subcellular localization of HvBT1 provided
additional evidence that HvBT1 targets the amyloplast membrane of the endospermic
cells. Biochemical characterization of HvBT1 using E. coli system revealed that HvBT1
is able to transport ADP-glucose into E. coli cells with an affinity of 614.5 µM and in
counter exchange of ADP with an affinity of 334.7 µM. The study also showed that AMP
is another possible exchange substrate. The effect of non-labeled ADP-glucose and ADP
on the uptake rate of [α-32
P] ADP-glucose indicated the substrate specificity of HvBT1
for ADP-glucose and ADP.
30
2.2. Introduction
Starch is the main storage compound in grains of cereal crop. Its biosynthesis is
catalyzed by a number of enzymes. ADP-glucose pyrophosphorylase (AGPase) converts
glucose-1- phosphate, using ATP, into ADP-glucose (ADP-Glc) that acts as the building
block of starch. This enzyme is located in the endospermic cells of cereal grains and it
has a total activity of about 85% to 95% in the cytosol of such cells (James et al. 2003).
The majority of ADP-Glc is synthesized in the cytosol and imported into the amyloplasts
by ADP-glucose transporter located on the membrane of the amyloplasts. In wheat, the
ADP-glucose transporter was characterized in vitro using reconstituted amyloplast
envelope proteins in the proteoliposomes. The results of this study showed that ADP-
glucose was transported in counter exchange of AMP and ADP (Bowsher et al. 2007). In
maize, the brittle1 (BT1) mutant is deficient in four amyloplast envelope proteins. One of
the defective proteins was ZmBT1 that encodes ADP-glucose transporter (Cao et al. 1995;
Cao et al. 1996). This mutant showed a low rate of ADP-Glc uptake into isolated
amyloplasts, as compared to the control ones (Shannon et al. 1996). Using the radioactive
(14
C) ADP-Glucose as a substrate, the ZmBT1 heterologously expressed in E. coli was
able to transport ADP-glucose with high affinity in counter exchange with ADP
(Kirchberger et al. 2007). Endospermic amyloplasts isolated from lys5 mutant of barley,
which is deficient in amyloplast envelope proteins showed reduced ADP-glucose uptake
(Patron et al. 2004). In non-graminaceous species, two BT1 homologues were identified
and characterized, AtBT1from Arabidopsis, and StBT1 from potato. Characterization of
StBT1 using an E. coli expression system showed high affinity to AMP, ADP and ATP
(Leroch et al. 2005).

31
The phylogenetic analysis of the BT1 protein revealed that maize ZmBT1 and barley
HvNST1 belong to the mitochondrial carrier family (MCF) (Patron et al. 2004; Picault et
al. 2004). In cereals, ADP-glucose transporter protein possesses six membrane spanning
domains. The C-terminus and N-terminus of these proteins are located inside the
amyloplasts (Patron et al. 2004). It was presumed that BT1 homologues are localized in
plastids’ membranes in autotrophic and heterotrophic tissues and are involved in
transporting nucleotides or nucleotide sugars. Recently, subcellular localization analysis
of maize and Arabidopsis plants expressing ZmBT1 and AtBT1 homologues, respectively,
showed dual localization of the two MCF members on the mitochondrial as well as the
plastidial membranes. Another finding is that the transit peptide in N-terminal targets
plastids, while the sequence targeting mitochondria is localized within internal domains
(Bahaji et al. 2011).
The present study characterized barley ADP-glucose transporter, HvBT1, using E. coli
expression system via monitoring the direct transport of ADP-Glc through the intact E.
coli cells’ plasma membrane. The expression of HvBT1 in different tissues and the
cellular and subcellular localizations of HvBT1 were investigated. In addition the study
examined the effect of expressed HvBT1 protein on E. coli cell growth and protein
expression.
2.3. Materials and methods
2.3.1. Plant Material

32
Barley (Hordeum vulgare L.) Harrington plants were grown a greenhouse condition
(under 8 h dark/16 h light photoperiod). Spikes were harvested after 2- 20 days after
anthesis (DAA) and frozen immediately in liquid nitrogen until used for RNA extraction.
2.3.2. Amplification and cloning of HvBT1
RNA was extracted using RNeasy Plant Mini Kit (Qiagen, Hilden, Germany). The
genomic DNA was digested in columns using RNase-Free DNase I Kit (Qiagen). The
purity and integrity of the RNA was determined using agarose gel electrophoresis and
NanoDrop spectrophotometer (Thermo Fisher Scientific, Waltham, MA, USA),
respectively. The cDNA was synthesized using Revert Aid First Strand cDNA
Synthesis Kits (Thermo Scientific). The open reading frame (ORF) of HvBT1 was
amplified using gene specific primers, which were designed based on the reported DNA
sequence (GenBank ID: AY560327.2). The amplified ORF was cloned in the pGEM-T-
Easy plasmid and introduced into E. coli DH5α (Invitrogen, Carlsbad, CA, USA).
Following plasmid isolation, the target sequence was verified by sequencing (Macrogen,
Rockville, MD, USA) and blast searched against the GenBank database. The resulting
ORF was amplified using specific primers flanked by restriction sites for Nde1 (5’-
CGTcatatgGCGGCGGCAAT-3’) and BamH1 (5’-TAggatccTCATGGTCGATCACCG-
3’) and cloned into the bacterial expression plasmid pET16b (Novagen, Darmstadt,
Germany) in Nde1 and BamH1 restriction sites and further verified by DNA sequencing.
2.3.3. Southern blot analysis
Genomic DNA was extracted using the CTAB method from 2 g frozen leaf tissue and
treated with RNase A to eliminate RNA contamination. The genomic DNA was digested

33
using XhoI, BamHI, SalI and KpnI (do not cut HvBT1 sequence). Then, the digested
products were separated on 0.8% agarose gel. Denaturation and neutralization were
performed according to the standard protocol (Sambrook et al. 1989). After transferring
the DNA into the nylon membrane (GE Healthcare, Little Chalfont, UK), DNA fragments
were fixed to the membrane using UV crosslinker (Stratagene, La Jolla, CA, USA). Gene
Images Alkphos Direct Labeling and Detection system (GE Healthcare) was used for
preparation of the probe (700 bp). Pre-hybridization, hybridization, and washing, and all
the procedures were performed according to the manufacturer’s instructions. The
chemiluminescent signal was generated and detected using CDP-Star reagent.
2.3.4. Quantitative Real-time RT- PCR
Quantitative Real-Time PCR was achieved using C1000 Thermal Cycler (Bio-Rad,
Hercules, CA, USA) and SSo Fast Eva Green Super mix (Bio-Rad) according to the
manufacturer’s instructions. Actin was used as a quantitative normalizer. The HvBT1
specific sense, (5’-TGTACGACAACCTCCTCCAC-3’); and antisense, (5’-
GCAGTGTCTCGTAGGCGTAG-3’) primers and β-Actin sense, (5’-
CCAAAAGCCAACAGAGAGAA-3’) and antisense, (5’-GCTGACACCATC
ACCAGAG-3’) were used for qRT-PCR. The results were analyzed using 2−ΔΔ
CT method
(Livak and Schmittgen 2001).
2.3.5. Cellular localization of HvBT1 transcripts
RNA in-situ Hybridization was used to investigate the cellular localization of HvBT1.
Barley caryopsis (8 DAA) were collected and immersed immediately in 4%

34
paraformaldehyde in PBS buffer (pH 7.4) on ice. The caryopsis was cut from both ends to
facilitate buffer penetration and exchange. Then the caryopsis was purged under vacuum
for 15 min. The rest of the procedures were performed according to Belmonte et al.
(2006). The probe was prepared using DIG-RNA labeling Kit (Roche). Briefly, the full
length cDNA was amplified and cloned into pGEM-T-Easy plasmid (Promega, Madison,
WI, USA). The ORF was amplified using M13 forward and reverse primers located in the
upstream and downstream of T7 and SP6 promoter regions, respectively. The PCR
products were used as templates for T7 and SP6 RNA polymerase reactions. Sense and
antisense probes were hydrolyzed using bicarbonate buffer (60 mM Na2Co3 and 40 mM
NaHCo3) to reach to 150 bp length. Pre-hybridization, hybridization, and color
development were done according to Canton et al. (1999) and Tahir et al. (2006),
respectively.
2.3.6. Subcellular localization of HvBT1 protein
Subcellular localization of HvBT1 was investigated using transient expression of
HvBT1 fused with YFP in Arabidopsis protoplast. Plant binary vector pEarleyGate 101
containing the yellow fluorescent protein (YFP) was prepared using Gateway LR clonase
reaction (Invitrogen, USA). The coding sequence of HvBT1 was cloned into pENTR-1A
entry plasmid at EcoRI and XhoI restriction sites. The HvBT1 specific primers were
designed to include the restriction sites of EcoRI and XhoI. The stop codon of HvBT1
ORF was removed by excluding it from the reverse primer of HvBT1 to generate
continuous ORF that includes both HvBT1 and YFP in the binary plasmid. Phusion DNA
polymerase was used to amplify the coding sequence of HvBT1 from pGEM-T-Easy

35
plasmid. The PCR product was digested using EcoRI and XhoI. The digested PCR
product was cloned in pENTR-1A plasmid using T4 DNA ligase (Fermentas, Thermo
Scientific, CA). LR clonase reaction was performed using pENTR-1A:HvBT1 and
pEarleyGate101 according to the manufacturer’s instruction. The insertion and the
orientation of HvBT1 in pEarleyGate101::HvBT1 were verified by PCR and sequencing
(Macrogen, USA). The transient expression was performed on Arabidopsis protoplasts by
introducing the pEarleyGate101::HvBT1 plasmid into protoplasts using PEG-mediated
transformation according to Yoo et al. (2007). The immunolocalization of HvBT1∷YFP
in the fixed Arabidopsis protoplasts was performed using anti-YFP Tag (Mouse
monoclonal) primary antibody (Applied Biological Materials Inc., Canada) with dilution
of 1:1000. Fluorescein conjugated anti-Mouse IgG (FITC) (Applied Biological Materials
Inc., Canada) was used as secondary antibody with dilution of 1:200. The
immunolocalization procedures were performed according to Lee and Hwang (2011).The
HvBT1-YFP expression was monitored using confocal laser scanning microscope (Zeiss,
Oberkochen, Germany) with excitation wavelengths of 488 nm with broad pass 505-530
nm, and 488 nm with long pass 650 nm for HvBT1∷YFP and chlorophyll, respectively.
FITC was detected with excitation of 495 nm and BP of 528 nm according to the
manufacturer’s instructions.
2.3.7. HvBT1 codon optimization
In E. coli, the rare codons (RCs) are defined as synonymous codons, which are
decoded by low abundant tRNA (rare tRNA). The RCs affect the translation rate of

36
eukaryotic proteins due to the unavailability of the rare tRNA [19]. One of the most
limiting steps during expression of eukaryotic genes in E. coli is the codon bias. The low
usage codons for particular amino acids disrupt the expression of most eukaryotic genes.
Gene synthesis methods are able to optimize the DNA sequences by substituting rare
codons with other ones that are common in E. coli’s translation machinery system. The
four problematic amino acids (Proline, Arginine, Leucine and Isoleucine) have more than
one codon, thus the challenges are to choose the right codons for these amino acids that
can be recognized by the E. coli translation machinery and provide the same amino acid
sequence up on translation. To this end, the codons of the nucleotide sequence of the
target gene were optimized to E. coli translation system. The newly synthesized sequence
was cloned into pET16b plasmid (Novagen), which has His- tag at the N- terminus to
produce fused protein that facilitates protein purification.
2.3.8. Escherichia coli strains and growth conditions
Two E. coli strains, Rosetta2 (DE3) plysS and C43 (DE3) (Lucigen, Middleton, WI,
USA) were used in this study to investigate the optimal conditions for protein expression
and the possible toxic effects of the ADP-glucose transporter protein (HvBT1). Bacterial
transformation was performed according to the strain specificity and the manufacturer
instructions. Bacterial cells harboring pET16b::HvBT1, the original (org) or the optimized
sequences (opc), and the control cells harboring the empty pET16b plasmid were grown
at 37°C overnight in 5 ml 2xYT medium supplied with 100 µg /ml carbenicillin. This
culture was used to inoculate fresh 2xYT culture medium which was then incubated at
37°C for 2 h to reach OD 600 = 0.6. The expression of HvBT1 was then induced by

37
adding IPTG (final concentration 0.5 mM) and incubation at 20°C overnight. The cells
were centrifuged at 5000 g and resuspended in the transport buffer (50 mM potassium
phosphate, pH 7.2) followed by incubation on ice.
2.3.9. Inhibitory effect of the expressed HvBT1
Escherichia coli cells of strains C43 and Rosetta2, harboring different copies of
HvBT1 (org or opc) were grown in 2xYT medium supplied with 100 µg/mL carbenicillin.
After the cell density reaches to OD600 ~0.6, the expression of HvBT1 was induced by
adding IPTG (final concentration of 0.5 mM) and incubation at 20°C. The growth rate of
cells was monitored over time using spectrophotometer. The same procedures were
repeated using 2xYT agar plates. A single colony was spread on agar plates supplied with
IPTG (0.5 mM final concentration) and without IPTG as a control, and then incubated at
30°C for 2 days.
2.3.10. Membrane protein extraction and SDS-PAGE
His-tagged HvBT1 protein was extracted and purified with HOOK His Protein Spin
purification kit (G-Biosciences, St. Louis, MO, USA) according to the manufacturer’s
instructions with minor modification. The cell pellets were placed in liquid nitrogen to
disrupt the cell wall and then re-suspended in PE LB–Lysozyme buffer provided with the
kit with complete protease inhibitor (Roche Applied Science). The cells were incubated at
37°C for 60 min and further disrupted by ultrasonication (250 W, 4 x 30 s, 4°C).
Unbroken cells and cell debris were collected using centrifugation at 4°C, first at 15,000
g for 20 min and then at 50,000 g for 90 min. The membrane protein fractions

38
(supernatant) were mixed with nickel chelating resin. The rest of the procedures were
performed according to the manufacturer’s instructions. After elution, His-tagged HvBT1
protein was desalted with Sephadex G50 and the purified membrane protein was
subjected to SDS-PAGE analysis according to Laemmli et al. (1970).
2.3.11. Transport assay using E. coli C43 (DE3) strain harboring pET16b::HvBT1
(opc)
The transport assay was performed using intact E. coli cells. IPTG-induced E. coli
cells harboring either HvBT1 recombinant plasmid or the empty one (control) were
resuspended in potassium phosphate buffer (pH 7.2). The transport assay was initiated by
adding [α-32
P] ADP-Glc or [α-32
P] ADP as transport substrates to the reaction mixture.
[α-32
P] ADP-Glc was enzymatically synthesized using a modified protocol of Ghosh and
Preiss (1966) and Rösti et al. (2006). The procedures of the assay were as follow: ADP-
glucose pyrophosphorylase (AGPase) was extracted from the leaf tissues of two weeks
old barley seedlings (0.5 g) with extraction buffer containing 50 mM HEPES (pH 7.4), 2
mM MgCl2, 1 mM EDTA and 1mM DTT. The mixture was centrifuged at 10,000 g for
15 min at 4°C. The supernatant was used directly in the assay. The direct ADP-glucose
synthesis was conducted in assay buffer (0.2 mL) containing 100 mM HEPES (pH 7.6),
15 mM MgCl2, 0.025 % (w/v) BSA, 0.5 units inorganic pyrophosphatase from baker’s
yeast (Invitrogen), 0.5 mM glucose 1- phosphate, 1.5 mM ATP, 15 mM 3-PGA and 4 µL
[α-32
P] ATP (3000 Ci [111TBq]/mmol) (Perkin Elmer). Supernatant containing AGPase
(20 µL) was added to the assay buffer and incubated at 37°C for 20 min and the reaction
stopped by boiling the mixture for 2 min at 95°C. The mixture was used without further
39
dilution for making working stock. [α-32
P] ADP was enzymatically synthesized from [α-
32P] ATP (3000 Ci [111 TBq]/moll) (PerkinElmer). In brief, 3-4 μL of [α-
32P] ATP was
added to 20 µL reaction mixture that contains 20 mL of 50 mM HEPES-KOH (pH 7.2), 5
mM MgCl2, 1 mM glucose, 1 unit of hexokinase, and 10 mM unlabeled ATP. The
mixture was incubated for 60 min at room temperature. Hexokinase was deactivated by
heating for 2 min at 95°C (Tjaden et al. 1998). The uptake experiment was carried out at
30°C. The uptake was terminated by quick transfer the cells to 0.45 μm filter under
vacuum. The filter was washed with 3-4 mL cold potassium phosphate buffer (pH 7.2) to
remove unimported radiolabelled substrate. The filter was transferred to scintillation
cocktail (5 mL) and the amount of 32
Puptakenwas quantified in a liquid scintillation
counter ((Beckman, Brea, CA, USA).
Efflux experiment of the putative [α-32
P] ADP-Glc substrate was conducted in intact
IPTG-induced E. coli cells harboring HvBT1 and empty plasmid as a control. The cells
were pre-incubated with 1µM [α-32
P] ADP-Glc in 50 mM potassium phosphate buffer
(pH 7.2) for 5 min at room temperature. The uptake buffer was diluted 1000 times using
ADP-Glc, ATP, ADP and AMP at a final concentration of 1 mM and incubated for
indicated time points. The uptake reaction was stopped by quick filtration in 0.45 µm
filters under vacuum. The filter was washed by adding 3-4 mL ice cold potassium
phosphate buffer and then placed in scintillation cocktail (5 mL). The radioactivity of 32
P
was monitored at the indicated time points as described above (Kirchberger et al. 2007).
The efflux of intracellular [α-32
P] ADP was conducted in induced E. coli cells
harboringHvBT1. The cells were incubated with 1µM [α-32
P] ADP for 5 min and the rest
of the procedures were performed as described above for [α-32
P] ADP-Glc. Non-labeled
40
ADP-Glc and ADP dilution (1000 times) were used to enhance the export of [α-32
P]
ADP.
2.3.12. Bioinformatics analysis
BT1 protein sequences (29 amino acid sequences) were collected using the BLASTp
program (Altschul et al. 1997) and were aligned with ClustalX program (Thompson et al.
1997). The phylogenetic tree was generated by MEGA 5.2 program (Tamura et al. 2011)
and the tree was annotated with Corel Draw (Corel Corporation Ltd., Ottawa, Canada)
2.4. Results
2.4.1. Bioinformatics analysis of HvBT1
The phylogenetic tree divided BT1 proteins into two main groups. The first group
represented monocotyledonous species including wheat, barley, maize and rice and the
second group represented both monocotyledonous and dicotyledonous species (Figure
2.1). The first group consists of subgroups for BT1 homologues that are classified mainly
based on their biochemical functions. The HvBT1 (GenBank ID: AAT12275) is
classified in a distinct subgroup (orange color) that includes BT1 homologues from T.
aestivum and T. urartu. Comparison of the amino acid sequence of HvBT1 with that of
other BT homologues showed high similarity with BT homologue from Triticum
aestivum (GenBank ID:ACX68637; 97% similarity or 92% identity), Triticum urartu
(GenBank ID: EMS62502; 99% similarity or 88% identity). Aegilopus tauschii
(GenBank ID: EMT17313; 99% similarity or 89% identity) and Aegilopus crassa

41
(GenBank ID: ACX68638; 97% similarity or 90% identity). The HvBT1 homologue also
showed similarity with homologues from Zea mays (GenBank ID: NP001105889; 92%
similarity or 66% identity) and, Zea mays (GenBank ID: ACF78275; with 92% similarity
or 71% identity). Other subgroups in the phylogenetic tree include BT1 homologues that
function as either nucleotide sugar transporter or adenine nucleotide transporter. The
second group consists of BT1 homologues from both monocotyledonous and
dicotyledonous species. This group is divided into two main distinct subgroups. One of
the subgroups includes BT1 from monocotyledonous species that mainly function as
either nucleotide sugar transporter or adenine nucleotide transporter. The second
subgroup includes BT1 homologues from only dicotyledonous species that mainly
function as nucleotide carrier proteins. The BT1 homologues from dicotyledonous
species showed low similarity to HvBT1.

42
2.4.2.
Figure 2.1. Phylogenetic analysis of BT1 proteins.
The BLASTp (Altschul et al. 1997) program was used to retrieve sequences that were
related to BT1. The amino acid sequences were aligned with the Clustal X program
(Thompson et al. 1997). Phylogenetic estimates were created by the Molecular
Evolutionary Genetic Analysis program package (MEGA 5.2) (Tamura et al. 2011). The
gaps were eliminated from the analysis in MEGA by using complete deletion setting. The
phylogenetic tree was generated with the Maximum Parsimony (PARS), Neighbour
joining (NJ; setting JTT model), and Maximum likelihood (ML) methods. MEGA 5.2
was also used for determining the best fit substitution model for ML analysis; thus for
ML analysis the JTT+G model was applied and for all programs the bootstrap option was
selected (1000 replicates) in order to obtain estimates for the confidence levels for the
major nodes present within the phylogenetic trees. The phylogenetic tree was annotated

43
with Corel DrawTM
(Corel Corporation Ltd., Ottawa, Canada). The phylogenetic tree
divided BT1 homologues into two main groups represent monocotyledonous and mono
and dicotyledonous species. HvBT1 was located in the first group within a distinct
subgroup (Orange color) with T. aestivum (GenBank ID: ACX 68637) which was
characterized as ADP-glucose transporter (Bowsher et al. 2007). Another subgroup (Red
color) assigned for monocot species including Z. mays (GenBank ID: ACF 78275) which
characterized as ADP-glucose transporter. The second group was dedicated for both
mono and dicotyledonous species. Dicotyledonous species were assigned in a distinct
subgroup (Brown color).They are mainly function as nucleotide transporter as S.
tuberosum (GenBank ID: ABA 81858) and A. thaliana (GenBank ID: XP 004960816)
were characterized as adenine nucleotide transporter (Leroch et al. 2005; Kirchberger et
al. 2008).
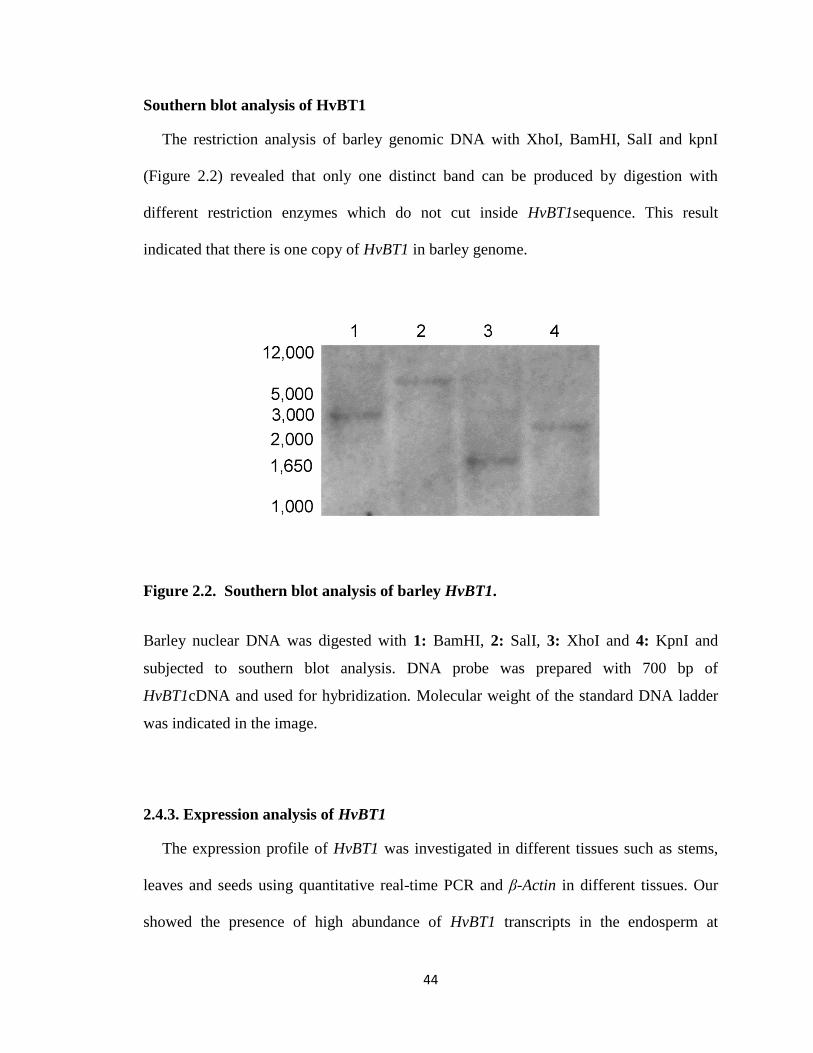
44
Southern blot analysis of HvBT1
The restriction analysis of barley genomic DNA with XhoI, BamHI, SalI and kpnI
(Figure 2.2) revealed that only one distinct band can be produced by digestion with
different restriction enzymes which do not cut inside HvBT1sequence. This result
indicated that there is one copy of HvBT1 in barley genome.
Figure 2.2. Southern blot analysis of barley HvBT1.
Barley nuclear DNA was digested with 1: BamHI, 2: SalI, 3: XhoI and 4: KpnI and
subjected to southern blot analysis. DNA probe was prepared with 700 bp of
HvBT1cDNA and used for hybridization. Molecular weight of the standard DNA ladder
was indicated in the image.
2.4.3. Expression analysis of HvBT1
The expression profile of HvBT1 was investigated in different tissues such as stems,
leaves and seeds using quantitative real-time PCR and β-Actin in different tissues. Our
showed the presence of high abundance of HvBT1 transcripts in the endosperm at

45
different stages of grain filling. The maximum transcript level was detected at 14 to 16
DAA. The transcripts of HvBT1 were also detected in the leaf and stem tissues but at
lower levels when compared to that found in the endosperm (Figure 2.3).
Figure 2.3. Real-time PCR analysis of HvBT1 in different barley tissues.
Quantitative real-time RT-PCR was used to determine the expression level of HvBT1 in
different tissues using gene specific primers. β-actin, a housekeeping gene from barley,
was used as an internal control. The relative expression level of HvBT1 transcripts was
normalized by β-actin expression level. Different head samples during grain filling (2-20
DAA) were assessed and samples from autotrophic tissues; stem and leaf also assessed
(small scale).
2.4.4. Cellular and subcellular localization of HvBT1
Cellular localization of HvBT1 transcripts was detected by RNA in-situ hybridization.
Our results indicated a strong signal of alkaline phosphatase (in case of the antisense

46
probe) reflecting high accumulation of HvBT1 transcripts in the starchy portion of
developing caryopsis (Figure 2.4). Subcellular localization of the HvBT1∷YFP fused
protein showed that HvBT1 protein is targeted to the chloroplast membranes (Figure
2.5A). This result was validated by immunolocalization of HvBT1∷YFP, where the
fluorescence of FITC was detected in the chloroplast envelopes (Figure 2.5B).
Figure 2.4. Cellular localization of HvBT1.
Cellular localization of HvBT1 was assayed using RNA- in situ hybridization. A: shows
hybridization with the sense probe which produces a very faint signal. B: shows antisense
probe hybridization which produces high signal of alkaline phosphatase. (es), embryo
sac; (al) aleurone and (em) embryo. The signal was detected strongly in embryo sac,
which accumulates the endosperm.

47
Figure 2. 5. Subcellular localization of HvBT1::YFP
Subcellular localization of HvBT1 was visualized by confocal laser scanning microscope.
A: transient expression of HvBT1::YFP in living protoplasts; chlorophyll autoflorescence
(red color), YFP fluorescence (yellow color) and merged image (orange color).B:
immunolocalization of HvBT1::YFP was detected using anti-YFP antibody and
visualized by the fluorescence of FITC-conjugated antibody. FITC fluorescence (blue
color), bright field and merged image which show the localization of HvBT1::YFP on the
chloroplast membranes.
2.4.5. Heterologous expression of HvBT1 in E. coli cells
SDS-PAGE analysis of the purified HvBT1 membrane protein showed that both E.
coli strains C43 and Rosetta2 harbouring the optimized ORF of HvBT1 are able to
express the HvBT1 protein with expected mass of ~ 45 KDa (Figure 2.6). Meanwhile,

48
Rosetta2 harbouring the original ORF was also capable of expressing HvBT1 at very low
level. The Rosetta 2 strain cells harbouring either org or opc ORFs of HvBT1 showed
growth inhibition, while the cell growth appeared to be normal in the case of C43 strain
(Figure S1). The use of optimized ORF of HvBT1 along with the C43 strain provided an
ideal expression system to sustain cell viability to perform the transport assay procedures.
Figure 2.6. SDS-PAGE analysis of HvBT1 protein.
Escherichia coli C43 and rosetta2 strains harboring the original (org) or the optimized
(opc) ORF of HvBT1 were grown in 2xYT liquid media supplied with IPTG (0.5 mM
final concentration). His-tagged HvBT1 membrane protein was purified and subjected to
12% SDS-PAGE. Lane 1 and 2 represent Rosetta 2 harboring opc and org ORF of
HvBT1, respectively. Lane 3 and 4 represent C43 harboring opc and org ORF of HvBT1,
respectively. Black arrows point to a band size of 45 KDa. Protein standard molecular
weight is shown.

49
2.4.6. [α-32
P] ADP-Glucose transport assay
The transport of [α-32
P] ADP-Glc was studied using intact E. coli cells harboring the
expression plasmid containing HvBT1 or the control plasmid (with no HvBT1). The
results showed that the import of the α-32
P labeled substrate follows a non-linear
regression trend for Michaelis-Menten kinetics (Figure 2.7A). The affinity of HvBT1 for
ADP- glucose was analyzed with different concentrations of [α-32
P] ADP-glucose using
the Wolfram Mathematica 8.0 software (Wolfram, Champaign, IL, USA). Increasing the
substrate concentration led to increased radiolabeled ADP-glucose uptake into the intact
E. coli cells expressing the HvBT1. The Km value of ADP-Glc was calculated to be 614.5
µM and the Vmax to be 254.1 nmol of ADP-Glc mg of protein-1
h-1
(Figure 7A). Uptake for
[α-32
P] ADP was also analyzed as described for [α-32
P] ADP-Glc. Likewise; an increase
in the import rate of [α-32
P] ADP was observed with increased concentrations of [α-32
P]
ADP. The Km and Vmax values for ADP are 334.7 µM and 74.07 nmol of ADP mg protein-
1 h
-1, respectively (Figure 2.7B).
Efflux of the intracellular [α-32
P] ADP-Glc and [α-32
P] ADP was monitored using the
intact IPTG-induced E. coli cells harboring HvBT1 as described in the materials and
methods. Rapid export of [α-32
P] ADP-Glc was enhanced by dilution of the assay
reaction with a high concentration of ADP or AMP, which caused a 75% or 60%
reduction from the initial amount, respectively. Meanwhile, dilution of [α-32
P] ADP-Glc
with a high concentration of non-labeled ADP-Glc or ATP led to 43% or 36% reduction
from the initial amount, respectively, within 8 min of incubation (Figure 8A). Increased
efflux of putative [α-32
P] ADP was also observed by dilution of the medium with high
concentration of non-labeled ADP-Glc at different incubation periods (Figure 8B). No
significant difference in efflux was found between dilution with ADP and the control.

50
Figure 2.7. Transport activity of HvBT1 in intact E. coli cells.
Escherichia coli C43 cells harboring the recombinant plasmid and the empty one
(Control) were incubated with different concentrations of [α-32
P] ADP-Glc. The cells
were incubated at 30°C for 10 min. The control values have been subtracted. The data is
the mean of three independent experiments ± SE with three replicates each. A: Km value
of ADP-Glc is 614.5±33.24 µM and Vmax of 254.14 ±19.45 nmol of ADP-Glc / mg of
protein-1
h-1
. B: Km and Vmax values of ADP is 334.7±39.3 µM and of 47.07 ±3.51 nmol of
ADP-Glc / mg of protein-1
h-1
, respectively.

51
To identify the possible counter-exchange substrates of HvBT1, intact E. coli cells
were preloaded with ATP, ADP or AMP at a concentration of 1 mM for 10 min at 30°C
followed by addition of [α-32
P] ADP-Glc (final concentration of 1 mM) and incubation
for 10 minutes. Our results indicated that preloading with ADP or AMP has a positive
impact on [α-32
P] ADP-Glc uptake, while preloading with ATP does not have significant
effect (Figure 2.8C).
To investigate if the [α-32
P] ADP-Glc transport activity of HvBT1 is inhibited or
activated by other metabolic intermediates, intact E. coli cells harboring HvBT1 were
incubated with 100 µM [α-32
P] ADP-Glc combined with the different metabolic
intermediates at a final concentration of 1 mM. Our results showed that the uptake rate of
[α-32
P] ADP-Glc was enhanced by ~ 88% or 70% when co-incubated with D-glucose or
glucose-1- phosphate, respectively (Table 1). Co-incubation with non-labeled ADP-Glc
reduced the uptake of [α-32
P] ADP-Glc by ~50% as compared to the control. Similarly,
the uptake of [α-32
P] ADP-Glc was negatively affected by co-incubation with the
nucleotide ADP, whereas the other nucleotides ATP and AMP did not have effect. The
reduction of [α-32
P] ADP-Glc uptake due to co-incubation of E. coli cells harboring
HvBT1 with ADP-Glc or ADP indicated the substrate specificity of HvBT1.

52
Figure 2.8. Exchange of intracellular radiolabeled substrates.
A: E. coli cells harboring HvBT1 and the given control were incubated with 1 µM [α-32
P]
ADP-Glc at 30°C in eppendorf tube for 5 min. The assay buffer was diluted with non-
labeled ATP, ADP, AMP, and ADP-Glc for indicated time points. The cells were filtered
and washed under vacuuming and measured for radioactivity. The data present here is the
mean of three independent experiments ±SE with three replicates. B: the procedures for
ADP efflux assay was performed as described for ADP-Glc in (A) with ADP and ADP-
Glc dilutions. C: E. coli C43 cells harboring HvBT1 and the given control were preloaded
with nucleotides at final concentration of 1 mM, and then the cells were incubated at
30°C for 5 min. The cells were centrifuged and re-suspended in potassium phosphate
buffer (50 mM, pH 7.2) with [α-32
P] ADP-Glc at concentration of 100 µM at 30°C for 8

53
min. The data present here is the mean of three independent experiments ±SE with three
replicates.
Table 2.1. Effects of different metabolites on [α-32
P] ADP-glucose transport
activities of HvBT1.
Effectors [α-
32P] ADP-Glc transport
nmol. mg protein-1
% % changes
Controla 12.99 ± 0.72
b 100 0
D-glucose 24.5 ± 0.76 188.54 + 88.54
Glucose 1-P 22.12 ± 0.91 170.17 +70.17
ADP-glucose 6.46 ± 0.35 49.67 - 50.33
ATP 11.98 ± 0.98 95.276 - 4.73
ADP 8.22 ± 0.85 63.18 - 36.82
AMP 11.16 ± 0.78 85.89 - 14.11
a Control = [α-
32P] ADP-glucose (100 µM)
b Data are means ± SE, n=3
Various metabolites at final concentration of 1 mM were tested for their activation or
inhibition of ADP-Glc transport. [α-32
P] ADP-Glc was present in the uptake buffer at
final concentration of 100 µM. Uptake assay was carried out with IPTG-induced E. coli
C43 cells harboring HvBT1 (opc) for 10 min and stopped by quick vacuuming. The data
present in this table is the mean of three independent experiments ± SE with three
replicates each.
54
2.5. Discussion
In cereal grains, starch is synthesized exclusively in the plastids. ADP-glucose, the
precursor of starch, is synthesized mainly in the cytosol of the endospermic cells by the
cytosolic AGPase form. The majority of AGPase activity in cereals is reported to be in
the cytosol (extra-plastidial) (Denyer et al. 1996; Tetlow et al. 2003). Different mutants
from cereals such as maize shrunken 2 (sh2) and brittle 2 (bt2) mutants (Giroux and
Hannah 1994), and barley mutant Risø 16 (Johnson et al. 2003), are characterized by the
lack of the activity of cytosolic AGPase, which in turn leads to the deposition of less
starch as compared to their control. Under normal conditions, the ADP-glucose
synthesized in the cytosol of the endospermic cells has to be transported into the
amyloplasts’ envelope membrane through a protein carrier. A study conducted on low
starch mutants of barley revealed that Risø13 mutant has low starch yield as compared to
the parental control. This is attributed to the decrease in the activity of ADP-glucose
transporter due to a point mutation in its cDNA sequence that led to the substitution of
GLU for VAL at position 273 in helx4 (Patron et al. 2004).
Amino acid sequence-based phylogenetic analysis revealed the clustering of BT1
proteins into two main groups. The first group contained only those isolated from
monocotyledonous species including the main cereal crops. HvBT1 (GenBank ID:
AAT12275) was assigned to this group, along with proteins from maize, rice, wheat and
other grasses. Some of the BT1 proteins in this cluster have been characterized. The
ZmBT1 (GenBank ID: ACF78275) is characterized biochemically to function as
plastidial ADP-glucose transporter (Kirchberger et al. 2007). ZmBT1 is also reported to
have dual function of targeting plastids and mitochondrial envelope membranes (Bahaji
et al. 2011), suggesting that it might have a role of transporting some other mitochondrial

55
energy molecules. The barley ADP-glucose transporter (HvNST1) is identified in a
mutant that accumulates less starch as compared to the wild type (Patron et al. 2004),
while wheat ADP-glucose transporter is identified by reconstituting amyloplasts envelope
membranes proteins in liposomes (Bowsher et a. 2007). As opposed to the first cluster,
BT1 proteins from both monocotyledonous and dicotyledonous species were assigned to
the second cluster. Most of these proteins have not been characterized yet but are
predicted to act as adenylate transporters. For example, the BT1 from potato (Solanum
tuberosum, StBT1) (GenBank ID: CAA67107) is identified as plastidial adenine
nucleotide uniporter (Leroch et al. 2005), and the Arabidopsis thaliana (AtBT1)
(GenBank ID: NP194966) as a plastidial nucleotide uniporter (Kirchberger et al. 2008).
The alignment of the deduced amino acid sequence of BT proteins indicates that the BT1
homologues belong to the mitochondrial carrier family (MCF) that possesses membrane
spanning domains (Leroch et al. 2005) and conserved motifs designated as mitochondrial
energy transfer signature (METS) (Millar and Heazlewood 2003). A signal peptide of 53
amino acids is located at N-terminal of HvBT1 protein was detected.
Southern blot analysis indicated the presence of only one copy of BT1 in the barley
genome (Figure 2.2). However, two copies of BT1 are detected in maize; ZmBT1 and
ZmBT1-2. The ZmBT1 is found to be expressed exclusively in the endosperm, while
ZmBT1-2 in both autotrophic and heterotrophic tissues. The ZmBT1-2 might work as an
adenine nucleotide transporter that supplies the cells with adenine nucleotides that
synthesized in the plastids (Kirchberger et al. 2007). QPCR and RNA in situ
hybridization-based gene expression analysis indicated that the HvBT1 is exclusively
expressed in the endosperm during grain filling (Figure 2.3 and 2.4). Detecting the
56
expression of HvBT1at low level in autotrophic leaf and stem tissues might suggest its
dual function in the chloroplasts and mitochondrial envelope membranes like that of
maize plastidial ADP-glucose transporter (ZmBT1) (Bahaji et al. 2011). However,
localization of HvBT1 to the plastid membrane suggested that it acts as an ADP-glucose
transporter across the plastid membrane (Figure 2.5A and B).
This study, using an E. coli expression system, characterized the HvBT1 as ADP-
glucose transporter. The first most important step of this study was to identify the proper
E. coli strain to avoid the possible toxic effect of the expressed membrane protein.
Heterologous expression of HvBT1 in two E. coli strains showed the inhibitory effect of
HvBT1on the cell growth of Rosetta2 strain harboring either original (org) or optimized
(opc) ORFs of HvBT1 (Appendex 1). However, cells of E. coli C43 strain, a mutant of
BL21, harboring HvBT1 were able to grow on both liquid and solid media after induction
with IPTG, showing that the suitability of this strain of E. coli as a system in studying
such membrane localized transporter proteins. At the protein level, Rosetta 2 harboring
either org or opc ORFs was able to express the HvBT1 protein at low level as well as C43
cells harboring the original ORF, while C43 cells harboring the optimized ORF was able
to produce HvBT1 at high level (Figure 2.6). Heterologous expression and purification of
membrane proteins is the bottleneck of understanding their functional and structural
prosperities (Bernaudat et al. 2011). Some eukaryotic membrane proteins are toxic to E.
coli cells. Under normal conditions, membrane biogenesis in newly dividing E. coli cells
is a multistep process in which the cells can produce adequate amounts of proteins,
especially membrane proteins, to meet the cellular demand, mainly by controlling the
translation machinery (Valent et al. 1997; Nagamori et al. 2004). However, when foreign
57
proteins transformed into the E. coli cells are expressed at higher rate, the cells are unable
to accommodate the large amounts of expressed proteins, thereby affecting natural
rhythm of the translation machinery (Narayanan et al. 2001). Another problem
associated with the expression of membrane proteins in the E. coli system is mis-folding
of the expressed proteins and storage of the aggregates in form of inclusion bodies
(Bernaudat et al. 2011), which increases toxicity and arrests the cell growth (Akiyama
2009; Wagner et al. 2007). These factors might explain the growth arrest of the Rosetta 2
cells expressing both the original and optimized ORFs in both liquid and solid media.
The lacUV5 promoter in C41 and C43 strains has three mutations, two in the -10 region
of the promoter and one in the lac operator. These mutations make the lacUV5 promoter
weak as compared to the wild type found in the original strain BL21 (Wagner et al.
2008), leading to low expression of the membrane protein that can help the cells
expressing it to proliferate normally. Our data shows that slow expression of HvBT1 in
the C43 strain allows the cells to produce soluble and functional proteins and keeps the
cells active.
ADP-glucose transporter of barley, HvBT1, transports ADP-Glc in counter-exchange
with ADP with apparent affinities of 614 µM and 334 µM, respectively (Figure 2.7A and
B). Similar results have been reported in maize where ZmBT1was able to transport ADP-
Glc in counter-exchange with ADP with apparent affinities of 850 µM and 465 µM,
respectively (Kirchberger et al. 2007). Wheat endosperm amyloplast ADP-glucose
transporter was also analyzed by reconstituting amyloplasts envelope membrane proteins
in a proteolosome. Its apparent affinities for ADP-Glc and both ADP and AMP were
found to be 430 µM and 200 µM, respectively (Bowsher et al. 2007).
58
Enhancing the efflux of [α-32p] ADP-Glc by dilution of the medium with high
concentration of ADP and AMP revealed the potentials of these nucleotides as counter
exchange substrates (Figure 2.8A). This result was supported by the efflux of the putative
[α-32
P] ADP by dilution with high concentration of nonlabeled ADP-Glc (Figure 2.8B).
In agreement with this, efflux study with intact amyloplasts of wheat showed that ADP-
glucose transporter protein transports ADP-Glc into the amyloplasts in counter exchange
with ADP and AMP (Bowsher et al. 2007). In addition, preloading induced E. coli cells
harboring HvBT1 with ADP and AMP resulted in increased ADP-Glc uptake as
compared to the control (Figure 8C). Similar results have been reported in maize using
ZmBT1 (Kirchberger et al. 2007).
Testing several effectors on the [α-32
P] ADP-Glc uptake in the intact E. coli cells
expressing HvBT1 protein showed that the transport rate of [α-32
P] ADP-Glc increased
when co-incubated with glucose or glucose 1-phosphate (Table 2.1). Interestingly, co-
incubation with glucose also increased the uptake rate of [α-32
P] ADP-Glc by almost
double of the control. Glucose as a sole carbon source plays an important role in the
activation of E. coli metabolism (Brown et al. 2008), which subsequently increases the
ability of the cells to uptake [α-32
P] ADP-Glc. Glucose 1-phosphate also had a positive
effect on the uptake of [α-32
P] ADP-Glc (Table 1). Meanwhile, co-incubation with
unlabeled ADP-Glc reduced the uptake of [α-32
P] ADP-Glc by ~ 50% as compared to the
control due to its competition as a substrate with the labeled ADP-Glc. Reduction in the
uptake of [α-32
P] ADP-Glc was also observed by co-incubation with ADP, indicating the
substrate specificity of HvBT1 for ADP-Glc and ADP.

59
In summary, the findings of this study show that HvBT1 is able to transport ADP-
glucose with high affinity in counter-exchange with ADP and probably with AMP. Its
localization to the plastids envelopes and exclusive expression in the endospermic cells of
the barley grains indicates its potential significance in determining starch yield in barley.

60
CHAPTER 3. THE IMPACT OF PLASTIDIAL ADP-GLUCOSE TRANSPORTER
(HvBT1) EXPRESSION ON STARCH SYNTHESIS IN BARLEY
3.1. Abstract
In the endosperm of cereal grains, ADP-glucose transporter is the main gate for
transportation of ADP-glucose from the cytosol into the amyloplasts. We investigated the
importance of the barley plastidial ADP-glucose transporter, HvBT1, for starch synthesis
using gene expression analysis of HvBT1 and other starch synthesis-related genes. The
expression of HvBT1 in Harrington was almost 10 times higher than Golden Promise. In
the grain composition, starch content was 2.5 % higher in Harrington than Golden
Promise while Harrington starch had higher amylopectin amylose ratio than Golden
Promise. In Harrington, AGPL1 and AGPL2 were expressed at late and early stages of
grain filling, respectively. The expression of the large and small subunits of AGPase was
significantly higher in Harrington as compared to Golden Promise. Similarly, AGPase
activity in Harrington was significantly higher than its activity in Golden Promise. The
expression patterns of Granule-Bound Starch Synthases1a and 1b (GBSS1a & 1b)
followed the same trend, and showed higher expression in Harrington. Oppositely,
soluble Starch Synthases (SS) showed significantly higher expression in Golden Promise
than Harrington, except SS3b which showed higher expression in Harrington. Also,
Starch Branching Enzyme1 (SBE1) showed significantly higher expression in Golden
Promise. Protein, β-glucan and lipids were significantly higher in Golden Promise which
accumulated less starch. This result is in line with the negative correlation between starch
content and other grain components. We speculate that starch content in Harrington was
higher as a result of a higher expression of HvBT1.
61
3.2. Introduction
Starch is the main storage polymer in higher plants and has a great impact as a
renewable source for human nutrition and a renewable source of industrial end-uses
especially biofuel production (Smith, 2008). Starch contains two polymers, amylose and
amylopectin, which is synthesised in both photosynthetic and non-photosynthetic organs
(Zeeman et al. 2010). Barley grain contains ~50 – 60% starch which is composed of ~
25% and 75% amylose and amylopectin, respectively (Li et al. 2011). In heterotrophic
cells of dicotyledonous species, glucose 6-phosphate is synthesized in the cytosol from
sucrose and imported into amyloplasts via glucose 6-phosphate / Pi translocator
(Kammerer et al. 1998). Then, glucose 6-phosphate is converted to glucose 1-phosphate
by plastidial phosphoglucomutase (PGM). ADP-glucose, the glucosyl donor for starch
synthesis, is made through the reaction driven by plastidial ADP-glucose
pyrophosphorylase (AGPase) which catalyzes the conversion of glucose 1-phosphate
using ATP into ADP-glucose and release inorganic phosphate (PPi) (Gross and apRees,
1986). Starch synthesis in cereal endosperm is a complex process as compared to other
species. The starch biosynthesis pathway is divided into two main streams; the first is
cytosolic and responsible for ADP-glucose synthesis, and the second one is plastidial and
directly involved in the starch synthesis process. The major activity of ADP-glucose
pyrophosphorylase (AGPase) was reported as cytosolic, which represents 85-95 % of the
total activity (James et al. 2003). Subsequently, the majority of ADP-glucose (80-90%) is
made in the cytosol of the endospermic cells (Tiessen et al. 2012) and must be imported
into amyloplasts where the starch is made. ADP-glucose is transported into amyloplasts
in counter-exchange with ADP via an ADP-glucose transporter (Bowsher et al. 2007;
62
Kirchberger et al. 2007). Mutation in ADP-glucose transporter impairs starch
accumulation in barley mutant RisØ 13 (Patron et al. 2004).
In the plastids, many enzymes are involved in amylose and amylopectin synthesis;
granule-bound starch synthases, soluble starch synthases, starch branching and de-
branching enzymes. Amylose is synthesized by granule-bound starch synthase (GBSS) in
the plastids. The effect of GBSS on amylose synthesis was demonstrated by generating
amylose free starch as a result of lacking GBSS activity (Denyer et al. 2001). GBSS is
able to form long glucan chains and elongates the side chains forming long chains of
amylopectin molecules (Denyer et al. 1999; Fulton et al. 2002; Hanashiro et al. 2008).
Amylopectin is a branched molecule which is synthesized by the function of soluble
starch synthases by transferring the glucosyl moiety to the existing glucan chains
(Zeeman et al. 2010). Different types of starch synthases are involved in amylopectin
synthesis. Analysis of different mutants and transgenic plants lacking the activity of one
of those enzymes showed negative effect on the amylopectin synthesis and altered the
amylose/amylopectin ratio in cereal grains. The high-amylose starch in durum wheat was
generated by a mutation in starch synthase 2a (SS2a) (Hogg et al. 2013). Also, the barley
mutant sex6 lacking the activity of starch synthase 2a (SS2a) produced high-amylose
starch (Morell et al. 2003). In rice, the null mutant of SS3a created white-core floury
endosperm, characterized by reducing the length of long chain of amylopectin and
increased amylose content (Ryoo et al. 2007).
The unique function of ADP-glucose transporter, HvBT1, makes them good
candidates as limiting factors in the starch synthesis process. In the present study, we
investigated the effect of the expression of the plastidial ADP-glucose transporter HvBT1
63
on the starch synthesis process in two malting barley cultivars. Grain composition
analysis and expression of starch-related genes were investigated to determine the unique
combination the key factors that involved in this process.
3.3. Materials and methods
3.3.1. Plant materials
Two barley (Hordeum vulgare L.) cultivars; Golden Promise and Harrington were
used in the present study. Barley plants were grown under greenhouse conditions (16/8
hrs day/ night photoperiod). Spike samples were collected at 2, 4, 6, 8, 10, 12, 14, 16 and
20 days after anthesis (DAA) during grain filling. The tissues were collected and
immediately placed in liquid nitrogen. In ceramic mortars, the tissues were ground to fine
powder, and stored at – 80°C.
3.3.2. RNA extraction and cDNA synthesis
Total RNA was extracted from collected tissues using RNaesy Plant Mini Prep Kit
(Qaigen, Germany). The extraction procedures were performed on 100 mg ground tissues
as described in the instructions manual. Genomic DNA contamination was eliminated by
in-column DNase digestion using RNase-Free DNase Set (Qiagen, Germany). The RNA
integrity was visualized on agarose gel and the concentration measured by a Nanodrop
spectrophotometer (Thermo Fisher, USA). The first strand DNA was synthesized from 5
µg total RNA by Revert Aid™ First Strand cDNA Synthesis Kits (Fermentas) using
oligo (dT)18 primers. Primers were designed by TaqMan (Genescript, USA). The primers
were designed with particular criteria as follow; Tm, 59±1°C, primer length 20±1 and
amplicon size 80-150 bp with GC content ranging between 45% and 55%.
64
3.3.2. Quantitative Real-Time RT-PCR analysis
Quantitative Real-Time PCR (qRT-PCR) was conducted on a CFX96 Thermal Cycler
(Bio-Rad) with SsoFast EvaGreen Supermix (Bio-Rad) according to the manufacturer’s
instructions. Actin was used as an internal control to normalize qRT-PCR. The qRT-PCR
was assayed on 4 ng cDNA /µL final volume. The selected genes accession numbers and
primer sequences are shown in Table1. The qRT-PCR results were analyzed using 2-ΔΔ
Ct
method (Livak and Schmittgen, 2001).
3.3.3. ADP-glucose pyrophosphorylase (AGPase) activity
ADP-Glc was enzymatically synthesized using a modified protocol of Ghosh and
Preiss (1966) and Rösti et al. (2006) as follows: ADP-glucose pyrophosphorylase
(AGPase) was extracted from barley caryopsis 10 DAA (0.5 g) with an extraction buffer
containing 50 mM HEPES (pH 7.4), 2 mM MgCl2, 1 mM EDTA and 1mM DTT. The
mixture was centrifuged at 10,000 g for 15 min at 4°C. Total protein in the extraction
buffer was measured by the Bradford standard protocol and used directly in the assay.
The direct ADP-glucose synthesis was conducted in assay buffer (0.2 mL) containing 100
mM HEPES (pH 7.6), 15 mM MgCl2, 0.025 % (w/v) BSA, 0.5 units inorganic
pyrophosphatase from baker’s yeast (Invitrogen), 0.5 mM glucose 1- phosphate, 1.5 mM
ATP, 15 mM 3-PGA. The supernatant containing AGPase (20 µL) was added to the assay
buffer and incubated at 37°C for 20 min followed by boiling the mixture for 2 min at
95°C to stop the reaction, and then the mixture was centrifuged at 10,000 rpm for 5 min
and filtered.
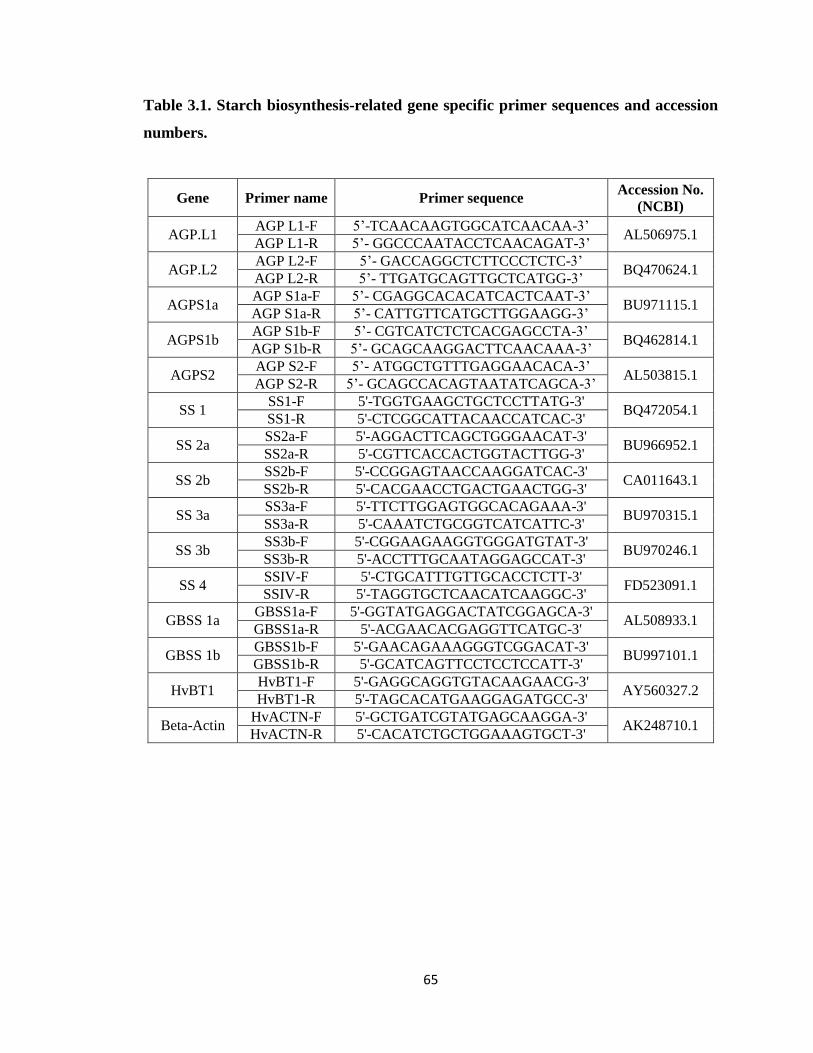
65
Table 3.1. Starch biosynthesis-related gene specific primer sequences and accession
numbers.
Gene Primer name Primer sequence Accession No.
(NCBI)
AGP.L1 AGP L1-F 5’-TCAACAAGTGGCATCAACAA-3’
AL506975.1 AGP L1-R 5’- GGCCCAATACCTCAACAGAT-3’
AGP.L2 AGP L2-F 5’- GACCAGGCTCTTCCCTCTC-3’
BQ470624.1 AGP L2-R 5’- TTGATGCAGTTGCTCATGG-3’
AGPS1a AGP S1a-F 5’- CGAGGCACACATCACTCAAT-3’
BU971115.1 AGP S1a-R 5’- CATTGTTCATGCTTGGAAGG-3’
AGPS1b AGP S1b-F 5’- CGTCATCTCTCACGAGCCTA-3’
BQ462814.1 AGP S1b-R 5’- GCAGCAAGGACTTCAACAAA-3’
AGPS2 AGP S2-F 5’- ATGGCTGTTTGAGGAACACA-3’
AL503815.1 AGP S2-R 5’- GCAGCCACAGTAATATCAGCA-3’
SS 1 SS1-F 5'-TGGTGAAGCTGCTCCTTATG-3'
BQ472054.1 SS1-R 5'-CTCGGCATTACAACCATCAC-3'
SS 2a SS2a-F 5'-AGGACTTCAGCTGGGAACAT-3'
BU966952.1 SS2a-R 5'-CGTTCACCACTGGTACTTGG-3'
SS 2b SS2b-F 5'-CCGGAGTAACCAAGGATCAC-3'
CA011643.1 SS2b-R 5'-CACGAACCTGACTGAACTGG-3'
SS 3a SS3a-F 5'-TTCTTGGAGTGGCACAGAAA-3'
BU970315.1 SS3a-R 5'-CAAATCTGCGGTCATCATTC-3'
SS 3b SS3b-F 5'-CGGAAGAAGGTGGGATGTAT-3'
BU970246.1 SS3b-R 5'-ACCTTTGCAATAGGAGCCAT-3'
SS 4 SSIV-F 5'-CTGCATTTGTTGCACCTCTT-3'
FD523091.1 SSIV-R 5'-TAGGTGCTCAACATCAAGGC-3'
GBSS 1a GBSS1a-F 5'-GGTATGAGGACTATCGGAGCA-3'
AL508933.1 GBSS1a-R 5'-ACGAACACGAGGTTCATGC-3'
GBSS 1b GBSS1b-F 5'-GAACAGAAAGGGTCGGACAT-3'
BU997101.1 GBSS1b-R 5'-GCATCAGTTCCTCCTCCATT-3'
HvBT1 HvBT1-F 5'-GAGGCAGGTGTACAAGAACG-3'
AY560327.2 HvBT1-R 5'-TAGCACATGAAGGAGATGCC-3'
Beta-Actin HvACTN-F 5'-GCTGATCGTATGAGCAAGGA-3'
AK248710.1 HvACTN-R 5'-CACATCTGCTGGAAAGTGCT-3'

66
ADP-glucose was quantified using High Performance Liquid Chromatography
(HPLC) (Waters 2695 Separations Module). The reaction was performed without a
protein extract as a blank, while the boiled extract was used in the reaction buffer as a
negative control. Ten microliters of the assay mixture was injected in an HPLC equipped
with Waters 996 Photodiode Assay Detector and LichroCART 250 x 4 Lichrospher 100
RP-18 (5µm) column (Merck KGaA, Germany). The samples were eluted by gradients
of acetonitrile in water as follows: time (min)/flow rate (mL/min)/acetonitrile (%):
0.01/1/0, 0.8/1/5, 1.6/1/20, 2.12/1/75, 4/1/100, 4.8/1/100, 6/1/0, 15/0.2/0.
3.3.4. Grain yield and physical parameters
A hundred grains were counted using a seed counter, and then grain weight was
recorded for three replicates from three individual samples from each cultivar. A single
grain weight was measured on the counted seeds ± SE. Grain length, width and area were
examined by scanning 25 grains in 5 replicates from each cultivar with Assess 2.0
(Lamari, 2008). Cross-sectioned and intact barley grains were examined by stereoscopic
microscopy for external appearance and plumpness.
3.3.5. Grain composition
3.3.5.1. Starch, Amylose and B-glucan contents
Barley whole grains were ground to a fine powder and used for extraction of total
starch, amylose and β-glucan. The extraction was performed with AOAC Method
996.11/AACC Method 76.13, K-AMYL 07/11, K-BGLU kits (Megazyme International
Ltd., Wicklow, Ireland) for starch, amylose and B-glucan, respectively. The extraction

67
procedures were achieved according to the manufacturer’s procedures. The assay was
performed on three biological replicates with two technical replicates from each.
3.3.5.2. Protein content
The total protein content was determined in the barley cultivars mature grains as total
nitrogen content using a combustion nitrogen analyzer (Leco FP – 528, Nitrogen/Protein
Determinator Corporation, St. Joseph, Mich). The protein values were calculated by
multiplying the obtained nitrogen value by a factor of 6.25. The assay was performed on
three biological replicates with three technical replicates from each.
3.3.5.3. Lipids content
Lipids were extracted and quantified from barley whole meal (1gm) of the barley
cultivars using a gravimetric method after extraction with a chloroform-methanol
mixture. The procedures were performed according to Phillips et al. (1997). Thin layer
chromatography (TLC) was performed by applying 10 µL of total lipid extracts on silica
gel (AL SIL G, plate size 20x20 cm with 0.25 mm thickness, Whatman) according to
Mangold and Malins (1960) and Mangold (1961) and separated by petroleum ether
:diethyl ether : glacial acidic acid (80:20:1, v:v:v) according to Kates (1972). Lipid
fractions were visualized using iodine vapor. The lipid fractions were identified by
comparing RF values to published RF values of lipid standards.

68
3.2.5.4. Water-soluble carbohydrate content
Water-soluble carbohydrates were extracted according to Yemm and Willis (1954)
with modifications described in Clarke et al. (2008). In brief, 100 mg of barley whole
meal was extracted in 10 mL 80% ethanol by boiling in a water bath for 10 min. The
extraction was performed three times and the supernatant pooled and freeze-dried. The
carbohydrates were re-suspended in 1 mL milliQ water and carbohydrate sugars were
quantified using High Performance Anion Exchange Chromatography (HPAEC)
according to Ruuska et al. (2006)
3.3.6. Statistical analysis
Student T-test (P < 0.05) was used to analyze the significant differences of single
traits between the barley cultivars. The analysis of variance (ANOVA analysis) was
performed with Proc GLM SAS 9.2 to assess the interaction of different factors in the
traits and cultivars.
3.4. Results
3.4.1. Plastidial ADP-glucose transporter (HvBT1)
The expression analysis of HvBT1 followed the same trend in both cultivars over time
(Figure 3.1). HvBT1 expression started at very low levels from 2-8 DAA, increased
drastically during the period 10-16 DAA, and decreased again at 20 DAA. The
expression level of HvBT1 in Harrington was significantly higher (10 folds) than in
Golden Promise at all tested time points. The expression of HvBT1 reached a peak in both

69
cultivars between 14-16 DAA, and then decreased after 20 DAA in Golden Promise,
while it was sustained in Harrington.
Figure 3.1. Expression analysis of the plastidial ADP-glucose transporter (HvBT1).
The expression of HvBT1 in Harrington (H) is shown by brown bars, while Golden
Promise (GP) by black bars. The letters show the significance of the expression of
HvBT1 among time points and cultivars. The bars which have the same letter are not
significantly different, while the bars with different letters are significantly different at P
< 0.05.
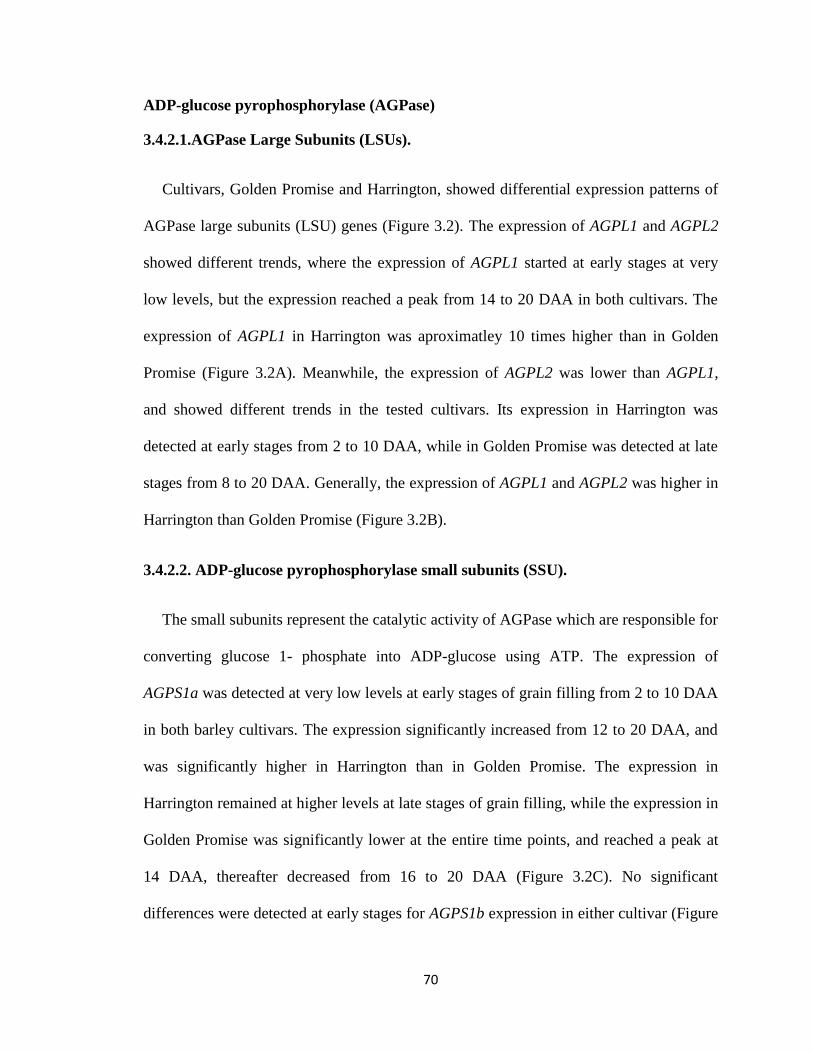
70
ADP-glucose pyrophosphorylase (AGPase)
3.4.2.1.AGPase Large Subunits (LSUs).
Cultivars, Golden Promise and Harrington, showed differential expression patterns of
AGPase large subunits (LSU) genes (Figure 3.2). The expression of AGPL1 and AGPL2
showed different trends, where the expression of AGPL1 started at early stages at very
low levels, but the expression reached a peak from 14 to 20 DAA in both cultivars. The
expression of AGPL1 in Harrington was aproximatley 10 times higher than in Golden
Promise (Figure 3.2A). Meanwhile, the expression of AGPL2 was lower than AGPL1,
and showed different trends in the tested cultivars. Its expression in Harrington was
detected at early stages from 2 to 10 DAA, while in Golden Promise was detected at late
stages from 8 to 20 DAA. Generally, the expression of AGPL1 and AGPL2 was higher in
Harrington than Golden Promise (Figure 3.2B).
3.4.2.2. ADP-glucose pyrophosphorylase small subunits (SSU).
The small subunits represent the catalytic activity of AGPase which are responsible for
converting glucose 1- phosphate into ADP-glucose using ATP. The expression of
AGPS1a was detected at very low levels at early stages of grain filling from 2 to 10 DAA
in both barley cultivars. The expression significantly increased from 12 to 20 DAA, and
was significantly higher in Harrington than in Golden Promise. The expression in
Harrington remained at higher levels at late stages of grain filling, while the expression in
Golden Promise was significantly lower at the entire time points, and reached a peak at
14 DAA, thereafter decreased from 16 to 20 DAA (Figure 3.2C). No significant
differences were detected at early stages for AGPS1b expression in either cultivar (Figure

71
3.2D). In Harrington, the expression of AGPS1b at 12 to 20 DAA was significantly
higher by aproximatley double of Golden Promise. AGPS1b showed higher expression
level in Golden Promise at 12 DAA as compared to Harrington. Generally, the expression
of S1b was significantly higher in Harrington than in Golden Promise. The expression of
AGPS2 was detected at very low levels at early stages of grain filling until 10 DAA, and
followed the same trend in both cultivars. At 12 DAA, it increased dramatically and
continued over the tested times in both cultivars. A significantly higher expression
occurred in Harrington at 14-16 DAA as compared to Golden Promise. Interestingly, the
expression of AGPS2 remained almost stable at late stages of grain filling in Golden
Promise (Figure 3.2E).
3.4.2.3.Granule-bound starch synthase (GBSS)
Granule-bound starch synthases (GBSS) are responsible for amylose biosynthesis.
Also they are involved in synthesis of long chains in amylopectin molecules. In this
research, we investigated the expression of GBSS-encoded genes (GBSS1a and 1b) in
barley cultivars. The expression of GBSS1a was not detected at early stages of grain
filling from 2 to 6 DAA in either cultivar, and then increased drastically from 12 to 20
DAA in both cultivars. The expression of GBSS1a was significantly higher in Harrington
as compared to Golden Promise from 14 to 20 DAA. In contrast, GBSS1b expression was
higher at early stages from 2 to 10 DAA in both cultivars, with significantly more in
Harrington, and a maximum expression at 8 and 10 DAA. Generally, the expression of
both GBSS1a and GBSS1b was significantly higher in Harrington as compared to Golden
Promise (Figure 3.3).

72
Figure 3.2. Expression of AGPase-encoding genes (AGP.)
The expression AGPase in cv. Harrington (H) is shown by brown bars, while cv. Golden
Promise (GP) by black bars. The expression of the large subunits; (A) AGPL1 and (B)
AGPL2. AGPase small subunit genes (AGPS); (C) AGPS1a, (D) AGPS1b and (E)
AGPS2. The bars which have the same letter are not significantly different, while the bars
with different letters are significantly different at P < 0.05.

73
Figure 3.3. Expression of granule-bound starch synthase-encoding genes (GBSS).
The expression of GBSSs in cv. Harrington (H) is shown by brown bars, while cv. Golden
Promise (GP) by black bars. The expression of GBSS1a is shown in (A), while the
expression of GBSS1b is shown in (B) .The bars which have the same letter are not
significantly different, while the bars with different letters are significantly different at P
< 0.05.
74
3.4.2.4.Soluble-starch synthase (SS)
The expression of starch synthase1 (SS1) was detected at all stages during grain filling
in both cultivars. It started at low levels from 2 to 10 DAA, and then increased
considerably over time (Figure 3.4A). The maximum expression was recorded at 16 DAA
in Golden Promise, and at 14 and 16 DAA in Harrington, and then decreased in both
cultivars. At 8 to 12 DAA, the expression of SS1 was significantly higher in Golden
Promise as compared to Harrington. The expression of starch synthase 2a (SS2a) was
detected at early stages during grain filling in both cultivars, but was at very low levels in
both cultivars at 2 to 6 DAA (Figure 3.4B). The expression was drastically increased
from 10 to 16 DAA and decreased thereafter at 20 DAA. The expression was
significantly higher in Golden Promise starting at 8 DAA and reached a peak at 12 to 16
DAA, then decreased at 20 DAA. In Harrington, it was at very low levels until 10 DAA
and then increased over time to reach a peak at 14 DAA, then decreased gradually.
Generally, the expression of SS2a was significantly higher in Golden Promise than
Harrington between 8 to 20 DAA, while the expression of SS2b was stable over time
from early to late stages in both cultivars. There was little difference in the expression
patterns of SS2b between the two cultivars. In Harrington, the expression of SS2b was
higher at early stages of grain filling from 2 to 6 DAA and reached a peak at 6 DAA
(Figure 3.4C). In Golden Promise, the expression of SS2a was higher at late stages of
grain filling as compared to Harrington.
The expression of Starch synthase 3a (SS3a) was detected at very low levels during
early stages up to 8 DAA in both cultivars (Figure 3.4D). The expression drastically
increased in Golden Promise from 10-16 DAA, while in Harrington, the expression of

75
SS3a increased at a later stage (12 DAA) and continued until 20 DAA. Generally, the
expression of SS3a was significantly higher in Golden Promise as compared to
Harrington, except at 20 DAA. The expression analysis of SS3b indicated continuous
expression through the tested time points (Figure 3.4E). In Harrington, the expression of
SS3b was significantly higher in all time points as compared to Golden Promise. The
expression of SS3b reached a maximum level between 14-16, and at 16 DAA for
Harrington and Golden Promise, respectively. Starch synthase 4 gene (SS4) showed
stable expression over time in both cultivars (Figure 3.4F). The expression of SS4 started
at very early stages of grain filling from 2 DAA and extended until 20 DAA. In Golden
Promise, the expression of SS4 was significantly higher at 8-12 DAA as compared to
Harrington, where it reached a peak at 12 DAA.
3.4.2.5. Starch branching enzyme 1 (SBE1)
Starch branching enzymes1 (SBE1) is responsible for initiation of amylopectin
branches. The expression of SBE1 was detected at all-time points in both cultivars. It
started at low levels at early stages from 2 to12 DAA and increased at late stages from 14
to 20 DAA. Although, the expression of SBE1 followed the same trend in both cultivars,
it was significantly higher in Golden Promise than in Harrington, and reached a peak at
14-20 DAA (Figure 3.5).

76
Figure 3.4. Expression of soluble starch synthase-encoding genes (SSs).
The expression of GBSSs in cv. Harrington (H) is shown by brown bars, while cv. Golden
Promise (GP) by black bars. The expression of starch synthase-encoded genes shown in
the panel is ; (A) SS1, (B) SS2a, (C) SS2b, (D) SS3a, (E) SS3b , and (F) SS4. The bars
which have the same letters are not significantly different, while the bars with different
letters are significantly different at P < 0.05.
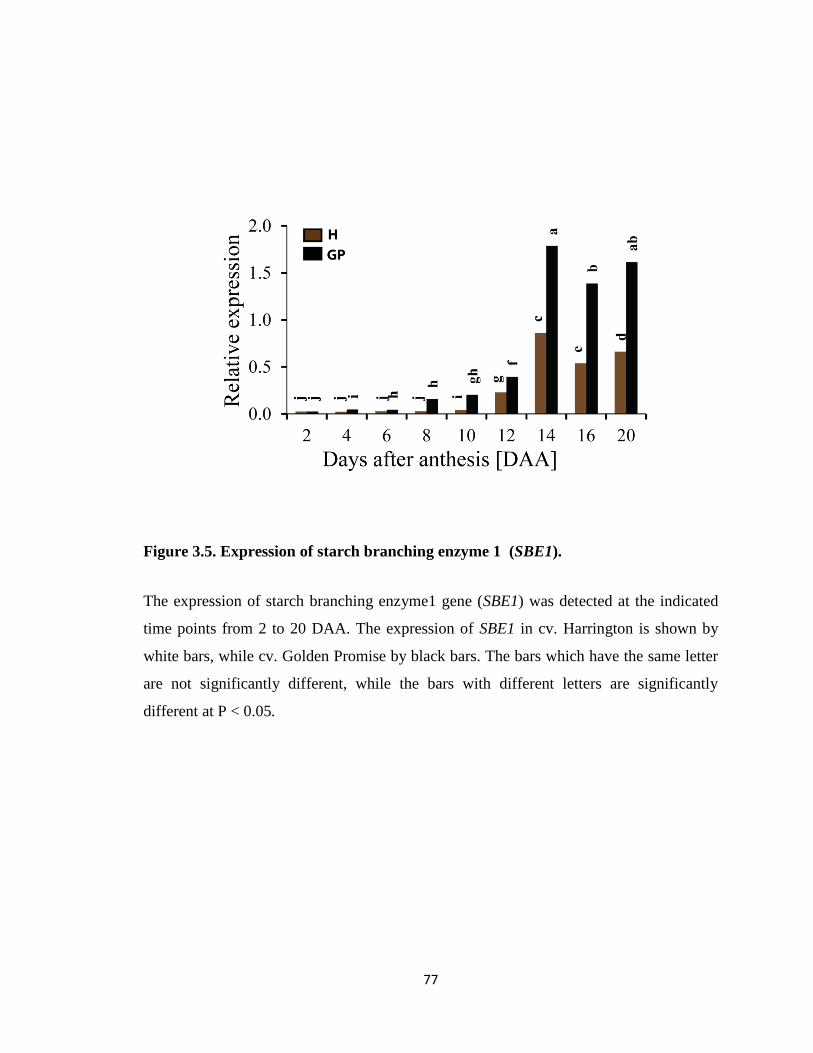
77
Figure 3.5. Expression of starch branching enzyme 1 (SBE1).
The expression of starch branching enzyme1 gene (SBE1) was detected at the indicated
time points from 2 to 20 DAA. The expression of SBE1 in cv. Harrington is shown by
white bars, while cv. Golden Promise by black bars. The bars which have the same letter
are not significantly different, while the bars with different letters are significantly
different at P < 0.05.
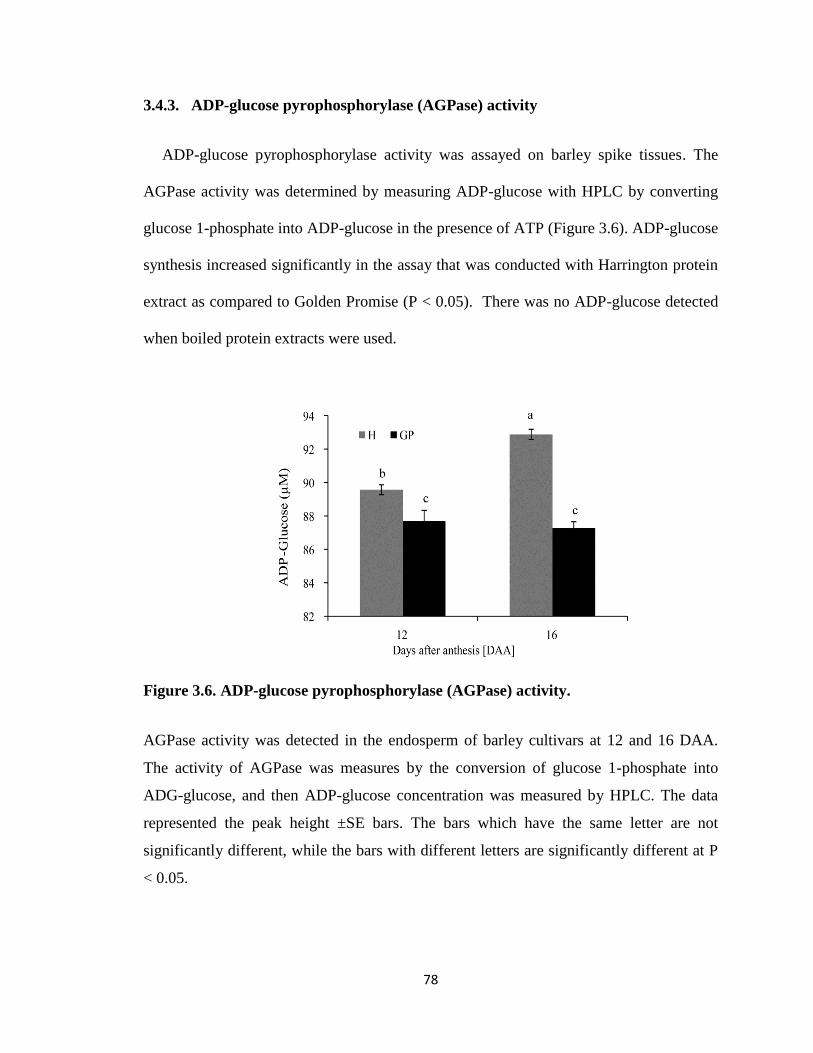
78
3.4.3. ADP-glucose pyrophosphorylase (AGPase) activity
ADP-glucose pyrophosphorylase activity was assayed on barley spike tissues. The
AGPase activity was determined by measuring ADP-glucose with HPLC by converting
glucose 1-phosphate into ADP-glucose in the presence of ATP (Figure 3.6). ADP-glucose
synthesis increased significantly in the assay that was conducted with Harrington protein
extract as compared to Golden Promise (P < 0.05). There was no ADP-glucose detected
when boiled protein extracts were used.
Figure 3.6. ADP-glucose pyrophosphorylase (AGPase) activity.
AGPase activity was detected in the endosperm of barley cultivars at 12 and 16 DAA.
The activity of AGPase was measures by the conversion of glucose 1-phosphate into
ADG-glucose, and then ADP-glucose concentration was measured by HPLC. The data
represented the peak height ±SE bars. The bars which have the same letter are not
significantly different, while the bars with different letters are significantly different at P
< 0.05.

79
Grain yield and physical parameters
A single grain weight in Harrington was significantly higher than in Golden Promise.
Consequently, a hundred grain weight also was significantly higher in Harrington. Grain
length and area in Harrington were higher in values than in Golden Promise, while grain
width showed no difference between the two cultivars (Table 2). The stereoscopic
examination of the cross-sectioned and the whole grains showed differences in grain size
and plumpness, where Harrington has bigger grains as compared to Golden Promise
(Figure 3.7).
Table 3.2. Grain yield-related traits
a Moisture content ~ 9-10 %
b Seed counter was used for counting 100 grains
c Grain physical parameters were assessed using Assess 2.0
3.4.4. Grain composition
3.4.4.1. Starch and amylose contents
Total starch content in Harrington (55.84%) was higher than in Golden Promise
(53.35%), representing ~ 2.5% higher starch content. In contrast to starch, amylose
content is lower in Harrington cultivar as compared to Golden Promise), with 26.8% and
27.65 %, respectively. Amylopectin was higher in Harrington than in Golden Promise
with 73.2% and 72.35%, respectively (Table 3).
Genotypea
Single grain
weight (mg)
100 grain
weight (g)b
Grain length
(mm)c
Grain width
(mm)c
Grain area
(mm)c
G. Promise 48.184 ± 0.62 4.825 ± 0.1 8.9472 ± 0.088 3.9132 ± 0.19 23.6508 ± 0.37
Harrington 53.412 ± 0.66* 5.118 ± 0.18* 10.406 ± 0.088* 3.9012 ± 0.043 27.9704 ± 0.27*
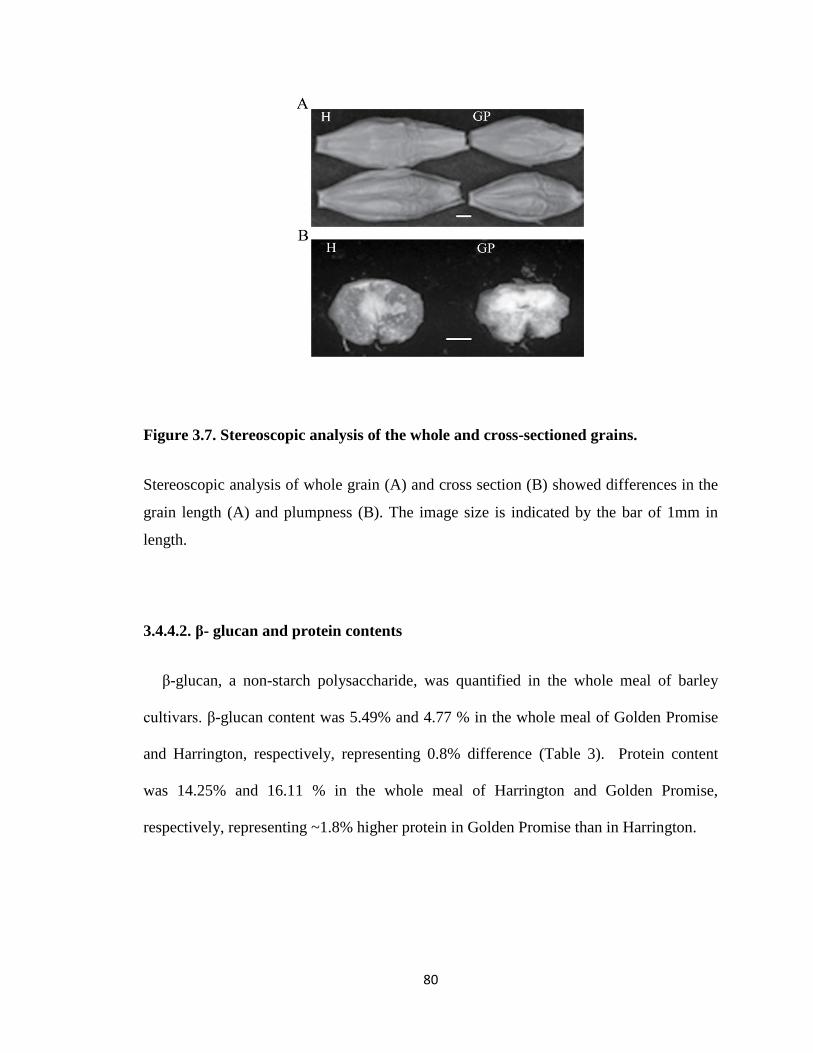
80
Figure 3.7. Stereoscopic analysis of the whole and cross-sectioned grains.
Stereoscopic analysis of whole grain (A) and cross section (B) showed differences in the
grain length (A) and plumpness (B). The image size is indicated by the bar of 1mm in
length.
3.4.4.2. β- glucan and protein contents
β-glucan, a non-starch polysaccharide, was quantified in the whole meal of barley
cultivars. β-glucan content was 5.49% and 4.77 % in the whole meal of Golden Promise
and Harrington, respectively, representing 0.8% difference (Table 3). Protein content
was 14.25% and 16.11 % in the whole meal of Harrington and Golden Promise,
respectively, representing ~1.8% higher protein in Golden Promise than in Harrington.

81
Table 3.3. Grain composition
Genotype a
Total starch
(%)b
Amylose (%) Amylopectin
(%) Protein (%)
c β-glucan (%)
d
G. Promise 53.35 ± 0.872 27.65± 0.25* 72.35 ± 0.25 16.115 ± 0.95* 5.40 ± 0.037*
Harrington 55.8 ± 1.195* 26.8± 0.2 73.2 ± 0.2* 13.25 ± 1.026 4.77 ± 0.18
a Moisture content ~ 9-10% and the percentage of the components based on the total
weight used for the assay (100 mg). b Total starch, amylose and amylopectin were measured in the whole meal.
c Protein values were obtained by multiplying nitrogen value by a factor of 6.25.
*Asterisk star indicates significance at P < 0.05.
3.4.4.3. Lipids content
Total lipids were extracted from the whole meal of Harrington and Golden Promise.
The lipid content was significantly higher in Golden Promise than in Harrington with
65.7 mg/g DW and 53.1 mg/g DW, respectively (Figure 3.8A). The gravimetric method
used for this quantification seems to overestimate lipid contents in the dry matter. Thin-
layer chromatography of extracted lipids did not discern changes in the lipids’ profiles of
the two cultivars (Figure 3.8B).
3.4.4.4. Waster-soluble carbohydrates
Water-soluble carbohydrates in grains of the two cultivars were measured by HPAEC.
Glucose, fructose, sucrose, and maltotriose contents were higher in Harrington than in
Golden Promise. Sucrose and fructose represented the highest soluble carbohydrates in
the grains (Figure 3.9).

82
Figure 3.8. Total lipids content and thin layer chromatography (TLC).
Total lipids content was assayed from barley cv. Harrington (H) and cv. Golden Promise
(GP) whole milled grains using the gravimetric method (A). A volume of 10 µL different
lines was separated on silica gel plate and visualized by iodine vapor (B). Spots are
marked with number on the left side of the gel. 1, Polar lipids; 2, Mono-glycerides; 3, 1,2
& 2,3 Di-glycerides; 4, Sterols; 5, 1,3 Di-glycerides; 6, Free fatty acids; 7, Triglycerides;
8, Sterol esters.

83
Figure 3.9. Water-soluble carbohydrates of barley grains
Y-axis represents the contents in mg/g DW, while X-axis showed the assayed
components. The mean values which marked by the same letter are not significantly
different at P < 0.05. Barley cv. Harrington is indicated with black box and cv. Golden
Promise with box with upward slanting diagonal lines.

84
3.5. Discussion
Identifying key elements or ideal combinations of different factors in the starch
synthesis process is essential for improving starch yield and quality. Many factors are
involved in the starch synthesis, including various enzymes and carrier proteins that
contribute to producing intermediate precursors and transporting the corresponding
substrates to be used for starch biosynthesis. ADP-glucose transporter is considered a key
factor in starch synthesis because of its unique function and localization. In this study, we
investigated the impact of HvBT1 and other starch synthesis-related genes on the grain
yield and composition in two malting barley cultivars.
Changes in starch content of cereal grains contribute to grain weight and grain yield
components (Table 1 and 2). Similar results were obtained from maize, where increasing
starch content led to an increase of grain weight (Li et al. 2011). Barley grain contains
~50-60% starch that is composed of ~25% and 75% amylose and amylopectin,
respectively (Li et al. 2011). Changes in starch content of cereal grains contribute to grain
weight and grain yield components. Variations in the grain composition and grain yield-
related traits resulted in a 2.5% higher starch in Harrington (Table 3.3), similar to
increased seed weight in maize (Li et al. 2011).
A negative correlation between starch and protein was clearly observed in the present
study, where Harrington accumulated higher starch and significantly lower protein
content as compared to Golden Promise (Table 3.3). Such negative correlation between
starch and protein content was previously reported in maize (Seebauer et al. 2010) and in
barley SS2a mutants (Clarke et al. 2008). Decreasing amylopectin content has a great
negative impact on starch yield (Morell et al. 2003). Therefore, the higher amylopectin

85
and low amylose content observed in Harrington was a determinant factor in increasing
starch yield in this cultivar. Starch yield mainly relies on amylopectin content which
represents around 70-80% of starch dry weight (Regina et al. 2010). High levels of β-
glucan in Golden Promise were accompanied with high amylose content, which
suggested a correlation between those two components in cereal grains (Table 3.3).
Izydorczyk et al. (2000) reported that a positive correlation between β- glucan and
amylose content was found in barley. Similar results have been reported by Caciofi et al.
(2012) by suppression of all SBE genes in barley. Hang et al. (2006) reported that
amylose was negatively correlated with proteins and β- glucan contents. β-glucan content
in barley grains varies from 3-20% of the dry matter and depends on the genotype and
environmental conditions (Aastrup and Munck, 1985; Munck et al. 2004; Aastrup, 1979;
Fincher and Stone, 1986). Lipids represent 1-3% of the cereal grain and are distributed in
different compartments; aleurone layer, scutella, embryo and endosperm, mainly
depending on the genetic background (Morrison, 1978; Jacobsen et al. 2005). Crude
lipids were significantly higher in Golden Promise, along with high amylose and lower
starch content (Figure 3.8). Oppositely, sucrose and fructose were higher in Harrington
than Golden Promise (Figure 3.9). The differences in grain size and plumpness, as
indicated by stereoscopic analysis of barley intact and cross sectioned grains, respectively
(Figure 3.7), which showed higher values in Harrington are controlled genetically
(Bednarek et al. 2012) and / or environmentally (Chen et al. 2012).
Changing grain composition was genetically indicated by analysis of starch synthesis-
related genes. ADP-glucose pyrophosphorylase (AGPase) is one of the limiting factors in
this process, which is responsible for ADP-glucose synthesis. Higher expression of

86
AGPase-encoding genes for large and small subunits in Harrington (Figure 3.2) can give
an indication of the efficiency of intermediate precursor’s conversion. The AGPase
activity in Harrington was higher at both indicated time points (Figure 3.6). Increasing
the activity of AGPase helps to enhance starch accumulation and increase seed weight (Li
et al,. 2001). The AGPase activity result coincides with the results obtained from the gene
expression analysis. Another indicator for the efficiency of starch synthesis process in
Harrington came from a higher expression level of ADP-glucose transporter HvBT1 than
in Golden Promise (Figure 3.1). HvBT1 is located in amyloplasts` membrane and
mediates ADP-glucose transport from the cytosol into amyloplasts (Bowsher et al. 2007;
Kirchberger et al. 2007). The position of HvBT1 and its unique function make it another
possible limiting factor in starch synthesis process along with AGPase. Increasing the
expression of GBSS1a and b (Figure 3.3) in Harrington may contribute to amylopectin
synthesis along with the main function of amylose synthesis, which may explain the high
ratio of amylopectin/amylose in Harrington. Granule-bound starch synthase (GBSS)
isoforms are responsible for amylose synthesis and producing long chains of amylopectin
(Shure et al. 1983; Denyer et al. 1999a; Denyer et al. 1999b). GBSS1a is normally
expressed in the endosperm, while GBSS1b is expressed in the pericarp (Radchuk et al.
2009). GBSSs are exclusively located inside starch granules and act on amylopectin side-
chains forming long chains (Fulton et al. 2002; Hanashiro et al. 2008). Amylopectin is
synthesized by starch synthase isoforms in the plastids. Generally, starch synthases (SSs)
in both cultivars followed the same trends and there were not many differences between
these cultivars (Figure 3.4). Soluble starch synthases (SS) were grouped into three distinct
classes; early, late and steady expressers (Hirose and Terao, 2004). Late expressed genes
87
include SS1, SS2a and SS3a, while steady expressed genes include SS2b, SS3b and SS4.
Starch synthase genes showed differential expression patterns in both cultivars. Higher
expression of AGPase genes for large and small subunits genes in Harrington, supported
by the higher AGPase activity as well as the high expression of HvBT1, can explain
increased starch content in comparison to Golden Promise.
3.6. Conclusion
The expression of the plastidial ADP-glucose transporter (HvBT1) in Harrington
was significantly higher (almost 10 times) than in Golden Promise. The combined
activities of AGPase and HvBT1, which generate ADP-glucose in the cytosol and
transport it into amyloplasts, respectively, can help improve starch accumulation in cereal
grains. Interestingly, the expression of starch synthase-encoding genes was significantly
lower in Harrington, but starch content was significantly higher by 2.5% as compared to
Golden Promise. This result provided a positive sign about the importance of the
combination of AGPase and HvBT1 in starch synthesis. As a result of changes in starch
content in barley grains, other grain components changed accordingly. β-glucan, protein
and lipids showed significantly lower content in Harrington which correlate negatively
with starch content. Genetic manipulation of HvBT1 by changing its expression may
provide amenable opportunities to increase starch accumulation in cereal grains.
88
CHAPTER 4. DOWN-REGULATION OF THE PLASTIDIAL ADP-GLUCOSE
TRANSPORTER (HvBT1) IMPAIRS STARCH ACCUMULATION AND ALTERS
GRAIN COMPOSITION IN BARLEY.
4.1. Abstract
Down-regulation of barley plastidial ADP-glucose transporter HvBT1 resulted in
negative effects on starch accumulation and composition, and concurrent changes in the
grain size and grain weight. Starch decreased by 9.5% in transgenic grains as compared
to those of the wild type. Also, starch composition was altered, with amylose decreased
by 3.5%, and amylopectin decreased by 6%. Wild type grains were plump and well-filled,
whereas transgenic grains were incompletely filled. On the other hand, protein and lipid
content increased significantly in the transgenic grains. Grain yield-related traits were
negatively affected by increased grain size, which led to a decreased number of grains per
spike, and decreased spike length and number of spikes per plant. HvBT1 seems to have
pleotropic effects on starch synthesis-related genes such as the large and small subunits of
ADP-glucose pyrophosphorylase (AGPLs and AGP.Ss), granule-bound starch synthases
(GBSSs) and soluble Starch Synthases (SSs). Interestingly, AGPLs were down-regulated
while small subunit genes, S1b and S2 were up-regulated in the transgenic plants. Soluble
starch synthases (SS) expressed differentially in the transgenic plants. SS2a and SS3a
were down-regulated while, plastidial AGPS2b was up-regulated in the transgenic plant.
HvBT1 is a key factor in starch biosynthesis process. It has negative effects on starch
accumulation and composition and other grain components.

89
4.2. Introduction
Barley (Hordeum vulgare L.) is one of the oldest grain crops. Globally, it stands after
maize, wheat, rice, and soybean in term of importance (Dahleen et al. 2007). In ancient
times, barley was mainly used as a human food source. After the domestication of wheat
and rice, its use is shifted mainly for feeding live-stocks and malting and brewing
(Newman and Newman 2006). Barley products have much potential for human health.
For example, β-glucan reduces blood cholesterol and glycemic index (Baik et al. 2008),
and many other useful compounds found in barley grains work as antioxidants such as
tocopherols and tocotrienols which reduce serum LDL cholesterol (Qureshi et al. 1991).
The starch content of barley ranges between ~ 50 and ~ 60% and contains two main
components, amylose (~25%) and amylopectin (~75%) (Li et al. 2011). Amylose is a
linear molecule composed of ɑ-D-glucopyranosyl units connected by (1-4) linkage,
whereas, amylopectin is a branched molecule of (1-4) linked D-glucopyranosyl units
connected by (1-6) linkage (Whister and Daniel, 1984). The synthesis of starch in higher
plants takes place in the plastids and is catalyzed by several enzymes. ADP-glucose, the
main substrate for starch synthesis, is synthesized by ADP-glucose pyrophosphorylase
(EC 2.7.7.27) via catalyzing the conversion of glucose 1-phosphate using ATP to ADP-
glucose. Amylose and amylopectin are formed from ADP-glucose by starch synthases
(EC 2.4.1.21), starch branching (SBE, EC 2.4.1.18) and de-branching enzymes (EC
3.2.1.41 and 3.2.1.68). Multiple isoforms of these enzymes are present in the plastids of
photosynthetic and non- photosynthetic tissues of higher plants (Li et al. 2011). In
heterotrophic tissues of mono-cotyledonous plants, starch is synthesized via catalyzing
hexose phosphate via plastidial form of AGPase in amyloplasts. Glucose 6-phosphate is

90
transported across the amyloplast envelops via glucose 6-phosphate/phosphate
translocator (GTP) in counter-exchange with inorganic phosphate and can be used either
for starch biosynthesis or for triose phosphate production (Kammerer et al. 1998).
The extra-plastidial activity of AGPase has been reported in several cereal crops and
other graminaceous grasses (Beckles et al. 2001). The majority of AGPase activity in
cereal crops is extra-plastidial in the endosperm (Denyer et al. 1996; Thorbjørnsen et al.
1996; Tetlow et al. 2003), in which the majority of ADP-glucose is synthesized in the
cytosol and transported into the amyloplasts, where starch synthesis takes place. It has
been shown, for example, the isolated amyloplasts of wheat and barley transported the
exogenous ADP-glucose in and formed starch (Tetlow et al. 1994; Patron et al. 2004).
As a result of the extra-plastidial activity of AGPase in the endosperm of cereal plants,
the majority of ADP-glucose is synthesized in the cytosol and should be transported into
amyloplasts where starch biosynthesis takes place.
In different plant species, Brittle1 (BT1) homologues are members of the
mitochondrial carrier family (MCF), which transport different metabolite precursors.
ADP-glucose transporters have been characterized in different cereal crops and are shown
to be capable of transporting ADP-glucose in counter exchange with ADP and AMP
(Krishberger et al. 2007; Bowsher et al. 2007). Mutation in the lys5 locus led to defect in
ADP-glucose transport, and reduced starch accumulation. Expression analysis of the
maize BT1 gene showed that its expression exclusively localized in the endosperm
(Krishberger et al. 2007). In dicotyledonous species, several BT1 homologues were
characterized as nucleotide transporters including Solanum tuberosum StBT1 and
Arabidopsis thaliana AtBT1 (Loerch et al. 2005; Kirchberger et al. 2008). The dual
91
function of BT1 homologues was reported, where maize ADP-glucose transporter ZmBT1
and Arabidopsis adenine nucleotides transporter AtBT1 were localized in chloroplasts and
mitochondrial envelops (Bahaji et al. 2011).
Different techniques have been successfully implemented for barley transformation
including; particle bombardment (Lemaux et al. 1994), electroporation (Gurel et al.
2000), and Agrobacterium-mediated transformation (Tingay et al. 1997) have been
successfully used for stable barley transformation. Agrobacterium-mediated
transformation in many crops is preferable due to the low copy number of T-DNA
integrations in the genome of transgenic lines that increase the stability over generations
(Shou et al. 2004). Transformation of cereal plants is a genotype-dependent, which is still
a big challenge to improve traits through gene transfer in commercial cultivars (Shrawat
et al. 2007). Most of the biolistic and Agrobacterium-mediated transformations of barley
have used the model cultivars such as Golden Promise and Igri for their high callus
induction and regeneration characteristics (Dahleen et al. 2007). The immature embryo
has been considered as the most relevant explant that is highly responsive to tissue
culture conditions. However, mature embryos axis-based explants and shoot meristematic
cultures have been used for successful stable transformation in model and commercial
barley cultivars (Zang et al. 1999; Sharma et al. 2005).
In cereals, improving starch yield and quality is the target of many researchers, which
can be achieved by manipulating genes that are involved in ADP-glucose synthesis and
transport in the endospermic cells during grain filling. Our goals in this research are
investigating the impact of knocking down the barley plastidial ADP-glucose transporter
HvBT1 on starch accumulation and grain composition, and investigating the impact of

92
the HvBT1 expression on some genes that are involved in the starch biosynthesis
pathway.
4.3. Materials and methods
4.3.1. Plant material and immature embryo isolation
Barley cv: Golden Promise was grown in the greenhouse under controlled conditions
with photoperiod 16/8 and temperature 22/18 C day and night with humidity 80%.
Immature barley spikes were collected after 12-14 days after anthesis (DAA) whereas;
immature embryos were 1.5-2 mm in diameter. The grains were surface sterilized using
1.2% sodium hypochlorite and few drops of tween 20. The immature embryos were
dissected using fine forceps (5- Inex, Invitorgen, CA, USA), to removed or disrupt
embryonic axis which prevented embryo germination and increased callus induction. The
extracted embryos were placed on callus induction medium (CIM) containing 4.3 g l-1
Murashige & Skoog salt base (Phytotechnology Lab.), 30 g/L Maltose, 1 g/L Casein
hydrolysate, 350 mg/L myo-inositol, 690 mg/L proline, 1 mg/L thiamine HCl, 2.5 mg/L
dicamba (Sigma-Aldrich) and 3.5 g/L phytagel (Bartlett et al. 2008) with additional 1.25
mg/L CuSO4.5H2O (Cho et al. 1998).
4.3.2. Cloning of antisense HvBT1 and binary plasmid construct
Spike tissue from different time points after anthesis were collected and immediately
frozen in liquid nitrogen. RNA was extracted using RNeasy Plant Mini Kit (Qiagen,
Hilden, Germany). The genomic DNA was digested in column and eliminated using
RNase-Free DNase I Kit (Qiagen). The purity and concentration of the RNA was

93
determined by visualizing on agarose gel and measuring absorbance on a Nanodrop
spectrophotometer (Thermo Fisher, MA, USA). The cDNA was synthesized using
Revert Aid First Strand cDNA Synthesis Kits (Fermentas). The open reading frame
(ORF) was amplified using gene specific primers, which were designed based on the
reported DNA sequence (NCBI: AY560327.2). The ORF was cloned in the pGEM-T-
Easy plasmid and verified by sequencing (Macrogen, USA). HvBT1 coding sequence was
amplified from pGEM-T-easy plasmid using gene specific primers flanked by restriction
sites for EcoR1 (Foreword, 5’-TAgaattcTCATGGTCGATCACCG-3’) and Xho1
(Reverse, 5’-CGctcgagATGGCGGCGGCAAT-3’). Lowercase letters indicate restriction
enzymes cutting sites. After PCR purification and digestion, the digested PCR product
was cloned into the entry plasmid pENTR1A (Invitrogen, CA, USA), where the HvBT1
ORF was cloned in the opposite orientation. LR clonase reaction (Invitrogen) was
performed to clone pBract 214 (John Inns Centre, UK). The LR clonase ligation
procedure was performed based on the manufacturer instructions (Figure 4.1).
Figure 4.1. Map of pBract214::HvBT1 antisense construct

94
4.3.3. Agrobacterium strain and binary plasmid transformation
Agrobacterium tumefaciens AGL1 cells harboring pBract 214 vector were used in this
experiment. This vector contains a hygromycin resistant gene (hpt gene) controlled by
CaMv 35S promoter. Also, it has a negative selection marker (ccdB) flanked by the
Gateway recombination sites to facilitate the cloning of the gene of interest. HvBT1 is
driven by maize ubiquitin promoter Ubi1. Bract vectors are based on pGreen and needs a
helper plasmid (pSoup) to be propagated in Agrobacterium cells. The helper plasmid was
electroporated into Agrobacterium cells along with the pBract vector. The two plasmids
are required for successful transformation in Agrobacterium. One microliter from each
plasmid was added to 100 µL Agrobacterium cells for co-electroporation using Bio-Rad
Gene Pulser (2.5 kV, 25u FD, 400 ohms). The cells were transferred into new eppendorf
tubes containing LB media and shaken gently at 28°C and 180 rpm for 2 hrs and then 100
µL of pre-culture was spread on LB media plates containing 50 µg/mL kanamycin and
25µg/ml rifampicin and incubated for 2-3 days at 28 C. One colony was selected and
inoculated in fresh LB media to make standard culture.
4.3.4. Agrobacterium inoculation and co-cultivation
The extracted immature embryos were placed on callus induction media (CIM)
scutella side up (25 embryos/plate). Agrobacterium cells were resuspended in diluted
CIM (1:10) and used to inoculate the embryos for 2-3 hours at room temperature.
Acetosyringone at final concentration of 200 µM and Silwet L77 detergent at final
concentration of 0.04% were added to the Agrobacterium diluted culture before
inoculation. Acetosyringone enhances the vir genes and Silwet L77 increases Ti-DNA
95
delivery. The embryos were co-cultivated and placed scutella side down into fresh callus
induction media CIM without antibiotics for 2-3 days at 23-24°C in dark.
4.3.5. Selection of transgenic plants
After co-cultivation with Agrobacterium AGL1 strain, 25 immature barley embryos
were plated scutella side down on callus induction media (CIM) supplemented by 50
mg/L hygromycin B and 300 mg/L timentin as Agrobacterium killer. The discected
embryos were incubated in CIM for 3-6 weeks and the induced calli were transferred
onto fresh CIM every 15 days (2 – 3 rounds). After callus induction, the embryonic callus
was transferred into shoot initiation media supplemented with plant growth hormones.
The shoot initiation (transition) medium contained 2.7 g/L Murashige & Skoog modified
plant salt base (without NH4NO3) (PhytoTechnology Lab., USA), 20 g/L maltose, 165
mg/L NH4NO3, 750 mg/L glutamine, 100 mg/L myo-inositol, 0.4 mg/L thiamine HCl,
1.25 mg/L CuSO4.5H2O, 2.5 mg/L 2, 4 Dichlorophenoxy acetic acid (2,4-D) (Sigma-
Aldrich), 0.1 mg/L 6-Benzylaminopurine (BAP), 3.5 g/L Phytagel (Sigma-Aldrich), 50
mg/L hygromycin (PhytoTechnology Lab, USA ) and 160 mg/L timentin
(PhytoTechnology Lab, USA). The embryonic calli were incubated in dim light on the
transition media for 3-4 weeks to form shoots. After shoot formation, plantlets were
transferred into regeneration media. Regeneration media is CIM media including 50
mg/L hygromycin B and 200 mg/L timentin but without growth regulators. The
regenerated plants were incubated in full light at 24°C until the plants reached 2-3 cm in
length and had good root systems, then transferred to the soil and grown under the same
condition as the parent plants (Harwood et al. 2009).

96
4.3.6. PCR analysis of transgenic lines
Genomic DNA of transgenic barley lines was extracted using CTAB method (Murray
and Thompson, 1980) and used for PCR amplification. Two sets of primers were used to
examine the transgenic lines. The hpt gene (aphIV) primers (forward: 5’-
ACTCACCGCGACGTCTGTCG-3’; reverse: 5’-GCGCGTCTGCTGCTCCATA-3’)
were used for PCR amplification of a 927 bp to confirm the integration of the hpt gene in
the regenerated lines. A second PCR reaction was conducted with primers to examine the
HvBT1 (HvBT1 R-5’ TCATGGTCGATCACCGTTG-3’) and the vector backbone (Nos-
Term R 5’-TGATATCAGCTTGCATGCCGGTC-3') presence in the genome. The
amplicon size is ~ 1800 bp. Phusion High-Fidelity DNA Polymerase (Fermentas) was
used for this assay. The polymerase chain reaction was performed according to the
manufacturer procedures. Genomic DNA samples from barley wild type and transformed
lines were used at a concentration of 50-100 ng/50 µL PCR reaction volume.
4.3.7. Northern blot analysis
Northern blot analysis was performed on total RNA from immature barley grains at 10
DAA. Total RNA (10 µg) was separated on 1% agarose formaldehyde gel and transferred
by capillary system onto Hybond-NI membranes (Amersham Bio-sciences) and fixed by
UV cross-linking according to the standard protocol. The probe was prepared using DIG-
labeling Kit (Roche). Briefly, 400 bp fragment of HvBT1 cDNA was amplified and
cloned in pGEM-T-Easy plasmid (Promega), then amplified using M13 forward and
reverse primers which are located in the upstream and downstream of T7 and SP6
promoter regions, respectively. The PCR products were used as templates for T7 RNA
polymerase reaction to produce antisense RNA probe. The procedures were performed
97
according to DIG Northern Starter Kit (Roche Applied Science, Mannheim, Germany).
After hybridization with RNA probe, the chemiluminescent signal of alkaline
phosphatase was generated and detected using CDP-Star reagent and developed on X-ray
film.
4.3.8. Grain morphology and cross section
Immature caryopsis harvested at 14 DAA, mature whole grains, mature grain cross
sections and dissected mature embryos were examined by stereoscopic microscope and
photographed (Li et al. 2011). Mature grains from individual transgenic lines and wild
type were assayed for seed area, seed length and seed width using Assess 2.0 Image
Analysis Software (Lamari, 2008). Thirty five grains from three transgenic lines and wild
type seed area, seed length and seed width were analyzed using Assess 2.0. The
measurement was replicated three times.
4.3.9. Analysis of grain composition
Analysis of starch and grain composition was performed on T2 grains from different
individual transgenic lines and the wild type control. Three biological sets of grains from
each line including the wild type was used for total starch analysis, amylose /
amylopectin, β-glucan and total protein content.
4.3.9.1. Starch content
Barley grains were ground in a mill grinder (Retsch 0.5 mm at 14,000 rpm). Total
starch content was assayed using AOAC Method 996.11/AACC Method 76.13 kit
(Megazyme International Ltd., Wicklow, Ireland). The assay was performed with 100 mg

98
whole meal and extraction procedures were performed according to the manufacturer’s
instructions.
4.3.9.2. Amylose content
Amylose content was assayed using K-AMYL 07/11 kit (Megazyme International
Ltd., Wicklow, Ireland). The assay was performed with 20 – 25 mg sample weight. Three
biological samples from each line and three technical replicates for each were used in this
assay.
4.3.9.3. Protein content
The total protein content was determined in different transgenic lines along with wild
type mature grains based on total nitrogen content using a combustion nitrogen analyzer
(Leco FP – 528, Nitrogen/Protein Determinator Corporation, St. Joseph, Mich). The
nitrogen was converted to protein by multiplying the obtained nitrogen values by a factor
of 6.25.
4.3.9.4. β-glucan content
β-glucan content was determined with whole meal using K-BGLU kit (Megazyme
International Ltd., Wicklow, Ireland). The assay was performed on three biological
samples from each line with three technical replicates.
4.3.9.5. Lipids extraction and thin layer chromatography
Lipids were extracted and quantified from barley whole meal (1 g) of wild type and
transgenic lines using gravimetric method after extraction with chloroform-methanol

99
mixture. The procedures were performed according to Phillips et al. (1997). Thin layer
chromatography (TLC) was performed by applying 10 µL of total lipid extracts on silica
gel (AL SIL G, plate size 20x20 cm with 0.25 mm thickness, Whatman) according to
Mangold and Malins, (1960) and Mangold, (1961) and separated by petroleum ether
:diethyl ether : glacial acidic acid (80:20:1, v:v:v) according to Kates, (1972). Lipid
fractions were visualized using iodine vapor. The lipid fractions were identified by
comparing RF values to published RF values of lipid standards.
4.3.9.6. Water-soluble carbohydrate content
Water-soluble carbohydrates were extracted according to Yemm and Willis, (1954)
with some modification made by Clarke et al. (2008). In brief, 100 mg of barley whole
meal was extracted in 10 mL 80% ethanol by boiling in water bath for 10 min. The
extraction was performed three times and the supernatant pooled and freeze dried. The
carbohydrates were re-suspended in 1 mL milliQ water and carbohydrate sugars were
quantified using HPAEC according to Ruuska et al. (2006).
4.3.10. Analysis of grain yield parameters
Number of spikes per plant, single grain weight, number of grains per spike, spike
length, hundred grains weight and total grain weight per plant were assayed in wild type
and transgenic lines to assess yield component parameters.
4.3.11. Quantitative qRT-PCR of starch synthesis related genes
Total RNA was extracted from barley heads at 8 and 12 DAA as previously described.
The first strand DNA was synthesized using Revert Aid First Strand cDNA Synthesis
100
Kits (Fermentas). Quantitative Real-Time PCR was conducted using a CFX96 Thermal
Cycler (Bio-Rad) and Sso Fast Eva Green Supermix (Bio-Rad) according to the
manufacturer’s instructions. Actin was used as an internal control to normalize qRT-PCR.
The qRT-PCR was assayed on cDNA with 4 ng/µL final volume. The selected genes
accession numbers and primer sequences are shown in (Chapter 2 Table 2.1). The qRT-
PCR results were analyzed using2- ΔΔ
Ct method (Livak and Schmittgen, 2001).
4.3.12. Starch granule morphology
The morphology of starch granules was tested by Scanning Electron Microscope
(SEM). Barley flour was sprinkled onto double sided sticky tape on circular aluminum
stubs and coated by gold. Starch granules were photographed by SEM (Cambridge S120).
4.3.13. Statistical analysis
Analysis of variance was performed using Proc GLM SAS 9.2 (SAS Institute Inc.,
USA) to determine the significance between wild type and transgenic lines parameters
4.4. Results
4.4.1. Generation and characterization of transgenic barley plants
To investigate the impact of down-regulation of HvBT1 on starch accumulation and
composition, an antisense approach was implemented using the maize ubiquitin promoter
to drive the expression of the antisense HvBT1 in barley. The transgenic plants were
selected on hygromycin selective media (50µg/mL). Seven individual transgenic lines

101
were generated successfully and assayed for transgene integration with PCR and northern
blot analysis. Our PCR analysis with the hygromycin specific primers generated
amplicon size of 920 bp in the transgenic lines and no amplification was detected in the
wild type (Figure 4.2A).
A subsequent PCR reaction was further performed using primers specific to the
vector backbone (NOS terminator region) and the transgene, resulting in a specific band
with amplicon size of ~ 1800 bp in the transgenic lines but not in the wild type. In
addition, the northern blot analysis showed the presence of strong signals in the wild type
(Figure 4.1B), while weak signals were detected in the transgenic lines (Lane 1-7). The
signal intensity in the transgenic lines was ~ 10 % of the signal intensity detected in wild
type RNA (Figure 4.2B).
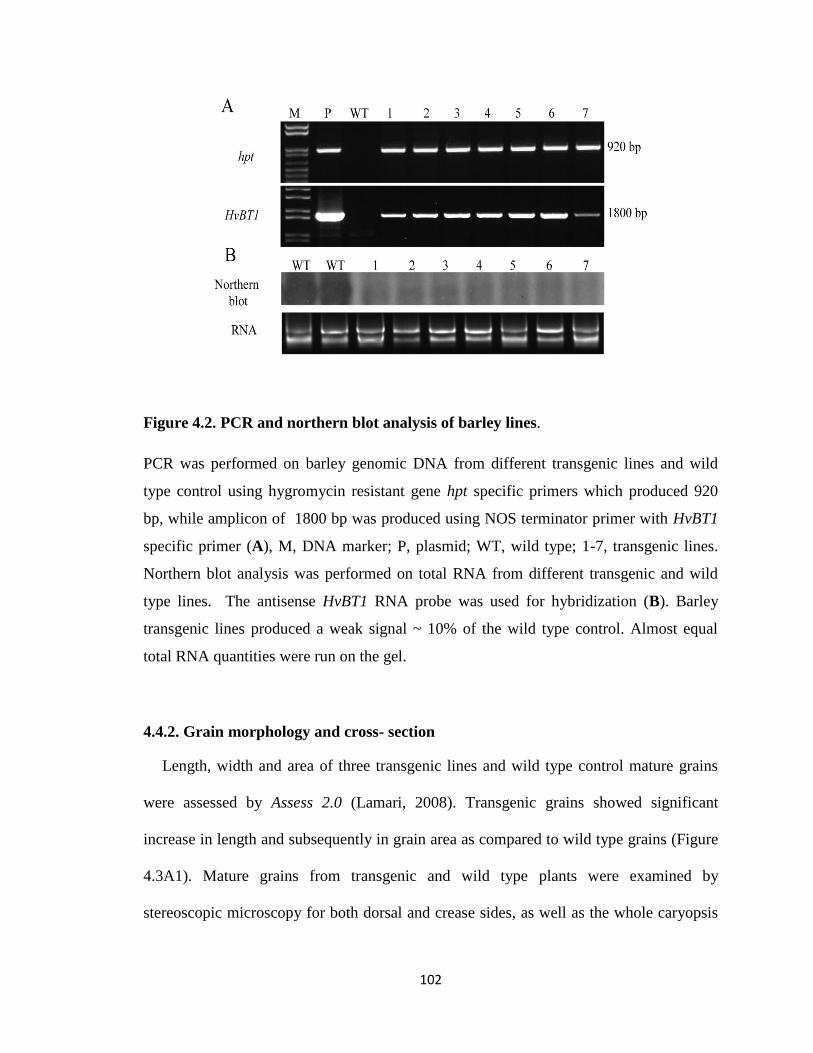
102
Figure 4.2. PCR and northern blot analysis of barley lines.
PCR was performed on barley genomic DNA from different transgenic lines and wild
type control using hygromycin resistant gene hpt specific primers which produced 920
bp, while amplicon of 1800 bp was produced using NOS terminator primer with HvBT1
specific primer (A), M, DNA marker; P, plasmid; WT, wild type; 1-7, transgenic lines.
Northern blot analysis was performed on total RNA from different transgenic and wild
type lines. The antisense HvBT1 RNA probe was used for hybridization (B). Barley
transgenic lines produced a weak signal ~ 10% of the wild type control. Almost equal
total RNA quantities were run on the gel.
4.4.2. Grain morphology and cross- section
Length, width and area of three transgenic lines and wild type control mature grains
were assessed by Assess 2.0 (Lamari, 2008). Transgenic grains showed significant
increase in length and subsequently in grain area as compared to wild type grains (Figure
4.3A1). Mature grains from transgenic and wild type plants were examined by
stereoscopic microscopy for both dorsal and crease sides, as well as the whole caryopsis
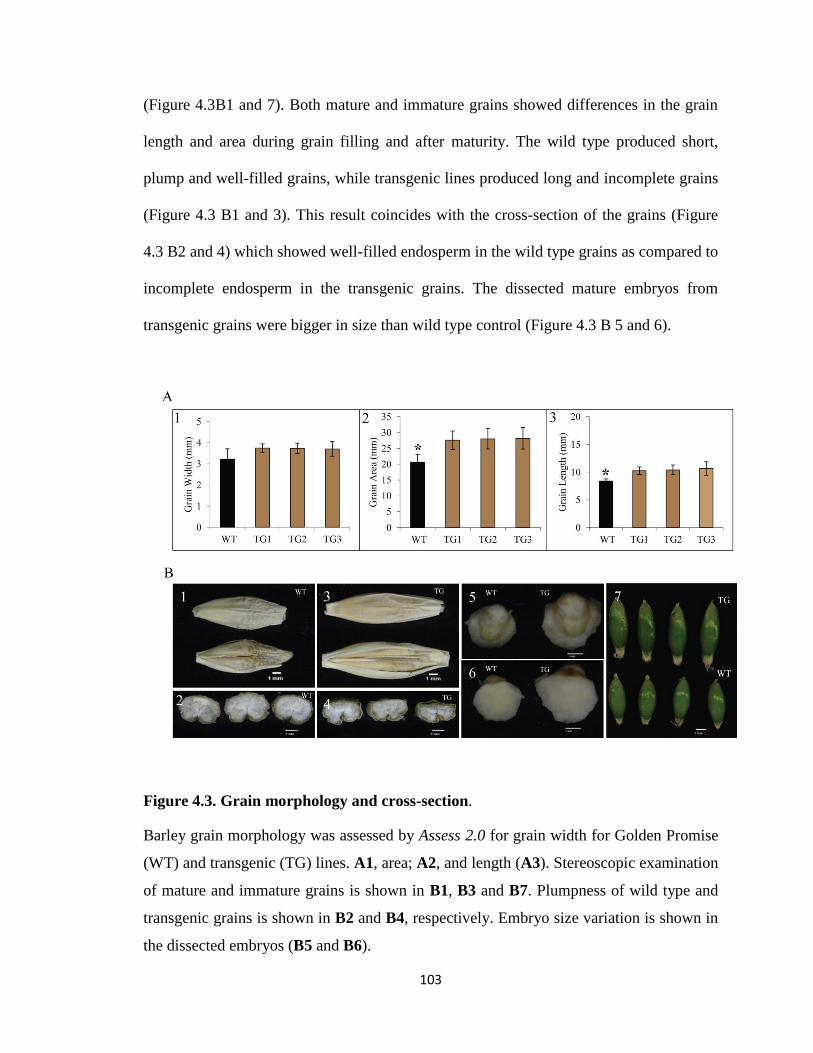
103
(Figure 4.3B1 and 7). Both mature and immature grains showed differences in the grain
length and area during grain filling and after maturity. The wild type produced short,
plump and well-filled grains, while transgenic lines produced long and incomplete grains
(Figure 4.3 B1 and 3). This result coincides with the cross-section of the grains (Figure
4.3 B2 and 4) which showed well-filled endosperm in the wild type grains as compared to
incomplete endosperm in the transgenic grains. The dissected mature embryos from
transgenic grains were bigger in size than wild type control (Figure 4.3 B 5 and 6).
Figure 4.3. Grain morphology and cross-section.
Barley grain morphology was assessed by Assess 2.0 for grain width for Golden Promise
(WT) and transgenic (TG) lines. A1, area; A2, and length (A3). Stereoscopic examination
of mature and immature grains is shown in B1, B3 and B7. Plumpness of wild type and
transgenic grains is shown in B2 and B4, respectively. Embryo size variation is shown in
the dissected embryos (B5 and B6).
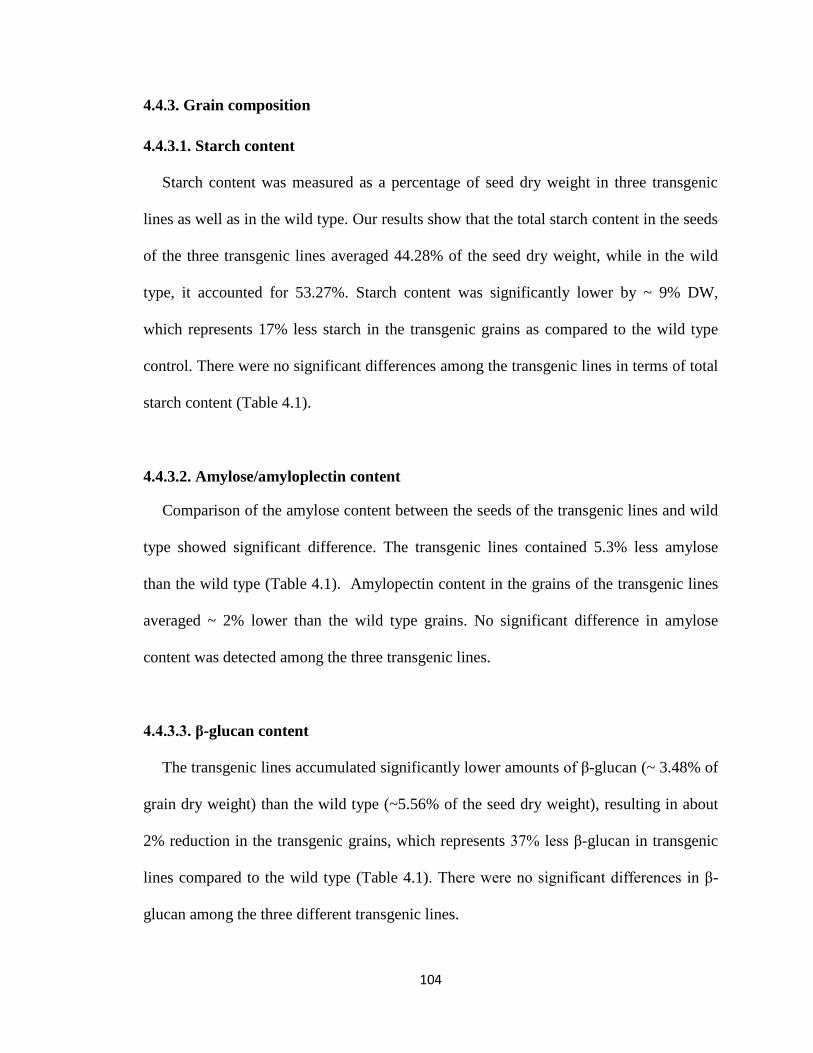
104
4.4.3. Grain composition
4.4.3.1. Starch content
Starch content was measured as a percentage of seed dry weight in three transgenic
lines as well as in the wild type. Our results show that the total starch content in the seeds
of the three transgenic lines averaged 44.28% of the seed dry weight, while in the wild
type, it accounted for 53.27%. Starch content was significantly lower by ~ 9% DW,
which represents 17% less starch in the transgenic grains as compared to the wild type
control. There were no significant differences among the transgenic lines in terms of total
starch content (Table 4.1).
4.4.3.2. Amylose/amyloplectin content
Comparison of the amylose content between the seeds of the transgenic lines and wild
type showed significant difference. The transgenic lines contained 5.3% less amylose
than the wild type (Table 4.1). Amylopectin content in the grains of the transgenic lines
averaged ~ 2% lower than the wild type grains. No significant difference in amylose
content was detected among the three transgenic lines.
4.4.3.3. β-glucan content
The transgenic lines accumulated significantly lower amounts of β-glucan (~ 3.48% of
grain dry weight) than the wild type (~5.56% of the seed dry weight), resulting in about
2% reduction in the transgenic grains, which represents 37% less β-glucan in transgenic
lines compared to the wild type (Table 4.1). There were no significant differences in β-
glucan among the three different transgenic lines.

105
Table 4.1. Grain composition
aMoisture content ~ 9-10% and the percentage of the components based on the total weight used for the
assay (100 mg). Wild type control is cultivar Golden Promise, TG represents the transgenic line. bTotal starch, amylose and amylopectin were measured in the whole meal and are represented as %, which
represents the amount in mg per 100 mg dry weight. cProtein values were obtained by multiplying the obtained nitrogen value by a factor of 6.25.
4.4.3.4. Protein content
Comparison of the protein content of three transgenic lines and wild type grains
showed that the protein level in the transgenic lines accounted for 19.27% of the seed dry
weight, compared to 15.29% in the wild type, resulting in a statistically significant
difference in protein content between transgenic and wild type lines. Total protein content
was on average 4-5% higher in the transgenic grains than the wild type control (Table
4.1).
4.4.3.5. Lipids content
Quantification of total lipids in the grains of transgenic and wild type plants showed
that the transgenic grains accumulated significantly higher quantities of lipids than the
wild type control. The transgenic grains contained ~ 88 mg/g DW, while the wild type
control contained 65 mg/g DW (Figure 4.4A), which represents ~35% higher lipids in
transgenic grains. The gravimetric method used for this quantification seems to
overestimate lipid content in the dry matter. Analysis of the lipid extracts with Thin
Layer Chromatography (TLC) indicated that the seeds of the transgenic lines
Total starch (%)b Amylose (%) Amylopectin (%) Protein (%)c β- glucan (%)d
Wild type 53.27± 1.3a 27.6±0.14a 72.4±0.15a 15.29±0.21a 5.56±0.28a
TG1 44.31± 0.83b 26±0.15b 74±0.15b 19.93±0.52b 3.43±0.18b
TG2 43.85± 0.7b 25.9±0.14b 74.1±0.15b 19.44±0.37b 3.52±0.05b
TG3 44.7± 1.3b 26.5±0.12b 73.5±0.12b 18.44±0.36c 3.48±0.14b

106
accumulated more free fatty acid (spot 6), while the seeds of the wild type contained
slightly more triglycerides (Figure 4.4B).
Figure 4.4. Total lipids content and thin layer chromatography (TLC).
Total lipid content was assayed from barley wild type (WT) and transgenic lines (TG)
using the gravimetric method (A). A volume of 10 µL from different lines was separated
on silica gel plate and visualized by iodine vapor (B). Spots are marked with number on
the left side of the gel. 1, Polar lipids; 2, Mono-glycerides; 3, 1,2 & 2,3 Di-glycerides; 4,
Sterols; 5, 1,3 Di-glycerides; 6, Free fatty acids; 7, Triglycerides; 8, Sterol esters.
4.4.3.6. Water soluble carbohydrate (WSC)
Water soluble carbohydrate composition of the mature grains of wild type and
transgenic lines were measured by High Performance Anion Exchange Chromatography
(HPAEC). Glucose and fructose were significantly higher in the transgenic lines than in
the wild type, while there was no significant difference in maltose content between the
107
two samples. The content of sucrose decreased significantly in the seeds of the transgenic
lines to wild type control. Oligosaccharides also showed significant differences, for
example, maltotetraose was lower in the transgenic lines than that found in the wild type
(Figure 4.5).
Figure 4.5. Quantification of water-soluble carbohydrates in barley grain.
Y-axis represents the contents in mg/g DW, while X-axis showed the assayed
components. The letters on standard error bars are based on the LSD. The mean values
which marked by the same letter are not statistically significant, while the mean values
which marked by different letters are significantly different at P < 0.05. Barley lines
assayed are; wild type (black bars), TG1 (Gray bars), TG2 (Brown bars), TG3 (Orange
bars).

108
4.4.4. Starch granule morphology
Starch granule morphology was examined by Scanning Electron Microscope (SEM) in
transgenic and wild type cross-sectioned grains (Figure 4.6). Variations in the size of
starch granules were detected between transgenic and wild type starch. Wild type starch
granules are smaller in size than those obtained from the transgenic lines. Granule sizes in
the starch of the transgenic lines were variable in size (Figure 4.6 C,D), while in the wild
type, starch granules were similar (Figure 4.6 A,B). There was no difference in the shapes
of starch granules observed between the two lines.
Figure 4.6. Starch granule morphology.
Barley grain cross-sections and purified starch of wild type (WT) and transgenic lines
(TG) were subjected to SEM. A, wild type grain cross section; B, wild type purified
starch; C, transgenic grain cross-section; D, transgenic purified starch. Starch granule
diameter is shown with straight lines across starch granules with values. Scale bars are
shown at the bottom of the images.

109
4.4.5. Grain yield parameters
Different grain yield related traits were assayed in the present study. Single grain
weight was significantly increased in transgenic lines as compared to wild type. As a
result of increasing the average single grain weight, a hundred grain weight significantly
increased in transgenic lines. Compared to wild type, the number of spikes per plant,
spike length and number of grains per spike decreased significantly in the transgenic
lines. Subsequently, total grain yield per plant also significantly lower by ~ 30% in the
transgenic lines as compared to the wild type control (Figure 4.7).
4.4.6. Expression of starch biosynthesis-related genes
Expression of starch biosynthesis related genes was analyzed by qRT-PCR in both
wild type and transgenic plants at 8 and 12 DAA. Our results showed that AGPase large
subunits genes (AGPL) were down-regulated in the transgenic lines as compared to the
wild type at both stages analyzed (Figure 4.8A, B). The AGPase small subunits genes
(AGPS) showed different expression pattern. AGPS1b and S2 were up-regulated in the
transgenic lines (Figure 4.8D, E), while AGPS1a gene showed no significant changes in
its expression between the wild type and transgenic samples (Figure 4.8C).
Granule-bound starch synthase genes (GBSS) expressed differently in the wild type
and transgenic plants (Figure 9). The expression of GBSS1a was significantly down-
regulated in the transgenic samples as compared to the wild type (Figure 4.9A). GBSS1b
was significantly up-regulated in the transgenic lines when compared to wild type
samples in both stages (Figure 4.9B).

110
Figure 4.7. Grain yield-related traits of barley wild type and transgenic lines.
The mean values of the tested traits are shown in columns with standard error bars. The
mean values which marked by asterisk star is statistically significant at P < 0.05. The Y-
axes represented the tested parameters, while the X-axes represented the barley lines. The
wild type (WT) was shown by black bars and transgenic lines (TG) by brown bars.
111
Soluble starch synthase genes (SS) showed variation in their expression patterns
(Figure 4.10). The transgenic line showed stable expression of SS1 in both time points,
but significantly higher at 8 DAA, while no significant difference was observed at 12
DAA. Interestingly, SS2a and SS2b were expressed differently in both stages as
compared to wild type. In the transgenic plant, the expression of SS2a was significantly
lower, while SS2b was significantly higher as compared to the wild type. In addition,
transcripts of SS3a in the transgenic line were hardly detected at both stages, while SS3b
showed no significant differences with the wild type at both stages. SS4 showed stable
expression at both stages, and showed lower expression at 8 DAA in the transgenic line
than the wild type, while the expression at 12 DAA remained at the same level (Figure
4.10).

112
Figure 4.8.. Expression analysis of ADP-glucose pyrophosphorylase genes.
Barley wild type expression is represented in the graphs by blue bars with standard error
bars, while expression of transgenic line is presented by red bars with standard error bars.
A, AGPL1; B, AGPL2; C, AGPS1a; D, AGPS1b, and E, AGPS2. The mean of the fold
change values which marked asterisk star is significant at P < 0.05.

113
Figure 4.9. Expression analysis of granule-bound starch synthase genes.
The mean values of the fold change are presented with standard error bars. Blue bars
represent wild type, while red bars represent transgenic lines. The mean values which
marked by asterisk star is statistically significant at P < 0.05. A, GBSS1a; B, GBSS1b.
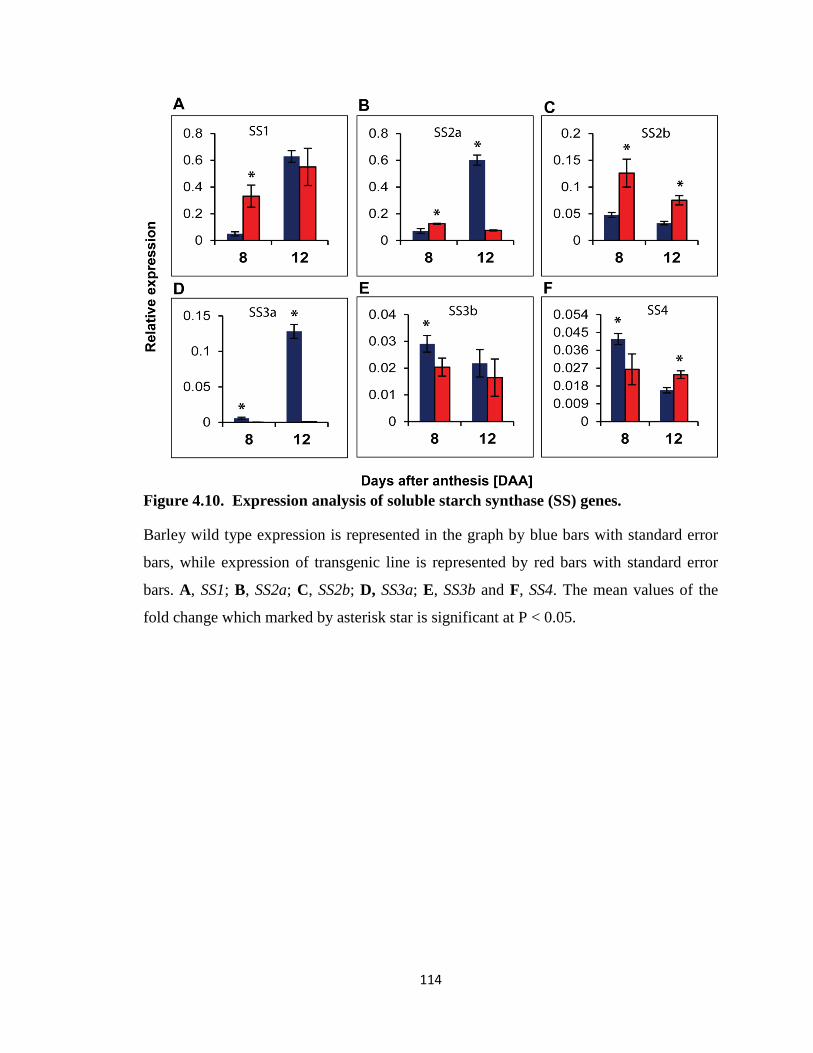
114
Figure 4.10. Expression analysis of soluble starch synthase (SS) genes.
Barley wild type expression is represented in the graph by blue bars with standard error
bars, while expression of transgenic line is represented by red bars with standard error
bars. A, SS1; B, SS2a; C, SS2b; D, SS3a; E, SS3b and F, SS4. The mean values of the
fold change which marked by asterisk star is significant at P < 0.05.
115
4.5. Discussion
The barley plastidial ADP-glucose transporter HvBT1 is encoded by a single gene
forming one polypeptide chain. This gives the gene an advantage for further
manipulation, such as plant transformation, in comparison to complex proteins that are
encoded by multi-genes such as ADP-glucose pyrophosphorylase (AGPase). Identifying
such key elements in the starch synthesis process as HvBT1, is essential for
understanding the rhythm of starch accumulation, and provides clues about possible ways
to improve the yield and quality of the starch for particular end uses.
Down-regulation of HvBT1 results in changes in the barley grain’s physical and yield
parameters. Changes in the grain size, represented by the alterations in the grain length
and area (Figure 4.2 A2,3) were observed in the transgenic lines, while the grain width
for both mature and immature grains remains similar to those of the wild type lines
(Figure 4.2 B1, 2 and 7). Cross-sectioned grains (Figure 4.2 B2 and 4) also provided
inside view of the changes of the endospermic portion in the grains, where showed the
well-filled plump of wild type grains and incomplete grains in the transgenic lines. The
level of water-soluble carbohydrates, especially glucose and fructose, was elevated in the
transgenic grains, while that of sucrose decreased (Figure 4.4). This alteration in grain
carbohydrates composition might explain the increase in grain size in the transgenic lines.
Metabolic sugars play an important role in expanding the endospermic cells during grain
filling, where sugar alcohol and monosaccharaides have a major effect on the osmotic
pressure in the cell (Wang and Stuutte, 1992; Boldingh et al. 2000). It has been shown
previously that a high hexose to sucrose ratio promotes cell division and expansion
through glucose signalling, while high sucrose to hexose ratio promotes differentiation

116
and storage (Wobus and Weber 1999). This might explain the negative effect of HvBT1
suppression on the number of grains per spike and overall yield. In addition, increasing
starch granule size might be a result of decreasing starch content in the transgenic lines
(Figure 4.5). Similar results were reported on Arabidopsis mutant lacking the activity of
starch synthase IV (SSIV) type that showed decrease numbers of starch granules per
plastid, and oppositely, increasing starch granule size (Roldán et al. 2007).
In contrast to that observed with grain size, the suppression of HvBT1 had a negative
effect on the number of spikes per plant, number of grains per spike and total grain yield
per plant (Figure 4.6), leading to a negative correlation between grain size and number of
grains per spike. Negative correlations between grain size and number of grains per ear
have been also shown in other cereals such as sorghum and maize (Kiniry 1988; Kiniry et
al. 1990). Alteration of the storage reserve in the grain of the transgenic lines is
associated with changes in grain weight. The level of lipids showed an increase in the
transgenic lines, and this may contribute to an increase the grain weight (Figure 4.3). As
the major amount of lipids is present in the embryo (Price and Parsons, 1979), the
increase of lipids in the transgenic grains might be due to an increase in embryo size
(Figure 4.2 B 5 and6). On the other hand, the endosperm is the major part of the cereal
grain, which contains mainly starch. Expressing the antisense of HvBT1 led to 17% lower
starch yield in the transgenic mature grains (Table 4.1). This could be a result of reducing
the activity of HvBT1, subsequently reduced loading of ADP-glucose to the amyloplasts.
HvBT1 has a crucial role in starch synthesis process as demonstrated by the reduction of
starch accumulation in the barley mutant RisØ13 which carried mutated HvBT1 (Patron

117
et al. 2004). This mutation is caused by a base substitution that led to substitution of GLU
for VAL. The majority of AGPase activity was reported as cytosolic in storage organs of
different cereal plants, including wheat, maize, rice and barley (Tetlow et al. 2003;
Hylton and Smith 1992; Denyer et al. 1996). As a result of this activity, the majority of
ADP-glucose is synthesized in the cytosol of the endosperm and must be transferred to
amyloplasts where starch is synthesized. Down-regulation of HvBT1 decreased loading
of ADP-glucose to amyloplasts. As a result of down-regulation of HvBT1, amylose
content decreased by approximately 5.3%, while amylopectin increased by 2% in
transgenic grains (Table 4.1). At a low level of loading ADP-glucose, the starch
biosynthesis process was negatively affected which appeared as low starch yield and
altered starch composition.
β- glucan, a soluble non-starch polysaccharide, is found in cereal grains such as oats
and barley (Talati et al. 2009). Endospermic cell walls contain 75% of total β- glucan
content in the grains of barley (Fincher and Stone 1986). Down-regulation of HvBT1
resulted in 37% lower in β-glucan content (Table 4.1), which normally represents 3-7%
of total grain dry weight (Aman and Graham, 1987; Bhatty et al. 1990). β-glucan content
is positively correlated to amylose content. Significant differences in β-glucan content
were observed in different barley genotypes that showed differences in their amylose
content. High β-glucan content was accompanied with high amylose content (Izydorczyk
et al. 2000). Similar results have been reported by Carciofi et al. (2012), where all SBE
genes in barley were suppressed and knockdown grains showed higher in β-glucan
118
content than the wild type control. Changes in β-glucan content might contribute to grain
weight.
The higher protein content (Table 4.1) of the transgenic grains indicates the effect of
HvBT1 suppression on starch level in the endospermic cells. This demonstrates a
negative correlation between starch and protein content which has been reported in other
cereals. For example, a study on two inbred lines of maize showed the association of high
protein content with low starch and high kernel weight (Seebauer et al. 2010). A mutation
in starch synthase 2a (SS2a) in barley decreased starch content, and consequently protein
content was increased (Clarke et al. 2008). In our study, the high protein content in the
transgenic lines was accompanied with low starch content that demonstrates the negative
correlation between starch and protein content in barley grains.
ADP-glucose transporter had pleotropic effects on starch synthesis-related genes.
Changes were observed in the expression patterns of these genes in the wild type and
transgenic lines. AGPLSU regulates the response to inducers (3-PGA) and inhibitors (Pi)
as regulatory subunits, while AGPSSUs are responsible for the enzymatic catalytic
activity (Tetlow et al. 2004; Ballicora et al. 2005; Geigenberger et al. 2005). Reduction of
the expression of AGPLs (Figure 4.7A and B) might indicate the decrease of AGP-
glucose synthesis. Increasing the expression of the plastidial AGPS1b and AGPS2 (Figure
4.7D and E) might compensate the reduction of ADP-glucose synthesis in the cytosol.
Previous studies reported that AGPS1a encodes for the cytosolic AGPSSU, while
AGPS1b and AGPS2 encode for the plastidial AGPSSU (Johnson et al. 2003;

119
Thorbjørnsen et al. 1996; Rösti et al. 2006). Enhancing the expression of both plastidial
AGPS1b and AGPS2 may be correlated to the reduction of cytosolic AGPase activity.
The cytosolic AGPase activity in cereal plants represents around 85-95% of the total
activity in the endosperm, while a small portion of the activity is plastidial (Tetlow et al.
2003).Then, increasing the expression levels of the plastidial AGPS1b and AGPS2 gave
an indication of increasing the activity of plastidial AGPase form, which is an alternative
way to synthesize ADP-glucose in the plastids.
Changes in the expression of GBSSs (Figure 4.8) provided an indication about
amylose synthesis and content in grains. Decreasing the expression of GBSS1a (hardly
detected) which mainly expressed in the endosperm at late stages of grain filling might
contribute to decrease the amylose content in the transgenic grains (Figure 4.8 A). Up-
regulation of GBSS1b (Figure 4.8 B), mainly expressed in the pericarp only at early
stages of grain filling (Radchuk et al. 2009), might compensate some loss of the GBSS1a
expression. Down-regulation of GBSS1a might contribute to the reduction in amylose
content in the transgenic lines and consequently on starch yield.
Decreasing the expression levels of SS2a and SS3a (Figure 4.9 B and D) in the
transgenic plant might contribute to the reduction in total starch content in the transgenic
lines by reducing long and very long chains of amylopectin, respectively. SS2a mutant in
barley accumulate less starch and high amylose, while amylopectin deceased by 20% of
wild type control (Morell et al. 2003; Clarke et al. 2008; Li et al. 2011). Down regulation
of SS2a led to decrease levels of longer glucan chains of DP 12-35 (Yamamori et al.

120
2000; Konik-Rose et al. 2007). SS3a mutants of barley and rice showed reduction in
amylopectin content by reducing the proportion of very long glucan chains and increased
amylose content (Fujita et al. 2007; Clarke et al. 2008).
4.6. Conclusion
In this research, we showed that down-regulation of barley plastidial ADP-glucose
transporter (HvBT1) has a significant negative impact on starch yield and composition.
This was observed by analysis of total starch and amylose content in different transgenic
lines compared to wild type. Also, down-regulation of HvBT1 has a negative impact on
β-glucan content, which may be correlated to a reduction in amylose content. A negative
correlation between starch and protein content was confirmed by 4-5 % increased protein
content in transgenic lines, which accumulated ~ 9% less starch. Increased lipid content
and water-soluble carbohydrates in the transgenic grains also gave an indication of
deficiency in the conversion of sugar metabolites during starch synthesis. We
investigated changes in the expression profile of starch biosynthesis genes, especially
those involved in amylose and amylopectin synthesis. Phenotypic data also revealed the
negative impact on spike characteristics and overall the grain yield.
121
CHAPTER 5: SUMMARY AND CONCLUSIONS
Barley is one of the oldest grain crops and globally stands after maize, wheat, rice, and
soybean in term of importance (Dahleen et al. 2007). In ancient times, barley was mainly
used as a human food source. After the domestication of wheat and rice, its use has
shifted to mainly feeding live-stocks, malting, and brewing (Newman and Newman,
2006), although barley products have much potential for human health. For example, β-
glucan reduces blood cholesterol and the glycemic index (Baik et al. 2008), and many
compounds found in barley grains work as antioxidants, i.e., tocopherols and tocotrienols,
which reduce serum LDL cholesterol (Qureshi et al. 1991).
We investigated the role of the plastidial ADP-glucose transporter in barley for its
impact on the starch biosynthesis process. The study started by characterization of the
ADP-glucose transporter HvBT1 using an E. coli expression system, and investigated its
expression profile and localization in barley grains. The second objective in our study
was to investigate the impact of HvBT1 expression on starch accumulation in two barley
cultivars; Harrington and Golden Promise, by evaluating the grain yield and composition,
along with the expression analysis of some starch biosynthesis-related genes. The third
objective was to investigate the impact of down-regulation of HvBT1 on starch
accumulation in Golden Promise using the antisense approach. Our findings are
summarized as follows:

122
We have successfully characterized the barley plastidial ADP-glucose transporter
(HvBT1) biochemically using an E. coli expression system, and we explored its
relationship to other brittle 1 (BT1) homologues from mono and dicotyledonous species.
Using molecular and biochemical techniques, we have shed some light on the functional
properties of barley plastidial ADP-glucose transporter (HvBT1). Phylogenetic analysis
of several BT1 homologues indicated that HvBT1 was assigned to the group which
representing BT homologues from monocotyledonous species. Some members of this
group, such as maize ZmBT1, mainly work as nucleotide sugar transporters. Gene
expression analysis indicated that HvBT1 is mainly expressed in endospermic cells
during grain filling. However, HvBT1expression was also slightly detected in the
autotrophic tissues. These results were supported by southern blot analysis, which
showed a single copy of HvBT1 homolog in the barley genome, providing evidence of a
possible alternative biochemical function of HvBT1 in autotrophic tissues. The cellular
and subcellular localization of HvBT1 provided evidence that this gene targets the
amyloplasts membranes of the endospermic cells. Barley HvBT1 was successfully
characterized biochemically using an E. coli system. HvBT1 was able to transport ADP-
glucose into E. coli cells with an affinity of 614.5 µM and in counter-exchange with
ADP, with an affinity of 334.7 µM. We also found AMP to be another candidate
exchange substrate. The negative effect of nonlabeled ADP-glucose and ADP on the
uptake rate of [α-32
P] ADP-glucose provided evidence for substrate specificity of HvBT1
for ADP-glucose and ADP.

123
The second objective of our research aimed to investigate the impact of the barley
plastidial ADP-glucose transporter HvBT1 on starch synthesis using gene expression
analysis of HvBT1 and other starch synthesis-related genes. To achieve this objective,
two barley cultivars, Harrington and Golden Promise, was used to have inside look into
the endosperm during grain filling through the expression of HvBT1 and some starch
biosynthesis-related genes in the cytosol and the amyloplasts of endospermic cells, and
eventually their impact on the grain composition. Higher expression of AGPase encoding
genes reflects on the AGPase activity, where AGPase activity was higher in Harrington.
AGPase activity reflects on ADP-glucose synthesis efficiency. The expression of HvBT1
in Harrington was almost 10 times higher than Golden Promise. The expression of starch
synthesis genes reflected on the grain composition analysis, where starch content in
Harrington was 2.5 % higher than Golden Promise with high amylopectin /amylose ratio.
The expression patterns of granule-bound starch synthases1a and 1b (GBSS1a & 1b)
followed the same trend, and showed higher expression in Harrington. Oppositely,
soluble starch synthases (SS) showed significantly higher expression in Golden Promise
than Harrington, except SS3b. Also, starch branching enzyme1 (SBE1) showed higher
expression in Golden Promise than Harrington. Protein, β-glucan and lipids were
significantly higher in Golden Promise, which accumulated less starch. This result is in
line with the negative correlation between starch content and other grain components. We
presumed that starch content in Harrington was higher as a result of the high expression
of HvBT1, which facilitates the loading of ADP-glucose into amyloplasts, where starch is
made, combined with the activity of AGPase.
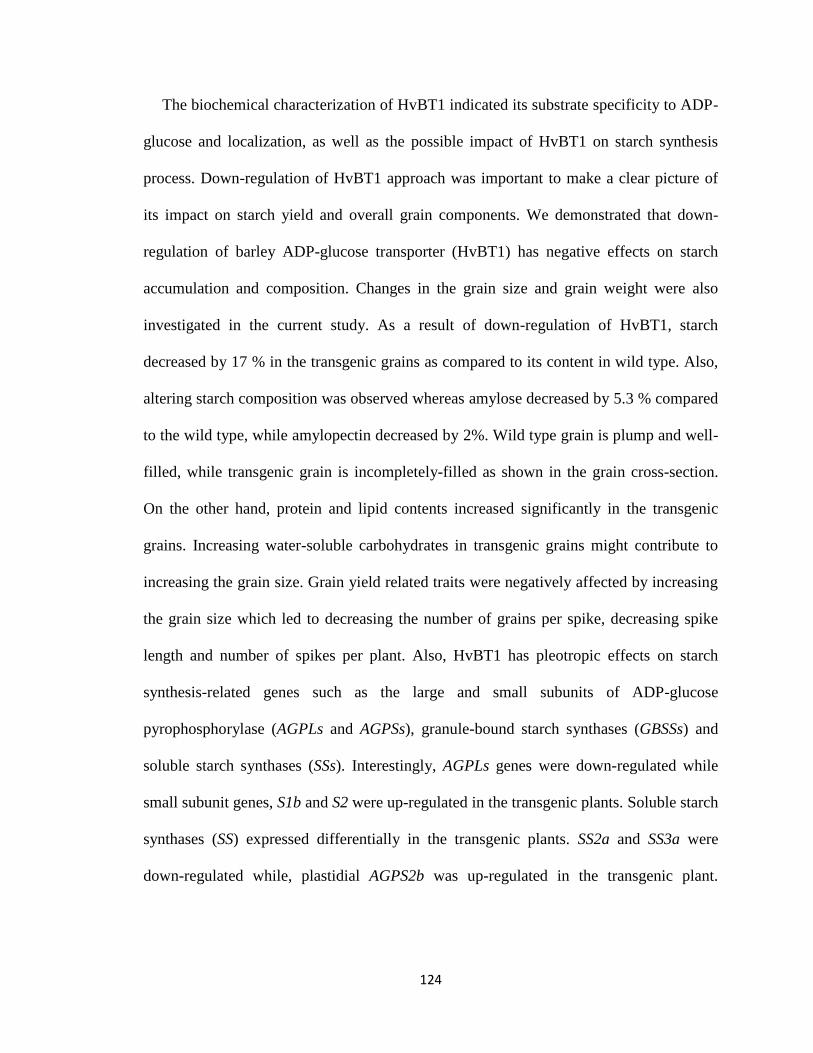
124
The biochemical characterization of HvBT1 indicated its substrate specificity to ADP-
glucose and localization, as well as the possible impact of HvBT1 on starch synthesis
process. Down-regulation of HvBT1 approach was important to make a clear picture of
its impact on starch yield and overall grain components. We demonstrated that down-
regulation of barley ADP-glucose transporter (HvBT1) has negative effects on starch
accumulation and composition. Changes in the grain size and grain weight were also
investigated in the current study. As a result of down-regulation of HvBT1, starch
decreased by 17 % in the transgenic grains as compared to its content in wild type. Also,
altering starch composition was observed whereas amylose decreased by 5.3 % compared
to the wild type, while amylopectin decreased by 2%. Wild type grain is plump and well-
filled, while transgenic grain is incompletely-filled as shown in the grain cross-section.
On the other hand, protein and lipid contents increased significantly in the transgenic
grains. Increasing water-soluble carbohydrates in transgenic grains might contribute to
increasing the grain size. Grain yield related traits were negatively affected by increasing
the grain size which led to decreasing the number of grains per spike, decreasing spike
length and number of spikes per plant. Also, HvBT1 has pleotropic effects on starch
synthesis-related genes such as the large and small subunits of ADP-glucose
pyrophosphorylase (AGPLs and AGPSs), granule-bound starch synthases (GBSSs) and
soluble starch synthases (SSs). Interestingly, AGPLs genes were down-regulated while
small subunit genes, S1b and S2 were up-regulated in the transgenic plants. Soluble starch
synthases (SS) expressed differentially in the transgenic plants. SS2a and SS3a were
down-regulated while, plastidial AGPS2b was up-regulated in the transgenic plant.

125
HvBT1 is a key factor in the starch biosynthesis process. It has negative effects on starch
accumulation and composition and other grain components.
In conclusion, the barley ADP-glucose transporter (HvBT1) has been successfully
characterized as plastidial antiporter capable to transport ADP-glucose in counter-
exchange with ADP with high affinities of 614.5 µM and 334.7 µM, respectively. AMP
can be another possible counter-exchange substrate for HvBT1, along with ADP. The
expression analysis and the cellular and subcellular localization of HvBT1 provided
further evidence that HvBT1 targets the amyloplasts of the endospermic cells. The
expression of HvBT1 has effects on starch accumulation in the cereal grains. The
expression of starch biosynthesis-related genes in barley cultivars, Harrington and Golden
Promise indicated the importance of the HvBT1 for starch accumulation process. The
higher expression of AGPase-encoded genes and its activity along with higher expression
of HvBT1 in Harrington provided an ideal combination for improving starch
accumulation. This combination might increase the efficiency of synthesizing and
transporting ADP-glucose from the cytosol into amyloplasts. Down-regulation of HvBT1
using antisense approach led to a decrease in starch accumulation in the transgenic lines
by 9 % and alters starch composition in grains of the transgenic lines. Also, down-
regulation of HvBT1 altered the accumulation of other grain components such as protein,
lipids and β-glucan. Also, down-regulation of HvBT1 had pleotropic effects on the starch
synthesis-related genes.

126
Future work
Over expressing of HvBT1 in barley might lead to significant increases in starch
yield and might alter starch composition.
The co-expressing of HvBT1 and AGPase (SH2) in cereal plants might enhance
starch accumulation, once they are the two key elements in the starch synthesis
process.

127
REFERENCES
Aastrup S (1979) Effect of rain on β-glucan content in barley grains. Carlsberg Res.
Comm. 44,381-393
Aastrup S, Munck L (1985) A β-glucan mutant in barley with thin cell walls. Pages
291-296 in: New Approaches to Research on Cereal Carbohydrates. R. D. Hill and L.
Munck, eds. Elsevier Science Publishers: Amsterdam.
Adel GJW, Springer F, Willmitzer L, Kossmann J (1996) Cloning and functional
analysis of a cDNA encoding a novel 139 kDa starch synthase from potato (Solanum
tuberosum L.). Plant J. 10, 981-991
Agarwal S, Loar S, Steber C, Zale J (2009) Floral transformation of wheat. Methods in
Molecular Biology, Transgenic wheat, barley and oats 478, 105- 113
Altschul SF, Madden TL, Schäffer AA, Zhang J, Zhang Z, Miller W, Lipman DJ
(1997) Gapped BLAST and PSI-BLAST: a new generation of protein database search
programs. Nucleic Acids Res. 25, 3389-3402
Akiyama Y (2009) Quality control of cytoplasmic membrane proteins in Escherichia
coli. J. Biochem. 146, 449–454
Aoki N, Hirose T, Scofield GN, Whitfeld PR, Furbank RT (2003) The Sucrose
Transporter Gene Family in Rice. Plant Cell Physiol 44, 223-232
Aman P, Graham H (1987) Analysis of total and insoluble mixed-linked (1-3) ( 1-4) β-
glucans in barley and malt. J. Agric. Food Chem. 35, 704-709
Badr A, Müller K, Schäfer-Pregl R, El Rabey H, Effgen S, Ibrahim H, Pozzi C,
Rohde W, Salamini F (2000) On the origin and domestication history of barley
(Hordeum vulgare L.). Mol. Biol. Evol. 17, 499-510.
128
Bae JM, Giroux M, Hannah L (1990) Cloning and characterization of the Brittle-2 gene
of maize. Maydica 35, 317–322
Bahaji A, Ovecka M, Barany I, Risueno MC, Munoz FJ, Baroja-Fernandez E,
Montero M, Li J, Hidalgo M, Sesma MT, Ezquer I, Testillano PS, Pozueta-Romero
J (2011) Dual targeting to mitochondria and plastids of AtBT1 and ZmBT1, two members
of the mitochondrial carrier family. Plant Cell Physiol. 52, 97-609
Baik Y K, Ullrich SE (2008) Barley for food: Characteristics, improvement, and
renewed interest. J. Cereal Sci. 48, 233–242
Ballicora MA, Dubay JR, Devillers CH, Preiss J (2005) Resurrecting the ancestral
enzymatic role of a modulatory subunit. J. Biol. Chem. 280, 10189-10195.
Ballicora MA, Laughlin MJ, Fu Y, Okita TW, Barry GF, Preiss J (1995) Adenosine
5-diphosphate-glucose pyrophosphorylase from potato tuber. (Significance of the N
terminus of the small subunit for catalytic properties and heat stability). Plant Physiol.
109, 245–251.
Barkat A, Carels N, Bernardi G (1997) The distribution of genes in the genome of
Gramineae. Proc. Natl. Acad. Sci. U.S.A. 94, 6857–6861.
Baroja-Ferna´ndez E, Munóz FJ, Zandueta-Criado A,Mora´n-Zorzano MT, Viale
AM, Alonso-Casaju´s N, Pozueta-Romero J (2004) Most of ADP-glucose linked to
starch biosynthesis occurs outside the chloroplast in source leaves. Proc. Natl. Acad. Sci.
U.S.A 101, 13080–13085.
Beatty MK, Rahman A, Cao H, Woodman W, Lee M, Myers AM, James MG (1999)
Purification and molecular genetic characterization of ZPU1, a pullulanase-type starch-
debranching enzyme from maize Plant Physiol. 119, 255–266

129
Beckles DM, Smith AM, Rees T (2001) A cytosolic ADP-glucose pyrophosphorylase is
a feature of graminaceous endosperms, but not of other starch storing organs. Plant
Physiol. 125, 818–827.
Bednarek J, Boulaflous A, Girousse C, Ravel C, Tassy C, Barret P, Bouzidi MF,
Mouzeyar S ( 2012) Down-regulation of the TaGW2 gene by RNA interference results
in decreased grain size and weight in wheat. J. Exp. Bot. 63, 5945-5955
Bhatty RS, MacGrwgor AW, Rossnagel BG (1990) Total and acid soluble β-glucan
content of hulless barley and its relationship to acid-extract viscosity. Cereal Chem. 68,
221-227
Belmonte M, Donald G, Reid D, Yeung E, Stasolla C (2006) Alternations of the
glutathione redox state improves apical meristem structure and somatic embryo quality
on white spruce (Picea glauca). J. Exp. Bot. 56, 23-55
Bernstein AM, Titgemeier B, Kirkpatrick K, Golubic M, RoizenMF (2013) Major
Cereal Grain Fibers and Psyllium in Relation to Cardiovascular Health. Nutrients 5,
1471-1487
Bernaudat F, Frelet-Barrand A, Pochon N, Dementin S, Hivin P, Boutigny S, rioux
J, Salvi D, Seigneurin-Berny D, Richaud P, Joyard j, Pignol D, Sabaty M, Desnos T,
Pebay-Peyroula E, Darrouzet E, Vernet T, Rolland N (2011) Heterologous Expression
of Membrane Proteins: Choosing the Appropriate Host. PLoS ONE 6, 1-17
Binns AN, Thomashow MF (1988) Cell biology of Agrobacterium infection and
transformation of plants. Ann. Rev. Microbiol. 42, 575-606.
130
Boldingh H, Smith GS, Klages K (2000) Seasonal concentrations of non-structural
carbohydrates of five Actinidia species in fruit, leaf and fine root tissue. Annals of Botany
85, 469-476
Bowsher CG, Scrase-Field EFAL, Esposito S, Emes MJ, Tetlow IJ (2007)
Characterization of ADP-glucose transport across the cereal endosperm amyloplast
envelope. J. Exp. Bot. 58, 1321–1332
Boyko A, Matsouka A, Kovalchuk I. (2009) High frequency Agrobacterium
tumefaciens-mediated plant transformation induced by ammonium nitrate. Plant Cell
Rep. 28, 737-757
Braun DM, Slewinski TL (2009) Genetic control of carbon partitioning in grasses:
Roles of Sucrose Transporters and Tiedyed loci in phloem loading. Plant Physiol. 149,
71–81
Brettschneider R, Becker D, Lorz H (1997) Efficient Transformation of Scutellar
Tissue of Maize Embryos, Theor. Appl. Genet. 94, 737–748
Brencic A, Winans S (2005) Detection and response to signals involved in host-microbe
interactions by plant-associated bacteria. Microbiol. Mol. Biol. Rev. 69, 155–94
Brown W, Ralston A, Shaw K (2008) Positive transcription control: The glucose
effect. Nature Education 1(1)
Buléon A, Colonna P, Planchot V, Ball S (1998) Starch granules: structure and
biosynthesis. Int. J. Biol. Macromol. 23, 85–112
Burton RA, Jenner H, Carrangis L, Fahy B, Fincher GB, Hylton C, Laurie DA,
Parker M, Waite D, van Wegen S, Verhoeven T, Denyer K (2002) Starch granule

131
initiation and growth are altered in barley mutants that lack isoamylase activity. Plant J.
31, 97–112
Cao H, Sullivan TD, Boyer CD, Shannon JC (1995) BT1, a structural gene of the
major 39–44 kDa amyloplast membrane polypeptides. Physiol. Plant. 95, 176–186
Cao H, Shannon JC (1996) BT1, a protein critical for in vivo starch accumulation in
maize endosperm, is not detected in maize endosperm suspension cultures. Physiol.
Plant. 97, 665–673
Cao H, Impari-Radosevich J, Guan H (1999) Identification of soluble starch synthase
activities of maize endosperm. Plant Physiol. 120, 205-215
Canton F, Suarez M, Jose-Estanyol M, Canovas F (1999) Expression analysis of
cytosolic glutamine synthase gene in cotyledons of Scots pine seedlings: developmental,
light regulation and septial distribution of specific transcripts. Plant Mol. Biol. 40, 623-
634
Carciofi M, Blennow A, Jensen SL, Shaik SS, Henriksen A, Bulèon A, Holm PB,
Hebelstrup KH (2012) Concerted suppression of all starch branching enzymes genes in
barley produces amylose-only starch granules. BMC Plant Biol. 12: 1-16
Cho M-J, Jiang W, Lemaux PG (1998) Transformation of recalcitrant barley cultivars
through improvement of regenerability and decreased albinism. Plant Sci.138, 229-244
Chen D, Texada DE (2006) Low-usage codons and rare codons of Escherichia coli.
Gene Therapy and Molecular Biology 10, 1-12
Cheng M, Lowe BA, Spencer TM, Ye X, Armstrong CL (2004) Factors influencing
Agrobacterium-mediated transformation of monocotyledonous species. In Vitro Cell.
Dev. Biol. Plant 40, 31–45

132
Clarke BR, Denyer K, Jenner CF, Smith AM (1999) The relationship between the rate
of starch synthesis, the sdenosine 5’-diphosphoglucose concentration and the amylose
contentof the starch in developing pea embryos. Planta 209, 324-329
Clarke B, Liang R, Morell MK, Bird AR, Jenkins CLD, Li Z (2008) Gene expression
in a starch synthase IIa mutant of barley: changes in the level of gene transcription and
grain composition. Funct. Integr. Genomics 8, 211–221
Comparot-Moss S, Denyer K (2009) The evolution of the starch biosynthetic pathway
in cereals and other grasses. J. Exp. Bot. 60, 2481-92
Commuri PD, Keeling PL (2001) Chain-length specificities of maize starch synthase I
enzyme: studies of glucan affinity and catalytic properties. Plant J. 25, 475- 486
Curá JA, Jansson P-E, Krisman CR (1995) Amylose is not strictly linear.
Starch/Staerke 47:207-209
Dahleen LS, Manoharan M (2007) Recent advances in barley transformation. In Vitro
Cel. Dev. Biol. – Plants 43, 493-506
Danilova SA (2007) The technologies for genetic transformation of cereals. Russian
Journal of Plant Physiol. 54, 569-581
Delvallé D, Dumez S, Wattebleb F, Roldán I, Planchot V, Berbezy P, Colonna P,
Vyas D, Chatterjee M, Ball S, Mérida A, D'Hulst C (2005). Soluble starch synthase I:
A major determinant of the synthesis of amylopectin in Arabidopsis thaliana leaves.
Plant J. 43, 398 – 412
Denyer K, Clarke B, Hylton C, Tatge H, Smith AM (1996) The elongation of amylase
and amylopectin chains in isolated granules. Plant J. 10, 1135-1143

133
Denyer K, Dunlap F, Thorbjørnsen T, Keeling P, Smith AM (1996) The major form
of ADP-glucose pyrophosphorylase in maize endosperm is extraplastidial. Plant Physiol.
112, 779–783
Denyer K, Waite D, Motawia S, Moller B-L, Smith AM (1999a) Granule-bound starch
synthase I in isolated starch granules elongates malto-oligosaccharides processively.
Biochem. J. 340, 183−191
Denyer K, Waite D, Edwards A, Martin C, Smith AM (1999b) Interaction with
amylopectin influences the ability of granule-bound starch synthase I to elongate malto-
oligosaccharides. Biochem. J. 342, 647−653
Denyer K, Johnson P, Zeeman SC, Smith AM (2001) The control of amylose
synthesis. J. Plant Physiol. 158,479–87
Dian W, Jiang H, Wu P (2005) Evolution and expression analysis of starch synthase III
and IV in rice. J. Exp. Bot. 56, 623-632
Dinges R, Colleoni C, James MG, Myers AM (2003) Mutational analysis of the
pullulanase-type debranching enzyme of maize indicates multiple functions in starch
metabolism. Plant Cell 15, 666–680
Emes MJ, Neuhaus HE (1997). Metabolism and transport in non-photosynthetic
plastids. J. Exp. Bot. 48, 1995-2005
Emes MJ, Tetlow IJ, Bowsher CG (2001) Transport of metabolites into amyloplastids
during starch synthesis. In: Barsby TL, Donald AM, Frazier PJ, eds. Starch advances in
structure and function. Royal Society of Chemistry 138-143

134
Emes MJ, Borwsher CG, Hedley C, Burrell MM, Scrase-Field ESF, Tetlow IJ
(2003). Starch synthesis and carbon partitioning in developing endosperm. J. Exp. Bot.
54, 569-575
Fincher GB, Stone BA (1986) Cell walls and their components in cereal grain
technology. Pages 207-295 in: Advances in Cereal Science and Technology. Y.
Pomeranz, ed. AACC International: St. Paul, MN
Fulton DC, Edwards A, Pilling E, Robinson HL, Fahy B et al. (2002) Role of granule-
bound starch synthase in determination of amylopectin structure and starch granule
morphology in potato. J. Biol. Chem. 277, 10834–10841
Fullner KJ, Nester EW (1996) Temperature Affects the T-DNA Transfer Machinery of
Agrobacterium tumefaciens. J. Bacteriol. 178, 1498–1504
Fujita N, Hasegawa H, Taira T (2001) The isolation and characterization of a waxy
mutant of diploid wheat (Triticum monococcum L.). Plant Sci. 160, 595 – 602
Fujita N, Kubo A, Suh DS, Wong KS, Jane JL, Ozawa K, Takaiwa F, Inaba Y,
Nakamura Y (2003) Antisense inhibition of isoamylase alters the structure of
amylopectin and the physicochemical properties of starch in rice endosperm. Plant Cell
Physiol. 44,607–618
Fujita N, Yoshida M, Asakura N, Ohdan T, Miyao A, Hirochika H, Nakamura Y
(2006) Function and characterization of starch synthase I using mutants in rice. Plant
Physiol. 140, 1070 – 1084
Fujita N, Yoshida M, Kondo T, Saito K, Utsumi Y, Tokunaga T, Nishi A, Satoh H,
Park JH, Jane JL, Miyao A, Hirochika H, Nakamura Y (2007). Characterization of
135
SSIIIa-deficient mutants of rice: the function of SSIIIa and pleiotropic effects by SSIIIa
deficiency in the rice endosperm. Plant Physiol. 144, 2009-2023
Fujita N, Toyosawa Y, Utsumi Y, Higuchi T, Hanashiro I, Ikegami A, Akuzawa S,
Yoshida M, Mori A, Inomata K, Itoh R, Miyao A, Hirochika H, Satoh H, Nakamura
Y (2009) Characterization of pullulanase (PUL)-deficient mutants of rice (Oryza sativa
L.) and the function of PUL on starch biosynthesis in the developing rice endosperm. J.
Exp. Bot. 60,1009–1023
Furbank RT, Scofield GN, Hirose T, Wang X-D, Patrick JW, Offler CE (2001)
Cellular localisation and function of a sucrose transporter OsSUT1 in developing rice
grains. Aust. J. Plant Physiol. 28, 1187–1196
Gao M, Wanat J, Stinard PS, James MG, Myers AM (1998) Characterization of dull1,
a maize gene coding for a novel starch synthase. Plant Cell 10, 399 - 412
Gelvin S (2003) Agrobacterium-mediated plant transformation: The biology behind the ‘
Gene-Jockeying’ tool. Microbiol. Mol. Biol. Rev. 67, 16-37
Geigenberger P, Kolbe A, Tiessen A (2005) Redox regulation of carbon storage and
partitioning in response to light and sugars. J. Exp. Bot. 56, 1469-1479
Geirger DR, Servaites JC, Fuchs MA (2000) Role of starch in carbon translocation and
partitioning at the plant level. Aust. J. Plant Physiol. 27, 571-582
Ghosh HP, Preiss J (1966) Adenosine diphosphate glucose pyrophosphorylase: a
regulatory enzyme in biosynthesis of starch in spinach leaf chloroplasts. J. Biol. Chem.
241, 4491–4504
Giroux MJ, Hannah LC (1994) ADP- glucose pyrophosphorylase in shrunken-2 and
brittle-2 mutants of maize. Mol. Gen. Genet. 243, 400-408
136
Gross P, ap Rees T. (1986) Alkaline inorganic pyrophosphatase and starch synthesis in
amyloplasts. Planta 167, 140–145
Guan HP, Preiss J (1993) Differentiation of the properties of the branching isozymes
from maize (Zea mays L.). Plant Physiol. 102, 12691273
Guan HP, Keeling PL (1998) Starch biosynthesis: understanding the functions and
interactions of multiple isozymes of starch synthase and branching enzyme. Trends
Glycosci. Glycotechnol. 10, 307 - 319
Gürel F, Gözükirmizi N (2000) Optimization of gene transfer into barley (Hordeum
vulage L) marure embryos by tissue electroporation. Plant Cell Rep. 19, 787-791
Hanashiro I, Itoh K, Kuratomi Y, Yamazaki M, Igarashi T, Matsugasako J, Takeda
Y (2008) Granule-bound starch synthase I is responsible for biosynthesis of extra-long
unit chains of amylopectin in rice. Plant Cell Physiol. 49, 925-933
Harlan JR (1978) On the origin of barley. Pages 10-36 in: Barley: Origin, Botany
Culture, Winter Hardiness, Genetics, Utilization, Pests. Agriculture Handbook 338. US.
Department of Agriculture, Washington, DC.
Harn C, Knight M, Ramakrishan A, Guan HP, Keeling PL,Wasserman BP (1998)
isolation and characterization of the SS2 starch synthase cDNA clones from maize
endosperm. Plant Mol. Biol. 37, 629-637
Harwood WA, Bartlett J, Alves S, Perry M, Smedley M, Leyland N, Snape JW
(2009) Barley transformation using Agrobacterium-mediated techniques. In: Huw D
Jones and Peter R Shewry (eds), Methods in Molecular Biology, Transgenic Wheat,
Barley and Oats, Vol 478, Chapter 9, pp137-147
137
Hayashimoto A, Li Z, Murai N (1990) A polyethylene glycol-mediated protoplast
transformation system for production of fertile transgenic rice plants. Plant Physiol. 93,
857-863
He GY, Lazzeri PA (1998) Analysis and optimization of DNA delivery into wheat
scutellum and tritordeum inflorescence explants by tissue electroporation. Plant Cell Rep.
18, 64–70
Hirose T, Terao T (2004) A comprehensive expression analysis of the starch synthase
gene family in rice (Oryza sativa L.). Planta 220, 9–16
Hogg AC, Gause K, Hofer P, Martin JM, Graybosch Robert A, Hansen LE, Giroux
MJ (2013) Creation of a high-amylose durum wheat through mutagenesis of starch
synthase II (SSIIa). J. Cereal Sci. 57, 377-383
Hood LF (1982) Current concepts of starch structure. Pages 218-224 in: Food
Carbohydrates. D. R. Lineback and G. E. Inglett, Eds. AVI, Westport, CT.
Imparl-Radosevich JM, Gameon JR, Mckean A, Wetterberg D, Keeling P L , Guan H.
(2003) Understanding catalytic properties and functions of maize starch synthase
isozymes. J. Appl. Glycoscience 50, 117-182
Ishimaru K, Hirose T, Aoki N, Takahashi S, Ono K, Yamamoto S, Wu J, Saji S,
Baba T, Ugaki M, Matsumoto T, Ohsugi R (2001) Antisense expression of a rice
sucrose transporter OsSUT1 in rice (Oryza sativa L.). Plant Cell Physiol. 42, 1181–1185
Izydorczyk MS, Storsley J, Labossiere D, MacGregor AW, Rossnagel BG (2000)
Variation in total and soluble β-glucan content in hulless barley: Effects of thermal,
physical, and enzymatic treatments. J. Agric. Food Chem. 48, 982–989

138
James MG, Robertson DS, Myers AM (1995) Characterization of the maize gene
sugary1, a determinant of starch composition in kernels. Plant Cell 7, 417–429
James MG, Denyer K, Myers AM (2003) Starch synthesis in the cereal endosperm.
Curr. Op Plant Biol. 6, 215–222
Jarchow E, Grimsley NH, Hohn B (1991) virF, the host-range determining virulence
gene of Agrobacterium tumefaciens, affects T-DNA transfer to Zea mays. Proc. Natl.
Acad. Sci. USA 88, 10426–10430
Jacobsen, S, Søndergaard I, Møller B, Desler T, Munck L (2005) A chemometric
evaluation of the underlying physical and chemical patterns that support near infrared
spectroscopy of barley seeds as a tool for explorative classification of endosperm genes
and gene combinations. J. Cereal Sci. 42,281-299
Jespersen HM, MacGregor AE, Henrissat B, Sierks MR, Svensson B (1993) Starch-
and glycogen-debranching and branching enzymes: prediction of structural features of the
catalytic (P/u)a-barrel domain and evolutionary relationship to other amylolytic enzymes.
J. Protein Cherm. 12, 791-805
Jeon JS, Ryoo N, Hahn T, Walia H, Nakamura Y (2010) Starch biosynthesis in cereal
endosperm. Plant Physiol. Biochem. 48, 383-392
Johnson PE, Patron NJ, Bottrill AR, Dinges JR, Fahy BF, Parker ML, Waite DN,
Denyer K (2003)A low-starch barley mutant, Riso16, lacks the cytosolic small subunit
of ADP-glucose pyrophosphorylase, reveals the importance of the cytosolic isoform and
the identity of the plastidial small subunit. Plant Physiol. 131, 684–696
Kalra S, Joad S (2000) Effect of dietary barley β- glucan on cholesterol and lipoprotein
fractions in rates. J. Cereal Sci. 31: 141-145

139
Kammerer B, Fisher K, Hilpert B, Schuber S, Gutensohn M, Weber A, Flügge U-I
(1998) Molecular characterization of a carbon transporter in plastids from heterotrophic
tissues: the glucose 6-phosphate antiporter. Plant Cell 10, 105-117
Kampfenkel K, Mohlmann T, Batz O, van Montagu M, Inze D, Neuhaus HE (1995)
Molecular characterization of an Arabidopsis thahana cDNA encoding for a novel
putative adenylate transporter of higher plants. FEBS Letters 374, 351-5
Kates M (1972) Techniques of lipiology isolation. Analysis and identification of lipids.
North Holland Publishing Co. Amesterdam, London
Kiniry JR (1988) Kernel weight increase in response to decreased kernel number in
sorghum. Agron. J. 80, 221-226
Kiniry JR, Wood CA, Spanel DA, Bockholt AJ (1990) Seed weight response to
decreased seed number in maize. Agron. J. 82, 98-102
Kirchberger S, Leroch M, Huynen MA, Wahl M, Neuhaus HE, Tjaden J (2007)
Molecular and biochemical analysis of the plastidic ADP-glucose transporter (ZmBT1)
from Zea mays. J. Biol. Chem. 282, 22481–22491
Kirchberger S, Tjaden J, Neuhaus HE (2008) Characterization of the Arabidopsis
Brittle1 transport protein and impact of reduced activity on plant metabolism. Plant J.
56, 51–63
Kloti A, Iglesias VA, Wunn J, Burkhardt PK, Datta SK, Potrykus I (1993) Gene
transfer by electroporation into intact scutellum cells of wheat embryos. Plant Cell Rep.
12, 671-675
140
Konik-Rose C, Thistleton J, Chanvrier H, et al. (2007) Effects of starch synthase IIa
gene dosage on grain, protein and starch in endosperm of wheat. Theor. Appl. Genet. 115,
1053–1065
Kubo A, Rahman S, Utsumi Y, Li Z, Mukai Y, Yamamoto M, Ugaki M, Harada K,
Satoh H, Konik-Rose C, Morell M, Nakamura Y (2005) Complementation of sugary-1
phenotype in rice endosperm with the wheat isoamylase1 gene supports a direct role for
isoamylase1 in amylopectin biosynthesis. Plant Physiol. 137, 43–56
Kühn C (2010) Sucrose transporters and plant development. In: Signalling and
Communication in Plants: Transporters and pumps in plant signalling. Eds. K. Venema,
Springer Verlag, Heidelberg, pp. 225-251
Laemmli UK, Molber E, Showe M, Kelenberger E (1970) Form-determining function
of genes required for the assembly of the head of bacteriophage T4. J. Mol. Biol.49, 99-
113
Lamari L (2008) ASSESS 2.0: Image Analysis Software for Plant Disease
Quantification. St Paul, MN: Amer Phytopathological Society
Lazzeri PA, Brettschneider R, Luhrs R, Lorz H (1991) Stable transformation of
barley via PEG-induced direct DNA uptake into protoplasts. Theor. Appl. Genet. 81,
437–444
Leedell PJ, Zhany G, Cass DD (1997) Transient GFP expression in sperm cells and
zygotes of Zea mays L. Plant Physiol. 114, 297–298
Léon J, Silz S, Harloff HJ (2000) β-glucan content during grain filling in spring barley
and its wild progenitor H. vulgare ssp. spontaneum. J. Agron. Crop Sci. 185: 1-8
141
Leroch M, Kirchberger S, Haferkamp I, Wahl M, Neuhaus HE, Tjaden J (2005)
Identification and characterization of a novel plastidic adenine nucleotide uniporter from
Solanum tuberosum. J. Biol. Chem. 280, 17992–18000
Li Z, Mouille G, Kosar-Hashemi B, Rahman S, Clarke B, Gale KR, Appels R,
Morell MK (2000) The structure and expression of the wheat starch synthase III gene.
Motifs in the expressed gene define the lineage of the starch synthase III gene family.
Plant Physiol. 123, 613 – 624
Li Z, Li D, Du X, Wang H, Larroque O, LenkinsCLD, Jobling SA, Morell MK
(2011) The barley amo1 locus is tightly linked to the starch synthase IIIa gene and
negatively regulates expression of granule-bound starch synthetic genes. J. Exp. Bot. 62,
5217–5231
Linka N, Hurka H, Lang BF, Burger G, Winkler HH, Stamme C, Urbany C, Seil I,
Kusch J, Neuhaus HE (2003) Phylogenetic relationship of non-mitochondrial nucleotide
transport proteins in bacteria and eukaryotes. Gene 306, 27–35
Lioyd JR, Landschütze V, Kossmann J (1999) Simultaneous antisense inhibition of
two starch synthase isoforms in potato tubers leads to accumulation of grossly modified
amylopectin. Biochem. J. 338, 515-521
Lorz H, Lazzeri PA (1992) In vitro regeneration and genetic transformation of barley.
Barley Genet VI II 807-815
Livak, KJ, Schmittgen TD. (2001) Analysis of relative gene expression data using real-
time quantitative PCR and the 2^-∆∆C
T method. Methods 25, 402–408
Mangold HK, Malins DC (1960) Fractionation of fats, oils and waxes on thin-layer of
silica acid. J. Am. Oil Chem. Soc. 37, 383-387
142
Mangold HK (1961) Thin-layer chromatography of lipids. J. Am. Oil Chem. Soc. 38,
708-727
Martin T, Ludewig F (2007) Transporters in starch synthesis. Funct. Plant Biol. 34,
474-479
Matthews PR, Wang MB, Waterhouse PM, Thornton S, Fieg SJ, Gubler F,
Jacobsen JV (2001) Marker gene elimination from transgenic barley using co-
transformation with adjacent ‘twin T-DNAs’ on standard Agrobacterium transformation
vector. Mol. Breed. 7, 195–202
Messens E, Dekeyser R, Stachel SE (1990) A non-transformable Triticum monococcum
monocotyledonous culture produces the potent Agrobacterium vir-inducing compound
ethyl ferulate. PNAS 87, 4368-4372
Miller M, Tagliani L, Wang N, Berka B, Bidney D, Zhao ZY (2002) High efficiency
transgene segregation in co-transformed maize plants using an Agrobacterium
tumefaciens 2 T-DNA binary system. Transgenic Res. 11, 381–396
Millar AH, Heazlewood JL (2003) Genomic and proteomic analysis of mitochondrial
carrier proteins in Arabidopsis. Plant Physiol. 131, 443–453
Möhlmann T, Tjaden J, Henrichs G, Quick WP, Ha¨usler R, Neuhaus HE (1997)
ADP-glucose drives starch synthesis in isolated maize endosperm amyloplasts:
characterisation of starch synthesis and transport properties across the amyloplast
envelope. Biochem. J. 324, 503–509
Morell MK, Blennow A, Kosar-Hashemi B, Samuel MS (1997) Differential expression
and properties of starch branching enzyme isoforms in developing wheat endosperm.
Plant Physiol. 113, 201–208

143
Morell MK, Kosar-Hashemi B, Cmiel M, Samuel MS, Chandler P, Rahman S,
Buleon A, Batey IL, Li ZY (2003) Barley sex6 mutants lack starch synthase IIa activity
and contain a starch with novel properties. Plant J. 34, 172-184
Morell MK, Myers A (2005) Towards the rational design of cereal starches. Curr. Opin.
Plant Biol. 8, 204- 210
Morrison W R (1978) Wheat lipid composition. Cereal Chem. 55, 548- 558
Morrison W R (1993) Cereal starch granule development and composition. Pages 179-
209 in: Proceedings of the Phytochemical Society of Europe. P.R. Shewry and K. Stobart,
eds. Clarendon Press: Oxford
Munck L, Møller B, Jacobsen S, Søndergaard I (2004) Near infrared spectra
indicate specific mutant endosperm genes and reveal a new mechanism for substituting
starch with (1-3,1-4) beta glucan in barley. J. Cereal Sci. 40, 213–222
Murray AA, Thompson WF (1980) Rapid isolation of high molecular weight plant
DNA. Nuc. Acid Res. 8, 4321-4325
Nakamura Y, Sakurai A, Inaba Y, Kimura K, Iwasawa N, Nagamine T (2002) The
fine structure of amylopectin in endosperm from Asian cultivated rice can be largely
classified into two classes. Starch 54, 117–131
Nakamura Y, Umemoto T, Ogata N, Kuboki Y, Yano M, Sasaki T (1996) Starch
debranching enzyme (R-enzyme or pullulanase) from developing rice endosperm:
purification, cDNA and chromosomal localization of the gene. Planta 199, 209–218
Nagamori S et al. (2004) Role of YidC in folding of polytopic membrane proteins. J.
Cell Biol. 165, 53–62
144
Narayanan A, Ridilla M, Yernool DA (2001) Restrained expression, a method to
overproduce toxic membrane proteins by exploiting operator–repressor interactions.
Protein Sci. 20, 51-61
Neuhaus EH, Wagner R (2000) Solute pores, ion channels, and metabolite transporters
in the outer and inner envelope membranes of higher plant plastids. Biochim. Biophys.
Acta 1465, 307–323
Newman CW, Newman RK (2006) A brief history of barley foods. Cereal Foods
World 51, 4–7
Nobre J, Davey MR, Lazzeri PA, Cannell ME (2000) Transformation of barley
scutellum protoplasts: regeneration of fertile transgenic plants. Plant Cell Rep. 19, 1000–
1005
Ohdan T, Francisco PB Jr, Sawada T, Hirose T, Terao T, Satoh H, Nakamura Y
(2005) Expression profiling of genes involved in starch synthesis in sink and source
organs of rice. J. Exp. Bot. 56, 3229 - 3244
Orzaez D, Mirabel S, Wieland WH, Granell A (2006) Agroinjection of tomato fruits:
A tool for rapid functional analysis of transgenes directly in fruit. Plant Physiol. 140, 3-
11
Otten L, DeGreve H, Leemans J, Hain R, Hooykaas P, Schell J (1984) Restoration of
virulence of vir region mutants of Agrobacterium tumefaciens strain B6S3 by coinfection
with normal and mutant Agrobacterium strains. Mol. Gen. Genet. 195, 159–163
Patron NJ, Smith AM, Fahy BF, Hylton CM, Naldrett MJ, Rossnagel BG, Denyer K
(2002) The altered pattern of amylose accumulation in the endosperm of low-amylose

145
barley cultivars is attributable to a single mutant allele of granule-bound starch synthase I
with a deletion in the 5’-non-coding region. Plant Physiol. 130, 190 – 198
Patron NJ, Greber B, Fahy BF, Laurie DA, Parker ML, Denyer K (2004) The lys5
mutations of barley reveal thenature and importance of plastidial ADP-glucose
transporters for starch synthesis in cereal endosperm. Plant Physiol. 135, 2088–2097
Pein FM, Shannon JC (1996) Plant Physiology 111 (suppl.) S100
Peng M, Hucl P, Chibbar RN (2001) Isolation, characterization and expression analysis
of starch synthase I from wheat (Triticum aestivum L.). Plant Sci. 161, 1055-1062
Phillips KM, Tarrangó -Trani MT, Grove TM, Grün I, Lugogo R, Harris RF,
Stewart KK (1997) Simplified gravimetric determination of total fat in food composites
after chloroform-methanol extyraction. JAOCS 74, 1-6
Picault N, Hodges M, Palmieri L, Palmieri F (2004) The growing family of
mitochondrial carriers in Arabidopsis. Trends Plant Sci. 9, 138–146
Prasanna GL, Panda T (1997) Electroporation basic principles, practical considerations,
applications in molecular biology. Biopress Engineering 16, 261-264
Price PB, Parsons J (1979) Distribution of lipids in embryonic axis, bran-endosperm,
and full fractions of hulless barley and hulless oat grains. J. Agric. Chem. 27, 813-815
Purohit SD, Raghuvanshi S, Tyagi A (2007) Biolistic-mediated DNA delivery and
transient expression of GUS in hypocotyles of Feronia limonia L- A fruit tree. Indian J.
Biotech. 6, 504-507
Qureshi AA, Qureshi N, Wright JJK, Shen Z, Kramer G, Gapor A, Chong YH,
Dewitt G, Ong ASH, Peterson DM, Bradlow BA (1991) Lowering serum cholesterol in

146
hypercholesterolemic humans by tocotrienols (palmvitee). Am. J. Clin. Nutr. 53, 1021–
1026
Radchuk VV, Borisjuk L, Sreenivasulu N, Merx K, Mock H-P, Rolletschek H,
Wobus U, WeschkeW (2009) Spatiotemporal profiling of starch biosynthesis and
degradation in the developing barley grain. Plant Physiol. 150,190–204
Regina A, Kosar-Hashemi B, Li Z, Pedler A, Mukai Y, Yamamoto M, Gale K,
Sharp PJ, Morell MK, Rahman S (2005) Starch branching enzyme IIb in wheat is
expressed at low levels in the endosperm compared to other cereals and encoded at a non-
syntenic locus. Planta 222, 899-909
Regina A, Kosar-Hashemi B, Ling S, Li Z, Rahman S,Morell M (2010) Control of
starch branching in barley defined through differential RNAi suppression of starch
branching enzyme IIa and IIb. J. Exp. Bot. 61, 1469–1482
Reinders A, Sivitz AB, Hsi A, Grof CP, Perroux JM, Ward JM (2006) Sugarcane
ShSUT1: analysis of sucrose transporter activity and inhibition by sucralose. Plant Cell
Environ. 29, 1871-1880
Reiser J, Linka N, Lemke L, Jeblick W, Neuhaus HE (2004) Molecular physiological
analysis of the two plastidic ATP/ADP transporters from Arabidopsis. Plant Physiol. 136,
3524–3536
Repellin A, Baga M, Jauhar PP, Chibbar RN (2001) Genetic enrichment of cereal
crops via alien gene transfer: new challenges. Plant Cell, Tissue and Organ Culture 64,
159–183
Rieder B, and Neuhaus HE (2011) Identification of an Arabidopsis plasma membrane–
located ATP transporter important for anther development. Plant Cell 23, 1932–1944

147
Register JC, Peterson DJ, Bell PJ, Bullock WP, Evans IJ, Frame B, Greenland AJ,
Higgs NS, Jepson I, Jiao S, Lewnau CJ, Sillick JM, Wilson M (1994) Structure and
Function of Selectable and Non- Selectable Transgenes in Maize after Introduction by
Particle Bombardment. Plant Mol. Biol. 25, 951–961
Risacher T, Craze M, Bowden S, Paul W, Barsby T (2009) High efficient
Agrobacterium-mediated transformation of wheat via in planta inoculation. Methods in
Molecular Biology, Transgenic wheat, barley and oats 478, 115- 124
Roldán I, Wattebled F, Mercedes Lucas M, Delvallé D, Planchot V, Jiménez S,
Pérez R, Ball S, D’Hulst C, Mérida A (2007) The phenotype of soluble starch synthase
IV defective mutants of Arabidopsis thaliana suggests a novel function of elongation
enzymes in the control of starch granule formation. Plant J. 49, 492 – 504
Rösti S, Rudi H, Rudi K, Opsahl-Sorteberg H., Fahy B, Denyer K (2006) The gene
encoding the cytosolic small subunit of ADP-glucose pyrophosphorylase in barley
endosperm also encodes the major plastidial small subunit in the leaves. J. Exp. Bot. 57,
3619–3626
Ruuska S, Rebetzke G, van Herwaarden A, Richards RA, Fettell N, Tabe L, Jenkins
CLD. (2006). Genotypic variation in water-soluble carbohydrate accumulation in wheat.
Funct. Plant Biol. 33, 799–809
Ryoo N, Yu C, Park CS, Baik MY, Park IM, Cho MH, Bhoo SH, An G, Hahn TR,
Jeon JS (2007) Knockout of a starch synthase gene OsSSIIIa/Flo5 causes white-core
floury endosperm in rice (Oryza sativa L.). Plant Cell Rep 26, 1083–1095
Sambrook J, Fritsch EF, Maniatis T (1989) Molecular Cloning: A Laboratory Manual,
Cold Spring Harbor Laboratory, Cold Spring Harbor, NY

148
Satoh H, Nishi A, Yamashita K, Takemoto Y, Tanaka Y, Hosaka Y, Sakurai A,
Fujita N, Nakamura Y (2003) Starch branching enzyme 1–deficent mutant specifically
affects the structure and properties of starch in rice endosperm. Plant Physiol. 133, 1111-
1121
Satoh H, Shibahara K, Tokunaga T, Nishi A, Tasaki M, Hwang SK, Okita TW,
Kaneko N, Fujita N, Yoshida M, Hosaka Y, Sato A, Utsumi Y, Ohdan T, Nakamura
Y (2008) Mutation of the plastidial alpha-glucan phosphorylase gene in rice affects the
synthesis and structure of starch in the endosperm. Plant Cell 20,1833–1849
Sauer N. (2007) Molecular physiology of higher plant sucrose transporters. FEBS letter
581, 2309-2317
Scofield GN, Hirose T, Aoki N, Furbank RT (2007) Involvement of the sucrose
transporter, OsSUT1, in the long distance pathway for assimulate transport in rice. J. Exp
Bot. 58, 3155-3169
Seebauer JR, Singletary GW, KrumpelmanPM,Ruffo ML, Below FE (2010)
Relationship of source and sink in determining kernel composition of maize. J. Exp. Bot.
61, 511–519
Shannon JC, Pien FM, Liu KC (1996) Nucleotides and nucleotide sugars in developing
maize endosperms: Synthesis of ADP-glucose in brittle 1. Plant Physiol. 110, 835–843
Shannon JC, Pien FM, Cao H, Liu KC (1998) Brittle-1, an adenylate translocator,
facilitates transfer of extraplastidial synthesized ADP-glucose into amyloplasts of maize
endosperms. Plant Physiol. 117, 1235-1252
149
Sharma VK, Hansch R, Mendel RR, Schuize J (2005) Mature embryo axis-based high
frequency somatic embryogenesis and plant regeneration from multiple cultivars of
barley (Hordeum vulgare L.). J. Exp. Bot. 417, 1913-1922
Shrawat AK, Horst Lörz (2006) Agrobacterium-mediated transformation in cereals: a
promising approach crossing barriers. Plant Biotech. J. 4, 575-603
Shrawat AK, Decker D, Lorz H (2007) Agrobacterium tumefaciens-mediated genetic
transformation of barley (Hordeum vulgare L.). Plant Sci. 172, 281-290
Shou H, Frame BR, Whitham SA, Wang K (2004) Assessment of transgenic maize
events produced by particle bombardment or Agrobacterium-mediated transformation.
Mol. Breed. 13, 201–208
Shure M, Wessler S, Fedoroff N (1983) Molecular identification and isolation of the
waxy locus in maize. Cell 35, 225−233
Sikka VK, Choi SB, Kavakli IH, Sakulsingharoj C, Gupta S,Ito H, Okita TW (2001)
Subcellular compartmentation and allosteric regulation of the rice endosperm ADP-
glucose pyrophosphorylase. Plant Sci. 161, 461–468
Sivitz AB, Reinders A, Johnson ME, Krenz AD, Grof CP, Perroux JM, Ward JM
(2007) Arabidopsis sucrose transporter AtSUC9. High affinity transport activity,
intragenic control of expression, and early flowering mutant genotype. Plant Physiol.
143, 188-198
Smith AM (2008) Prospects for increasing starch and sucrose yields for bioethanol
production. Plant J. 54, 546–58
Songstad DD, Halaka FG, DeBoer DL, Armstrong CL, Hinchee MAW, Ford-
Santino CG, Brown SM, Fromm ME, Horsch R.B (1993) Transient Expression of

150
GUS and Anthocyanin Constructs in Intact Maize Immature Embryos Following
Electroporation. Plant Cell, Tissue Organ Cult. 33, 195–201
Sorokin AP, Ke XY, Chen D, Elliott MC (2000) Production of fertile transgenic wheat
plants via tissue electroporation. Plant Sci. 156, 227-233
Stachel SE, Nester EW (1986) The genetic and transcriptional organization of the vir
region of the A6 Ti plasmid of Agrobacterium tumefaciens. EMBO J. 5, 1445–1454
Stark DM, Timmerman KP, Barry GF, Preiss J, Kishore GM (1992) Regulation of
the amount of starch in plant tissues by ADP-glucose pyrophosphorylase. Science 258,
287–292
Steup M (1988) Starch degradation. In: Stumpf PK, Conn EE (Eds), The Biochemistry
of Plants. Academic Press, NY. vol.14, pp.255-296.
Streb S, Delatte T, Umhang M, Eicke S, Schorderet M, Reinhardt D, Zeeman SC
(2008) Starch granule biosynthesis in Arabidopsis is abolished by removal of all
debrancing enzymes but restored by the subsequent removal of an endoamylase. Plant
Cell 20, 3448–3466
Sullivan TD, Kaneko Y (1995). The maize Brittle1 gene encodes amyloplast membrane
polypeptides. Planta 196, 477-484
Szydlowski N, Ragel P, Raynaud S, Lucas MM, Roldan I, Montero M, Muñoz FJ,
Ovecka M, Bahaji A, Planchot V, Pozueta-Romero J, D’Hulst C, Mérida A (2009)
Starch granule initiation in Arabidopsis requires the presence of either class IV or class
III starch synthases. Plant Cell 21, 2443 – 2457

151
Tada Y, Sakamoto M, Fujmura T (1990) Efficient Gene Introduction into Rice by
Electroporation and Analysis of Transgenic Plants: Use of Electroporation Buffer
Lacking Chloride Ions. Theor. Appl. Genet. 80, 475–480
Tahir M, Law D, Stasolla C (2006) Molecular characterization of PgAGO, a novel
conifer gene of the ARGONAUTE family expressed in apical cells and required for
somatic embryo development in spruce. Tree Physiol. 26, 12-57
Talati R, Baker WL, Pabilonia MS, White CM, Coleman CI (2009) The effects of
barley-derived soluble fiber on serum lipids. Ann. Fam. Med. 7, 157–163
Tamura K, Peterson D, Peterson N, Stecher G, Nei M, Kumar S (2011) MEGA5:
molecular evolutionary genetics analysis using maximum likelihood, evolutionary
distance, and maximum parsimony methods. Mol. Biol. Evol. 28, 2731-2739
Tang K, Wu A, Yao J, Qi H, Lu X (2000) Development Mediated Transformation and
Genetic Analysis – Based Selection. Acta Biotech. 20, 175–183
Tetlow IJ, Blissett KJ, Emes MJ (1994) Starch synthesis and carbohydrate oxidation in
amyloplasts from developing wheat endosperm. Planta 194, 454–460
Tetlow IJ, Davies EJ, Vardy KA, Bowsher CG, Burrell MM, Emes MJ (2003)
Subcellular localization of ADP-glucose pyrophosphorylase in developing wheat
endosperm and analysis of a plastidial isoform. J. Exp. Bot. 54, 715–725
Tetlow IJ, Morell MK, Emes MJ (2004) Recent developments in understanding the
regulation of starch metabolism in higher plants. J. Exp. Bot. 55, 2131-2145
Tetlow IJ, Morell MK, Emes MJ (2009) Recent developments in understanding the
regulation of starch metabolism in higher plants. J. Exp. Bot. 55, 2131–2145

152
Tetlow IJ, Emes MJ (2011) Plant Systems. Starch Biosynthesis in Higher Plants: The
Starch Granule. In: Murray Moo-Young (ed.), Comprehensive Biotechnology, Second
Edition, Vol 4, pp 37-45.
Thompson JD, Gibson TJ, Plewniak F, Jeanmougin F, Higgins DG (1997) The
CLUSTAL_X windows interface: flexible strategies for multiple sequence alignment
aided by quality analysis tools. Nucleic Acids Res. 25, 4876-82
Thomashow MF, Panagopoulos CG, Gordon MP, Nester EW (1980) Host range of
Agrobacterium tumefaciens is determined by the Ti plasmid. Nature 283, 794–796
Thorbjørnsen T, Villand P, Denyer K, Olsen OA, Smith AM (1996a) Distinct
isoforms of ADP-glucose pyrophosphorylase occur inside and outside the amyloplasts in
barley endosperm. Plant J. 10, 243–250
Thorbjørnsen T, Villand P, Kleczkowski LA, Olsen OA (1996b) A single gene
encodes two different transcripts for the ADP-glucose pyrophosphorylase small subunit
from barley (Hordeum vulgare L.). Biochem. J. 313, 149–154
Tiessen A, Nerlich A, Faix B, Hümmer C, Fox S, Trafford K, Weber H, Weschke W,
Geigenberger P (2012) Subcellular analysis of starch metabolism in developing barley
seeds using a non-aqueous fractionation method. J. Exp. Bot. 63, 2071-87
Tickle P, Burrell MM, Coates SA, Emes MJ, Tetlow IJ, Bowsher CG (2009)
Characterization of plastidial starch phosphorylase in Triticum aestivum L. endosperm. J.
Plant Physiol. 166,1465–1478
Tingay S, McElroy D, Kalla R, FiegS, Wang M, Thornton S, Brettell R (1997)
Agrobacterium tumefaciens-mediated barley transformation. Plant J. 11, 1369–1376
153
Tjaden J, Schwöppe C, Möhlmann T, Quick PW, Neuhaus HE. (1998). Expression of
the plastidic ATP/ADP transporter gene in Escherichia coli leads to the presence of a
functional adenine nucleotide transport system in the bacterial cytosolic membrane. J.
Biol. Chem. 273, 9630–9636
Tjaden JI, Haferkamp B, Boxma AGM, Tielens M, Huynen M, Hackstein JHP
(2004) A divergent ADP/ATP carrier in the hydrogenosomes of Trichomonas gallinae
argues for an independent origin of these organelles. Mol. Microbiol. 51: 1439–1446
Tomlinson K, Denyer K (2003) Starch synthesis in creal grains. Adv. Bot. Res. 40, 1-61
Topping DL, Clifton PM (2001) Short Chain Fatty Acids and Human Colonic Function:
Roles of Resistant Starch and Non Starch Polysaccharides. Physiol Rev.81, 1031-1064
Toriyama KF, Arimoto Y, Uchimiya H, Hinata K (1988) Transgenic rice plants after
direct gene transfer into protoplasts. Biotechnol 6, 1072-1074
Tsai C-Y, Nelson OE (1966) Starch-deficient maize mutants lacking adenosine
diphosphate glucose pyrophosphorylase activity. Science 151, 341–343
Vain P, De Buyser J, Trang VB, Haicour R, Henry Y (1995) Foreign gene delivery
into monocotyledonous species. Biotechnol. Adv. 13, 653-671
Vain P, Afolabi AS, Worland B, Snape JW. (2003) Transgene behavior in populations
of rice plants transformed using a new dual binary vector system: pGreen/pSoup. Theor.
Appl. Genet.107, 210–217
Valent QA et al. (1997) Nascent membrane and presecretory proteins synthesized in
Escherichia coli associate with signal recognition particle and trigger factor. Mol.
Microbiol. 25, 53–64

154
Visser R G F , Somhorst I , Kuipers GJ, Ruys NJ , Feenstra WJ Jacobsen E (1991)
Inhibition of the expression of the gene for granule-bound starch synthase in potato by
antisense constructs. Mol. Gen. Genet. 225, 289-296
Vrinten PL, Nakamura T (2000) Wheat granule-bound starch synthase I and II are
encoded by separate genes that are expressed in different tissues. Plant Physiol. 122, 255
- 264
Walters DA, Vetsch CS, Potts DE, Lundguist RC (1992) Transformation and
inheritance of a hygromycin phosphotransferase gene in maize plants. Plant Mol. Biol.
18, 189–200
Wagner S, Baars L, Ytterberg AJ, Klussmeier A, Wagner CS, Nord O, Nygren
PA, van Wijk KJ, de Gier JW (2007) Consequences of membrane protein
overexpression in Escherichia coli. Mol. Cell Proteomics 6, 1527-1550
Wagner S, Klepsch MM, Schlegel S, Appel A, Draheim R, Tarry M, Högbom M,
VanWijk KJ, Slotboom DJ, Persson JO, Gier JW (2008)Tuning Escherichia coli for
membrane protein overexpression. Proc. Natl. Acad. Sci. 105, 14371–14376
Wan Y, Lemaux PG. (1994) Generation of large numbers of independently transformed
fertile barley plants. Plant Physiol. 104, 37–48
Wang Z, Stutte GW (1992) The role of carbohydrates in active osmotic adjustment in
apple under water stress. J. Amer. Soc. Hort. Sci.117, 816-823
Weschke W, Panitz R, Sauer N, Wang Q, Neubohn B, Weber H, Wobus U (2000)
Sucrose transporter into barley seeds: molecular characterization ot two transporters and
implications for seed development and starch accumulation. Plant J. 21, 455-467

155
Whalen MC, Innes RW, Bent AF, Staskwicz BJ (1991) Identification of Pseudomonas
syringae pathogens of Arabidopsis and a bacterial locus determining avirulence on both
Arabidopsis and soybean. Plant cell 3, 49-59
Whister RL, Daniel JR. (1984) Molecular structure of starch. In RL Whister, JN
Bemiller, EF Paschall, eds, Starch: Chemistry and Technology, Ed2. Academic Press,
New York, PP 153-182
Winans SC, Kerstetter RA, Nester EW (1988) Transcriptional regulation of the virA
and virG genes of Agrobacterium tumefaciens. J. Bacteriol. 170, 4047–54
Winans SC (1990) Transcriptional induction of an Agrobacterium regulatory gene at
tandem promoters by plant-released phenolic compounds, phosphate starvation, and
acidic growth media. J. Bacteriol. 172, 2433–38
Winkler HH, Neuhaus HE (1999) Non-mitochondrial ATP transport. Trends Biochem
Sci 24, 64–68
Wobus U, Weber H. (1999) Sugars as signal molecules in plant seed development. Biol.
Chem. 390, 937-944
Wu H, Doherty A, Jones HD (2009) Agrobacterium-mediated transformation of bread
and durum wheat using freshly isolated immature embryos. Methods in Molecular
Biology, Transgenic wheat, barley and oats 478, 93- 103
Yamamori M, Fujita S, Hayakawa K, Matsuki J, Yasui T. (2000) Genetic elimination
of a starch granule protein, SGP-1, of wheat generates an altered starch with apparent
high amylose. Theor. Appl. Genet. 101, 21–29
Yemm EW, Willis AJ (1954) The estimation of carbohydrates in plant extracts by
anthrone. Biochem. J. 57, 508–514

156
Yun SH, Matheson NK (1993) Structure of the amylopectins of waxy, normal, amylose-
extender, and wx:ae genotypes and of the phytoglycogen of maize. Carbohydr. Res. 243,
307-321.
Yu-jun R, Jie Z. (2008) Optimization of electroporation paramerts for immature
embryos of indica Rice (Oryza sativa L.). Rice Sci. 15, 43-50
Zang S, Cho MJ, Koprek T, Yun R. (1999) Genetic transformation of commercial
cultivars of oat (Avena sativa L) and barley (Hordeum vulgare L.) using in vitro shoot
meristematic cultures derived from germinated seedlings. Plant Cell Reports18, 959-966
Zeeman SC, Kossmann J, Smith AM (2010) Starch: Its metabolism, evolution and
biotechnological modification in plants. Annu. Rev. Plant Biol. 61, 209-234
Zhang S, Cho M-J, Koprek T, Yun R, Bregitzer P, Lemaux PG (2000) Genetic
transformation of commercial cultivars of oat (Avena sativa L.) and barley (Hordeum
vulgare L.) using in vitro shoot meristematic cultivars derived from germinated seedlings.
Plant Cell Rep. 18, 959–966
Zhang X, Colleoni C, Ratushna V, Sirghie-Colleoni M, James MG, Myers AM
(2004) Molecular characterization demonstrates that the Zea mays gene sugary2 codes for
the starch synthase isoform SSIIa. Plant Mol. Biol. 54, 865 - 879
Zupan JR, Zambryski PC (1995) Transfer of TDNA from Agrobacterium to the plant
cell. Plant Physiol. 107, 1041-1047

157
APPENDICES
Appendex 1. (chapter 2)
Inhibitory effect of HvBT1 on E. coli cells.
A: Growth curve of C43 cells; empty plasmid (C43-E), optimized ORF (C43-OPC), and
original ORF (C43-ORG). B: Growth curve of Rosetta2 cells; empty plasmid (R-E),
optimized ORF (R-OPC), and original ORF (R3-ORG). C: Growth of C43 and Rosetta2
cells on plate media. C 1 and 2 indicate the un-induced (-) and induced (+) C43 cells
harboring original ORF and optimized ORF, respectively. C 3 and 4 indicate the un-
induced (-) and induced (+) Rosetta2 cells harboring original ORF and optimized ORF,
respectively.
158
Appendex 2. (chapter 2)
Barley genomic DNA sequence of HvBT1 (1486 bp)
ATGGCGGCGGCAATGGCTGCAACGACAATGGTGACCAAGAACAACGGCGGCTCGCTCGCCAT
GGACAAGAAGAACTGGTTCTTTCGGCCGGCCCCTGAGGTCGCCTTCTCTTGGAGCTCGCAGCC
CGAGTCCAGGAGCTTGGAGTTCCCACGCAGGGCTCTGTTCGCCAGCGTCGGACTCAGCCTGTC
CCACGACGGGAAGGCTCGGCCCGCCGACGACGTCGCACACCAATTCGCAGCCGCGGGCGATG
CGGGCGTCCAGCAGGCCCAGAAGGCGAAAAAGGCCAAGAAGCAGCAGCTGGGTCTGAGGAA
GGTGAGGGTCAAGATCGGCAACCCGCACCTGCGTCGGCTGGTCAGCGGCGCCATCGCCGGCG
CCGTTTCGAGGACTTTCGTGGCGCCGCTGGAGACGATCAGGACGCACCTGATGGTGGGAAGCT
CCGGCGCCGACTCCATGGGCGGGGTTTTCCGGTGGATCATGCGGACGGAGGGGTGGCCCGGC
CTCTTCCGCGGCAACGCCGTCAACGTCCTCCGCGTCGCGCCGAGCAAGGCCATCGAGGCAAGC
CAGCCACCTCACGTGTTTTCCTTTGAAATTTCCTATAGTAGACGCGAGATGCATGCATGCATGC
AGCGTCGCTGATGATTCCACTTCCACATGCCGCGGTGCAGCACTTCACTTACGGCACGGCCAA
GAAGTACCTGACCCCGGAGGCCGGCGAGCCAGCCAAGGTCCCCATCCCCACGCCGCTTGTCG
CCAGAGCGCTCGCCGGAGTGGCCTCAACCCTGTGCACCTATCCCATGGAGCTCGTCAAGACCC
GTCTCACCATCGAGGTGAAGAAGACACAGAATTCTGCGCAGTCTCTACCAGTGGCAGTGCCAT
CTGATCAGGCTGACGGCCCCGTTGTGTTGTGTACTTGTGTTGCATGCAGAAGGATGTGTACGA
CAACCTCCTCCACGCGTTCGTCAAGATCGTGCGCGACGAGGGGCCCGGAGAGCTGTACCGCG
GGCTGGCGCCGAGCCTGATCGGCGTGGTGCCGTACGCGGCGGCCAACTTCTACGCCTACGAGA
CACTGCGGGGCGCGTACCGCCGCGCGTCGGGGAAGGAGGAGGTGGGCAACGTGCCGACGCTG
CTGATCGGGTCCGCGGCGGGCGCCATCGCCAGCACGGCCACCTTCCCGCTGGAGGTGGCGCG
GAAGCAGATGCAGGTGGGCGCCGTGGGCGGGAGGCAGGTGTACAAGAACGTCCTGCACGCCA
TGTACTGCATCCTCAACAAGGAGGGCGCCGCCGGGCTCTACCGCGGGCTCGGCCCCAGCTGCA
TCAAGCTCATGCCCGCCGCCGGCATCTCCTTCATGTGCTACGAGGCCTGCAAGAAGATACTCG
TCGACGACAAACAAGACGGCGAGCCCCAGGACCAGGAGGAGACGGAGACCGGACACACACA
AGGACAGGCGGCGCCCAAGAGCCCCAACGCCAACGGTGATCGACCATGA

159
Appendex 3. (chapter 2)
Barley complete cDNA sequence of HvBT1 (1287 bp) (GenBank ID: AY560327.2)
ATGGCGGCGGCAATGGCTGCAACGACAATGGTGACCAAGAACAACGGCGGCTCGCTCGCCAT
GGACAAGAAGAACTGGTTCTTTCGGCCGGCCCCTGAGGTCGCCTTCTCTTGGAGCTCGCAGCC
CGAGTCCAGGAGCTTGGAGTTCCCACGCAGGGCTCTGTTCGCCAGCGTCGGACTCAGCCTGTC
CCACGACGGGAAGGCTCGGCCCGCCGACGACGTCGCACACCAACTCGCAGCCGCGGGCGATG
CGGGCGTCCAGCAGGCCCAGAAGGCGAAAAAGGCCAAGAAGCAGCAGCTGGGTCTGAGGAA
GGTGAGGGTCAAGATCGGCAACCCGCACCTGCGTCGGCTGGTCAGCGGCGCCATCGCCGGCG
CCGTTTCGAGGACTTTCGTGGCGCCGCTGGAGACGATCAGGACGCACCTGATGGTGGGAAGCT
CCGGCGCCGACTCCATGGGCGGGGTTTTCCGGTGGATCATGAGGACGGAGGGGTGGCCCGGC
CTCTTCCGCGGCAACGCCGTCAACGTCCTCCGCGTCGCGCCGAGCAAGGCCATCGAGCACTTC
ACTTACGACACGGCCAAGAAGTACCTGACCCCGGAGGCCGGCGAGCCAGCCAAGGTCCCCAT
CCCCACGCCGCTTGTCGCCGGAGCGCTCGCCGGAGTGGCCTCAACCCTGTGCACCTATCCCAT
GGAGCTCGTCAAGACCCGTCTCACCATCGAGAAGGATGTGTACGACAACCTCCTCCACGCGTT
CGTCAAGATCGTGCGCGACGAGGGGCCCGGAGAGCTGTACCGCGGGCTGGCGCCGAGCCTGA
TCGGCGTGGTGCCGTACGCGGCGGCCAACTTCTACGCCTACGAGACACTGCGGGGCGCGTACC
GCCGCGCGTCGGGGAAGGAGGAGGTGGGCAACGTGCCGACGCTGCTGATCGGGTCCGCGGCG
GGCGCCATCGCCAGCACGGCCACCTTCCCGCTGGAGGTGGCGCGGAAGCAGATGCAGGTGGG
CGCCGTGGGCGGGAGGCAGGTGTACAAGAACGTCCTGCACGCCATGTACTGCATCCTCAACA
AGGAGGGCGCCGCCGGGCTCTACCGCGGGCTCGGCCCCAGCTGCATCAAGCTCATGCCCGCC
GCCGGCATCTCCTTCATGTGCTACGAGGCCTGCAAGAAGATACTCGTCGACGACAAACAAGAC
GGCGAGCCCCAGGACCAGGAGGAGACGGAGACCGGACACACACAAGGACAGGCGGCGCCCA
AGAGCCCCAACGCCAACGGTGATCGACCATGA

160
Appendex 4. (chapter 2)
Gene Name: ADP-Glucose transporter gene, Length: 1287bp, Codon Optimization: No
Sequence:
CATATGGCAGCAGCGATGGCAGCAACGACGATGGTTACGAAAAACAACGGTGGCAGCCTGGC
AATGGATAAAAAAAACTGGTTCTTCCGCCCGGCTCCGGAAGTTGCGTTTAGTTGGAGCTCTCA
GCCGGAATCACGTTCGCTGGAATTTCCGCGTCGCGCACTGTTCGCCTCCGTGGGTCTGAGCCT
GTCTCATGATGGTAAAGCACGTCCGGCTGATGACGTCGCACACCAGCTGGCAGCAGCAGGTG
ACGCAGGTGTGCAGCAAGCGCAAAAAGCCAAAAAAGCGAAAAAACAGCAACTGGGCCTGCG
TAAAGTCCGCGTGAAAATTGGTAACCCGCATCTGCGTCGCCTGGTTTCAGGTGCAATCGCAGG
TGCAGTCTCGCGTACCTTTGTGGCACCGCTGGAAACCATTCGCACGCACCTGATGGTGGGCAG
TTCCGGTGCGGATTCCATGGGCGGTGTTTTTCGTTGGATCATGCGTACCGAAGGTTGGCCGGG
TCTGTTCCGTGGTAACGCAGTTAATGTCCTGCGCGTGGCCCCGAGCAAAGCAATTGAACATTT
CACCTATGATACGGCGAAAAAATACCTGACCCCGGAAGCTGGTGAACCGGCGAAAGTTCCGA
TCCCGACGCCGCTGGTCGCTGGTGCACTGGCCGGTGTGGCCAGCACCCTGTGCACGTATCCGA
TGGAACTGGTTAAAACCCGTCTGACGATTGAAAAAGATGTCTACGACAATCTGCTGCACGCGT
TTGTGAAAATCGTTCGTGATGAAGGTCCGGGTGAACTGTATCGTGGTCTGGCACCGTCACTGA
TTGGTGTGGTTCCGTACGCTGCGGCCAACTTCTATGCATACGAAACCCTGCGTGGTGCATATC
GTCGCGCATCGGGCAAAGAAGAAGTCGGTAATGTGCCGACCCTGCTGATTGGCAGTGCAGCT
GGTGCAATCGCTTCCACCGCTACGTTTCCGCTGGAAGTTGCGCGTAAACAGATGCAAGTTGGT
GCTGTCGGCGGTCGCCAGGTGTATAAAAACGTTCTGCATGCCATGTACTGCATTCTGAATAAA
GAAGGCGCAGCAGGTCTGTATCGTGGTCTGGGTCCGAGCTGTATTAAACTGATGCCGGCAGCT
GGCATCTCTTTCATGTGCTACGAAGCGTGTAAGAAAATTCTGGTGGATGACAAACAGGATGGT
GAACCGCAGGACCAAGAAGAAACCGAAACGGGTCATACCCAAGGTCAAGCAGCCCCGAAAT
CGCCGAACGCAAATGGTGATCGTCCGTAAGGATCC