biodiesel from canola oil using a 1 : 1 molar mixture of methanol and ethanol
TRANSCRIPT

Research Paper
Biodiesel from canola oil using a 1 : 1 molar mixture ofmethanol and ethanol*
Hem Joshi1, Joe Toler2, Bryan R. Moser3 and Terry Walker1
1 Biosystems Engineering, Clemson University, Clemson, USA2 Applied Economics and Statistics, Clemson University, Clemson, USA3 United States Department of Agriculture, Agricultural Research Service, National Center for Agricultural Utili-
zation Research, Peoria, USA
Canola oil was transesterified using a 1 : 1 molar mixture of methanol and ethanol (M/E) with potassiumhydroxide (KOH) catalyst. The effects of catalyst concentration (0.5–1.5 wt-%), molar ratio of M/E tocanola oil (3 : 1 to 20 : 1) and reaction temperature (25–75 7C) on the percentage yield measured after 2.5and 5.0 min were optimized using a central composite design. A maximum percentage yield of 98% wasobtained for a catalyst concentration of 1.1 wt-% and an M/E to canola oil molar ratio of 20 : 1 at 25 7C at2.5 min, whereas a maximum percentage yield of 99% was obtained for a catalyst concentration of1.15 wt-% and all molar ratios of reactants at 25 7C at 5 min. Statistical analysis demonstrated thatincreasing catalyst concentration and molar ratio of reactants resulted in curvilinear and linear trends inpercentage yield, both at 2.5 and 5 min. However, reaction temperature, which affected the percentageyield at 2.5 min linearly, was insignificant at 5 min. The resultant mixed methyl/ethyl canola esters exhib-ited enhanced low-temperature performance and lubricity properties in comparison to neat canola oilmethyl esters and also satisfied ASTM D6751 and EN 14214 standards with respect to oxidation stability,kinematic viscosity, and acid value.
Keywords: Biodiesel / Canola oil / Central composite design / Optimization / Transesterification
Received: March 15, 2008; accepted: October 9, 2008
DOI 10.1002/ejlt.200800071
464 Eur. J. Lipid Sci. Technol. 2009, 111, 464–473
1 Introduction
Biodiesel is defined chemically as simple monoalkyl esters(typically methyl or ethyl) of long-chain fatty acids, whichmeet ASTM and EN specifications. Biodiesel is producedfrom the transesterification of vegetable oils and animal fats.The advantages of biodiesel over conventional petroleum die-sel fuels are its domestic origin, derivation from a renewablefeedstock, biodegradability, non-toxicity, cleaner emissions,superior lubricating properties, and the ability to be blendedin any proportion with petroleum diesel. Biodiesel is typicallyproduced using methanol, resulting in fatty acid methyl esters(FAME). However, methanol is derived commercially frompetrochemical processes and yields biodiesel with relatively
poor low-temperature performance [1–5] and reduced lubri-city [1, 2] in comparison to biodiesel produced from higheralcohols. Biodiesel obtained from ethanolysis of triacylglycer-ols (TAG), yielding fatty acid ethyl esters (FAEE), is com-pletely bio-derived, since ethanol may be obtained from var-ious biomass sources, such as corn and sugarcane. However,ethanol is currently more expensive than methanol, and recentstudies [1, 2] have indicated that the kinematic viscosity ofFAEE is slightly higher than that of FAME, but still normallywithin specifications.
In a previous study, various mixtures of methanol andethanol in the presence of KOH were used to transesterifycanola oil [1]. The results indicated that canola oil methylesters (COME) had poorer lubricity compared to canola oil
Correspondence: Hem Joshi, 111 Biosystems Research Complex,Clemson University, Clemson, SC 29634, USA.E-mail: [email protected]: 11 864 6560338
* Disclaimer: Product names are necessary to report factually on avail-able data; however, USDA neither guarantees nor warrants thestandard of the product, and the use of the name by USDA impliesno approval of the product to the exclusion of others that may also besuitable.
© 2009 WILEY-VCH Verlag GmbH & Co. KGaA, Weinheim www.ejlst.com

Eur. J. Lipid Sci. Technol. 2009, 111, 464–473 Optimization and characterization of canola oil alkyl esters 465
ethyl esters (COEE). The synthesis of COEE, however, wascomplicated by an inadequate separation of the COEE phasefrom the glycerol phase [1]. Accordingly, mixtures of metha-nol and ethanol were investigated and the following advan-tages were elucidated: The rate of transesterification wasimproved [1], better lubricity was obtained than from methylesters alone [1], and better phase separation was achievedwhen compared to using only ethanol [6, 7].
The aim of the current investigation was to optimize theexperimental conditions of ester production from canola oilemploying a 1 : 1 molar mixture of methanol and ethanol withKOH as catalyst using response surface methodology, whichis hitherto unreported. A central composite design with eightfactorial points, six replicated center points and six axialpoints was used to study the effects of catalyst concentration(wt-%), molar ratio of M/E to canola oil, and reaction tem-perature (7C) on the percentage of conversion to esters after2.5 and 5.0 min. Additionally, the resultant mixture of COMEand COEE was analyzed with respect to low-temperatureperformance, lubricity, kinematic viscosity, oxidation stability,and acid value, and was compared to neat COME and COEEusing ASTM D6751 [8] and EN 14214 [9] standards.
2 Materials and methods
2.1 Materials and apparatus
Canola oil was obtained commercially and found to contain byGC [10] palmitic (4.1 wt-%), oleic (61 wt-%), linoleic (21 wt-%), and linolenic acid (8.8 wt-%), with trace amounts of ara-chidic, behenic, myristic, palmitoleic, stearic, linolenic, erucicand lignoceric acids. Anhydrous methanol, ethanol (200 proof),and potassium hydroxide were obtained from Fisher Scientific(Somerville, NJ, USA), and care was taken to avoid contact withwater that may lower alcoholysis of the canola oil [11]. All otherchemicals and reagents were purchased from Aldrich ChemicalCo. (Milwaukee, WI, USA). Each experiment was conducted ina 500-mL round-bottom flask connected to a reflux condenserand the reaction mixture was agitated by magnetic stirring at600 rpm, as described previously [12].
2.2 Methods
Esters were produced using M/E and KOH as catalyst, whichwere first blended according to the calculated amount as perexperimental design and then mixed with canola oil. Themixture was heated at the experimental temperature for 2.5and 5.0 min in two sets of experiments. After the reactionwas stopped by addition of oxalic acid [13], the crude mix-ture was centrifuged at 3000 rpm for 1 min, followed bydecantation of the top ester layer. At this stage, a small sam-ple of crude ester was removed for subsequent HPLC deter-mination of unreacted TAG (Section 2.3). The crude estersample was then washed with distilled water (36) until a
neutral pH was achieved, followed by drying with brine (sat.aq.) and MgSO4 to afford alkyl esters. The ratio of methyl toethyl esters in the final product was determined by 1H-NMR(500 MHz, CDCl3 solvent, Bruker AV-500 spectrometer;Billerica, MA, USA) through comparison of the integrationvalues for the peaks corresponding to the methyl ester pro-tons of COME and the methylene protons of the ethyl estersof COEE, which was found to be 2.7 : 1 (methyl/ethyl esters)under the optimum conditions determined in this study at5 min.
2.3 HPLC analyses
The esters were analyzed using an RP-HPLC system equip-ped with an ELSD detector set at 40 7C. A 1 : 15 dilution ofbiodiesel in dichloromethane was used for the analysis. AShimadzu HPLC system equipped with EZstart 7.2.1 soft-ware and an Altech HP prevail C18 column of length 150 mmand inner diameter 4.6 mm was used. The mobile phase was amixture of acetonitrile and dichloromethane, with a gradientof dichloromethane maintained to separate constituents in theester sample [14]. The following gradient was maintained:gradient time: 0, 15, 30, 32, 35 min; % dichloromethane: 0,15, 70, 70, 0, respectively. A flow rate of 1.0 mL/min wasmaintained for the mobile phase. A sample volume of 10 mLand a gain of 5 were set for each of the runs. Using this meth-od, FAME and FAEE were separated based on their selectiveretention according to their polarity.
2.4 Calculation of percentage yield
Percentage yield was calculated by using the following equa-tion:
% yield ¼ ðAFAME þ AFAEEÞ � 100AFAME þ AFAEE þ ATG þ ADG þ AMG
;
where AFAME ¼ Ab þ f1 Ad þ f2 Af þ f3 Ah andAFAEE ¼ f4 Ac þ f5 Ae þ f6 Ag þ f7 Ai . Ab , Ac , Ad, Ae , Af ,Ag, Ah and Ai were the areas under peaks b, c, d, e, f, g, h and irespectively (Fig. 1). ATG, ADG, and AMG were the areasrepresenting triacylglycerols, diacylglycerols and mono-acylglycerols, respectively. The response factors for methyllinoleate, methyl oleate, methyl palmitate, ethyl linolenate,ethyl linoleate, ethyl oleate and ethyl palmitate relative tomethyl linolenate were f1 , f2 , f3 , f4 , f5 , f6 , and f7 . The re-sponse factors were all assumed to be 1 for mono-, di- andtriacylglycerols.
2.5 Experimental design
Response surface methodology was used to optimize conver-sion for three selected factors: catalyst concentration in wt-%(C), M/E: canola oil molar ratio (MR) and reaction tempera-
© 2009 WILEY-VCH Verlag GmbH & Co. KGaA, Weinheim www.ejlst.com

466 H. Joshi et al. Eur. J. Lipid Sci. Technol. 2009, 111, 464–473
Figure 1. Chromatogram of amixed canola oil methyl and ethylester sample using RP-HPLC.(a) Monoacylglycerols (MG),(b) methyl linolenate (FAME),(c) ethyl linolenate (FAEE),(d) methyl linoleate (FAME),(e) ethyl linoleate (FAEE),(f) methyl oleate (FAME), (g) ethyloleate (FAEE), (h) methyl palmi-tate (FAME), (i) ethyl palmitate(FAEE), (j) diacylglycerols (DG),(k) unreacted triacylglycerolspresent in the mixed ester sam-ple.
ture (T) in 7C [15]. The selection of factor levels was based onprevious research and practical considerations [16]. Theupper temperature level (75 7C) was just below the boilingpoint of ethanol, and the lower level (25 7C) was room tem-perature. Catalyst concentration extremes (0.5 and 1.5 wt-%)were based on literature data [15]. The lower molar ratio(3 : 1) was the minimum amount of alcohol required from thereaction stoichiometry, and the upper molar ratio (20 : 1) wasbased on previous research [12]. In a previous study, transes-terification of canola oil was performed in the presence ofKOH using methanol and ethanol separately [17]. Althoughnot directly stated, tabulated results showed that, for somecombinations of catalyst concentration, molar ratio of alcohol(methanol or ethanol) to oil and reaction temperature, yieldsas high as 98–99% were obtained after 5 min of reaction [17].Hence, the reaction time was fixed at 2.5 and 5 min in twoseparate experiments. A central composite design with eightfactorial points, six axial points and six replicated centerpoints was used for each study (Table 1). The results obtainedfrom the 20 experimental runs were analyzed using the GLMprocedure in Statistical Analysis System (SAS) for Windows,version 9.1 (Cary, NC, USA), to estimate the parameters of acomplete second-order model represented by Eq. (1), for thethree factors being studied [16, 18],
Y ¼ b0 þX3
i¼1
bixiþX3
i¼1
biix2i þ
XX3
i¼1<j
bijxij (1)
and determines the most influential terms using a = 0.05.
2.6 Low-temperature properties
Cloud point (CP) and pour point (PP) determinations weremade in agreement with ASTM D5773 [19] and ASTM
D5949 [20] using a phase technology analyzer model PSA-70S (Richmond, B.C., Canada). CP and PP are rounded tothe nearest whole degree (7C). For a greater degree of accu-racy, PP measurements were done with a resolution of 1 7Cinstead of the specified 3 7C increment. Cold filter pluggingpoint (CFPP) was determined in accordance with ASTMD6371 [21] utilizing an ISL automatic CFPP analyzer modelFPP 5Gs (Houston, TX, USA). Each sample was run intriplicate and mean values are reported (Table 2).
2.7 Kinematic viscosity
Kinematic viscosity (u, mm2/s) was determined with Cannon-Fenske viscometers (Cannon Instrument Co., State College,PA, USA) at 40 7C in accordance with ASTM D445 [22]. Allexperiments were run in triplicate and mean values arereported (Table 2).
2.8 Lubricity
Lubricity (lub) determinations were performed at 60 7C(controlled to less than61 7C), according to ASTM D6079[23] using a high-frequency reciprocating rig (HFRR) lubri-city tester (PCS Instruments, London, UK) via Lazar Scien-tific (Granger, IN, USA). Wear scar (mm) values (Table 2) arethe average of two replicates, measuring the maximum valueof the x- and y-axis of each wear scar. The average wear scardiameter of each replicate was determined by calculating theaverage of the x- and y-axis wear scar lengths.
2.9 Oxidation stability
Oil stability index (OSI, h) was measured in accordancewith EN 14112 [24] employing a Rancimat model 743
© 2009 WILEY-VCH Verlag GmbH & Co. KGaA, Weinheim www.ejlst.com
Eur. J. Lipid Sci. Technol. 2009, 111, 464–473 Optimization and characterization of canola oil alkyl esters 467
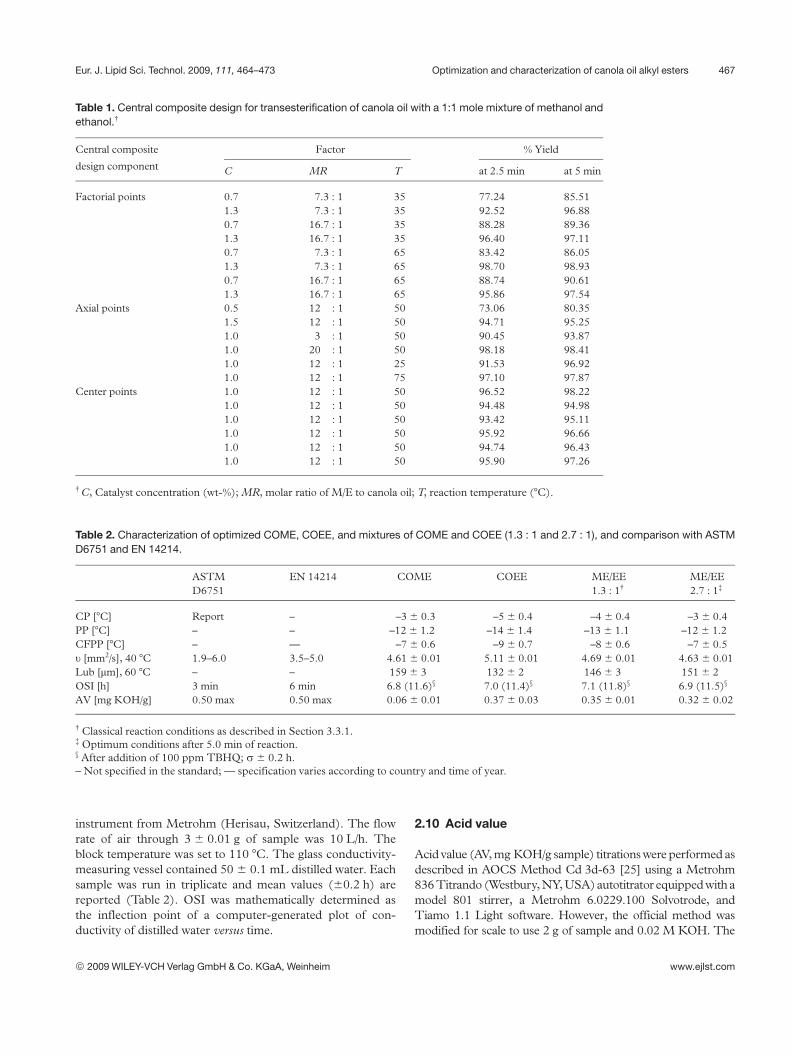
Table 1. Central composite design for transesterification of canola oil with a 1:1 mole mixture of methanol andethanol.{
Central composite Factor % Yield
design component C MR T at 2.5 min at 5 min
Factorial points 0.7 7.3 : 1 35 77.24 85.511.3 7.3 : 1 35 92.52 96.880.7 16.7 : 1 35 88.28 89.361.3 16.7 : 1 35 96.40 97.110.7 7.3 : 1 65 83.42 86.051.3 7.3 : 1 65 98.70 98.930.7 16.7 : 1 65 88.74 90.611.3 16.7 : 1 65 95.86 97.54
Axial points 0.5 12 : 1 50 73.06 80.351.5 12 : 1 50 94.71 95.251.0 3 : 1 50 90.45 93.871.0 20 : 1 50 98.18 98.411.0 12 : 1 25 91.53 96.921.0 12 : 1 75 97.10 97.87
Center points 1.0 12 : 1 50 96.52 98.221.0 12 : 1 50 94.48 94.981.0 12 : 1 50 93.42 95.111.0 12 : 1 50 95.92 96.661.0 12 : 1 50 94.74 96.431.0 12 : 1 50 95.90 97.26
{ C, Catalyst concentration (wt-%); MR, molar ratio of M/E to canola oil; T, reaction temperature (7C).
Table 2. Characterization of optimized COME, COEE, and mixtures of COME and COEE (1.3 : 1 and 2.7 : 1), and comparison with ASTMD6751 and EN 14214.
ASTMD6751
EN 14214 COME COEE ME/EE1.3 : 1{
ME/EE2.7 : 1{
CP [7C] Report – –3 6 0.3 –5 6 0.4 –4 6 0.4 –3 6 0.4PP [7C] – – –12 6 1.2 –14 6 1.4 –13 6 1.1 –12 6 1.2CFPP [7C] – –– –7 6 0.6 –9 6 0.7 –8 6 0.6 –7 6 0.5u [mm2/s], 40 7C 1.9–6.0 3.5–5.0 4.61 6 0.01 5.11 6 0.01 4.69 6 0.01 4.63 6 0.01Lub [mm], 60 7C – – 159 6 3 132 6 2 146 6 3 151 6 2OSI [h] 3 min 6 min 6.8 (11.6)§ 7.0 (11.4)§ 7.1 (11.8)§ 6.9 (11.5)§
AV [mg KOH/g] 0.50 max 0.50 max 0.06 6 0.01 0.37 6 0.03 0.35 6 0.01 0.32 6 0.02
{ Classical reaction conditions as described in Section 3.3.1.{ Optimum conditions after 5.0 min of reaction.§ After addition of 100 ppm TBHQ; s 6 0.2 h.– Not specified in the standard; –– specification varies according to country and time of year.
instrument from Metrohm (Herisau, Switzerland). The flowrate of air through 3 6 0.01 g of sample was 10 L/h. Theblock temperature was set to 110 7C. The glass conductivity-measuring vessel contained 50 6 0.1 mL distilled water. Eachsample was run in triplicate and mean values (60.2 h) arereported (Table 2). OSI was mathematically determined asthe inflection point of a computer-generated plot of con-ductivity of distilled water versus time.
2.10 Acid value
Acid value (AV, mg KOH/g sample) titrations were performed asdescribed in AOCS Method Cd 3d-63 [25] using a Metrohm836 Titrando (Westbury, NY, USA) autotitrator equipped with amodel 801 stirrer, a Metrohm 6.0229.100 Solvotrode, andTiamo 1.1 Light software. However, the official method wasmodified for scale to use 2 g of sample and 0.02 M KOH. The
© 2009 WILEY-VCH Verlag GmbH & Co. KGaA, Weinheim www.ejlst.com

468 H. Joshi et al. Eur. J. Lipid Sci. Technol. 2009, 111, 464–473
titration endpoint was determined by the instrument and visuallyverified using a phenolphthalein indicator. Each sample was runin triplicate and mean values are reported (Table 2).
3 Results and discussion
3.1 Optimization of percent yield at 2.5 min
Table 3 provides the ANOVA summary for the full quadraticmodel for percentage yield at 2.5 min. Based on a = 0.05,terms with p value less than 0.05 significantly affected thepercent yield at 2.5 min, and only those terms were includedin the final model used to characterize the response surface. Itwas found that only the b1 (catalyst concentration linearterm), b2 (molar ratio of M/E to canola oil linear term), b3
(reaction temperature linear term), b11 (catalyst concentrationquadratic term), b12 (interaction between catalyst concentra-tion and molar ratio of M/E to canola oil) and b23 (interactionbetween molar ratio of M/E to canola oil and reaction tem-perature) coefficients were significantly different from zero.The reduced response surface model used to describe percentyield at 2.5 min is represented by Eq. (2):
Y = –11.10 1 126.966C – 45.336C2 1 2.926MR 1 0.366T – 1.356C6MR – 0.026MR6T (2)
where Y is the predicted percentage yield at 2.5 min, C is thecatalyst concentration (wt-%), MR is the molar ratio of M/E tocanola oil and T is the reaction temperature (7C). All of thefactors studied were found to significantly affect percentageyield in the time period studied. A brief discussion of theinfluential terms follows.
3.1.1 Interaction
Equation (2) includes two significant interaction termsaffecting percentage yield at 2.5 min. Since all three factors
were involved in one or both interactions, these factors did notindependently affect percentage yield at 2.5 min. The signifi-cant C6MR interaction means that the effect of catalyst con-centration on percentage yield at 2.5 min depends on thespecific level of the molar ratio of M/E to canola oil and viceversa. This can be readily observed in Fig. 2, which providesthe fitted response surface generated by Eq. (2) at 50 7Creaction temperature. Likewise, the significant MR6T inter-action means that the effect of temperature on percentageyield at 2.5 min depends on the specific level of the molar ratioof M/E to canola oil and vice versa. This can be readilyobserved in Fig. 3 which provides the fitted response surfacegenerated by Eq. (2) for 1 wt-% catalyst concentration.
3.1.2 Catalyst concentration
Catalyst concentration was a very important factor in thetransesterification of canola oil. The relationship betweenpercentage yield at 2.5 min and catalyst concentration wasfound to be curvilinear with a positive linear coefficient and anegative quadratic coefficient. This suggested that percentageyield at 2.5 min was inhibited by high catalyst concentration,which was consistent with previous studies [12]. This reduc-tion in yield may be because the reverse reaction was favoredat high catalyst concentration [26]. As can be seen in Fig. 2,the response surface starts leveling off for catalyst concentra-tions in the range of 1.03–1.17 wt-% and – for higher molarratios – decreases as the catalyst concentration increases above1.17 wt-%. High ester conversion (.90%) was generallyobtained for catalyst concentrations in the range of 1.1–1.5 wt-%. Maximum ester conversion of 98% was achieved ata catalyst concentration of 1.1 wt-%.
3.1.3 Molar ratio of M/E to canola oil
The relationship between percentage yield at 2.5 min and molarratio of M/E to canola oil was linear [12] (Figs. 2, 3). Percentageconversion increased as the molar ratio of M/E to canola oil
Table 3. ANOVA summary for the full quadratic model for percentage yield measured at 2.5 and 5 min.
Model term % Yield at 2.5 min % Yield at 5 min
Mean squares p value Mean squares p value
C (linear) 494.85 ,0.0001 299.83 ,0.0001C (quadratic) 239.74 ,0.0001 151.26 ,0.0001MR (linear) 67.66 ,0.0001 16.22 0.0046MR (quadratic) 2.18 0.1534 1.20 0.3453T (linear) 34.31 0.0001 2.52 0.1829T (quadratic) 2.18 0.1534 0.34 0.6088C 6 MR 29.33 0.0002 11.44 0.0123C 6 T 0.12 0.7193 0.05 0.8304MR 6 T 19.34 0.0010 0.10 0.7778Residual 0.91 1.23
© 2009 WILEY-VCH Verlag GmbH & Co. KGaA, Weinheim www.ejlst.com

Eur. J. Lipid Sci. Technol. 2009, 111, 464–473 Optimization and characterization of canola oil alkyl esters 469
Figure 2. Response surface of percentage yield at 2.5 min vs. molar ratio and catalyst concentration at 50 7Ctemperature.
increased when the catalyst concentration was less than1.1 wt-%, but for higher catalyst concentrations the percentyield decreased as the molar ratio of M/E to canola oilincreased. Percentage yield also increased linearly as the molarratio of M/E to canola oil increased when the reaction tem-perature was below 70 7C. However, the molar ratio of M/E tocanola oil had little effect on percent yield at 2.5 min at highertemperatures.
3.1.4 Reaction temperature
The relationship between percentage conversion and temper-ature was linear (Fig. 3) [17]. Percentage conversion increasedlinearly as the reaction temperature increased when the molarratio of M/E to canola oil was less than 16 : 1, but for highermolar ratios of M/E to canola oil the reaction temperature hadlittle impact on percentage yield at 2.5 min.
From the ANOVA summary for the reduced model forpercentage yield at 2.5 min, insufficient evidence for ‘lack-of-fit’ for the reduced model (p = 0.7393) indicated that themodel adequately characterized the relationship between thethree influential factors (catalyst concentration, molar ratio ofM/E to canola oil, and reaction temperature) and percentageyield at 2.5 min. Furthermore, the coefficient of determina-tion for the model was high (R2 = 0.99). A maximum per-centage yield of 98% was predicted for a catalyst concentra-tion of 1.1 wt-% and a molar ratio of M/E to canola oil of20 : 1 at a reaction temperature of 25 7C.
3.2 Optimization of percent yield at 5 min
Table 3 provides the ANOVA summary for the full quadraticmodel for percentage yield at 5 min. Based on a = 0.05, only
terms with p values less than 0.05 significantly affected per-cent yield at 5 min, and hence only those terms were includedin the final model used to characterize the response surface.The reduced response surface model used to describe percentyield at 5 min is represented by Eq. (3):
Y = 31.99 1 97.486C – 35.886C2 1 1.076MR – 0.846C6MR (3)
where Y is the predicted percentage yield at 5 min (C and MRas above). It was found that only b1, b2, b11 and b12 were sig-nificantly different from zero. All terms containing tempera-ture were found to be insignificant; thus, temperature did notsignificantly affect percentage yield at 5 min. This result is inagreement with previous work that used other oil sources [12].However, the time required to reach maximum conversiondecreased as temperature increased. A brief discussion of theinfluential terms follows.
3.2.1 Interaction
The significant interaction term for catalyst concentration andmolar ratio of M/E to canola oil indicated that these two fac-tors did not independently affect percentage yield at 5 min.Thus, the effect of one factor on percentage yield at 5 mindepended on the specific level of the other factor. This can bereadily observed in Fig. 4 which provides the fitted responsesurface generated by Eq. (3).
3.2.2 Catalyst concentration
The relationship between percentage yield at 5 min and cata-lyst concentration was found to be curvilinear with a positive
© 2009 WILEY-VCH Verlag GmbH & Co. KGaA, Weinheim www.ejlst.com

470 H. Joshi et al. Eur. J. Lipid Sci. Technol. 2009, 111, 464–473
Figure 3. Response surface of percentage yield at 2.5 min vs. molar ratio and temperature for 1 wt-% catalystconcentration.
linear coefficient and a negative quadratic coefficient. Thissuggested that percent yield at 5 min was inhibited at highcatalyst concentration, which was consistent with prior studies[12]. This inhibition in yield may be because the reversereaction was favored at high catalyst concentrations [26]. Ascan be seen in Fig. 4, the response surface starts to level off forcatalyst concentrations in the range of 1.07–1.21 wt-% and,for higher molar ratios of M/E to canola oil, decreases as thecatalyst concentration increases above 1.21 wt-%. High esterconversion (.90%) was generally obtained for catalyst con-centrations in the range of 1.21–1.5 wt-%, and yields wereonly slightly higher than those obtained after 2.5 min of reac-tion time. Maximum ester conversion of 99% was obtained for1.15 wt-% catalyst concentration. Essentially, at 5.0 min, thereaction had proceeded further to completion with a catalystconcentration of 1.21 to 1.5 wt-% in comparison to 2.5 min.
3.2.3 Molar ratio of M/E to canola oil
The molar ratio of M/E to canola oil also influenced thetransesterification of canola oil. The relationship betweenpercentage yield at 5 min and molar ratio of M/E to canola oilwas linear [12] (Fig. 4). Percentage yield increased linearly asthe molar ratio of M/E to canola oil increased when the cata-lyst concentration was less than ,1.15 wt-%, but decreased asthe molar ratio of M/E to canola oil increased at higher catalystconcentrations.
From the ANOVA summary for the reduced model forpercent yield at 5 min, insufficient evidence for ‘lack-of-fit’ forthe reduced model (p = 0.7899) indicated that the modeladequately characterized the relationship between the twoinfluential factors, catalyst concentration and molar ratio ofM/E to canola oil, and percentage yield at 5 min. Further-
more, the coefficient of determination for the model was large(R2 = 0.97). Since percentage yields were independent ofreaction temperature after 5 min, a maximum percentageyield of 99% was predicted for a catalyst concentration of1.15 wt-% and all molar ratios of M/E to canola oil at a reac-tion temperature of 25 7C. The best conversions obtained at2.5 and 5 min required a high molar ratio of M/E to canola oil,which may be cost prohibited. A reduction in the molar ratioof M/E to canola oil along with a slight increase in the amountof KOH could be used to obtain high conversions, and thiswould positively impact on the economic assessment. Fromthe statistical analysis, it was found that catalyst concentration,molar ratio of M/E to canola oil, and reaction temperature, allsignificantly affected the percentage conversion at 2.5 min.However, reaction temperature did not significantly influencepercentage conversion at 5 min. Therefore, there was a cut-offtime between 2.5 and 5 min beyond which the temperaturedid not significantly affect conversion. In order to determinethe cut-off time, the set of experiments was repeated for 3.3and 4.2 min. From the ANOVA summary, it was found thatthe T (linear) and MR6T terms, which significantly affectedconversion at 2.5 min, became insignificant at 5 min. Hence,only these two terms were used to determine the averagep value, which was calculated by taking the average of thep values for the T (linear) and MR6T terms in the percentageyield model. The other temperature terms were insignificantat both 2.5 and 5 min and hence were not taken into con-sideration when calculating the average p value. The followingdata was obtained: reaction time: 2.5, 3.3, 4.2, 5.0 min; aver-age p value: 0.00, 0.02, 0.16, and 0.48, respectively. Based ona = 0.05, at any time period temperature significantly affectedpercentage yield only if the average p value was less than 0.05.By interpolation, the cut-off time was found to be about
© 2009 WILEY-VCH Verlag GmbH & Co. KGaA, Weinheim www.ejlst.com

Eur. J. Lipid Sci. Technol. 2009, 111, 464–473 Optimization and characterization of canola oil alkyl esters 471
Figure 4. Response surface of percentage yield at 5 min vs. catalyst concentration and molar ratio.
3.5 min. Hence, reaction temperature significantly affectedpercentage yield up to 3.5 min of reaction time, but beyondthat temperature had no effect on conversion based ona = 0.05. This result was true over all ranges of catalyst con-centration and molar ratio of M/E to canola oil studied.
3.3 Physical and chemical properties
Although not directly measured in the present study, sub-stitution of methyl esters for ethyl esters in biodiesel is knownto impart slightly enhanced cetane numbers and heat content,both of which are beneficial to fuel performance in compres-sion-ignition (diesel) engines [27, 28]. Other potential bene-fits are revealed below, along with a concomitant discussion onthe influence of mixed methyl and ethyl esters on the fuelproperties of biodiesel resulting from alcoholysis of canola oilwith M/E.
3.3.1 Ratio of methyl to ethyl esters
Alcoholysis of canola oil with M/E at room temperature asdescribed in Section 2.2 yielded a methyl-to-ethyl ester ratioof 2.7 : 1, as determined by 1H-NMR spectroscopy. Thisresult is not unexpected since methanolysis proceeds at a fas-ter rate than ethanolysis because of the higher reactivity ofmethoxide as compared to ethoxide [29]. Repetition of thealcoholysis of canola oil with a 9 : 1 molar ratio of M/E tocanola oil and employing classical reaction conditions (70 7C,60 min, 1.15 wt-% KOH) afforded a methyl/ethyl ester ratioof 1.3 : 1. These results indicated that the methyl ester is pre-ferred at both low (2.7 : 1) and high (1.3 : 1) temperature;however, at high temperature the preference for methyl esters
is diminished. For the sake of the physical property analysisdescribed below, esters resulting from both ratios are de-scribed, along with pure COME and COEE.
3.3.2 Low-temperature operability
Replacement of the methyl ester moiety of FAME with that ofhigher alcohols is known to positively influence low-tempera-ture operability of biodiesel [3, 4, 5, 27, 28]. As expected,COEE exhibited marginally enhanced cold-flow properties incomparison to COME, as evidenced by reduced CP, PP, andCFPP (Table 2). Mixed canola oil methyl and ethyl esters(COME/EE) were found to possess low-temperature proper-ties intermediate between those of pure COME and COEE,with 2.7 : 1 COME/EE more closely mimicking that of pureCOME and 1.3 : 1 COME/EE essentially exhibiting valuesthat resemble the mathematical average of COME and COEEresults.
3.3.3 Acid value, kinematic viscosity, and lubricity
Acid value (AV) is limited to a maximum value of 0.50 mgKOH/g sample in both ASTM D6751 and EN 14214. Allsamples were found to satisfy this requirement (Table 2).Kinematic viscosity (u, 40 7C) is also specified in both ASTMD6751 (1.9–6.0 mm2/s) and EN 14214 (3.5–5.0 mm2/s).Substitution of the methyl ester moiety of FAME with that ofhigher alcohols is known to increase u [2, 27, 28], which wasalso observed in the present study (Table 2). In fact, pureCOEE exhibited u (5.111 6 0.01 mm2/s) in excess of the EN14214 requirement but within the ASTM D6751 specifica-tion. Esters resulting from M/E at ratios of either 2.7 : 1 or
© 2009 WILEY-VCH Verlag GmbH & Co. KGaA, Weinheim www.ejlst.com
472 H. Joshi et al. Eur. J. Lipid Sci. Technol. 2009, 111, 464–473
1.3 : 1, although slightly higher than pure COME, easilysatisfied both standard specifications with respect to u. Lubri-city is not specified in either ASTM D6751 or EN 14214since biodiesel possesses inherently good lubricating proper-ties [2, 27, 30]. Nonetheless, the lubricity-enhancing effect ofincreasing ester headgroup size on the lubricity of biodieselhas been previously discussed [2], and is confirmed in thepresent study. Examination of the wear scars produced byHFRR (60 7C, ASTM D6079) revealed that COEE(132 6 2 mm) displayed enhanced lubricity over COME(159 6 2 mm; Table 2). COME/EE mixtures also exhibitedimproved lubricity over pure COME, with the effect beingmore pronounced in the 1.3 : 1 mixture versus the 2.7 : 1mixture, which is of course attributed to the higher percentageof COEE in the 1.3 : 1 mixture.
3.3.4 Oxidation stability
Biodiesel is considerably more susceptible to autoxidationthan conventional petroleum diesel fuel. Consequently, auto-xidation is a serious threat to the fuel quality of biodiesel. BothASTM D6751 and EN 14214 contain an oxidation stabilityspecification, EN 14112, whereby biodiesel must resist oxi-dation for at least 3 (ASTM D6751) or 6 h (EN 14214). Notonly will biodiesel with poor oxidation stability fail relevantspecifications, but oxidative degradation negatively affects AVand u [31], both of which are specified in ASTM D6751 andEN 14214. As can be seen from Table 2, all samples satisfiedboth ASTM D6751 and EN 14214 requirements. Addition-ally, treatment of fuels with anti-oxidant additives is ubiqui-tous in the fuels industry. Therefore, the influence of a com-mon synthetic anti-oxidant, tert-butyl-hydroquinone(TBHQ), was of interest. As expected, addition of TBHQ at arelatively low load level (100 ppm) significantly enhanced theoxidative stability of each sample (Table 2).
4 Conclusions
In summary, response surface analysis was performed toassess the effects of potassium hydroxide concentration, molarratio of M/E to canola oil, and reaction temperature on thepercentage yield measured at 2.5 and 5.0 min. From statisticalanalysis it was found that catalyst concentration, molar ratio ofM/E to canola oil, and reaction temperature, all significantlyaffected the percentage conversion at 2.5 min. However,reaction temperature did not significantly influence percent-age conversion at 5.0 min. A cut-off time of about 3.5 min wasdetermined by interpolating the average p value and reactiontime data. Hence, reaction temperature significantly affectedthe conversion of canola oil to esters up to 3.5 min and wasinsignificant thereafter. Lastly, COME/EE mixtures exhibitedenhanced low-temperature performance and lubricity prop-erties in comparison to neat COME and also satisfied ASTM
D6751 and EN 14214 standards with respect to oxidationstability, kinematic viscosity, and acid value.
Acknowledgments
The authors are very grateful to the United States Department ofAgriculture for their financial support. The authors also acknowl-edge Benetria Banks for excellent technical assistance and Dr. KarlVermillion for the acquisition of NMR data.
Conflict of interest statement
The authors have declared no conflict of interest.
References
[1] M. G. Kulkarni, A. K. Dalai, N. N. Bakhshi: Transesterifica-tion of canola oil in mixed ethanol/methanol system and use ofesters as lubricative additive. Bioresour Technol. 2007, 98,2027–2033.
[2] G. Knothe: Dependence of biodiesel fuel properties on thestructure of fatty acid alkyl esters. Fuel Proc Technol. 2005, 86,1059–1070.
[3] W. H. Wu, T. A. Foglia, W. N. Marmer, R. O. Dunn, C. E.Goering, T. E. Briggs: Low temperature property and engineperformance evaluation of ethyl and isopropyl esters of tallowand grease. J Am Oil Chem Soc. 1998, 75, 1173–1177.
[4] I. Lee, L. A. Johnson, E. G. Hammond: Use of branched chainesters to reduce the crystallization temperature of biodiesel. JAm Oil Chem Soc. 1995, 72, 1155–1160.
[5] T. A. Foglia, L. A. Nelson, R. O. Dunn, W. N. Marmer: Lowtemperature properties of alkyl esters of tallow and grease. JAm Oil Chem Soc. 1997, 74, 951–955.
[6] W. Zhou, D. G. B. Boocock: Phase distribution of alcohol,glycerol, and catalyst in the transesterification of triglycerides.J Am Oil Chem Soc. 2006, 83, 1047–1050.
[7] W. Zhou, D. G. B. Boocock: Phase behavior of the base-cata-lyzed transesterification of soybean oil. J Am Oil Chem Soc.2006, 83, 1041–1045.
[8] ASTM Standard D6751-07b: Standard Specification for Bio-diesel Fuel Blend Stock (B100) for Middle Distillate Fuels.American Society for Testing and Materials, West Con-shohocken, PA (USA) 2007.
[9] EN 14214: Automotive Fuels – Fatty Acid Methyl Esters(FAME) for Diesel Engines – Requirement Methods. Euro-pean Committee for Standardization, Brussels (Belgium)2003.
[10] AOCS: Fatty acid composition by gas chromatography. In:Official Methods and Recommended Practices of the American OilChemists’ Society. AOCS Press, Champaign, IL (USA) 1989,Method Ce 1–62.
[11] E. Bikou, A. Louloudi, N. Papayannakos: The effect of wateron the transesterification kinetics of cottonseed oil with etha-nol. Chem Eng Technol. 1999, 22, 70–75.
© 2009 WILEY-VCH Verlag GmbH & Co. KGaA, Weinheim www.ejlst.com

Eur. J. Lipid Sci. Technol. 2009, 111, 464–473 Optimization and characterization of canola oil alkyl esters 473
[12] N. Lima da Silva, M. R. W. Maciel, C. B. Batistella, R. M.Filho: Optimization of biodiesel production from castor oil.Appl Biochem Biotechnol. 2006, 130, 405–414.
[13] W. W. Christie: A simple procedure for rapid transmethylationof glycerolipids and cholesteryl esters. J Lipid Res. 1982, 23,1072–1075.
[14] R. Gaita: A reversed phase HPLC method using evaporativelight scattering detection (ELSD) for monitoring the reactionand quality of biodiesel fuels. In: The Application Notebook,Industrial 51. Grace Davison Discovery Sciences (USA) 2006,www.discoverysciences.com/WorkArea/downloadasset.aspx?id=5022.
[15] B. Freedman, E. H. Pryde, T. L. Mounts: Variables affectingthe yields of fatty esters from transesterified vegetable oils. JAm Oil Chem Soc. 1984, 61, 1638–1643.
[16] G. Vicente, A. Coteron, M. Martinez, J. Araci: Application ofthe factorial design of experiments and response surfacemethodology to optimize biodiesel production. Ind Crop Prod.1997, 8, 29–35.
[17] W. Zhou, S. K. Konar, D. G. B. Boocock: Ethyl esters fromthe single-phase base-catalyzed ethanolysis of vegetable oils. JAm Oil Chem Soc. 2003, 80, 367–371.
[18] R. L. Mason, R. F. Gunst, J. L. Hess: Designs and analyses forfitting response surfaces. In: Statistic Design and Analysis ofExperiments: With Applications to Engineering and Science. 2nd
Edn. John Wiley & Sons, New York, NY (USA) 1989, pp568–606.
[19] ATSM Standard D5773: Standard Test Method for Cloud Pointof Petroleum Products (Constant Cooling Rate Method). Amer-ican Society for Testing and Materials, West Conshohocken,PA (USA) 2007.
[20] ASTM Standard D5949: Standard Test Method for Pour Pointof Petroleum Products (Automatic Pressure Pulsing Method).American Society for Testing and Materials, West Con-shohocken, PA (USA) 2001.
[21] ASTM Standard D6371: Standard Test Method for Cold FilterPlugging Point of Diesel and Heating Fuels. American Societyfor Testing and Materials, West Conshohocken, PA (USA)2005.
[22] ATSM Standard D445: Standard Test Method for KinematicViscosity of Transparent and Opaque Liquids (and Calcula-tion of Dynamic Viscosity). American Society for Testing andMaterials, West Conshohocken, PA (USA) 2006.
[23] ASTM Standard D6079: Standard Test Method for Evaluat-ing Lubricity of Diesel Fuels by the High-Frequency Reci-procating Rig (HFRR). American Society for Testing andMaterials, West Conshohocken, PA (USA) 2004.
[24] EN 14112: Fat and Oil Derivatives. Fatty Acid Methyl Esters(FAME). Determination of Oxidation Stability (AcceleratedOxidation Test). European Committee for Standardization,Brussels (Belgium) 2003.
[25] AOCS: Acid value. In: Official Methods and RecommendedPractices of the American Oil Chemists’ Society. AOCS Press,Champaign, IL (USA) 1989, Method Cd 3d–63.
[26] I. U. Benjamin, O. P. David, H. M. Kefas, E. O. Onche:Determination of optimal catalyst concentration for max-imum biodiesel yield from tigernut (Cyperus esculentus) oil.Leonardo J Sci. 2007, 10, 131–136.
[27] G. Knothe, J. Krahl, J. Van Gerpen (Eds.): The BiodieselHandbook. AOCS Press, Champaign, IL (USA) 2005.
[28] J. M. Encinar, J. F. Gonzalez, A. Rodriguez-Reinares: Etha-nolysis of used frying oil. Biodiesel preparation and charac-terization. Fuel Process Technol. 2007, 88, 513–522.
[29] R. Sridharan, I. M. Mathai: Transesterification reactions. J SciInd Res. 1974, 22, 178–187.
[30] G. Knothe, K. R. Steidley: Lubricity of components of bio-diesel and petrodiesel. The origin of biodiesel lubricity. EnergFuel 2005, 19, 1192–1200.
[31] M. Canakci, A. Monuem, J. Van Gerpen: Accelerated oxida-tion processes in biodiesel. Trans ASAE 1995, 43, 1203–1208.
© 2009 WILEY-VCH Verlag GmbH & Co. KGaA, Weinheim www.ejlst.com