bioenergia pdd validation - netinform · project design document form (cdm pdd) - version 03.1. cdm...
TRANSCRIPT

PROJECT DESIGN DOCUMENT FORM (CDM PDD) - Version 03.1. CDM – Executive Board page 1
CLEAN DEVELOPMENT MECHANISM PROJECT DESIGN DOCUMENT FORM (CDM-PDD)
Version 03 - in effect as of: 28 July 2006
CONTENTS A. General description of project activity B. Application of a baseline and monitoring methodology C. Duration of the project activity / crediting period D. Environmental impacts E. Stakeholders’ comments
Annexes Annex 1: Contact information on participants in the project activity Annex 2: Information regarding public funding Annex 3: Calculation inputs
Annex 4: Monitoring information
Annex 5: Sensitivity analysis Annex 6: Project boundary

PROJECT DESIGN DOCUMENT FORM (CDM PDD) - Version 03.1. CDM – Executive Board page 2 SECTION A. General description of project activity A.1 Title of the project activity: >> Bioenergia Anaerobic Digestion and Biogas Generation Project Version 01 12 December 2007 A.2. Description of the project activity: >> The Bioenergia Anaerobic Digestion and Biogas Generation Project (hereafter, the “Project”) developed by Bioenergia1 (hereafter referred to as the “Project Developer”) is an anaerobic digestion and biogas generation project in the department of Escuintla, Guatemala, hereafter referred to as the “Host Country”. The Bioenergia Project will consist of the installation of an anaerobic digestion plant at the Servicios Manufactureros (SEMA) distillery site to utilize the distillery’s wastewater- also referred to as vinasse or spentwash- to produce biogas. The biogas generated will be fed into the boilers currently used by SEMA to produce steam to run its operations. SEMA’s operations consist of the production of industrial grade alcohol through the fermentation of molasses- the by-product of sugar refining- supplied by a neighbouring sugar mill (Ingenio Magdalena). SEMA is one of the largest distilleries in Guatemala and Central America. Operating since 2002, the facility produces beverage and industrial grade alcohol that is exported to Europe. SEMA has a capacity to produce approximately 120,000 litres of alcohol per day, which yields a flow of vinasse of 1440 m3/day. With an estimated operation of 310 days annually, the facility generates an average of 446,400 m3 of vinasse per year. In order to treat this wastewater, the SEMA distillery currently uses an open 32 lagoon-based waste water treatment system that has biochemical and hydrodynamic properties favourable to the anaerobic bacterial activity. In addition, the facility utilizes a bunker oil fuelled boiler - which emits carbon dioxide (CO2) during combustion - to produce steam. The Bioenergia Anaerobic Digestion and Biogas Generation Project will reduce the CH4 and CO2 emissions generated by SEMA by diverting the vinasse to an anaerobic digester. The biodigester will allow for the capture of biogas, one of the products of the anaerobic digestion. The biogas will be used for heat generation and thus will displace the consumption of heavy fuel oil used to generate steam for the distillery. Surplus biogas, where produced, will be flared rather than released to the atmosphere. The flare will be used occasionally, during stand-by or emergency situations. The low organic matter wastewater discharge that remains after the treatment process will be pumped through pipelines to the surrounding sugarcane plantations for ferti-irrigation. 1 Bioenergia is the Guatemalan registered company created by UEM Group for the purpose of owning and operating the Anaerobic Digestion biogas plant system.

PROJECT DESIGN DOCUMENT FORM (CDM PDD) - Version 03.1. CDM – Executive Board page 3
Baseline Scenario Project Intervention
Wastewater Treatment
Vinasse from distillery process- high in COD- is treated via a lagoon system, producing a significant amount of biogas methane
An anaerobic digestor will be installed to treat the wastewater, dramatically reducing its levels of COD prior to its release to the current pond system for discharge of treated waters for ferti-irrigation
Industrial Activities
Use of heavy fuel oil to produce steam for the production of industrial alcohol from molasses
Use of renewable, sustainably produced biogas in dual fuel burner system to ensure heating energy self sufficiency
The Bioenergia Anaerobic Digestion and Biogas Generation Project will therefore result in a number of positive environmental and socio-economic impacts for Guatemala, which are provided below: • The project will act a “first of its kind” clean technology demonstration project, easily to be replicated
across Guatemala and the Central American region. • It will transfer new technology, skills and knowledge to the country. • Bioenergia will act as an important capacity building project, nationally and locally, especially
demonstrating the use of a new financial mechanism for funding of the renewable energy and waste management sector via the CDM.
• The project will diversify the sources of and security of energy supplied through energy self-sufficiency. Using methane to generate clean electricity and/or heat on-site will reduce dependence on a dirty and non-renewable commodity and will show that energy can be produced sustainably.
• It will provide energy access outside the grid, in a place where there are more difficulties to have access to electricity
• It will additionally create over 60 temporary employment opportunities during construction of the AD plant and 6-9 permanent employment opportunities during operation.
• The project will eliminate potential odour and presence of bugs in surrounding areas, which will improve living standards of neighbouring communities.
• Bioenergia will improve the quality of the water used in the project scenario for irrigation of surrounding land.
• The project will lead to an overall decrease in the amount of Green House Gases (GHGs) emissions.

PROJECT DESIGN DOCUMENT FORM (CDM PDD) - Version 03.1. CDM – Executive Board page 4 A.3. Project participants: >> Table 1 - Project participants
Name of party involved (*) ((host) indicates a host party)
Private and/or public entity(ies) Project participants (*)
(as applicable)
Kindly indicate if the party involved wishes to be considered as project
participant (Yes/No)
Guatemala (host) Bioenergia S.A. (private entity) No United Kingdom of Great Britain and Northern Ireland
EcoSecurities Group Plc (private entity)
No
(*) In accordance with the CDM modalities and procedures, at the time of making the CDM-PDD public at the stage of validation, a Party involved may or may not have provided its approval. At the time requesting registration, the approval by the Party(ies) involved is required. A.4. Technical description of the project activity: A.4.1. Location of the project activity: A.4.1.1. Host Party(ies): >> Guatemala. (The “Host Country”) A.4.1.2. Region/State/Province etc.: >> Department of Escuintla A.4.1.3. City/Town/Community etc: >> La Democracia A.4.1.4. Detail of physical location, including information allowing the unique identification of this project activity (maximum one page): >> The Bioenergia project will be implemented at the Servicios Manufacturers S.A. industrial facility, located at KM 105, Carretera al Parcelamiento, Los Angeles, Interior Finca Buganvilla, La Democracia, Escuintla, Guatemala, C.A. GPS Coordinates The coordinates for the Bioenergia Anaerobic Digestion and Biogas Generation Project are: Latitude 14° 7' 1" North, Longitude 90° 55' 40" West.
PROJECT DESIGN DOCUMENT FORM (CDM PDD) - Version 03.1. CDM – Executive Board page 5 A.4.2. Category (ies) of project activity: >> According to Annex A of the Kyoto Protocol, this project fits in Sectoral Category 13, Waste Handling and Disposal. A.4.3. Technology to be employed by the project activity: >> The project will involve two important components, each requiring the transfer of new technology:
Methane Mitigation: The primary emissions reduction is related to the methane emissions avoidance through a New Anaerobic Water Treatment Facility (NAWTF). This component stems from capturing fugitive methane emissions through four low rate anaerobic digesters, which have each a Hydraulic Retention Time (HRT) of 32 days and a volume of 10,410 m3. These tanks are made of steel or concrete, and are sealed at the top with a special geo membrane which acts as a cover as well as a gas holder. This geo membrane, which is made of resistant polymeric material, prevents the biogas from escaping the anaerobic digestion process within the tanks. In addition to the methane capture facility, an auxiliary tank will be installed at the outlet of the digesters in order to reduce the hydrogen sulphides concentration. Downstream the NAWTF, a system of pipes and pumps will move the biogas from the digester tanks to the two Bono steam-matic boilers and the rest to the flare. Other equipment that will be included as part of the anaerobic digestion system include:
• Settling tanks • Wastewater transfer pumps to anaerobic digesters • Dewatering pumps • Biogas blowers • Recycling pumps Fuel switching to use Biogas: Two Bono steam-matic boilers will be employed to enable the generation of steam from biogas rather than the bunker C heavy fuel oil used in the baseline to steam consumed by the distillery. The biogas generated by the project will cover a fraction of the distillery’s steam consumption and the amount of fuel displaced will be proportional to the amount of steam produced from biogas.

PROJECT DESIGN DOCUMENT FORM (CDM PDD) - Version 03.1. CDM – Executive Board page 6 Process Flow Diagram
Source: UEM Group Inc.
A.4.4 Estimated amount of emission reductions over the chosen crediting period: >> In the absence of the project, fugitive emissions of methane from the lagoon system and direct CO2 emissions from the use of bunker-fuelled boilers would continue unabated. The project will engineer a more sustainable water waste treatment solution that reduces fugitive methane emissions and CO2 emissions by providing biogas for electricity generation. The table below provides an estimation of the emissions reductions expected from this project for the chosen crediting period of 7 years. Table 2 - Estimated Emissions Reductions from the Project

PROJECT DESIGN DOCUMENT FORM (CDM PDD) - Version 03.1. CDM – Executive Board page 7
Emissions reductions
YearsAnnual estimation of emissions reductions
(tonnes of CO2e)
2008 (8 months) 70,0022009 105,0032010 105,0032011 105,0032012 105,0032013 105,0032014 105,003
Total Estimated Reductions (tonnes of CO2e) 630,019
Total Number of Crediting Years 7
Annual average of the crediting period of emissions reductions (tonnes of CO2e) 90,003
A.4.5. Public funding of the project activity: >> The project will not receive any public funding from Parties included in Annex I of the UNFCCC. SECTION B. Application of a baseline and monitoring methodology B.1. Title and reference of the approved baseline and monitoring methodology applied to the
project activity: >> The project uses approved methodology AM0022: Avoided Wastewater and On-site Energy Use Emissions in the Industrial Sector, Version 4, dated 22 December 2006. B.2 Justification of the choice of the methodology and why it is applicable to the project
activity: >> AM0022 specifically focuses on wastewater fugitive methane abatement through anaerobic digestion in an industrial context which corresponds to the project activity. The project activity meets all the applicability criteria listed below. Methodology applicability

PROJECT DESIGN DOCUMENT FORM (CDM PDD) - Version 03.1. CDM – Executive Board page 8 • Project is implemented based upon a baseline of existing lagoon-based industrial wastewater
treatment facilities for wastewater with high organic loading; -SEMA currently uses an anaerobic lagoon system to manage the high organic load of the wastewater.
• The organic wastewater contains simple organic compounds (monosaccharide); -Wastewater analyses for SEMA indicate that the wastewater stream is primarily composed of monosaccharides.
• The methodology is applicable only to the improvement of existing wastewater treatment facilities. It is not applicable for new facilities to be built, or new build to extend current site capacity;
-The lagoon system managed by SEMA has been in operation since the distillery began to operate two years ago.
• It can be shown that the baseline is the continuation of a current lagoon system for managing wastewater. In particular, the current lagoon-based system is in full compliance with existing rules and regulations;
-The existing lagoon system is in full compliance with current regulations in Guatemala2. Please refer to section B.4 for more details about how to determine that the baseline is the continuation of the current lagoon system.
• The depth of the anaerobic lagoon should be at least 1 m; -The depths of the anaerobic lagoons are greater than 1 m; they range from 1.2 to 1.75 meters and are on average 1.5 meters deep.
• The temperature of the wastewater in the anaerobic lagoons is always at least 15 °C; -The temperature of the wastewater in the anaerobic lagoon is always greater than 15 °C and reaches a maximum of 85°C at the first discharge into the lagoon system.
• In the project, the biogas recovered from the anaerobic treatment system is flared and/or used onsite for heat and/or power generation, surplus biogas is flared;
-Biogas is used onsite in the facility’s boilers to generate steam for the distillery. Surplus biogas is flared.
• Heat and electricity needs per unit input of the water treatment facility remain largely unchanged before and after the project;
-Heat and electricity needs per unit input of the water treatment facility are unchanged. • Data requirements as laid out in the related Monitoring Methodology are fulfilled. In particular,
organic materials flow into and out of the considered lagoon based treatment system and the contribution of different removal processes can be quantified (measured or estimated).
-The monitoring plan based on the Monitoring Methodology will be implemented onsite and data requirements will be fulfilled.
The project activity meets all the conditions above and is therefore applicable to the methodology. B.3. Description of the sources and gases included in the project boundary >>
2 Acuerdo Gubernativo 236-2006, Reglamento de las Descargas y Residuos de Aguas Residuales y de la Disposición de Lodos (Governmental Agreement 236-2006, Regulations for the Discharges and Residues in Residual Waters and Mud Diposal)

PROJECT DESIGN DOCUMENT FORM (CDM PDD) - Version 03.1. CDM – Executive Board page 9 The following project activities and emission sources are considered within the project boundaries encompassed by AM0022:
• Methane emissions from the existing lagoon-based waste water treatment system up to, and
including, the point at which organic material flows can be quantified or estimated into and out of the wastewater treatment facility;
• Potential methane emissions from the newly introduced anaerobic waste water treatment facility; • CO2 emissions from displaced fossil fuel used for on site heat generation; • Methane emissions from incomplete combustion of biogas in heat and/or power generation or in
flare systems, or from leakage in piping. • Fugitive methane emissions from the boiler
As stipulated by AM0022, ignored emissions include: nitrous oxide from the waste treatment system, and nitrous oxide from biogas combustion and/or destruction.
The following project activities and emission sources are considered within the project boundaries, as in accordance with AM0022 (Please refer to Annex 6 for the simplified process flow diagram including the Project Activity boundary). Table 3: Sources and Gases included in the Project Source Gas Included? Justification/Explanation
CO2 No CO2 is not considered in the lagoon-based wastewater treatment.
CH4 Yes CH4 is considered in the lagoon-based wastewater treatment.
Existing lagoon-based waste water treatment system
N2O No Not applicable CO2 Yes CO2 is considered in the emissions
from displaced fossil fuel. CH4 No. CH4 is not considered in the
emissions from displaced fossil fuel.
Bas
elin
e
Emissions from displaced fossil fuel use for onsite heat generation
N2O No Not applicable CO2 No CO2 from the lagoons is not a
source of project emissions. CH4 Yes CH4 from the lagoons is a source of
project emissions.
Existing lagoon-based waste water treatment system
N2O No Not applicable CO2 No CO2 from combustion is not
accounted for in Project Emissions.
Proj
ect A
ctiv
ity
Fugitive Emissions from the Flare
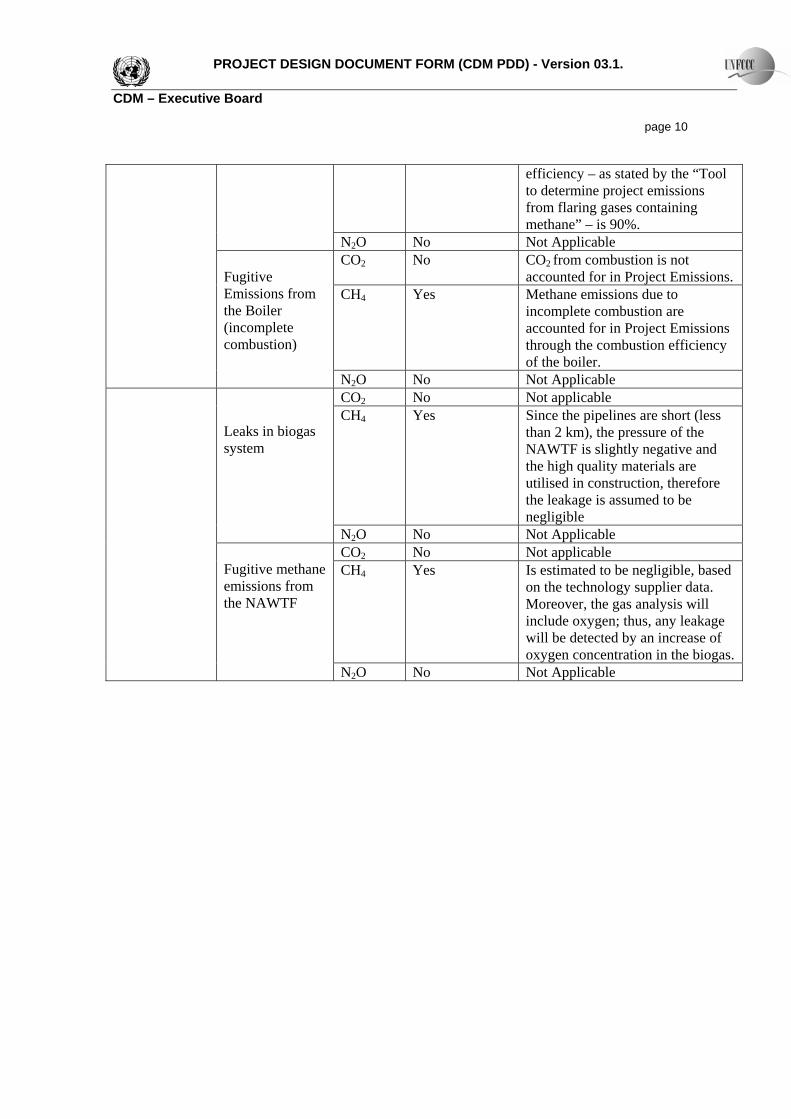
CH4 Yes Potential methane emissions due to incomplete combustion are accounted for in Project Emissions. As the project activity utilises an enclosed flare, the default flare
PROJECT DESIGN DOCUMENT FORM (CDM PDD) - Version 03.1. CDM – Executive Board page 10
efficiency – as stated by the “Tool to determine project emissions from flaring gases containing methane” – is 90%.
N2O No Not Applicable CO2 No CO2 from combustion is not
accounted for in Project Emissions. CH4 Yes Methane emissions due to
incomplete combustion are accounted for in Project Emissions through the combustion efficiency of the boiler.
Fugitive Emissions from the Boiler (incomplete combustion)
N2O No Not Applicable CO2 No Not applicable CH4 Yes Since the pipelines are short (less
than 2 km), the pressure of the NAWTF is slightly negative and the high quality materials are utilised in construction, therefore the leakage is assumed to be negligible
Leaks in biogas system
N2O No Not Applicable CO2 No Not applicable CH4 Yes Is estimated to be negligible, based
on the technology supplier data. Moreover, the gas analysis will include oxygen; thus, any leakage will be detected by an increase of oxygen concentration in the biogas.
Fugitive methane emissions from the NAWTF
N2O No Not Applicable
PROJECT DESIGN DOCUMENT FORM (CDM PDD) - Version 03.1. CDM – Executive Board page 11 B.4. Description of how the baseline scenario is identified and description of the identified baseline scenario: >> The baseline was determined according to the six-step process established in AM0022 which is listed below: Step 1: List a range of potential baseline options Step 2: Select the barriers from the range of potential barriers Step 3: Score the barriers Step 4: Compare which is the most plausible baseline option Step 5: Investment analysis Step 6: Conclusion Step 1: List a range of potential baseline options Five alternative baseline scenarios were tested for the Project activity, as according to AM0022 version 04. The contemplated scenarios were the following:
1. Continuation of current practices (business as usual - BAU); 2. Direct release of wastewaters to an offsite water way; 3. Direct release to surrounding plantations (ferti-irrigation) 4. Aerobic treatment of wastewaters (activated sludge or filter bed type treatment) and post-
treatment ferti-irrigation; 5. The proposed project activity undertaken without being registered as a CDM project
activity. Step 2: Select the barriers from the range of potential barriers According to AM0022, five barrier types which could prevent the implementation of the project can be considered. The barriers are listed below:
1. Legal barriers 2. Technical barriers 3. Financial barriers 4. Social barriers 5. Business culture barriers
Step 3: Score the barriers For each of the barriers identified in Step 2 one or several questions are addressed in order to determine the baseline scenario. 1. Legal barrier
• Does the practice violate any host country laws or regulations or is it not in compliance with them?

PROJECT DESIGN DOCUMENT FORM (CDM PDD) - Version 03.1. CDM – Executive Board page 12 Three of the above mentioned alternatives (1, 4, and 5) are in compliance with all mandatory applicable legal and regulatory requirements in Guatemala3,4 and are therefore legally realistic and credible alternative scenarios. Current practice, aerobic and anaerobic treatment of wastewater in a lagoon system for COD removal purposes would represent legal management options and would not be subject to additional regulation, other than the same effluent release standards applicable to the current pond systems. Regarding scenarios 2 and 3, they are both in violation of Guatemalan legislation, since direct release of wastewater to either an offsite waterway or for ferti-irrigation purposes is prohibited by the national legislation5. Hence, legal barrier for these two cases are considered absolute barriers. Therefore both scenarios are considered not viable, and will no longer be discussed in the barrier analysis. Are there legal barriers to alternative baseline practices?
• Business as usual (BAU): No. The activity complies with all national regulations. • Direct release of wastewaters to offsite water way: Yes. Guatemalan law prohibits the release
of wastewater to water-bodies. This option will no further be discussed in the barrier analysis. • Direct release to surrounding plantations (ferti-irrigation): Yes. This option opposes also to
what is stated in Guatemalan law therefore it will not be discussed further in the barrier analysis. • Aerobic treatment of wastewaters (activated sludge or filter bed type treatment) and post-
treatment ferti-irrigation: No. There is no law establishing a specific waste management practice.
• The proposed project activity undertaken without being registered as a CDM project activity: No. There is no law establishing a specific waste management practice.
2. Technical barriers
• Is this technology option currently difficult to purchase through local equipment suppliers? • Are skills and labour to operate and maintain this technology in country insufficient? • Is this technology outside common practice in similar industries in the country? • Is performance certainty not guaranteed within tolerance limits? • Is there real, or perceived, technology risk associated with the technology?
Alternative 1 (BAU) The continuation of the current practice is the most plausible scenario, since it is the most common practice of handling wastewater from similar processes producing it in the region. The use of an open lagoon system is a common practice not only in Guatemala but in many parts of the world since it is a simple wastewater management system, cheap, accessible, and easy to operate. For instance, according to
3Decreto Legislativo 68-86, Ley de Protección y Mejoramiento al Medio Ambiente y sus Reformas (Legislative Decree 68-86, Environmental Protection and Improvement and its Amendments) 4 Acuerdo Gubernativo 236-2006, Reglamento de las Descargas y Residuos de Aguas Residuales y de la Disposición de Lodos (Governmental Agreement 236-2006, Regulations for the Discharges and Residues in Residual Waters and Mud Diposal) 5 Ibid. (see Chapter 7 Parameters for the Reuse of Water)
PROJECT DESIGN DOCUMENT FORM (CDM PDD) - Version 03.1. CDM – Executive Board page 13 the last survey of wastewater situation in Guatemala, among the 44 wastewater treatment facilities registered in the municipalities of Guatemala, 30 are lagoon based and 10 include primary treatment6. In Latin America, about 15% of collected wastewater passes through treatment plants (with varying levels of actual treatment), the rest of it being treated through lagoon systems or directly released to fields7. Since the lagoon systems are simpler than any other wastewater systems, and since they are the common practice in Guatemala and Latin America, it can be concluded that lagoon based system is the business as usual scenario and therefore it is the most plausible scenario in the absence of the Project Activity. Alternative 4: Aerobic treatment of wastewaters Although there is the alternative of treating the wastewater aerobically, it is not a common practice in the country7 currently since it implies several difficulties in operation and maintenance, and requires specialized human resources. Aerobic treatment systems are complex to control and costly due to the high energy requirement (oxygen needs to be injected, which requires higher amount of electrical energy) and a large volume of sludge is produced8. Oxygen is supplied to the system through a controlled mechanical process; the necessary operating and maintenance of this mechanical system is much greater than that of the use of anaerobic lagoons, which only implies pumping the waste water from one lagoon to another. Furthermore, the significant amount of sludge generated by aerobic systems must be disposed of. Alternative 5: Proposed Project Activity without CDM A similar situation occurs with anaerobic treatment systems for wastewater. This kind of technology is not available locally, and its implementation in this project will make it become a pioneer in the use of this type of technology in the region. AD systems are perceived as relatively high risk, being based upon the function of a biological system that is neither 100% characterised, nor performance guaranteed. The biological system is very sensitive to the changes in the chemical composition that can interfere with the anaerobic bacteria and subsequently the methane generation as well as energy production regimes8. These harmful changes can be caused by a host of problems such as mismanagement of the biodigester or mixing pond, improper recycling of the wastewater or the introduction of chemical agents into the system. AD systems require constant and ongoing precise management of a variety of elements, water flows, pH, etc. The proposed Project Activity also includes biogas steam generation. Since there is neither natural gas production nor consumption in Central America9, the Central American countries currently rely upon fossil fuels such as diesel and fuel oil and the related technologies to produce thermal or electrical energy. Since these technologies operate at high operating temperature and pressure, and imply various risks of leakage and uncontrolled combustion, gas -or biogas- steam generators require specialized human resources, security procedures as well as specific control and automatization equipment. Since there is no energy generation from gas in Central America, none of this equipment, skills or procedures has been developed in the region, which makes the implementation of this type of technology even more difficult. 6 Panamerican Health Organization, Inventario de la situación actual de las aguas residuales domesticas en Guatemala (Inventory of the current situation of domestic wastewater in Guatemala), 2003 7 Appropriate Technology for Sewage Pollution Control in the Wider Caribbean Region, Caribbean Environment Programme Technical Report #40, 1998 8 Parr, J., Smith, M.D. and Shaw, R.J., ''Wastewater Treatment Options'', Waterlines, the Journal of Appropriate Technologies for Water Supply and Sanitation, April 2000 9 Energy Information Administration, Official Energy Statistics from the U.S. Government, http://tonto.eia.doe.gov
PROJECT DESIGN DOCUMENT FORM (CDM PDD) - Version 03.1. CDM – Executive Board page 14 Therefore it is considered that alternatives 4 and 5 face considerable technological barriers. 3. Financial barriers
• Is the technology intervention financially less attractive in comparison to other technologies (taking in account potential subsidies, soft loans or tax windows available)?
• Is equity participation difficult to find locally? • Is equity participation difficult to find internationally? • Is technology currency (country) denomination a risk? • Is the proposed project exposed to commercial risk?
Foreign investment is a key factor that facilitates the access to credit in Central America. Guatemala ranks among the lowest in Central America in foreign investment, which makes the access to credit more difficult for the Guatemalan project developers. Represented by the United Nations Conference on Trade and Development as a percentage of gross fixed capital formation, the foreign direct investment (FDI) of Guatemala was 5.9% in 2006. Compared to other countries of Central America (16.7% for Honduras, 22.4% for Nicaragua or 36.7% for Costa Rica)10 Guatemala has the lowest rate of FDI in the region. Having the lowest rate of foreign investment in Central America -and one of the lowest in Latin America- it is more difficult to access foreign credit for a project in Guatemala than in any other country of Central America, especially for a project like Bioenergia which does not represent a “business as usual” scenario in Guatemala, as previously demonstrated in section 2.
Guatemala’s ratio of total savings compared to credit in the country has been historically among the highest in Central America11. Guatemala has the highest ratio of year 2006, among all Central American countries, which means Guatemala has the least access to credit compared to the total savings. This signifies less availability of bank credits and subsequently increases the difficulty of getting a loan. Since renewable energy projects are not the business as usual in Guatemala, they are perceived as more risky; hence it is even more difficult to access credit for these types of projects. It is still difficult to break that perception, because the majority of energy projects in Guatemala are fossil fuel based. Indeed, few renewable energy projects have been implemented in the last few years, and less for power generation: since 2003, 80% of the Guatemalan grid new generation plants operate with non renewable energy12. The Governmental Agreement 211-2005 - Regulation of the Law of Incentives for the Development of Renewable Energy Projects mainly focuses on electricity generation from different types of renewable energy13. Hence, only the projects whose main objective is electricity generation from renewable
10 United Nations Conference on Trade and Development, World Investment Report 2007 ; www.unctad.org/wir or www.unctad.org/fdistatistics
11 Secretaria Ejecutiva del Consejo Monetario Centroamericano (Executive Secretary of Central American Monetary Council), Bank indicators, http://www.secmca.org/Estadisticas_Indicadores_Ban.htm 12 Grid data from Dirección General de Energía, and the Administración del Mercado Mayorista 13 Acuerdo Gubernativo 211-2005 - Reglamento de la Ley de Incentivos para el Desarrollo de Proyectos de Energía Renovable – Artículo 3 (Governmental Agreement 211-2005 Regulation of the Law of Incentives for the Development of Renewable Energy Projects – Article 3)
PROJECT DESIGN DOCUMENT FORM (CDM PDD) - Version 03.1. CDM – Executive Board page 15 resources are eligible to get incentives. However, the projects in which only thermal energy is generated –as Bioenergia- do not receive any direct incentives, even though they are displacing onsite fossil fuel. There is no other initiative that provides incentives for thermal energy generated by renewable sources. Bioenergia project developers have faced obstacles both at the domestic and international levels when seeking financing and after approaching a number of different local banks, and funds. The developers constantly encountered either reluctance about investing in the project mainly because the lack of understanding of the project, but also because of the developers, as a new business, were not able to meet unfavourable terms and conditions that financers required. Among the financial institutions approached, only one formal proposal was submitted to the developers. This proposal consisted of starting the disbursement of funds to Bioenergia as soon as they completed their other loan obligations in 2007. However, even this offer could not be accepted as it was not suitable for Bioenergia’s project timeline. Finally the financing was partially obtained from the Central American Renewable Energy and Cleaner Production Facility (CAREC), which is a fund that is managed by E+Co Capital. E+Co considered the potential revenues from carbon credits as a major factor in the decision process of going ahead with the investment. 4. Social barrier
• Is the understanding of the technology low in the host country/industry considered?
Scenario 1 is the current practice and a common practice in the region, and no social barriers have been identified. For scenarios 4 and 5, certain social barriers are present. These barriers are related mainly to the reluctance of nearby communities to the implementation of projects that involve new technologies even though these may result in important benefits in several aspects (environmental, social, etc.). Nevertheless these could be overcome through the dissemination of proper information regarding the project in public awareness campaigns and consultations such as the one performed in the EIA (for more information consult section E). 5. Business culture barrier
• Is there reluctance to change to alternative management practices in the absence of regulation?
The business culture ideology for sugar mills in Guatemala can be summarized as being able to comply with local regulations at the least cost possible. Regarding scenarios 4 and 5 since there is no need to perform modifications to current wastewater treatment there are a lot of risks implied in implementing a new technology, and the investment would most likely be made in other sectors of the mill operation considered more important than wastewater treatment (eg. productivity improvements, transportation, etc.). The sum of the barriers previously demonstrated (legal, technical, financial and social) creates a business culture barrier in which the owners show reluctance to perform major investments on new, risky technologies when they can continue BAU in full compliance with applicable laws and at a continued low cost. For the above mentioned, business culture issues are considered a barrier for scenarios 4 and 5 (aerobic and enclosed anaerobic treatment respectively).
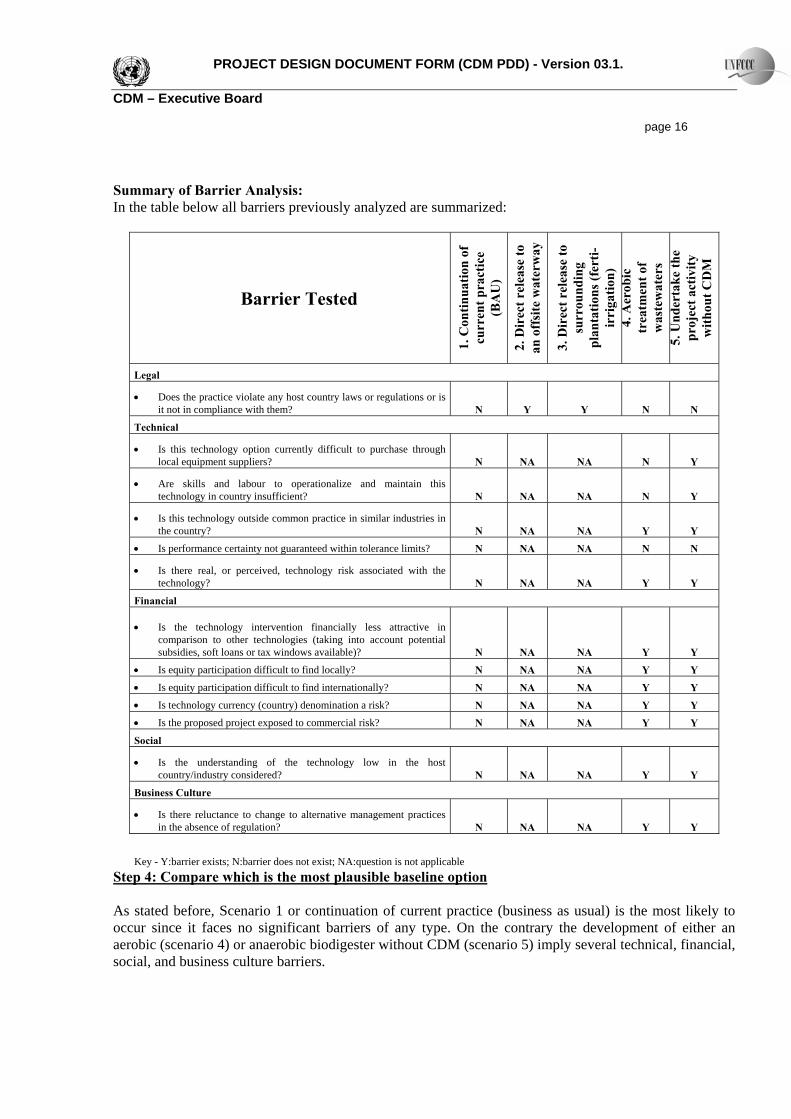
PROJECT DESIGN DOCUMENT FORM (CDM PDD) - Version 03.1. CDM – Executive Board page 16 Summary of Barrier Analysis: In the table below all barriers previously analyzed are summarized:
Barrier Tested
1. C
ontin
uatio
n of
cu
rren
t pra
ctic
e (B
AU
)
2. D
irec
t rel
ease
to
an o
ffsi
te w
ater
way
3. D
irec
t rel
ease
to
surr
ound
ing
plan
tatio
ns (f
erti-
irri
gatio
n)
4. A
erob
ic
trea
tmen
t of
was
tew
ater
s 5.
Und
erta
ke th
e pr
ojec
t act
ivity
w
ithou
t CD
M
Legal
• Does the practice violate any host country laws or regulations or is it not in compliance with them? N Y Y N N
Technical
• Is this technology option currently difficult to purchase through local equipment suppliers? N NA NA N Y
• Are skills and labour to operationalize and maintain this technology in country insufficient? N NA NA N Y
• Is this technology outside common practice in similar industries in the country? N NA NA Y Y
• Is performance certainty not guaranteed within tolerance limits? N NA NA N N
• Is there real, or perceived, technology risk associated with the technology? N NA NA Y Y
Financial
• Is the technology intervention financially less attractive in comparison to other technologies (taking into account potential subsidies, soft loans or tax windows available)? N NA NA Y Y
• Is equity participation difficult to find locally? N NA NA Y Y • Is equity participation difficult to find internationally? N NA NA Y Y • Is technology currency (country) denomination a risk? N NA NA Y Y • Is the proposed project exposed to commercial risk? N NA NA Y Y
Social
• Is the understanding of the technology low in the host country/industry considered? N NA NA Y Y
Business Culture
• Is there reluctance to change to alternative management practices in the absence of regulation? N NA NA Y Y
Key - Y:barrier exists; N:barrier does not exist; NA:question is not applicable Step 4: Compare which is the most plausible baseline option As stated before, Scenario 1 or continuation of current practice (business as usual) is the most likely to occur since it faces no significant barriers of any type. On the contrary the development of either an aerobic (scenario 4) or anaerobic biodigester without CDM (scenario 5) imply several technical, financial, social, and business culture barriers.
PROJECT DESIGN DOCUMENT FORM (CDM PDD) - Version 03.1. CDM – Executive Board page 17 Step 5: Investment analysis As just one baseline scenario is identified, baseline methodology (AM0022) does not require an investment analysis. Step 6: Conclusion In the baseline scenario analysis, it is demonstrated that scenario 1 (BAU) faces no legal barrier, is inexpensive, low-cost maintenance, and sufficiently effective in achieving COD reduction. It is also shown that there are significant investments, technological and prevailing practice barriers to alternatives, including the proposed project activity. Hence, scenario 1, which represents the continuation of current practice – using the 32 open lagoon system- is identified as the baseline scenario. Due to mandatory legal requirements and investment, technological and prevailing practice barriers, the only realistic and credible alternative is the continuation of this current waste water management practice, as well as the consequent bunker-fuelled boilers. B.5. Description of how the anthropogenic emissions of GHG by sources are reduced below those that would have occurred in the absence of the registered CDM project activity (assessment and demonstration of additionality): >> According to the methodology AM0022, a project is concluded to be additional “if the baseline determination demonstrates that the baseline is different from the proposed activity not undertaken as a CDM project activity”. Since the proposed project activity for Bioenergia is other than the baseline identified in section B.4, it can be concluded that the project is additional. Furthermore, CDM revenues were considered as an important component for the financing of the project since it is difficult to obtain financing from other sources as mentioned above (see section B.4). CDM revenues has been considered from the very beginning of the project viability analysis, and before the Project Activity start date, defined as the earliest of the dates at which the implementation or construction or real action of the project activity begins, which is the signature of the Letter of Intention (2006-02-02). Indeed, the communications between the project developer, technology supplier and E+Co Capital indicate that CDM revenues had been taken into account since the very beginning of the project.

PROJECT DESIGN DOCUMENT FORM (CDM PDD) - Version 03.1. CDM – Executive Board page 18
B.6.1. Explanation of methodological choices: >> All the parameters for which a methodological choice has to be made are presented in this section. As per methodology AM0022, Version 4, emission reductions of the project activity are equal to baseline emission minus project emissions. In accordance with AM0022, leakage is considered to be negligible. The following section is divided into baseline emissions (BE) and project emissions (PE). BASELINE EMISSIONS To estimate baseline emissions the following formula is used:
BLpowerCBLheatCBLlagoonsCHBL EEEE __02__02__4 ++= ECH4_lagoons_BL As per the calculation methodology of AM-0022, ECH4_lagoons_BL comes from various parameters, subject to methodological choices: GWPCH4, EF CH4, Qday, CODin, Alagoon_anaerobic, Mlagoon_aerobic specific, CAin, and Rdep. GWPCH4 is the Global Warming Potential of methane. For this parameter a value of 21 was
considered according to IPCC 2006. EF CH4 is the methane emission factor (kg CH4 / kg COD). A default methane conversion factor
(MCF) of 0.21kg CH4/kgCOD is used. The 2006 IPCC default of 0.25 kg CH4/kg COD has been corrected to 0.21 kg CH4/kg COD to account for uncertainties.
Qday is the daily volume of wastewater entering the system. The value for ex-ante calculation
is 1440 m3/day and has been provided by the project developer based on the historical data.
CODin this parameter determines the amount of organic material present in each litre of
wastewater. The parameter was obtained from the wastewater results performed by two different labs during a three month period and obtaining the average of all the results.
Alagoon_anaerobic this parameter accounts for the total lagoon surface area within the project boundary. The
data provided by the project developer (35.67 ha) represents the total surface of the 32 open anaerobic lagoons.
Mlagoon_aerobic (specific) this parameter establishes the amount of organic material degraded aerobically in
the lagoon system (kg COD). According to methodology AM0022, surface aerobic losses of organic material in the pond based systems equal to 254 kg of COD per hectare of pond surface area and per day. AM0022 also establishes that a sensitivity analysis (refer to Annex 5) must be performed to verify the
B.6. Emission reductions:

PROJECT DESIGN DOCUMENT FORM (CDM PDD) - Version 03.1. CDM – Executive Board page 19
conservative nature of this COD oxidation factor, and to evidence the low sensitivity of the ER calculation to the Mlagoon_aerobic (specific).
CAin is the amount of chemical agents entering the system boundary. Since the mill effluent
contains no chemical agents, the value of this parameter is considered to be 0. Rdep This parameter reflects the ratio at which organic material is deposited in the lagoon. The
parameter was determined according to AM0022 before the project start through on-site testing and laboratory results. The deposition results to be negligible and the value for Rdep is 0%.
ECO2_heat_BL This parameter has been calculated based on the historical values (3 years) of fuel consumption (F) and the associated emission factor for HFO (3.126 tCO2/tHFO14). F is the product of the annual steam production (St) multiplied by the specific fuel consumption (Fsp), in tonnes of bunker per tonnes of steam produced. Both parameters are estimated based on the consumption historical data of three last years. For this project St is 94,278 tonnes/year while Fsp is 0.0807 tbunker/tvapor. ECO2_power_BL This parameter represents the CO2 emissions from on-site fossil power generation in the baseline case (tCO2) that are displaced by generation based on biogas collected in the anaerobic treatment facility, and has been considered to be 0 because there is neither electricity production in the Baseline nor displacement in the Project Activity. PROJECT EMISSIONS To calculate total estimated project emissions the following formula is used:
LeaksICCHNAWTFCHlagoonsCHproject EEEE +++= _4_4_4 ECH4_lagoons
The methodological choices used for this parameter are the following: GWPCH4, EF CH4, Rlagoon, CODin, RNAWTF, Mlagoon_aerobic specific, Alagoon_anaerobic, Mlagoon_chem_ox, and Rdep. The parameters Mlagoon_aerobic specific,
Alagoon_anaerobic, CAin, Rdep, CODin, GWPCH4 and EF CH4 are the same than for baseline calculations.
14The HFO emission factor is obtained with the HFO net calorific value (0.0404 TJ/tfuel) and the HFO emission factor per unit of energy (77.367 tCO2/TJ), both from the IPCC 2006 Guidelines; the resulting emission factor is 3.126 tCO2/tfuel (2006 IPCC)

PROJECT DESIGN DOCUMENT FORM (CDM PDD) - Version 03.1. CDM – Executive Board page 20 Rlagoon this parameter quantifies the organic material removal ratio of the lagoon. A 60% ratio
was obtained from COD testing of wastewater entering and leaving the baseline anaerobic lagoons. Two different samplings campaigns -by two different labs during three different months- have been carried out and the ratios obtained from both have been averaged.
RNAWTF this parameter shows the organic material removal efficiency of the new Project Activity
water treatment facility (NAWTF). A 67% removal ratio was considered according to the project developer’s specifications.
ECH4_NAWTF This parameter accounts for all the fugitive emissions from the new anaerobic wastewater treatment facility which in the case of the Bioenergia project has been assumed to be 0, based on the project developer specifications. Moreover, as mentioned in the monitoring protocol of the present document, the gas analysis monitoring will include oxygen; thus, any leakage will be detected by an increase of oxygen concentration in the biogas and action will be taken accordingly. ECH4_IC+Leaks Since the biogas delivery pipe to the off-taker site is less than 2km, and that high quality materials have been utilised in construction, there is no expectation that there will be significant leaks of methane. Further, pressure tests will be performed by accredited engineering firm in order to measure the integrity of the pipeline. Emissions from inefficient combustion (IC) are summarized as followed. Based on the current operation from Ingenio Magdalena, the source of the wastewater, the total number of operational days is 310, operating 24 hours/day (7440 hr/yr). The parameters subject to methodological choices are the following: Rlagoon the same value that was taken for the parameter ECH4_lagoons
CODin the same value as for baseline emissions %CH4 this value is the percentage of methane in biogas which is considered to be 65%
according to the project developer MVn this value is the volume of one mole of any ideal gas which is 22.414 m3/kmol MM (CH4) molecular mass of methane which is 16.04 kg/mol fheat and fflare percentage of the biogas sent to the flare (fflare) according to the project developer
just 5% of the biogas produced will be flared, which means 95% is assumed to be sent to the boilers (fheat).
Vheat is calculated by multiplying fheat by Vtotal. Vflare is calculated by multiplying fflare by Vtotal.
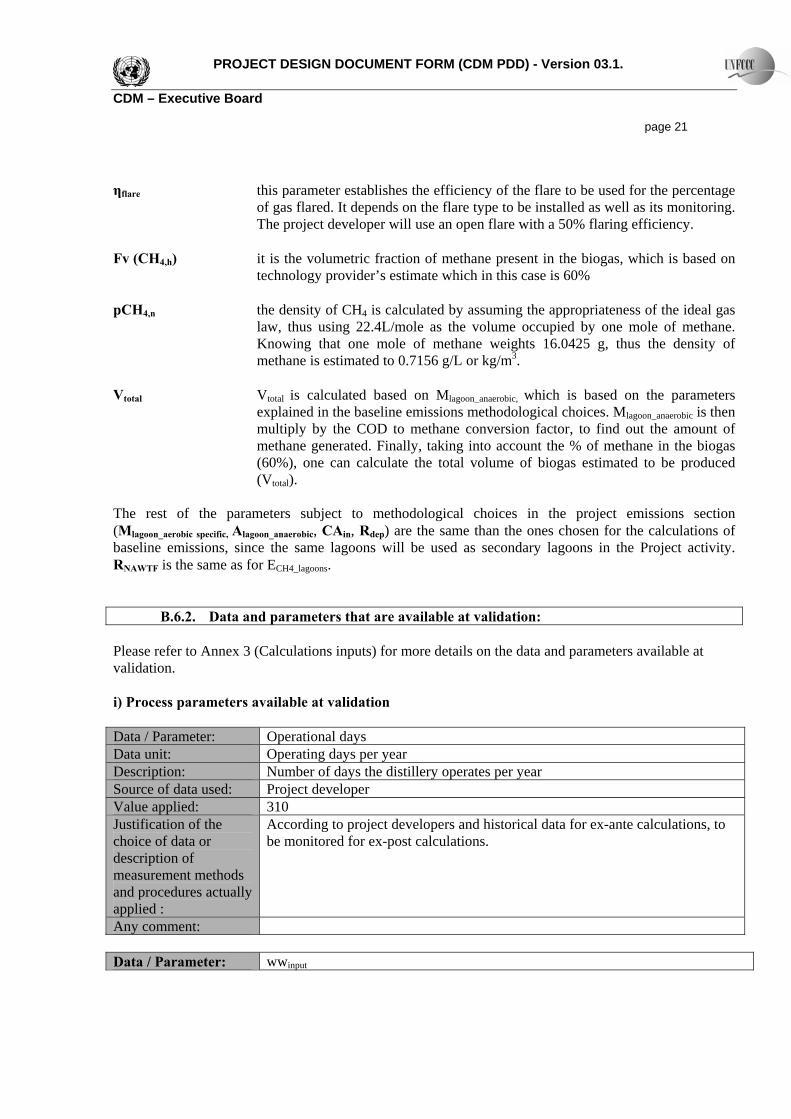
PROJECT DESIGN DOCUMENT FORM (CDM PDD) - Version 03.1. CDM – Executive Board page 21 ηflare this parameter establishes the efficiency of the flare to be used for the percentage
of gas flared. It depends on the flare type to be installed as well as its monitoring. The project developer will use an open flare with a 50% flaring efficiency.
Fv (CH4,h) it is the volumetric fraction of methane present in the biogas, which is based on
technology provider’s estimate which in this case is 60% pCH4,n the density of CH4 is calculated by assuming the appropriateness of the ideal gas
law, thus using 22.4L/mole as the volume occupied by one mole of methane. Knowing that one mole of methane weights 16.0425 g, thus the density of methane is estimated to 0.7156 g/L or kg/m3.
Vtotal Vtotal is calculated based on Mlagoon_anaerobic, which is based on the parameters
explained in the baseline emissions methodological choices. Mlagoon_anaerobic is then multiply by the COD to methane conversion factor, to find out the amount of methane generated. Finally, taking into account the % of methane in the biogas (60%), one can calculate the total volume of biogas estimated to be produced (Vtotal).
The rest of the parameters subject to methodological choices in the project emissions section (Mlagoon_aerobic specific, Alagoon_anaerobic, CAin, Rdep) are the same than the ones chosen for the calculations of baseline emissions, since the same lagoons will be used as secondary lagoons in the Project activity. RNAWTF is the same as for ECH4_lagoons.
B.6.2. Data and parameters that are available at validation: Please refer to Annex 3 (Calculations inputs) for more details on the data and parameters available at validation. i) Process parameters available at validation Data / Parameter: Operational days
Data unit: Operating days per year Description: Number of days the distillery operates per year Source of data used: Project developer Value applied: 310 Justification of the choice of data or description of measurement methods and procedures actually applied :
According to project developers and historical data for ex-ante calculations, to be monitored for ex-post calculations.
Any comment: Data / Parameter: wwinput
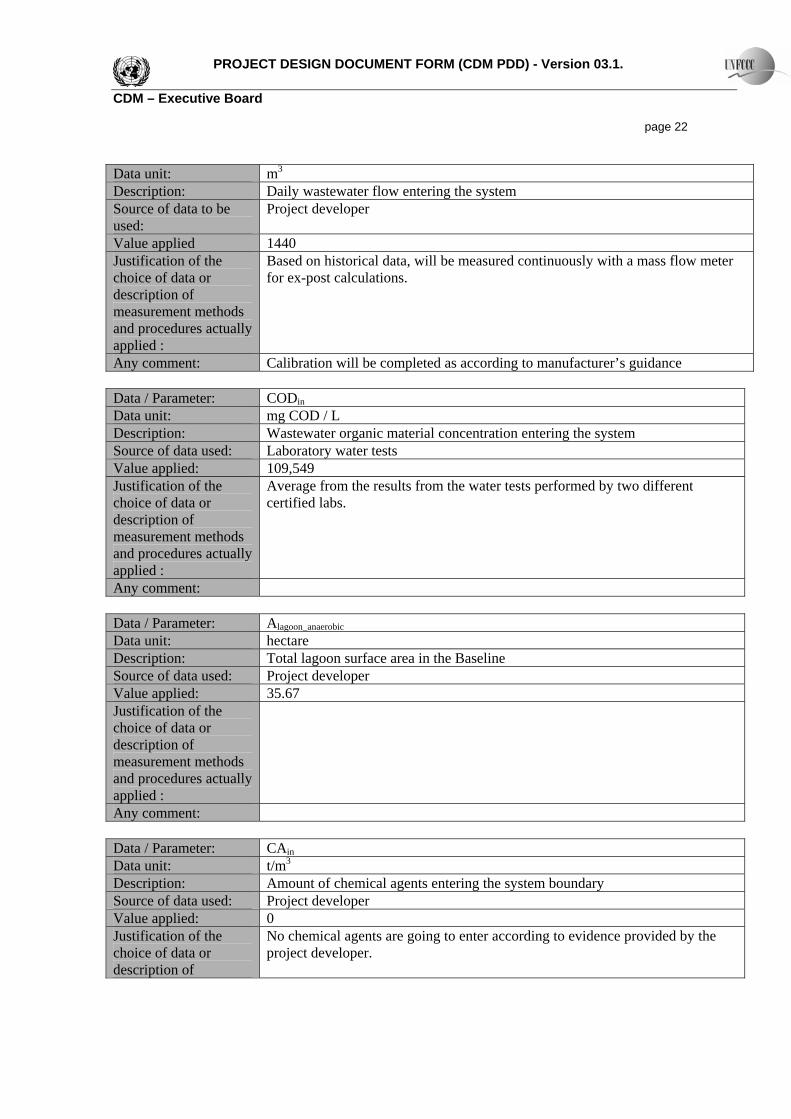
PROJECT DESIGN DOCUMENT FORM (CDM PDD) - Version 03.1. CDM – Executive Board page 22 Data unit: m3 Description: Daily wastewater flow entering the system Source of data to be used:
Project developer
Value applied 1440 Justification of the choice of data or description of measurement methods and procedures actually applied :
Based on historical data, will be measured continuously with a mass flow meter for ex-post calculations.
Any comment: Calibration will be completed as according to manufacturer’s guidance Data / Parameter: CODin
Data unit: mg COD / L Description: Wastewater organic material concentration entering the system Source of data used: Laboratory water tests Value applied: 109,549 Justification of the choice of data or description of measurement methods and procedures actually applied :
Average from the results from the water tests performed by two different certified labs.
Any comment: Data / Parameter: Alagoon_anaerobic Data unit: hectare Description: Total lagoon surface area in the Baseline Source of data used: Project developer Value applied: 35.67 Justification of the choice of data or description of measurement methods and procedures actually applied :
Any comment: Data / Parameter: CAin
Data unit: t/m3 Description: Amount of chemical agents entering the system boundary Source of data used: Project developer Value applied: 0 Justification of the choice of data or description of
No chemical agents are going to enter according to evidence provided by the project developer.

PROJECT DESIGN DOCUMENT FORM (CDM PDD) - Version 03.1. CDM – Executive Board page 23 measurement methods and procedures actually applied : Any comment: Data / Parameter: Rlagoon
Data unit: % Description: Total organic material removal ratio of the lagoon in the Baseline Source of data used: Project developer Value applied: 60 Justification of the choice of data or description of measurement methods and procedures actually applied :
Determined in accordance with AM0022 prior to the start of the project activity through on-site biochemical testing in the lagoon system.
Any comment: Data / Parameter: Rdep
Data unit: % Description: Organic material deposition ratio of the lagoon Source of data used: Project developer Value applied: 0 Justification of the choice of data or description of measurement methods and procedures actually applied :
Determined in accordance with AM0022 prior to the start of the project through on-site testing and laboratory results.
Any comment: Data / Parameter: Fsp
Data unit: tBunker/tvapor Description: Specific fuel consumption Source of data used: Project developer Value applied: 0.0807 Justification of the choice of data or description of measurement methods and procedures actually applied :
Fuel consumed per steam produced based on 3 years historical data.
Any comment: Data / Parameter: St Data unit: Tonnes Description: Annual steam production

PROJECT DESIGN DOCUMENT FORM (CDM PDD) - Version 03.1. CDM – Executive Board page 24 Source of data used: Project developer Value applied: 94,278 Justification of the choice of data or description of measurement methods and procedures actually applied :
Amount of steam produced based on 3 years historical data.
Any comment: Data / Parameter: NCVHFO
Data unit: TJ/t Description: Net calorific value of fuel oil Source of data used: IPCC 2006 Value applied: 0.0404 Justification of the choice of data or description of measurement methods and procedures actually applied :
Default value used.
Any comment: Data / Parameter: EFHFO
Data unit: tCO2/t Description: Emission factor of the HFO in tCO2 per tonnes of fuel Source of data used: IPCC Guidelines 2006 Value applied: 3,126 Justification of the choice of data or description of measurement methods and procedures actually applied :
The HFO emission factor is obtained with the HFO net calorific value (0.0404 TJ/tfuel) and the HFO emission factor per unit of energy (77.367 tCO2/TJ), both from the IPCC 2006 Guidelines; the resulting emission factor is 3.126 tCO2/tfuel (2006 IPCC)
Any comment: Data / Parameter: RNAWTF
Data unit: % Description: Organic material removal efficiency Source of data used: Project developer Value applied: 67 Justification of the choice of data or description of measurement methods and procedures actually applied :
According to project developers
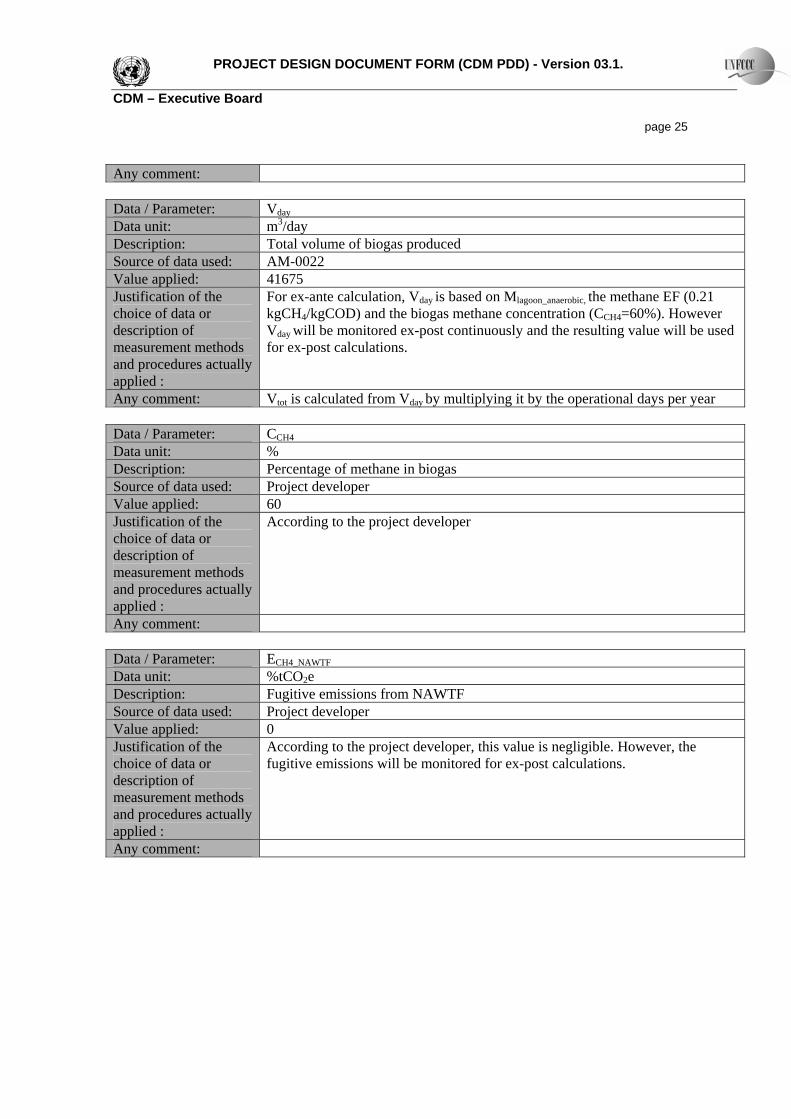
PROJECT DESIGN DOCUMENT FORM (CDM PDD) - Version 03.1. CDM – Executive Board page 25 Any comment: Data / Parameter: Vday
Data unit: m3/day Description: Total volume of biogas produced Source of data used: AM-0022 Value applied: 41675 Justification of the choice of data or description of measurement methods and procedures actually applied :
For ex-ante calculation, Vday is based on Mlagoon_anaerobic, the methane EF (0.21 kgCH4/kgCOD) and the biogas methane concentration (CCH4=60%). However Vday will be monitored ex-post continuously and the resulting value will be used for ex-post calculations.
Any comment: Vtot is calculated from Vday by multiplying it by the operational days per year Data / Parameter: CCH4
Data unit: % Description: Percentage of methane in biogas Source of data used: Project developer Value applied: 60 Justification of the choice of data or description of measurement methods and procedures actually applied :
According to the project developer
Any comment: Data / Parameter: ECH4_NAWTF
Data unit: %tCO2e Description: Fugitive emissions from NAWTF Source of data used: Project developer Value applied: 0 Justification of the choice of data or description of measurement methods and procedures actually applied :
According to the project developer, this value is negligible. However, the fugitive emissions will be monitored for ex-post calculations.
Any comment:

PROJECT DESIGN DOCUMENT FORM (CDM PDD) - Version 03.1. CDM – Executive Board page 26 Data / Parameter: Alagoon_anaerobic Data unit: hectare Description: Total lagoon surface area in the Project Activity Source of data used: Project developer Value applied: 35.67 Justification of the choice of data or description of measurement methods and procedures actually applied :
Any comment: Data / Parameter: Rlagoon
Data unit: % Description: Total organic material removal ratio of the lagoon in the Project Activity Source of data used: Project developer Value applied: 60 Justification of the choice of data or description of measurement methods and procedures actually applied :
Determined in accordance with AM0022 prior to the start of the project activity through on-site biochemical testing in the lagoon system. For ex-ante calculations, the parameter is assumed to be the same for the Baseline and Project Activity, but will be monitored for ex-post calculations.
Any comment: Data / Parameter: flare_fraction Data unit: % Description: Percentage of biogas sent to flare Source of data used: Project developer Value applied: 5 Justification of the choice of data or description of measurement methods and procedures actually applied :
According to project developer for ex-ante calculations, will be monitored for ex-post calculations.
Any comment: Data / Parameter: nflare Data unit: %
Description: Flare efficiency Source of data used: Tool to determine project emissions from flaring gases containing methane Value applied: 50 Justification of the choice of data or
According to the “Tool to determine project emissions from flaring gases containing methane”, the Project activity uses an open flare therefore the 50%

PROJECT DESIGN DOCUMENT FORM (CDM PDD) - Version 03.1. CDM – Executive Board page 27 description of measurement methods and procedures actually applied :
default from the flare tool was used, provided that it can be demonstrated that the flare is operational (through a flare detection system). Refer to section 7.1 for more details.
Any comment: Data / Parameter: fheat Data unit: %
Description: Heater efficiency Source of data used: Project developer Value applied: 98 Justification of the choice of data or description of measurement methods and procedures actually applied :
According to project developer for ex-ante calculations, will be monitored annually for ex-post calculations.
Any comment: ii) Default values available at validation Data / Parameter: EFCH4
Data unit: kg CH4/kg COD Description: COD to methane conversion factor Source of data used: AM0022 Value applied: 0.21 Justification of the choice of data or description of measurement methods and procedures actually applied :
The 2006 IPCC default of 0.25 kg CH4/kg COD has been corrected to 0.21 kg CH4/kg COD to account for uncertainties, in accordance with AM0022.
Any comment: Data / Parameter: GWPCH4 Data unit: tCO2e / t CH4 Description: Global Warming Potential of methane Source of data used: AM0022 Value applied: 21 Justification of the choice of data or description of measurement methods and procedures actually applied :
IPCC default, as established in the Kyoto Protocol
Any comment:
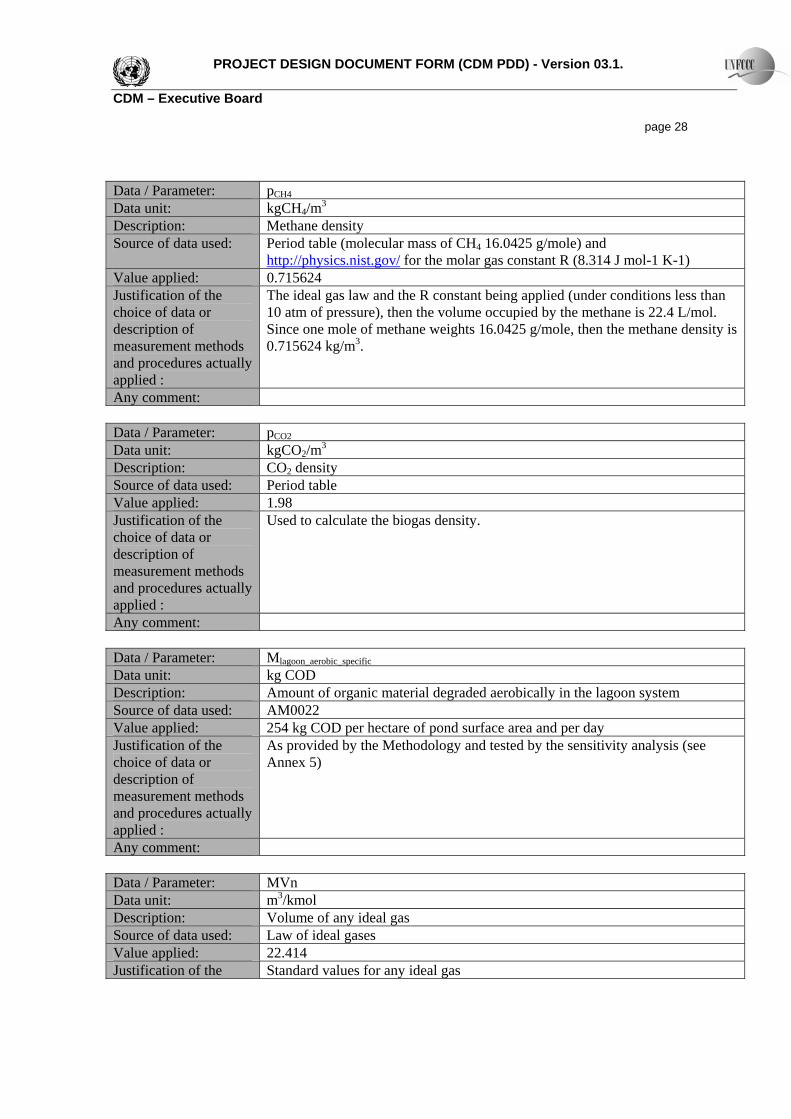
PROJECT DESIGN DOCUMENT FORM (CDM PDD) - Version 03.1. CDM – Executive Board page 28 Data / Parameter: pCH4 Data unit: kgCH4/m3 Description: Methane density Source of data used: Period table (molecular mass of CH4 16.0425 g/mole) and
http://physics.nist.gov/ for the molar gas constant R (8.314 J mol-1 K-1) Value applied: 0.715624 Justification of the choice of data or description of measurement methods and procedures actually applied :
The ideal gas law and the R constant being applied (under conditions less than 10 atm of pressure), then the volume occupied by the methane is 22.4 L/mol. Since one mole of methane weights 16.0425 g/mole, then the methane density is 0.715624 kg/m3.
Any comment: Data / Parameter: pCO2 Data unit: kgCO2/m3 Description: CO2 density Source of data used: Period table Value applied: 1.98 Justification of the choice of data or description of measurement methods and procedures actually applied :
Used to calculate the biogas density.
Any comment: Data / Parameter: Mlagoon_aerobic_specific
Data unit: kg COD Description: Amount of organic material degraded aerobically in the lagoon system Source of data used: AM0022 Value applied: 254 kg COD per hectare of pond surface area and per day Justification of the choice of data or description of measurement methods and procedures actually applied :
As provided by the Methodology and tested by the sensitivity analysis (see Annex 5)
Any comment: Data / Parameter: MVn Data unit: m3/kmol Description: Volume of any ideal gas Source of data used: Law of ideal gases Value applied: 22.414 Justification of the Standard values for any ideal gas
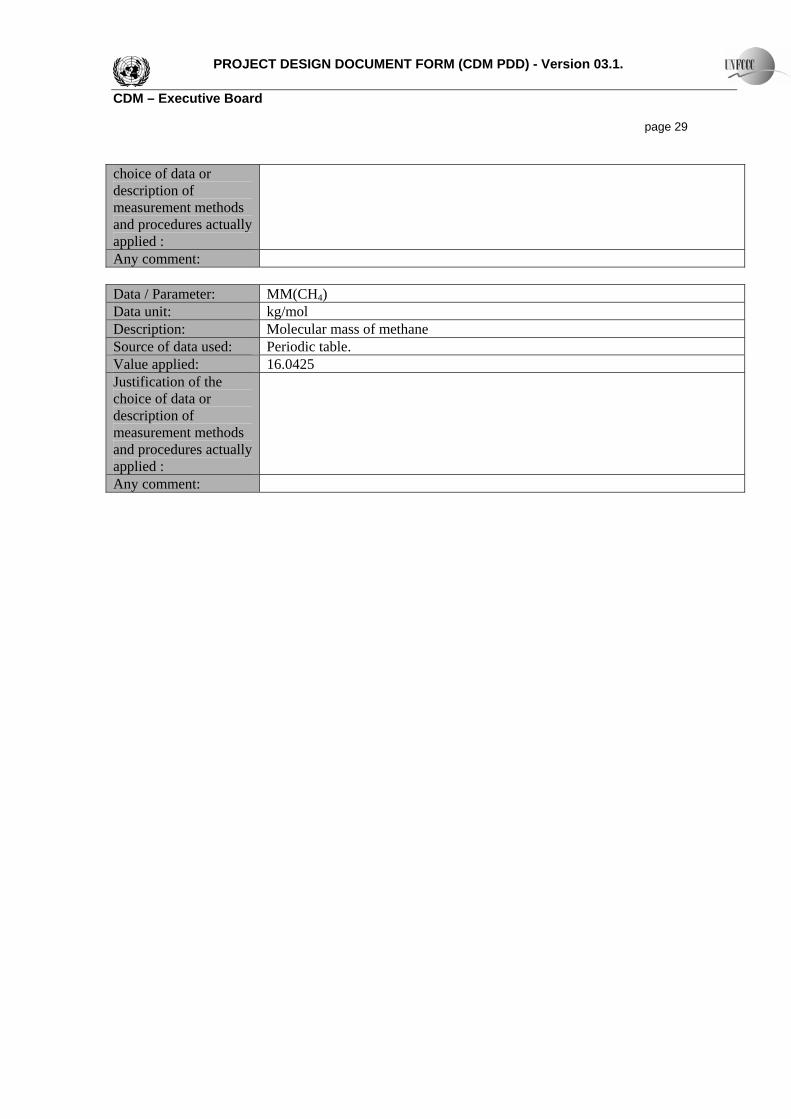
PROJECT DESIGN DOCUMENT FORM (CDM PDD) - Version 03.1. CDM – Executive Board page 29 choice of data or description of measurement methods and procedures actually applied : Any comment: Data / Parameter: MM(CH4) Data unit: kg/mol Description: Molecular mass of methane Source of data used: Periodic table. Value applied: 16.0425 Justification of the choice of data or description of measurement methods and procedures actually applied :
Any comment:

PROJECT DESIGN DOCUMENT FORM (CDM PDD) - Version 03.1. CDM – Executive Board page 30
B.6.3 Ex-ante calculation of emission reductions: >>
The ex-ante calculation is the following, based on the assumptions and methodological choices presented in section B.6.1: TOTAL BASELINE EMISSIONS
BLpowerheatCBLlagoonsCHBL EEE __02__4 ++=
value unit Term Definition 140,272 tCO2e EBL Total baseline emissions
116,492 tCO2e ECH4_lagoons_BL
fugitive methane emissions from lagoons in the baseline case
23,780 tCO2e ECO2_heat_BL
emissions from on site heat generation
- tCO2e ECO2_power_BL
emissions from on-site electricity generation
Baseline emissions > Fugitive methane emissions from lagoons
1000/44__4 CHCHanaerobiclagoonlagoonsCH GWPEFME ⋅⋅=
value unit Term Definition
116,492 tCO2e ECH4_lagoonsmethane emissions from the
lagoon
26,415,388 kgCOD Mlagoon_anaerobic
amount of organic material removed by anaerobic processes
in the lagoon system
0.21 kgCH4/kg COD
EFCH4 methane conversion factor
21 GWP GWP of methane

PROJECT DESIGN DOCUMENT FORM (CDM PDD) - Version 03.1. CDM – Executive Board page 31 Mass balance in the lagoon system: Mlagoon_ anaerobic = Mlagoon _ total −Mlagoon_ aerobic − Mlagoon _ chemical _ ox −Mlagoon _ deposition
value unit Term Definition
26,415,388 kg COD Mlagoon_anaerobicamount of org material removed
by anaerobic processes
29,224,044 kg COD Mlagoon_total
total amount of organic material removed in the lagoon system
from eq. 5
2,808,656 kg COD Mlagoon_aerobicamount of org material degraded aerobically in the lagoon system
- kg COD Mlagoon_chem_ox
amount of org material lost through chem ox in the lagoon
system
- kg COD Mlagoon_dep
amount of org material lost through deposition in the lagoon
system from eq.6 Total material removed in lagoon system: M lagoo n_ tota l = M lagoo n _ input ⋅ Rlagoon (5)
value unit Term Definition
29,224,044 kg COD Mlagoon_total
total amount of org material removed in the lagoon sys
through various routes
48,902,733 kg COD Mlagoon_input
input of org material from the new project anaerobic ww facility into
the lagoon system
60% ratio Rlagoonorg material removal ratio of the
lagoon Material deposition in lagoon system: Mlagoon_ deposition = Mlagoon _ input ⋅ Rdeposition

PROJECT DESIGN DOCUMENT FORM (CDM PDD) - Version 03.1. CDM – Executive Board page 32
value unit Term Definition - kg COD Mlagoon_dep material deposition
48,902,733 kg COD Mlagoon_input
input of org material from the new project anaerobic ww facility into
the lagoon system
0% ratio Rdepositionorg material deposition ratio of
the lagoon
Baseline organic material entering lagoon system: Mlagoon_ input _ BL = Minput _ total
value unit Term Definition
48,902,733 kgCOD Mlagoon_input_BL
input of organic material from the NAWTF into the lagoon system
48,902,733 kgCOD Minput_total
total amount of org material fed into the baseline water treatment
facility
Baseline emissions > Emissions from on site heat displaced
EFNCVFE heatC ⋅⋅=_02
value unit Term Definition
23780.49 tCO2e ECO2_heat
emissions from on-site heat generation
7608.23 t Famount of fossil fuel displaced by
the use of the biogas
3.13 tCO2e/t fuel EF emissions factor of the fossil fuel
As explained in section B.6.1, F is the product of Fsp (specific fuel consumption) and St (annual production of steam). Based on historical values, Fsp has a value of 0.0807 (tHFO/tvapor) and the average annual steam production for the 3 last years is 94,278 tonnes per year. F=Fsp*St F=0.0807 * 94,278 F=7608.23 t (tonnes of bunker estimated to be displaced) TOTAL PROJECT EMISSIONS
PROJECT DESIGN DOCUMENT FORM (CDM PDD) - Version 03.1. CDM – Executive Board page 33
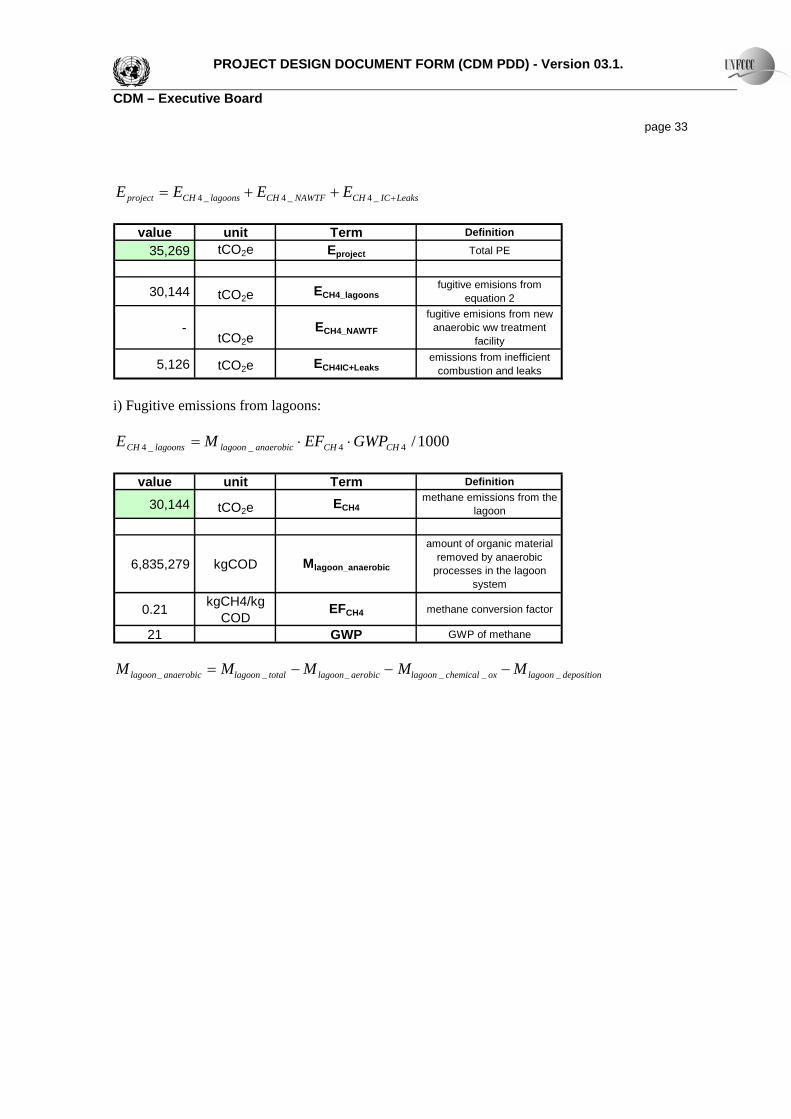
LeaksICCHNAWTFCHlagoonsCHproject EEEE +++= _4_4_4
value unit Term Definition
35,269 tCO2e Eproject Total PE
30,144 tCO2e ECH4_lagoonsfugitive emisions from
equation 2
- tCO2e
ECH4_NAWTF
fugitive emisions from new anaerobic ww treatment
facility
5,126 tCO2e ECH4IC+Leaksemissions from inefficient
combustion and leaks i) Fugitive emissions from lagoons:
1000/44__4 CHCHanaerobiclagoonlagoonsCH GWPEFME ⋅⋅=
value unit Term Definition
30,144 tCO2e ECH4methane emissions from the
lagoon
6,835,279 kgCOD Mlagoon_anaerobic
amount of organic material removed by anaerobic
processes in the lagoon system
0.21 kgCH4/kg COD
EFCH4 methane conversion factor
21 GWP GWP of methane Mlagoon_ anaerobic = Mlagoon _ total − Mlagoon_ aerobic − Mlagoon _ chemical _ ox − Mlagoon _ deposition

PROJECT DESIGN DOCUMENT FORM (CDM PDD) - Version 03.1. CDM – Executive Board page 34
value unit Term Definition
6,835,279 kg COD Mlagoon_anaerobic
amount of org material removed by anaerobic
processes
9,643,935 kg COD Mlagoon_total
total amount of organic material removed in the
lagoon system from eq. 5
2,808,656 kg COD Maerobic
amount of org material degraded aerobically in the
lagoon system and in the new aeration tank
- kg COD Mlagoon_chem_ox
amount of org material lost through chem ox in the
lagoon system
- kg COD Mlagoon_dep
amount of org material lost through deposition in the lagoon system from eq.6
Total material removed in the lagoon system: Mlagoon_ total = Mlagoon _ input ⋅ Rlagoon (5)
value unit Term Definition
9,643,935 kg COD Mlagoon_total
total amount of org material removed in the lagoon sys
through various routes
16,137,902 kg COD Mlagoon_input
input of org material from the new project anaerobic ww
facility into the lagoon system
60% ratio Rlagoonorg material removal ratio of
the lagoon Material deposition in lagoon system: Mlagoon_ deposition = Mlagoon _ input ⋅ Rdeposition
value unit Term Definition - kg COD Mlagoon_dep material deposition
16,137,902 kg COD Mlagoon_input
input of org material from the new project anaerobic ww
facility into the lagoon system
0% ratio Rdeporg material deposition ratio
of the lagoon
Project organic material entering the lagoon system:

PROJECT DESIGN DOCUMENT FORM (CDM PDD) - Version 03.1. CDM – Executive Board page 35 Mlagoon_ input = Minput _ total ⋅ (1− RNAWTF )
value unit Term Definition
16,137,902 kg COD Mlagoon_input
input of org material from the new project anaerobic ww
facility into the lagoon system
48,902,733 kg COD Minput_total
total amount of org material fed into the new projec water
treatment facility
67% ratio RNAWTF
org material removal efficiency of the new project
water treatment facility
ii) Methane emissions from inefficient combustion emissions:
PE flarer
CHrrCHrLeaksICCH GWPfCVE +⋅−⋅⋅= ∑+ ))1(( 4_4_4
value unit Term Definition
5,126 tCO2e
ECH4_IC+Leaks
CO2e from methane emissions from inefficient
combustion
12,273,365 Nm3 Vheat biogas to boiler
0.00043 tCH4/Nm3 CCH4methane density of biogas
(wet basis)
98% fheatproportion of biogas
destroyed by combustion21 GWP GWP of methane
2,912.30 tCO2e PEflare PE from PE from flaring tool Determination of methane mass flow rate in the residual gas on a dry basis:
1000)1( 4
,
8760
1,,
GWPnTMPE CHhflare
hhRGyflare xx −= ∑
=
pfvFVTM nCHhRGCHhRGhRG xx
,4,,4,, =

PROJECT DESIGN DOCUMENT FORM (CDM PDD) - Version 03.1. CDM – Executive Board page 36
FVRG,h 86.823 m3/hfvCH4,RG,h 60% %
pCH4,n 0.715624 kg/m3TMRG,h 37.280 kg/h
GWPCH4 21 kgCO2e/kgCH4nflare 50% %
h/year 7440 h/yearPEflare,y 2912.30 tCO2/yr
TOTAL PROJECT EMISSION REDUCTIONS
value unit Term Definition
105,003 tCO2e ER Total emissions reductions
140,272 tCO2e EBL Baseline emissions
35,269 tCO2e Eproject Project emissions

PROJECT DESIGN DOCUMENT FORM (CDM PDD) - Version 03.1. CDM – Executive Board page 37
B.6.4 Summary of the ex-ante estimation of emission reductions:
Emissions Reductions Profile
YearEstimation of Project
Activity emissions (tonnes CO2e)
Estimation of Baseline emissions
(tonnes CO2e)
Estimation of emission reductions
(tonnes CO2e)
2008 (8 months) 23,513 93,515 70,002 2009 35,269 140,272 105,0032010 35,269 140,272 105,0032011 35,269 140,272 105,0032012 35,269 140,272 105,0032013 35,269 140,272 105,0032014 35,269 140,272 105,003Total 235,128 935,149 700,021
Average 33,590 133,593 100,003 B.7 Application of the monitoring methodology and description of the monitoring plan:
B.7.1 Data and parameters monitored15: Data / Parameter: wwinput (M1) Data unit: m3 Description: Daily wastewater flows entering system boundary Source of data to be used:
Project developer
Value of data applied for the purpose of calculating expected emission reductions in section B.5
1440
Description of measurement methods and procedures to be applied:
Will be measured continuously with a mass flow meter.
QA/QC procedures to be applied:
Mass flow meters will be subject to a regular maintenance and testing regime to ensure accuracy.
Any comment: Calibration will be completed as according to manufacturer’s guidance Data / Parameter: CODinput (M2) Data unit: kg COD / m3 Description: Wastewater organic material concentration entering the project boundary Source of data to be used:
Laboratory water tests
15 Please refer to Annex 4 (monitoring information) that includes a process flow diagram showing the location of each monitoring parameter (M) to be measured.

PROJECT DESIGN DOCUMENT FORM (CDM PDD) - Version 03.1. CDM – Executive Board page 38 Value of data applied for the purpose of calculating expected emission reductions in section B.5
109,549
Description of measurement methods and procedures to be applied:
Wastewater will be sampled and analysed onsite at SEMA laboratory, and then the samples will be sent to an accredited analytical laboratory in Guatemala.
QA/QC procedures to be applied:
COD will be sampled frequently and tests carried out by accredited laboratory regularly to assure accuracy.
Any comment: Data / Parameter: wwoutput (M3) Data unit: m3 Description: Daily wastewater flow leaving the NAWTF Source of data to be used:
Project developer
Value of data applied for the purpose of calculating expected emission reductions in section B.5
1440
Description of measurement methods and procedures to be applied:
Will be measured continuously with a mass flow meter
QA/QC procedures to be applied:
Mass flow meters should be subject to a regular maintenance and testing regime to ensure accuracy.
Any comment: Calibration will be completed as according to manufacturer’s guidance Data / Parameter: CODout_NAWTF (M4) Data unit: kg COD / m3 Description: Wastewater organic material concentration leaving the NAWTF Source of data to be used:
Laboratory water tests
Value of data applied for the purpose of calculating expected emission reductions in section B.5
36,151
Description of measurement methods and procedures to be applied:
Wastewater will be sampled and analysed onsite at SEMA laboratory, and then the samples will be sent to an accredited analytical laboratory in Guatemala.
QA/QC procedures to be applied:
COD will be sampled frequently and tests carried out by accredited laboratory regularly to assure accuracy.
Any comment:
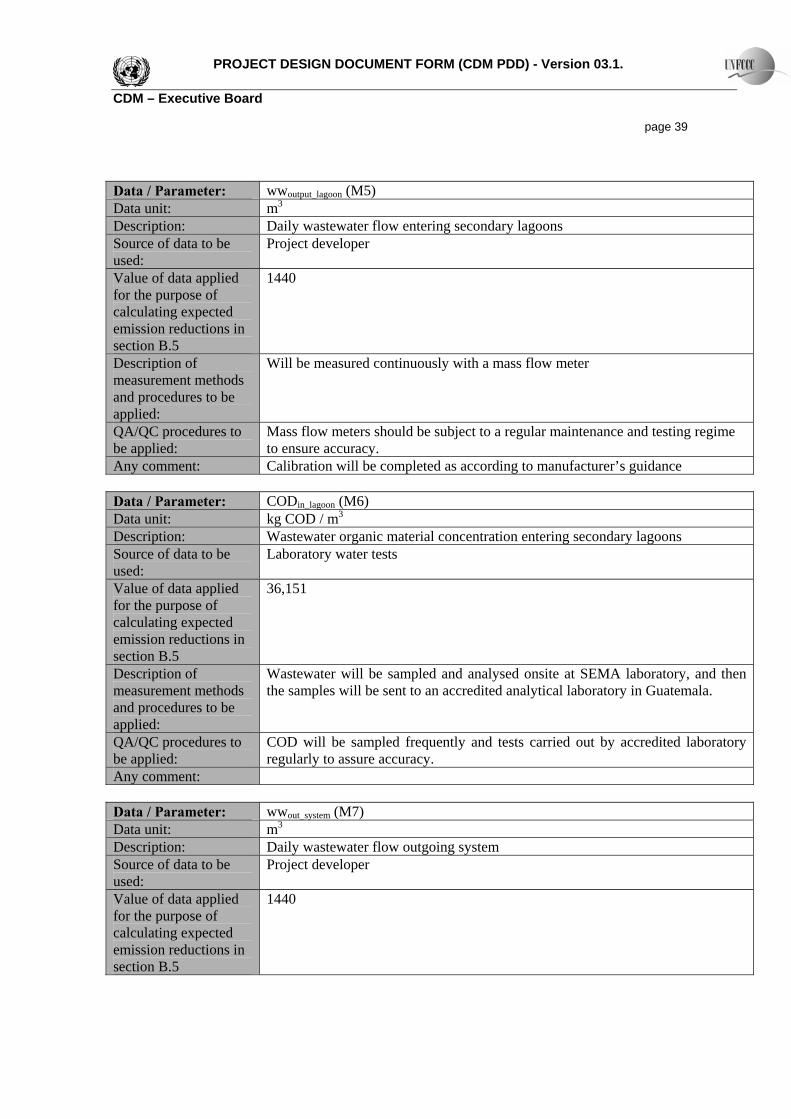
PROJECT DESIGN DOCUMENT FORM (CDM PDD) - Version 03.1. CDM – Executive Board page 39 Data / Parameter: wwoutput_lagoon (M5) Data unit: m3 Description: Daily wastewater flow entering secondary lagoons Source of data to be used:
Project developer
Value of data applied for the purpose of calculating expected emission reductions in section B.5
1440
Description of measurement methods and procedures to be applied:
Will be measured continuously with a mass flow meter
QA/QC procedures to be applied:
Mass flow meters should be subject to a regular maintenance and testing regime to ensure accuracy.
Any comment: Calibration will be completed as according to manufacturer’s guidance Data / Parameter: CODin_lagoon (M6) Data unit: kg COD / m3 Description: Wastewater organic material concentration entering secondary lagoons Source of data to be used:
Laboratory water tests
Value of data applied for the purpose of calculating expected emission reductions in section B.5
36,151
Description of measurement methods and procedures to be applied:
Wastewater will be sampled and analysed onsite at SEMA laboratory, and then the samples will be sent to an accredited analytical laboratory in Guatemala.
QA/QC procedures to be applied:
COD will be sampled frequently and tests carried out by accredited laboratory regularly to assure accuracy.
Any comment: Data / Parameter: wwout_system (M7) Data unit: m3 Description: Daily wastewater flow outgoing system Source of data to be used:
Project developer
Value of data applied for the purpose of calculating expected emission reductions in section B.5
1440
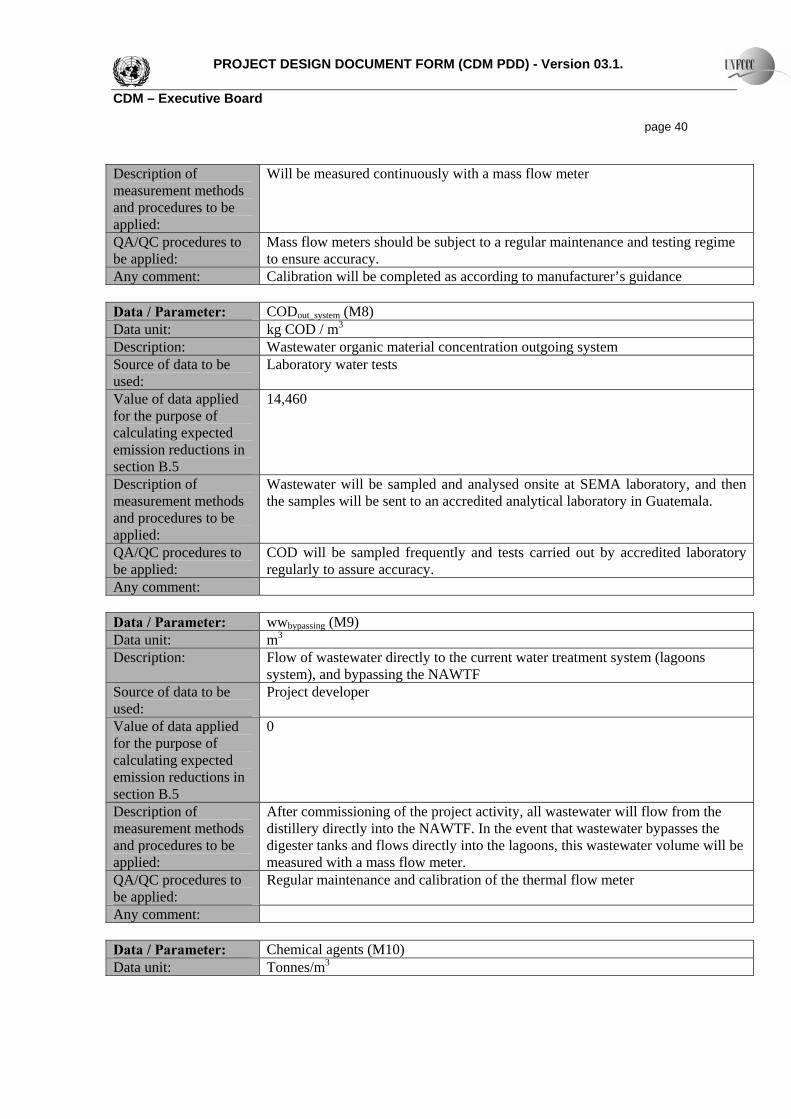
PROJECT DESIGN DOCUMENT FORM (CDM PDD) - Version 03.1. CDM – Executive Board page 40 Description of measurement methods and procedures to be applied:
Will be measured continuously with a mass flow meter
QA/QC procedures to be applied:
Mass flow meters should be subject to a regular maintenance and testing regime to ensure accuracy.
Any comment: Calibration will be completed as according to manufacturer’s guidance Data / Parameter: CODout_system (M8) Data unit: kg COD / m3 Description: Wastewater organic material concentration outgoing system Source of data to be used:
Laboratory water tests
Value of data applied for the purpose of calculating expected emission reductions in section B.5
14,460
Description of measurement methods and procedures to be applied:
Wastewater will be sampled and analysed onsite at SEMA laboratory, and then the samples will be sent to an accredited analytical laboratory in Guatemala.
QA/QC procedures to be applied:
COD will be sampled frequently and tests carried out by accredited laboratory regularly to assure accuracy.
Any comment: Data / Parameter: wwbypassing (M9) Data unit: m3 Description: Flow of wastewater directly to the current water treatment system (lagoons
system), and bypassing the NAWTF Source of data to be used:
Project developer
Value of data applied for the purpose of calculating expected emission reductions in section B.5
0
Description of measurement methods and procedures to be applied:
After commissioning of the project activity, all wastewater will flow from the distillery directly into the NAWTF. In the event that wastewater bypasses the digester tanks and flows directly into the lagoons, this wastewater volume will be measured with a mass flow meter.
QA/QC procedures to be applied:
Regular maintenance and calibration of the thermal flow meter
Any comment: Data / Parameter: Chemical agents (M10)
Data unit: Tonnes/m3
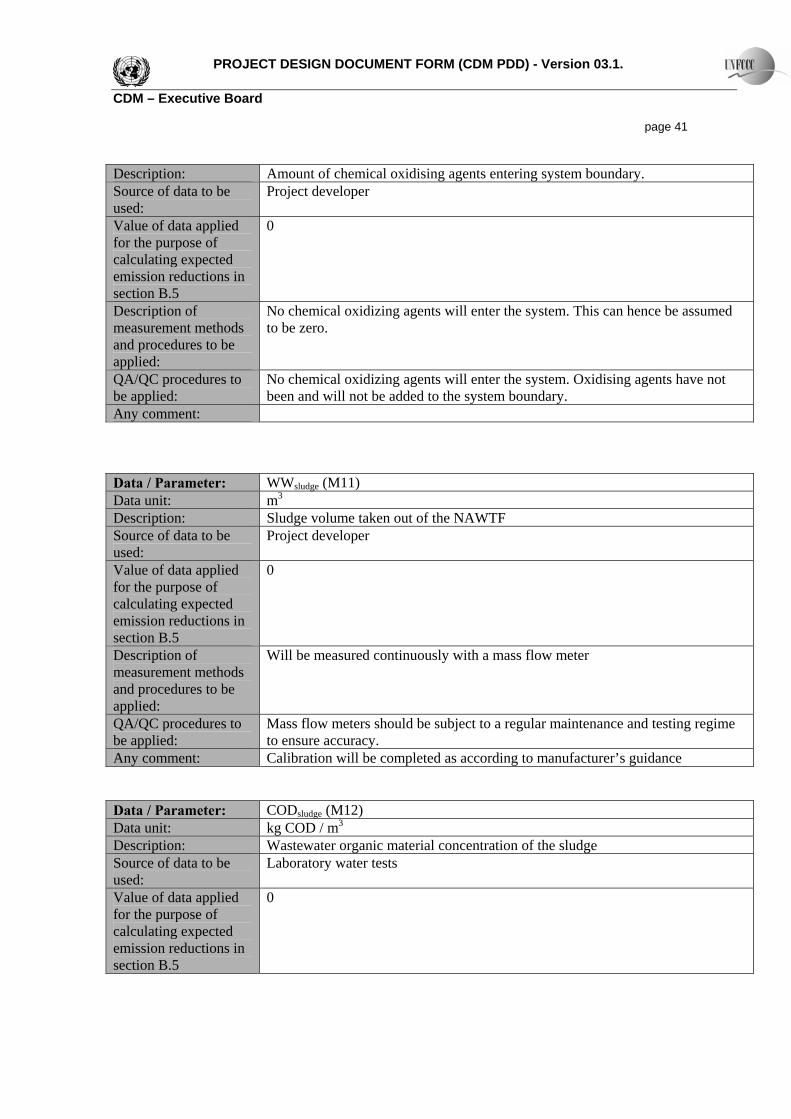
PROJECT DESIGN DOCUMENT FORM (CDM PDD) - Version 03.1. CDM – Executive Board page 41 Description: Amount of chemical oxidising agents entering system boundary. Source of data to be used:
Project developer
Value of data applied for the purpose of calculating expected emission reductions in section B.5
0
Description of measurement methods and procedures to be applied:
No chemical oxidizing agents will enter the system. This can hence be assumed to be zero.
QA/QC procedures to be applied:
No chemical oxidizing agents will enter the system. Oxidising agents have not been and will not be added to the system boundary.
Any comment: Data / Parameter: WWsludge (M11) Data unit: m3 Description: Sludge volume taken out of the NAWTF Source of data to be used:
Project developer
Value of data applied for the purpose of calculating expected emission reductions in section B.5
0
Description of measurement methods and procedures to be applied:
Will be measured continuously with a mass flow meter
QA/QC procedures to be applied:
Mass flow meters should be subject to a regular maintenance and testing regime to ensure accuracy.
Any comment: Calibration will be completed as according to manufacturer’s guidance Data / Parameter: CODsludge (M12) Data unit: kg COD / m3 Description: Wastewater organic material concentration of the sludge Source of data to be used:
Laboratory water tests
Value of data applied for the purpose of calculating expected emission reductions in section B.5
0
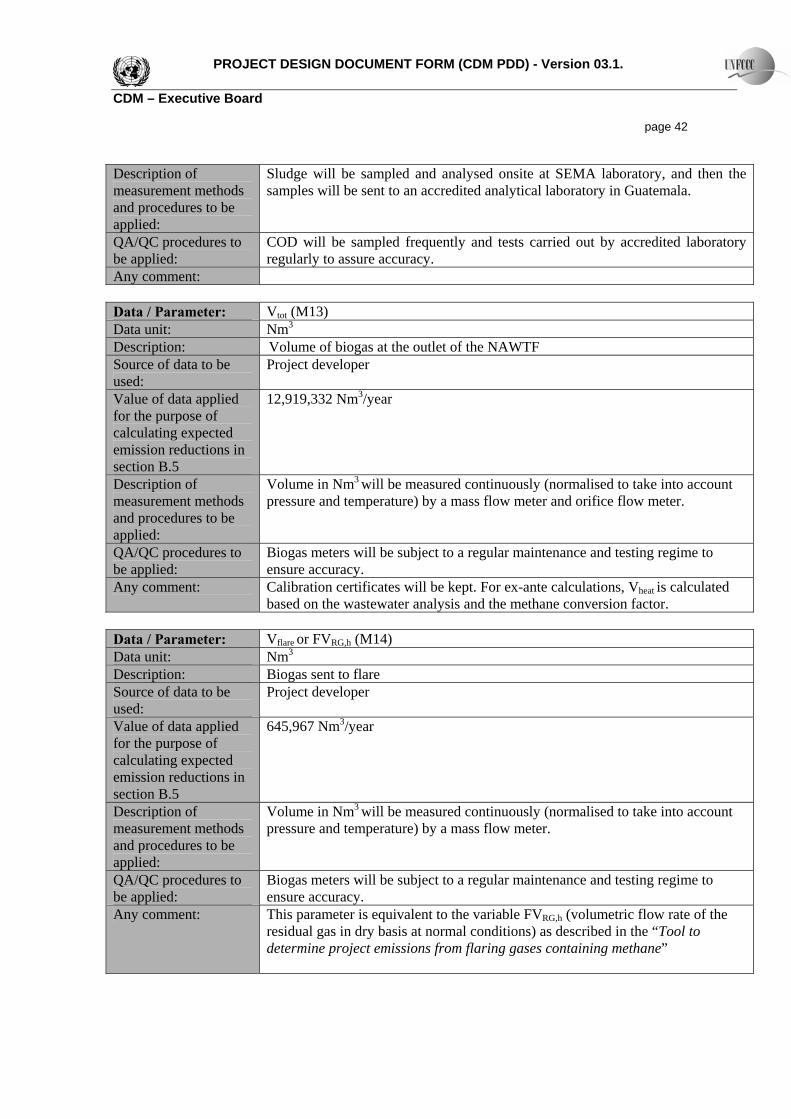
PROJECT DESIGN DOCUMENT FORM (CDM PDD) - Version 03.1. CDM – Executive Board page 42 Description of measurement methods and procedures to be applied:
Sludge will be sampled and analysed onsite at SEMA laboratory, and then the samples will be sent to an accredited analytical laboratory in Guatemala.
QA/QC procedures to be applied:
COD will be sampled frequently and tests carried out by accredited laboratory regularly to assure accuracy.
Any comment: Data / Parameter: Vtot (M13) Data unit: Nm3 Description: Volume of biogas at the outlet of the NAWTF Source of data to be used:
Project developer
Value of data applied for the purpose of calculating expected emission reductions in section B.5
12,919,332 Nm3/year
Description of measurement methods and procedures to be applied:
Volume in Nm3 will be measured continuously (normalised to take into account pressure and temperature) by a mass flow meter and orifice flow meter.
QA/QC procedures to be applied:
Biogas meters will be subject to a regular maintenance and testing regime to ensure accuracy.
Any comment: Calibration certificates will be kept. For ex-ante calculations, Vheat is calculated based on the wastewater analysis and the methane conversion factor.
Data / Parameter: Vflare or FVRG,h (M14) Data unit: Nm3 Description: Biogas sent to flare Source of data to be used:
Project developer
Value of data applied for the purpose of calculating expected emission reductions in section B.5
645,967 Nm3/year
Description of measurement methods and procedures to be applied:
Volume in Nm3 will be measured continuously (normalised to take into account pressure and temperature) by a mass flow meter.
QA/QC procedures to be applied:
Biogas meters will be subject to a regular maintenance and testing regime to ensure accuracy.
Any comment: This parameter is equivalent to the variable FVRG,h (volumetric flow rate of the residual gas in dry basis at normal conditions) as described in the “Tool to determine project emissions from flaring gases containing methane”
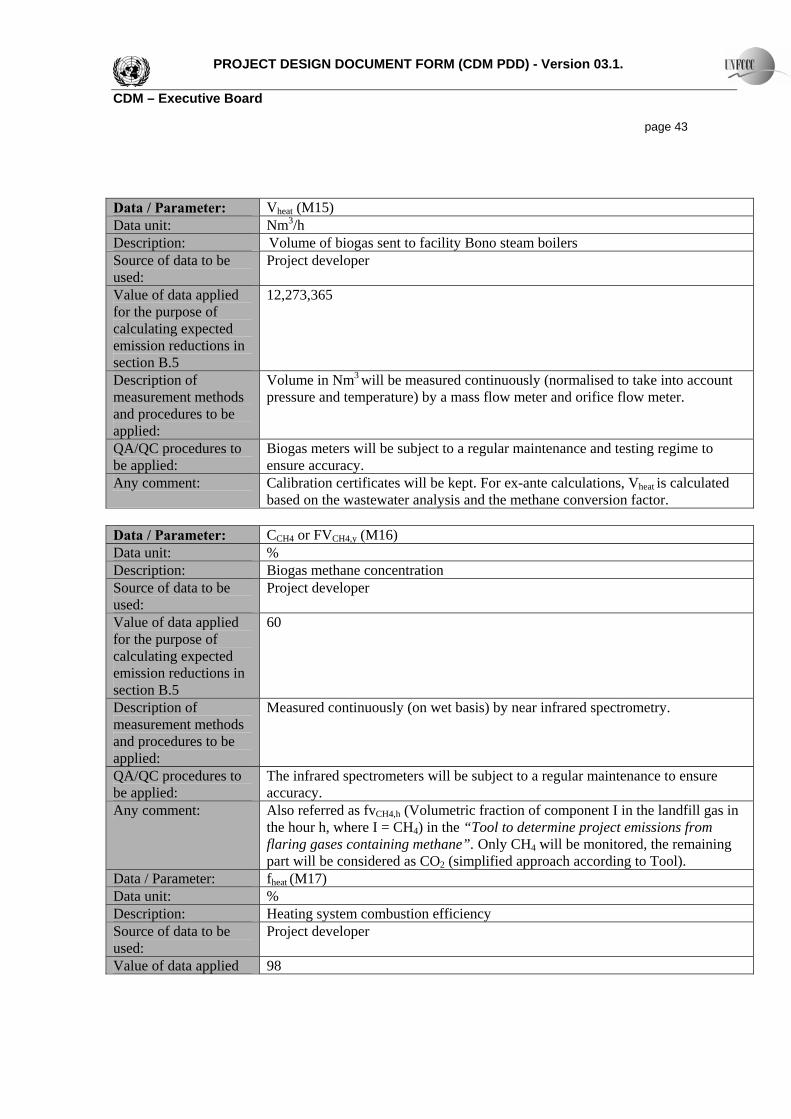
PROJECT DESIGN DOCUMENT FORM (CDM PDD) - Version 03.1. CDM – Executive Board page 43 Data / Parameter: Vheat (M15) Data unit: Nm3/h Description: Volume of biogas sent to facility Bono steam boilers Source of data to be used:
Project developer
Value of data applied for the purpose of calculating expected emission reductions in section B.5
12,273,365
Description of measurement methods and procedures to be applied:
Volume in Nm3 will be measured continuously (normalised to take into account pressure and temperature) by a mass flow meter and orifice flow meter.
QA/QC procedures to be applied:
Biogas meters will be subject to a regular maintenance and testing regime to ensure accuracy.
Any comment: Calibration certificates will be kept. For ex-ante calculations, Vheat is calculated based on the wastewater analysis and the methane conversion factor.
Data / Parameter: CCH4 or FVCH4,y (M16) Data unit: % Description: Biogas methane concentration Source of data to be used:
Project developer
Value of data applied for the purpose of calculating expected emission reductions in section B.5
60
Description of measurement methods and procedures to be applied:
Measured continuously (on wet basis) by near infrared spectrometry.
QA/QC procedures to be applied:
The infrared spectrometers will be subject to a regular maintenance to ensure accuracy.
Any comment: Also referred as fvCH4,h (Volumetric fraction of component I in the landfill gas in the hour h, where I = CH4) in the “Tool to determine project emissions from flaring gases containing methane”. Only CH4 will be monitored, the remaining part will be considered as CO2 (simplified approach according to Tool).
Data / Parameter: fheat (M17) Data unit: % Description: Heating system combustion efficiency Source of data to be used:
Project developer
Value of data applied 98

PROJECT DESIGN DOCUMENT FORM (CDM PDD) - Version 03.1. CDM – Executive Board page 44 for the purpose of calculating expected emission reductions in section B.5 Description of measurement methods and procedures to be applied:
The efficiency will be monitored during regular O&M cycle, and will be calculated as a ratio between the energy output (steam) and energy input (biogas).
QA/QC procedures to be applied:
The boiler is maintained regularly in order to ensure optimal performance.
Any comment: Data / Parameter: Biogas loss from pipeline (M18) Data unit: % Description: Loss of biogas from pipeline Source of data to be used:
Project developer
Value of data applied for the purpose of calculating expected emission reductions in section B.5
0
Description of measurement methods and procedures to be applied:
Leakage from the biogas pipeline is considered negligible, however the integrity of biogas pipeline for losses of biogas methane will be tested annually through pressurizing the system and establishing pressure drops through leakage.
QA/QC procedures to be applied:
Any comment: Data / Parameter: Tflare (M19) Data unit: Celcius Description: Temperature of the exhaust flare Source of data to be used:
Project developer
Value of data applied for the purpose of calculating expected emission reductions in section B.5
600
Description of measurement methods and procedures to be applied:
QA/QC procedures to be applied:
Any comment:

PROJECT DESIGN DOCUMENT FORM (CDM PDD) - Version 03.1. CDM – Executive Board page 45 Data / Parameter: Flare operation (M20) Data unit: Description: Flare detection system to determine if the flare is operating or not. Source of data used: Project developer Value applied: Justification of the choice of data or description of measurement methods and procedures actually applied :
According to the “Tool to determine project emissions from flaring gases containing methane”, the Project activity uses an open flare therefore the 50% default from the flare tool was used, provided that it can be demonstrated that the flare is operational (through a flare detection system). In this case, the operation and the flame will be detected with a UV sensor.
Any comment: Data / Parameter: RNAWTF
Data unit: % Description: Organic removal rate of the wastewater facility Source of data to be used:
Onsite testing
Value of data applied for the purpose of calculating expected emission reductions in section B.5
67
Description of measurement methods and procedures to be applied:
Calculated as 1-(CODout/ CODin)
QA/QC procedures to be applied:
Any comment: Data / Parameter: NCVCH4 Data unit: TJ/Gg Description: Methane Source of data to be used:
Onsite testing of the methane content in the biogas and Guidance for Landfill Gas Flaring (Environment Agency, 2002) for methane energy content
Value of data applied for the purpose of calculating expected emission reductions in section B.5
55.53
Description of measurement methods and procedures to be applied:
Environment Agency methane energy content and estimated 60% of methane content of biogas were used

PROJECT DESIGN DOCUMENT FORM (CDM PDD) - Version 03.1. CDM – Executive Board page 46 QA/QC procedures to be applied:
The methane content of the biogas will be continuously monitored with QA/QC completed annually when the facility is closed for maintenance
Any comment: The IPCC default will remain constant but the calorific value of the biogas will fluctuate based on its methane content
B.7.2 Description of the monitoring plan: >> This section details the steps taken to monitor fossil fuel displacement from the Bioenergia Anaerobic Digestion and Biogas Generation Project in Guatemala.
Prior to the start of the crediting period, the organisation of the monitoring team will be established. Clear roles and responsibilities will be assigned to all staff involved in the CDM project. The Project Developer will have a designated staff member who will be responsible for monitoring emissions reductions of the project activity. All staff involved in the collection of data and records will be coordinated by the staff member in charge of monitoring. In addition to this staff, qualified personnel will be designated to handle and operate equipment and machinery at the project site according to the statutory requirements of the country. Monitoring procedures will be established prior to the start of the project. These procedures will detail the organisation, control and steps required for certain key monitoring system features. This will ensure that high quality data is obtained. Specifically, data and records will be checked prior to being stored and archived. Data from the project will be checked to identify possible errors or omissions. All data required for verification and issuance will be kept for at least two years after the end of the crediting period or the last issuance of CERs of this project, whichever occurs later. Data will be archived electronically and data backup will be maintained. Paper data back up will also be available. All equipment will be calibrated and maintained in accordance to the manufacturer’s recommendations to ensure accuracy of measurements. Records of calibration and maintenance will be retained as part of the CDM monitoring system. B.8 Date of completion of the application of the baseline study and monitoring methodology and the name of the responsible person(s)/entity(ies) >> The baseline study was concluded in October 2007 following approval of a relevant methodology, AM0022. The baseline study was conducted by Adam Penque ([email protected]) and Mathieu Dumas ([email protected]) at EcoSecurities.

PROJECT DESIGN DOCUMENT FORM (CDM PDD) - Version 03.1. CDM – Executive Board page 47 SECTION C. Duration of the project activity / crediting period C.1 Duration of the project activity: C.1.1. Starting date of the project activity: >>
02/02/2006 C.1.2. Expected operational lifetime of the project activity: >>
30 years C.2 Choice of the crediting period and related information: The Project Activity will use a renewable period, seven years renewable twice C.2.1. Renewable crediting period A period of seven years renewable twice C.2.1.1. Starting date of the first crediting period: >> 01/04/08 or on the date of registration of the CDM project activity, whichever is later
C.2.1.2. Length of the first crediting period: >>
7 (seven) years C.2.2. Fixed crediting period: C.2.2.1. Starting date: >>
Not Applicable C.2.2.2. Length: >>
Not Applicable
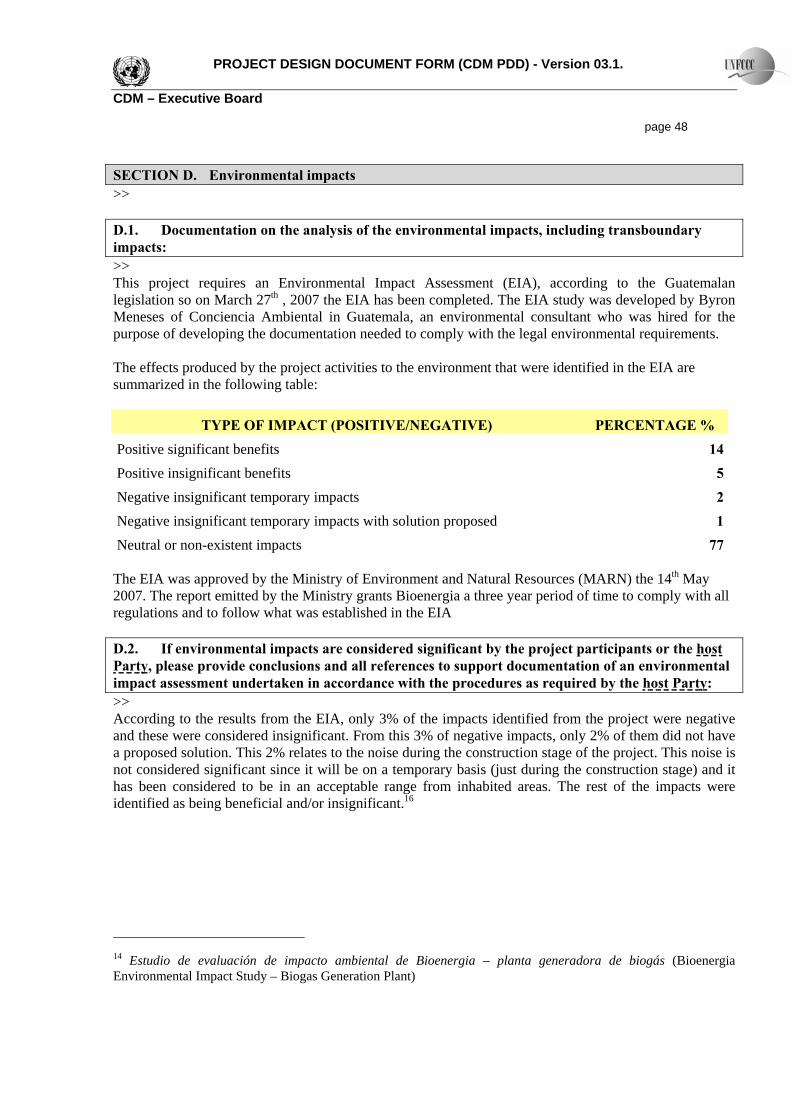
PROJECT DESIGN DOCUMENT FORM (CDM PDD) - Version 03.1. CDM – Executive Board page 48 SECTION D. Environmental impacts >> D.1. Documentation on the analysis of the environmental impacts, including transboundary impacts: >> This project requires an Environmental Impact Assessment (EIA), according to the Guatemalan legislation so on March 27th , 2007 the EIA has been completed. The EIA study was developed by Byron Meneses of Conciencia Ambiental in Guatemala, an environmental consultant who was hired for the purpose of developing the documentation needed to comply with the legal environmental requirements. The effects produced by the project activities to the environment that were identified in the EIA are summarized in the following table:
TYPE OF IMPACT (POSITIVE/NEGATIVE) PERCENTAGE % Positive significant benefits 14Positive insignificant benefits 5Negative insignificant temporary impacts 2Negative insignificant temporary impacts with solution proposed 1Neutral or non-existent impacts 77
The EIA was approved by the Ministry of Environment and Natural Resources (MARN) the 14th May 2007. The report emitted by the Ministry grants Bioenergia a three year period of time to comply with all regulations and to follow what was established in the EIA D.2. If environmental impacts are considered significant by the project participants or the host Party, please provide conclusions and all references to support documentation of an environmental impact assessment undertaken in accordance with the procedures as required by the host Party: >> According to the results from the EIA, only 3% of the impacts identified from the project were negative and these were considered insignificant. From this 3% of negative impacts, only 2% of them did not have a proposed solution. This 2% relates to the noise during the construction stage of the project. This noise is not considered significant since it will be on a temporary basis (just during the construction stage) and it has been considered to be in an acceptable range from inhabited areas. The rest of the impacts were identified as being beneficial and/or insignificant.16
14 Estudio de evaluación de impacto ambiental de Bioenergia – planta generadora de biogás (Bioenergia Environmental Impact Study – Biogas Generation Plant)

PROJECT DESIGN DOCUMENT FORM (CDM PDD) - Version 03.1. CDM – Executive Board page 49 SECTION E. Stakeholders’ comments >> E.1. Brief description how comments by local stakeholders have been invited and compiled: >> Stakeholders were informed about the Bioenergia Anaerobic Digestion and Biogas Generation Project via three avenues:
1. Through a publication on a national newspaper (Prensa Libre) that called for stakeholders to comment on the project during a 20-day period. This is a step that is required by the Guatemalan Ministry of Natural Resources and the Environment in order to grant an Environmental License. No comments were received during this period, the EIA was approved in a timely manner and the Environmental License was granted to Bioenergia.
2. Through a survey conducted on March 4, 2007 by Byron Meneses, a consultant hired to develop
the EIA. Individuals that participated in the polling were randomly selected from the immediate vicinities of the industrial facility where the project will be implemented. A total of 63 people, in their majority workers, were interviewed. The documentation from this is kept by Bioenergia.
3. Through an interview carried out on March 21, 2007 by Byron Meneses with relevant authorities:
the Minister of the Environment and Natural Resources, and the Mayor of La Democracia Municipality where the project is located.
E.2. Summary of the comments received: >> As stated above, there were no comments made by stakeholders during the 20-day period that the project was published on a national newspaper. As part of the survey conducted in the vicinity of the project site by Byron Meneses from Conciencia Ambiental, various questions were asked and corresponding answers were provided. This is a list of the most important questions that were asked and the corresponding answers:
Q1: Do you believe that these types of projects should be implemented if they help reduce the use of Heavy Fuel Oils (HFOs)?
• 95 % of the individuals agreed such projects should be promoted • 5 % were against the implementation of renewable energy activities
Q2: Will you be directly affected by this project?
• 95 % not affected • 5 % affected positively • 0% affected negatively
Q3: How will the Bioenergia project affect you (this question was posed to those three that indicated that they would be affected by the project)?
• Economically with jobs generation • Positive health effects
PROJECT DESIGN DOCUMENT FORM (CDM PDD) - Version 03.1. CDM – Executive Board page 50 In the interviews to the Minister of the Environment and Natural Resources, as well as with the Mayor of La Democracia, the following questions were asked and responses provided:
Q1: Do you believe that this type of projects should be implemented if they contribute to the reduction or elimination of fossil fuel consumption? A1: Both individuals responded that projects like Bioenergia should be promoted and developed because of the benefits they bring with them. Q2: Do you believe that these projects lead to more positive or negative impacts? A2: Both individuals agreed that positive consequences predominate in projects like Bioenergia. Q3: What types of positive impacts are associated with biogas production projects?
• Economically with jobs generation • Potential additional source of income for the municipality • Decrease in pollution • Reduction in operational costs • Increase in efficiencies • Higher salaries and productivity • Strengthening of the society’s environmental responsibility
Overall, the answers and comments provided by those surveyed were positive and indicative of the fact that projects like Bioenergia are starting to be seen as important drivers of socio-economic and environmental improvement in Guatemala E.3. Report on how due account was taken of any comments received: >> Not applicable, given that no comments made required any specific actions to change, fix or improve any aspects of the Bioenergia project. Overall, comments were positive and indicated that the persons interviewed relate projects like Bioenergia with positive economic and environmental benefits.

PROJECT DESIGN DOCUMENT FORM (CDM PDD) - Version 03.1. CDM – Executive Board page 51
Annex 1
CONTACT INFORMATION ON PARTICIPANTS IN THE PROJECT ACTIVITY Organization: Bioenergia S.A. Street/P.O.Box: Mayora and Mayota, 15 Calle, 1-04 Zona 10 Building: Edificio Centrica Plaza; 3 Nivel, oficina 301 City: Guatemala City State/Region: Guatemala Postfix/ZIP: 01014 Country: Guatemala Telephone: +502 23662531 E-Mail: Represented by: Title: Mr. Salutation: Last Name: Niño Hernandez First Name: Joeli Mobile: +502 5493 8161 Direct FAX: +502 2367 6116 Direct tel: Personal E-Mail: [email protected] Organization: EcoSecurities Group plc Street/P.O.Box: 1st Floor, 40-41 Park End Street Building: - City: Oxford State/Region: - Postfix/ZIP: OX1 1JD Country: United Kingdom Telephone: +44 1865 202 635 FAX: +44 1865 251 438 E-Mail: [email protected] URL: www.ecosecurities.com Represented by: Title: President Salutation: Dr Last Name: Moura Costa Middle Name: First Name: Pedro Mobile: Direct FAX: Direct tel: +44 1865 202 635 Personal E-Mail: [email protected]

PROJECT DESIGN DOCUMENT FORM (CDM PDD) - Version 03.1. CDM – Executive Board page 52
Annex 2
INFORMATION REGARDING PUBLIC FUNDING This project will not receive any public funding from Annex 1 parties.
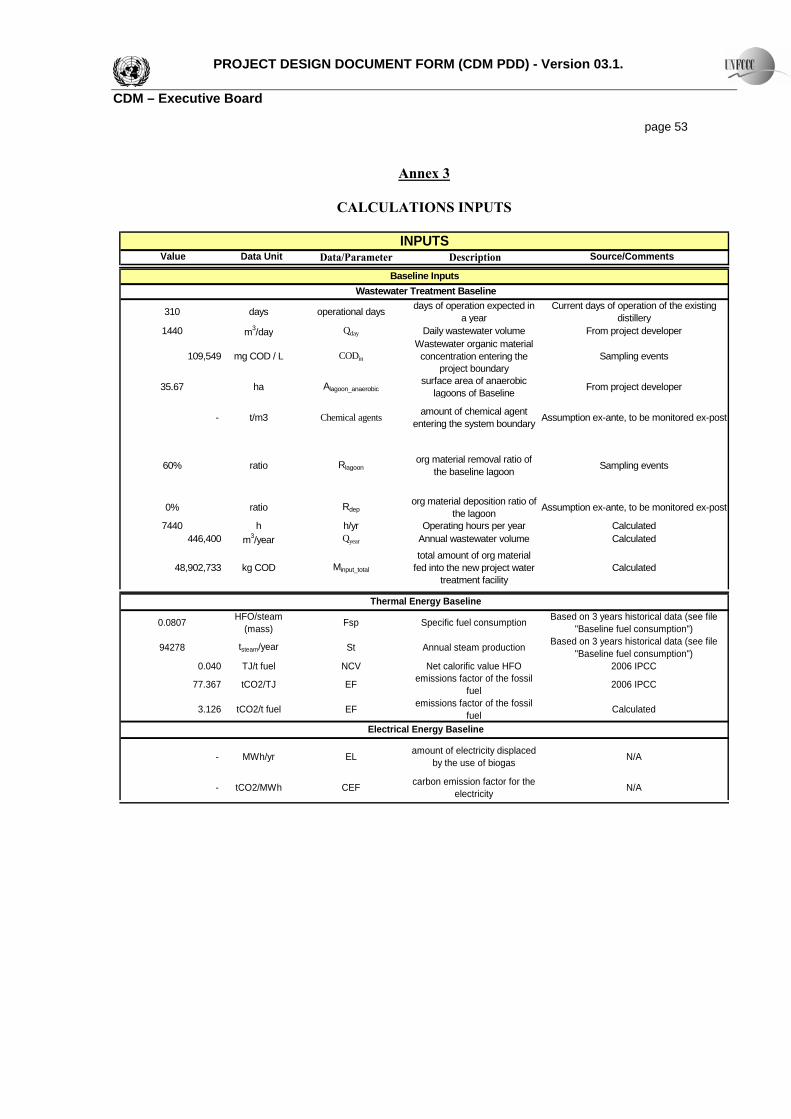
PROJECT DESIGN DOCUMENT FORM (CDM PDD) - Version 03.1. CDM – Executive Board page 53
Annex 3
CALCULATIONS INPUTS
Value Data Unit Data/Parameter Description Source/CommentsINPUTS
310 days operational days days of operation expected in a year
Current days of operation of the existing distillery
1440 m3/day Qday Daily wastewater volume From project developer
109,549 mg COD / L CODin
Wastewater organic material concentration entering the
project boundarySampling events
35.67 ha Alagoon_anaerobicsurface area of anaerobic
lagoons of Baseline From project developer
- t/m3 Chemical agents amount of chemical agent entering the system boundary Assumption ex-ante, to be monitored ex-post
60% ratio Rlagoonorg material removal ratio of
the baseline lagoon Sampling events
0% ratio Rdeporg material deposition ratio of
the lagoon Assumption ex-ante, to be monitored ex-post
7440 h h/yr Operating hours per year Calculated 446,400 m3/year Qyear Annual wastewater volume Calculated
48,902,733 kg COD Minput_total
total amount of org material fed into the new project water
treatment facilityCalculated
Baseline Inputs Wastewater Treatment Baseline
0.0807 HFO/steam (mass) Fsp Specific fuel consumption Based on 3 years historical data (see file
"Baseline fuel consumption")
94278 tsteam/year St Annual steam production Based on 3 years historical data (see file "Baseline fuel consumption")
0.040 TJ/t fuel NCV Net calorific value HFO 2006 IPCC
77.367 tCO2/TJ EF emissions factor of the fossil fuel 2006 IPCC
3.126 tCO2/t fuel EF emissions factor of the fossil fuel Calculated
- MWh/yr EL amount of electricity displaced by the use of biogas N/A
- tCO2/MWh CEF carbon emission factor for the electricity N/A
Thermal Energy Baseline
Electrical Energy Baseline
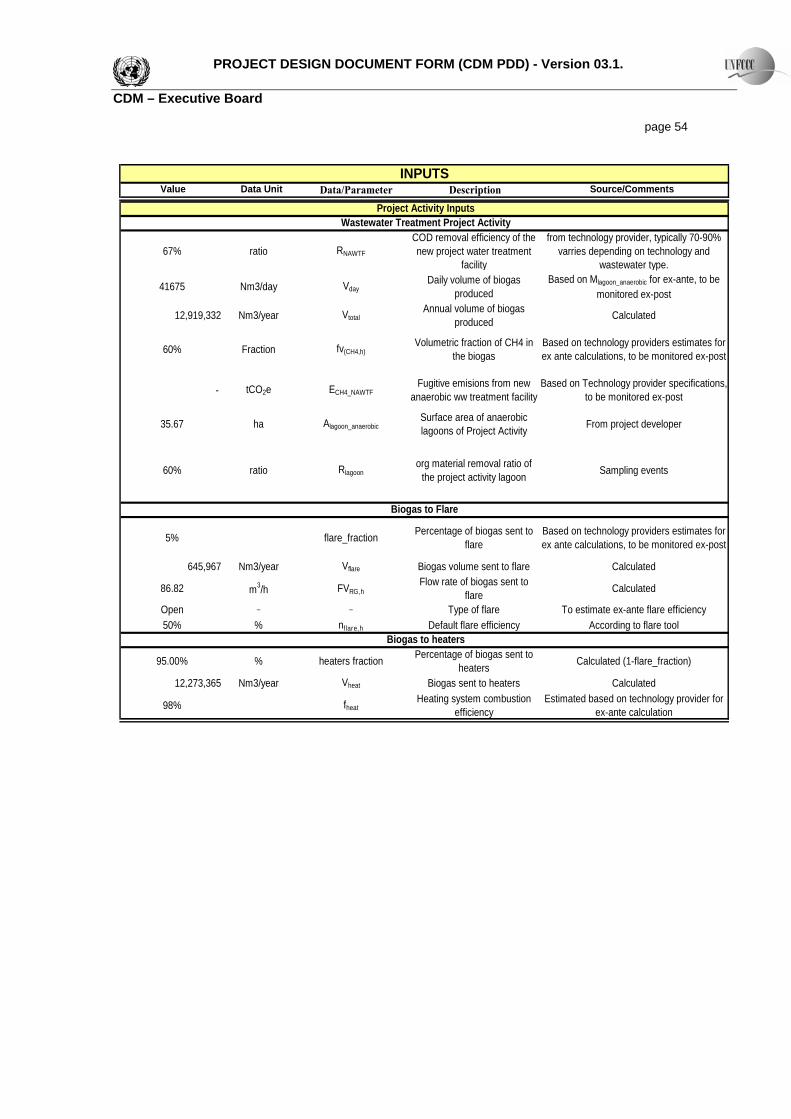
PROJECT DESIGN DOCUMENT FORM (CDM PDD) - Version 03.1. CDM – Executive Board page 54
Value Data Unit Data/Parameter Description Source/CommentsINPUTS
67% ratio RNAWTF
COD removal efficiency of the new project water treatment
facility
from technology provider, typically 70-90% varries depending on technology and
wastewater type.
41675 Nm3/day VdayDaily volume of biogas
produced Based on Mlagoon_anaerobic for ex-ante, to be
monitored ex-post
12,919,332 Nm3/year VtotalAnnual volume of biogas
produced Calculated
60% Fraction fv(CH4,h)Volumetric fraction of CH4 in
the biogasBased on technology providers estimates for ex ante calculations, to be monitored ex-post
- tCO2e ECH4_NAWTFFugitive emisions from new
anaerobic ww treatment facilityBased on Technology provider specifications,
to be monitored ex-post
35.67 ha Alagoon_anaerobicSurface area of anaerobic lagoons of Project Activity From project developer
60% ratio Rlagoonorg material removal ratio of
the project activity lagoon Sampling events
5% flare_fraction Percentage of biogas sent to flare
Based on technology providers estimates for ex ante calculations, to be monitored ex-post
645,967 Nm3/year Vflare Biogas volume sent to flare Calculated
86.82 m3/h FVRG,hFlow rate of biogas sent to
flare Calculated
Open _ _ Type of flare To estimate ex-ante flare efficiency50% % nflare,h Default flare efficiency According to flare tool
95.00% % heaters fraction Percentage of biogas sent to heaters Calculated (1-flare_fraction)
12,273,365 Nm3/year Vheat Biogas sent to heaters Calculated
98% fheatHeating system combustion
efficiencyEstimated based on technology provider for
ex-ante calculation
Biogas to Flare
Project Activity Inputs Wastewater Treatment Project Activity
Biogas to heaters

PROJECT DESIGN DOCUMENT FORM (CDM PDD) - Version 03.1. CDM – Executive Board page 55
Annex 4
MONITORING INFORMATION
Data generated by the monitoring of the parameters relevant for the CDM project activity will be collected on-site and transferred to EcoSecurities, who will perform a quality check and calculate emission reductions.
In addition to the information contained within the main text of the PDD, to ensure the successful operation of the project and the credibility and verifiability of the emission reductions achieved, the project must have a well-defined management and operational system. It is the obligation of the operator to put such a system in place. It must include the operational procedures and responsibilities associated with the monitoring activities and adequate record keeping. The table below provides an overview of key tasks, indicating who is responsible for their implementation and day-to-day management.
Operational Procedures and Responsibilities The Operational Manager at the Project has overall responsibility for the proper implementation and upkeep of the required tasks and their adequate management.
Task Process Operator Shift Leader Equipment Supplier /
External Company EcoSecurities
Collect Data E R N/A N/A
Enter data into Spreadsheet E R N/A N/A
Make monthly & annual reports E R N/A I
Archive data & reports E R N/A N/A
Calibration/ Maintenance; Rectify
faults R N/A E I
E = Executive responsibility R = Responsibility for overseeing and assuring quality I = To be informed
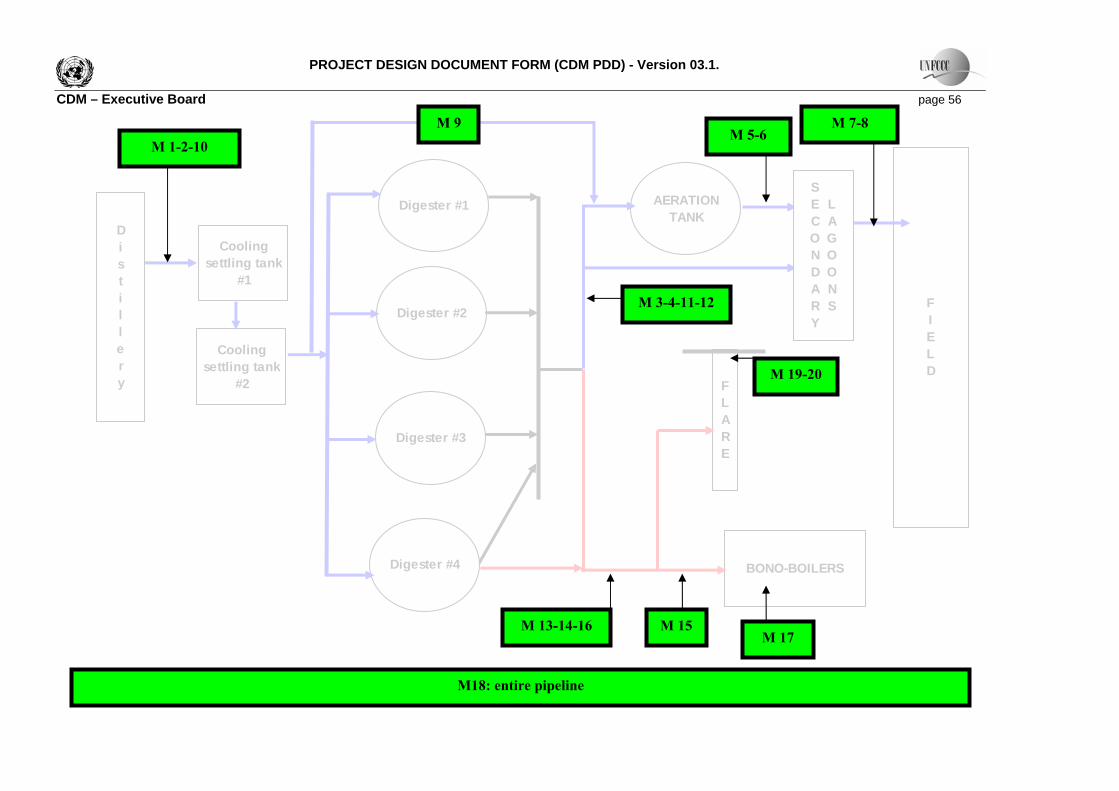
PROJECT DESIGN DOCUMENT FORM (CDM PDD) - Version 03.1. CDM – Executive Board page 56
FIELD
Distillery
Digester #1 AERATION TANK
BONO-BOILERS
FLARE
Cooling settling tank
#1
Cooling settling tank
#2
Digester #2
Digester #3
Digester #4
SECONDARY
LAGOONS
M 13-14-16
M 9
M 15 M 17
M 19-20
M 5-6 M 7-8
M18: entire pipeline
M 3-4-11-12
M 1-2-10

PROJECT DESIGN DOCUMENT FORM (CDM PDD) - Version 03.1. CDM – Executive Board page 57
Annex 5:
SENSITIVITY ANALYSIS
Surface Oxidative Removal Rate Error Factor Applied Baseline Lagoon Emissions
Sensitivity Project Emissions
Sensitivity Emissions Reductions Estimated
Sensitivity
kg/ha/day % T CO2e % T CO2e % T CO2e %254 - 116,492 - 35,269 - 105,003 -318 25% 113,371 2.68% 32,011 9.24% 105,140 -0.001305381 50% 110,299 5.32% 28,804 18.33% 105,276 -0.002600508 100% 104,106 10.63% 22,338 36.66% 105,548 -0.005190
1,270 400% 66,947 42.53% -16,455 146.66% 87,782 0.164005
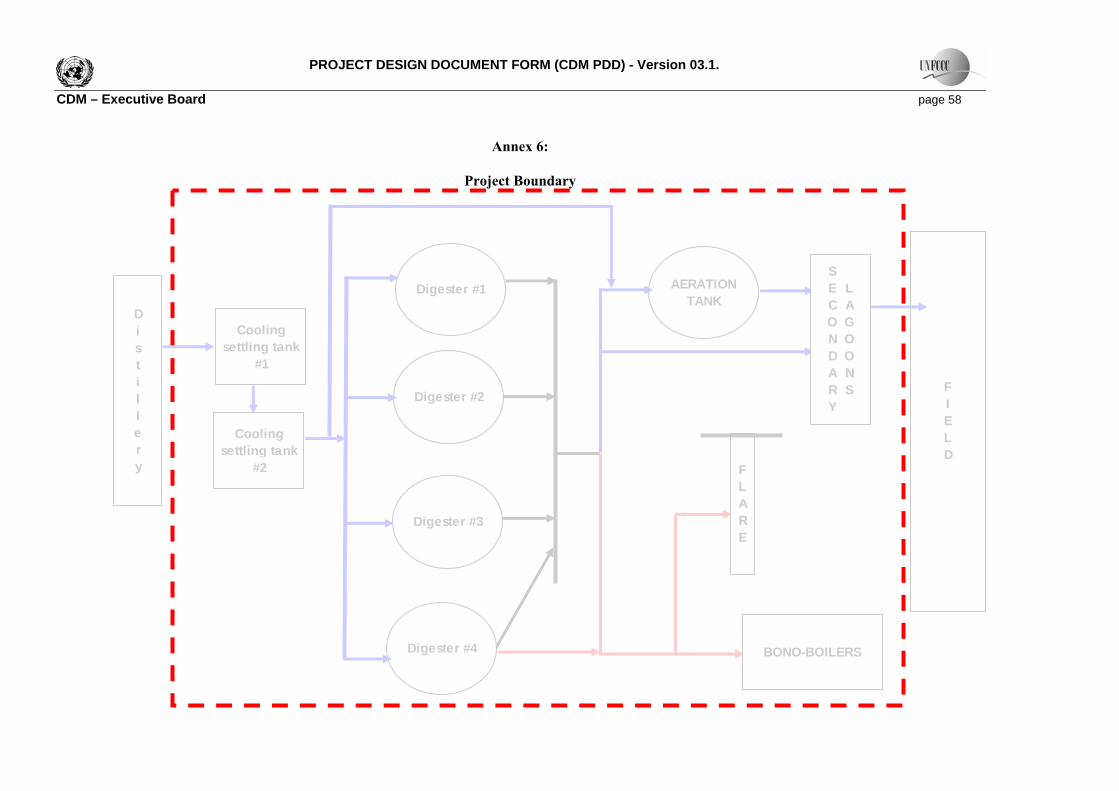
PROJECT DESIGN DOCUMENT FORM (CDM PDD) - Version 03.1. CDM – Executive Board page 58
Annex 6:
Project Boundary
FIELD
Distillery
Digester #1 AERATION TANK
BONO-BOILERS
FLARE
Cooling settling tank
#1
Cooling settling tank
#2
Digester #2
Digester #3
Digester #4
SECONDARY
LAGOONS