bioenergizeme virtual toolkit - energy.gov · bioenergizeme infographic challenge. 3 bioenergy...
TRANSCRIPT

Bioenergy Technologies Office
BioenergizeME InfographicChallenge Toolkit
BioenergizeMEOPERATION
U.S. DEPARTMENT OF ENERGY
OPERATION
Bioenergize
ME
BIO
ENERGY TECHNOLOGIES O
FFIC
E
U.S.
DEPARTMENT OF ENERGY
Developing future
leaders to determine
the bioenergy
landscape of tomorrow
Bioenergy Technologies Office
TABLE OF CONTENTS
1 INTRODUCTION ...................................................................................................2
Why Bioenergy? Why Now? ......................................................................... 3
Bringing Bioenergy into the Classroom ...................................................... 3
2 CHALLENGE DETAILS ......................................................................................... 3
Structure ...........................................................................................................4
Eligibility ...........................................................................................................4
3 CHALLENGE RULES .............................................................................................4
4 REVIEW AND JUDGING ...................................................................................... 5
Phase 1: Infographic Content and Design ................................................... 5
Team Advisor’s Review Prior to Submission to BETO ....................... 5
Bioenergy Technologies Office Review ....................................................... 5
Phase 2: Social Media Campaign .................................................................. 6
Grand Prize Winner Selection ....................................................................... 6
5 AWARD DETAILS ................................................................................................. 6
6 RESEARCH TOPIC AREAS AND PROMPTS ..................................................... 6
7 RUBRIC .................................................................................................................8
8 RESOURCES ......................................................................................................... 9
Library of Congress ........................................................................................ 9
Research Resources ....................................................................................... 9
Infographics .................................................................................................. 10
Examples ............................................................................................ 10
Image Resources ............................................................................... 10
APPENDIX A ........................................................................................................... 11
APPENDIX B ...........................................................................................................12

Bioenergy Technologies Office2
1 DOE will sponsor up to six students and two chaperones (one female and one male).
Welcome to the U.S. Department of Energy (DOE) BioenergizeME Infographic Challenge, where high school students use technology to learn about bioenergy.
In the Challenge, teams research, interpret, apply, and then design an infographic that responds to one of five bioenergy topics. Their infographics are submitted to the DOE Bioenergy Technologies Office (BETO) for a chance to compete in a national social media campaign. Selected infographics are promoted on the Challenge website. The winning team will be invited to present their infographic at BETO’s annual conference in Washington, D.C.1
The purpose of the Challenge is for participants to gain foundational knowledge about bioenergy and to educate others about what they have learned. As energy literacy increases, students will be better equipped to form educated opinions about energy information that they encounter in the media and from other sources. Students of today will be the future leaders of tomorrow. This understanding will be important to their future professions and communities as they make decisions about the changing energy landscape and how bioenergy can play a part.
To make student research easy and effective, the Library of Congress has prepared a Research Strategy Guide, which includes a two-step process for tackling tough research questions. The DOE has also provided students with valuable links and references to help them learn about their bioenergy topics. This toolkit includes rubrics and guides for creating infographics and designing social media campaigns.
Check out the interactive BioenergizeME Infographic Challenge Map to see past submissions from schools across the country. Put your school or organization on the BioenergizeME map by participating in the BioenergizeME Infographic Challenge.
1 INTRODUCTION
Finalists of the Spring 2016Infographics Courtesy of Smithtown High School East
BioenergizeME Infographic Challenge
Bioenergy Technologies Office3
2 OPERATION BioenergizeME is the U.S. Department of Energy Bioenergy Technologies Office’s educational “base camp”, providing resources and activities to help engage younger stakeholders in bioenergy. OPERATION BioenergizeME sup-ports the DOE’s Energy Literacy Framework (see energy.gov/eere/education/energy-literacy-essential-principles-and-fun-damental-concepts-energy-education)—an initiative to increase the public’s understanding of the role of energy in the world and in their daily lives, and to help them apply this understanding to answer questions and solve problems.
3 http://www.xprize.org/prize-development/learning
BRINGING BIOENERGY INTO THE CLASSROOMWHY BIOENERGY? WHY NOW?
Bionenergy has come a long way since wood, dung, and other organic matter was first burned for light and heat by early human civilization. There are many ways to capture bioenergy from organic materials, and technologies are advancing continually to use bioenergy more efficiently and cleanly.
In the United States, biomass provides just a portion of the variety of resources used to meet America’s energy needs. As our awareness increases about the uncertain availability
of energy resources and the environmental effects of producing and using them, it is more important than ever to understand the following:
• Basic energy principles• Energy resource and technology options
available• Benefits and challenges of various energy
resources• How students and their peers can play
an important role in shaping America’s energy future.
Many young people haven’t thought much about bioenergy as an option for power, transportation fuels, and other products. That’s understandable, because the variety of information available about bioenergy, including its benefits and challenges, can be confusing.
The BioenergizeME2 Infographic Challenge is designed to help young people and team advisors better understand this important energy resource topic.
The BioenergizeME Infographic Challenge is suitable for both classroom and independent educational use, and follows the Global Literacy XPRIZE model3 to “rethink learning by harnessing innovation and technology and by placing the capability and desire to become educated into the hands of the learner.” The Challenge is also designed to provide an opportunity for educators to incorporate the emerging area of arts-based learning of STEM into their classrooms.
In the Challenge, teams present their BioenergizeME project in the form of an infographic, which is an interesting and quick way to communicate ideas and educate others. BioenergizeME infographics should convey a well-focused message that is predominantly image-led and that a general audience can understand in just a few minutes.
For a good introduction to exciting things related to bioenergy production, see the video Bioenergy: America’s Energy Future Full version: http://youtu.be/GU0Cu45cLT4 or Short version: http://youtu.be/VskQZAvbjGE.
2 CHALLENGE DETAILS
Team advisors are encouraged to integrate the challenge into their curriculums where it fits best for them, but keep in mind the submission deadlines and the social media campaign schedule.
Bioenergy Technologies Office
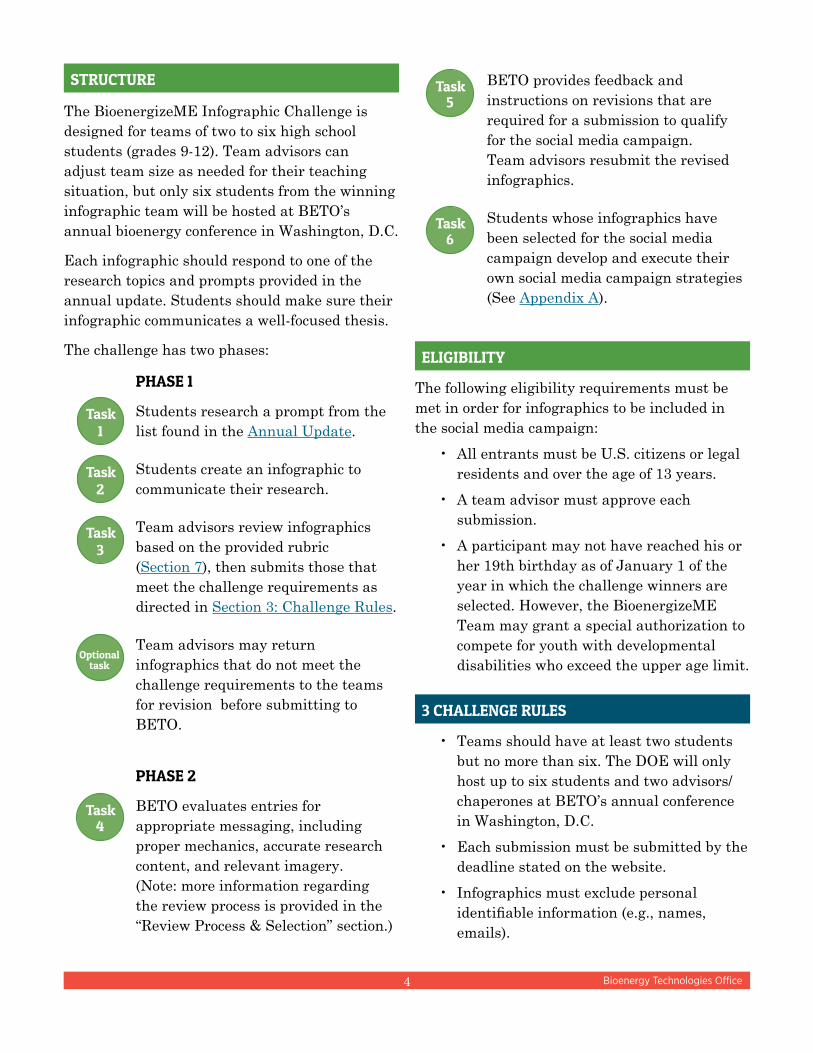
The BioenergizeME Infographic Challenge is designed for teams of two to six high school students (grades 9-12). Team advisors can adjust team size as needed for their teaching situation, but only six students from the winning infographic team will be hosted at BETO’s annual bioenergy conference in Washington, D.C.
Each infographic should respond to one of the research topics and prompts provided in the annual update. Students should make sure their infographic communicates a well-focused thesis.
The challenge has two phases:
PHASE 1
Students research a prompt from the list found in the Annual Update.
Students create an infographic to communicate their research.
Team advisors review infographics based on the provided rubric (Section 7), then submits those that meet the challenge requirements as directed in Section 3: Challenge Rules.
Team advisors may return infographics that do not meet the challenge requirements to the teams for revision before submitting to BETO.
PHASE 2
BETO evaluates entries for appropriate messaging, including proper mechanics, accurate research content, and relevant imagery. (Note: more information regarding the review process is provided in the “Review Process & Selection” section.)
4
STRUCTURE
Task1
Task2
Task3
BETO provides feedback and instructions on revisions that are required for a submission to qualify for the social media campaign. Team advisors resubmit the revised infographics.
Students whose infographics have been selected for the social media campaign develop and execute their own social media campaign strategies (See Appendix A).
Optionaltask
Task4
Task5
ELIGIBILITY
The following eligibility requirements must be met in order for infographics to be included in the social media campaign:
• All entrants must be U.S. citizens or legal residents and over the age of 13 years.
• A team advisor must approve each submission.
• A participant may not have reached his or her 19th birthday as of January 1 of the year in which the challenge winners are selected. However, the BioenergizeME Team may grant a special authorization to compete for youth with developmental disabilities who exceed the upper age limit.
3 CHALLENGE RULES
• Teams should have at least two studentsbut no more than six. The DOE will onlyhost up to six students and two advisors/chaperones at BETO’s annual conferencein Washington, D.C.
• Each submission must be submitted by thedeadline stated on the website.
• Infographics must exclude personalidentifiable information (e.g., names,emails).
Task6
Bioenergy Technologies Office5
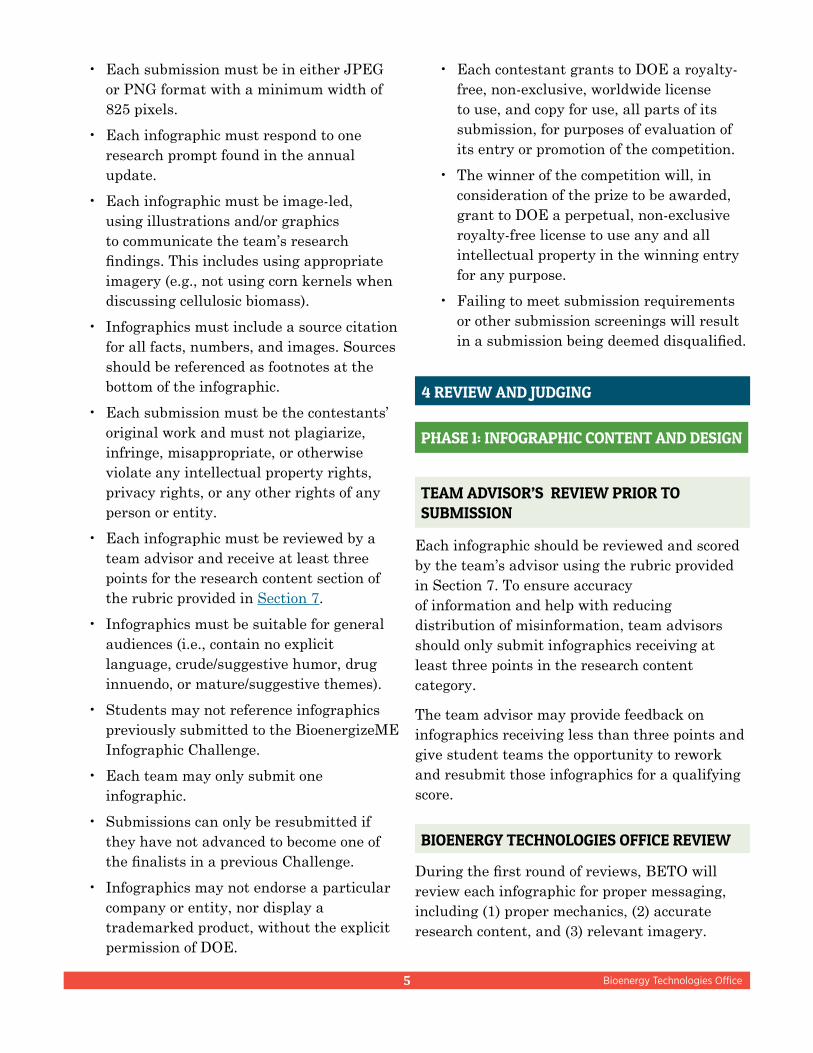
• Each contestant grants to DOE a royalty-free, non-exclusive, worldwide licenseto use, and copy for use, all parts of itssubmission, for purposes of evaluation ofits entry or promotion of the competition.
• The winner of the competition will, inconsideration of the prize to be awarded,grant to DOE a perpetual, non-exclusiveroyalty-free license to use any and allintellectual property in the winning entryfor any purpose.
• Failing to meet submission requirementsor other submission screenings will resultin a submission being deemed disqualified.
• Each submission must be in either JPEGor PNG format with a minimum width of825 pixels.
• Each infographic must respond to oneresearch prompt found in the annualupdate.
• Each infographic must be image-led,using illustrations and/or graphicsto communicate the team’s researchfindings. This includes using appropriateimagery (e.g., not using corn kernels whendiscussing cellulosic biomass).
• Infographics must include a source citationfor all facts, numbers, and images. Sourcesshould be referenced as footnotes at thebottom of the infographic.
• Each submission must be the contestants’original work and must not plagiarize,infringe, misappropriate, or otherwiseviolate any intellectual property rights,privacy rights, or any other rights of anyperson or entity.
• Each infographic must be reviewed by ateam advisor and receive at least threepoints for the research content section ofthe rubric provided in Section 7.
• Infographics must be suitable for generalaudiences (i.e., contain no explicitlanguage, crude/suggestive humor, druginnuendo, or mature/suggestive themes).
• Students may not reference infographicspreviously submitted to the BioenergizeMEInfographic Challenge.
• Each team may only submit oneinfographic.
• Submissions can only be resubmitted ifthey have not advanced to become one ofthe finalists in a previous Challenge.
• Infographics may not endorse a particularcompany or entity, nor display atrademarked product, without the explicitpermission of DOE.
4 REVIEW AND JUDGING
PHASE 1: INFOGRAPHIC CONTENT AND DESIGN
TEAM ADVISOR’S REVIEW PRIOR TO SUBMISSION
Each infographic should be reviewed and scored by the team’s advisor using the rubric provided in Section 7. To ensure accuracy of information and help with reducing distribution of misinformation, team advisors should only submit infographics receiving at least three points in the research content category.
The team advisor may provide feedback on infographics receiving less than three points and give student teams the opportunity to rework and resubmit those infographics for a qualifying score.
During the first round of reviews, BETO will review each infographic for proper messaging, including (1) proper mechanics, (2) accurate research content, and (3) relevant imagery.
BIOENERGY TECHNOLOGIES OFFICE REVIEW

Bioenergy Technologies Office6
An official link unique to each submission will be provided to the team advisors. Advisors should instruct teams to share the links via the students’ personal social media outlets. Finalists are determined by the number of unique page views to their infographic page, so encourage your social media networks to view the link in addition to liking and sharing. Infographics that have received more than 500 unique page views will qualify for the second round of reviews.
The Social Media Guide in Appendix A was developed specifically for the BioenergizeME Infographic Challenge to provide tips and guidance to students for planning and executing their social media campaigns.
PHASE 2: SOCIAL MEDIA CAMPAIGN
All teams who have received 500 or more unique page views in the Social Media Campaign will move forward to the second round of reviews.
During this review, BETO’s technical team will select the top three infographics based on the design and research content of the rubric. BETO’s Director will select the grand prize winner.
GRAND PRIZE WINNER SELECTION
Awards:
• National promotion of infographics thatqualify for the BioenergizeME SocialMedia Campaign.
• Recognition of the finalists with officialletters of recognition and certificates.
• Recognition of the first-place teamat BETO’s annual conference held inWashington, D.C.
5 AWARD DETAILS
To ensure that teams have the flexibility to develop their ideas and conduct their own research, topic areas are provided via the BioenergizeME website and Annual Update. The topic areas help students explore the role of biomass in the context of an energy landscape that has changed many times throughout human history. Within each topic area are prompts that are foundational, broad, and open-ended to foster student-centered discovery.
6 RESEARCH TOPIC AREAS AND PROMPTS
Note: Review of relevant imagery during the first round of reviews verifies that images convey messaging that is consistent with the text. For example, infographics that use images of yellow corn kernels rather than corn plants are inconsistent with messaging about advanced biofuels, which do not use feedstocks that compete with food and feed demands.
Teams will have at least one full week to complete required revisions. All required changes must be addressed in order for the team to advance to the Social Media Campaign. The BioenergizeME Team reserves the right to disqualify teams from advancing to the Social Media Campaign if required changes have not been met.
The team advisor will be contacted to inform teams who have submitted qualifying infographics that they should proceed with planning their social media campaign strategy. The selected infographics will be posted on the BioenergizeME Infographic Challenge Map, and a link to the infographics will be provided to the team advisors.
Bioenergy Technologies Office7
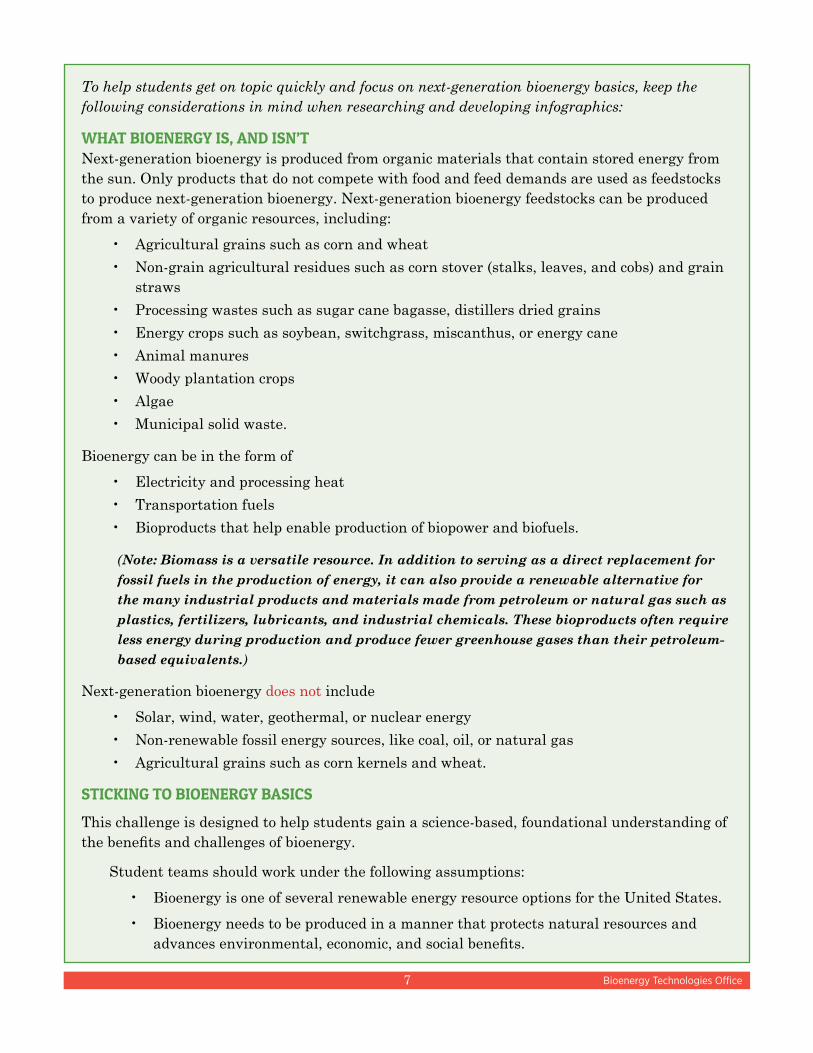
To help students get on topic quickly and focus on next-generation bioenergy basics, keep the following considerations in mind when researching and developing infographics:
WHAT BIOENERGY IS, AND ISN’TNext-generation bioenergy is produced from organic materials that contain stored energy from the sun. Only products that do not compete with food and feed demands are used as feedstocks to produce next-generation bioenergy. Next-generation bioenergy feedstocks can be produced from a variety of organic resources, including:
• Agricultural grains such as corn and wheat
• Non-grain agricultural residues such as corn stover (stalks, leaves, and cobs) and grainstraws
• Processing wastes such as sugar cane bagasse, distillers dried grains
• Energy crops such as soybean, switchgrass, miscanthus, or energy cane
• Animal manures
• Woody plantation crops
• Algae
• Municipal solid waste.
Bioenergy can be in the form of
• Electricity and processing heat
• Transportation fuels
• Bioproducts that help enable production of biopower and biofuels.
(Note: Biomass is a versatile resource. In addition to serving as a direct replacement for fossil fuels in the production of energy, it can also provide a renewable alternative for the many industrial products and materials made from petroleum or natural gas such as plastics, fertilizers, lubricants, and industrial chemicals. These bioproducts often require less energy during production and produce fewer greenhouse gases than their petroleum-based equivalents.)
Next-generation bioenergy does not include
• Solar, wind, water, geothermal, or nuclear energy
• Non-renewable fossil energy sources, like coal, oil, or natural gas
• Agricultural grains such as corn kernels and wheat.
STICKING TO BIOENERGY BASICS
This challenge is designed to help students gain a science-based, foundational understanding of the benefits and challenges of bioenergy.
Student teams should work under the following assumptions:
• Bioenergy is one of several renewable energy resource options for the United States.
• Bioenergy needs to be produced in a manner that protects natural resources andadvances environmental, economic, and social benefits.
Bioenergy Technologies Office8
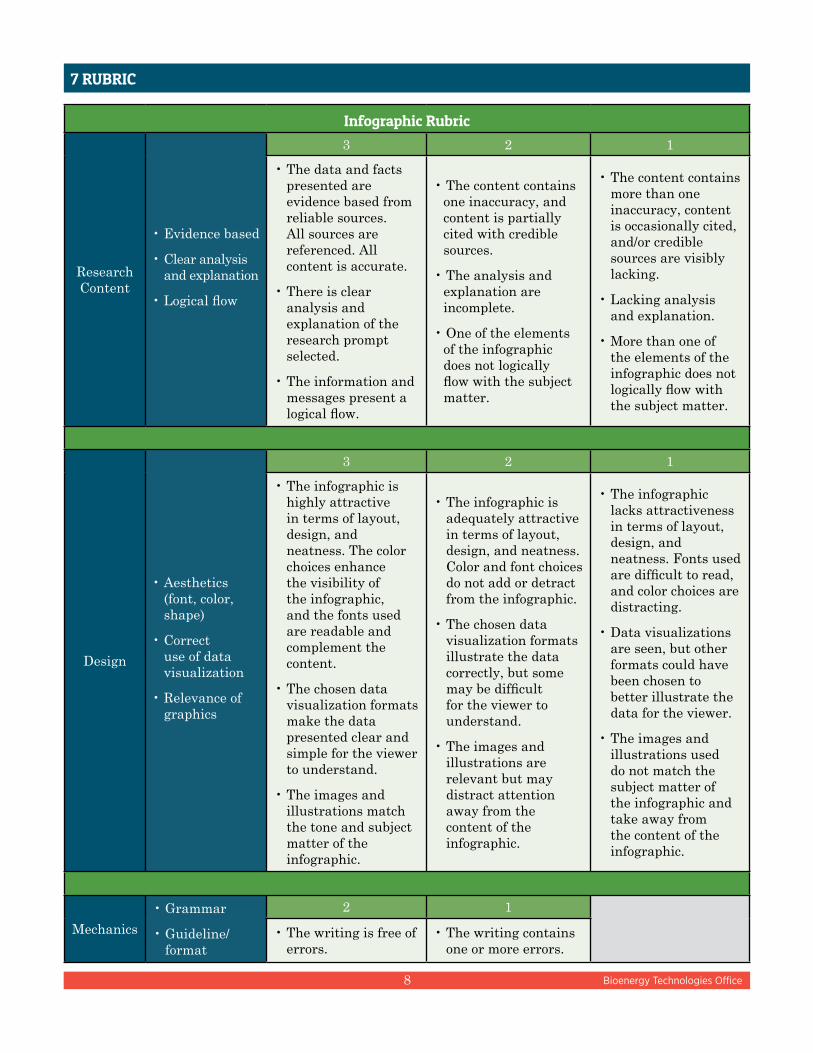
7 RUBRIC
Infographic Rubric
Research Content
• Evidence based
• Clear analysis and explanation
• Logical flow
3 2 1
• The data and facts presented are evidence based from reliable sources. All sources are referenced. All content is accurate.
• There is clear analysis and explanation of the research prompt selected.
• The information and messages present a logical flow.
• The content contains one inaccuracy, and content is partially cited with credible sources.
• The analysis and explanation are incomplete.
• One of the elements of the infographic does not logically flow with the subject matter.
• The content contains more than one inaccuracy, content is occasionally cited, and/or credible sources are visibly lacking.
• Lacking analysis and explanation.
• More than one of the elements of the infographic does not logically flow with the subject matter.
Design
• Aesthetics (font, color, shape)
• Correct use of data visualization
• Relevance of graphics
3 2 1
• The infographic is highly attractive in terms of layout, design, and neatness. The color choices enhance the visibility of the infographic, and the fonts used are readable and complement the content.
• The chosen data visualization formats make the data presented clear and simple for the viewer to understand.
• The images and illustrations match the tone and subject matter of the infographic.
• The infographic is adequately attractive in terms of layout, design, and neatness. Color and font choices do not add or detract from the infographic.
• The chosen data visualization formats illustrate the data correctly, but some may be difficult for the viewer to understand.
• The images and illustrations are relevant but may distract attention away from the content of the infographic.
• The infographic lacks attractiveness in terms of layout, design, and neatness. Fonts used are difficult to read, and color choices are distracting.
• Data visualizations are seen, but other formats could have been chosen to better illustrate the data for the viewer.
• The images and illustrations used do not match the subject matter of the infographic and take away from the content of the infographic.
Mechanics
• Grammar
• Guideline/format
2 1
• The writing is free of errors.
• The writing contains one or more errors.

Bioenergy Technologies Office9
Approaching the research process with a plan in mind will give direction to your efforts and help you stay focused. The following two sections outline the resources BETO has compiled to assist students in developing a strategic plan for their research efforts, as well as identifying peer-reviewed, academic or professional sources.
8 RESOURCES
The Bioenergy Technologies Office collaborated with the Library of Congress to develop a collection of quality resources for the BioenergizeME Infographic Challenge. These resources provide a solid foundation for conducting bioenergy research.The Library of Congress is the world’s largest library by number of catalogued items and serves as the research library for the U.S. Congress. The Library of Congress developed the BioenergizeMe Infographic Challenge Research Strategy Guide. The Research Strategy Guide provides students with a starting point for their research and provides guidance on developing a successful research strategy. This document is available on the BioenergizeME website and via the link below:
• Library of Congress Research Strategy Guide
The Library of Congress is a valuable resource for researchers at any level, and the “Ask a Librarian” function is a great way to get research assistance from Library of Congress librarians.
LIBRARY OF CONGRESS
The Internet can be a valuable tool for research, but it is important to verify that your sources of information about bioenergy are both credible and timely. That is why BETO has compiled a comprehensive list of reliable resources to provide a foundation for students to begin their research.
These sources can be found in the BioenergizeME Research Resources Guide and include valuable publications, fact sheets, and reports from a variety of organizations (e.g. government agencies, national laboratories, research centers, and major academic institutions) on the leading edge of science and technology research.
• BioenergizeME Research Resource Guide
To facilitate the review process during round one, The BioenergizeME Team recommends that students use the resources provided in this guide to generate the content for their infographics. This will enable the reviewers to fact check infographics in a timely manner and ensure students will have ample time to make the necessary revisions.
Teams are welcome to use sources not included in the Resource Guide, as long as they are from science-based or peer-reviewed sources (e.g., local, state, and federal government agencies, national laboratories, research centers, academic institutions, science journals, etc.).
RESEARCH RESOURCES

Bioenergy Technologies Office
BETO compiled the resources listed in the following two sections to assist students with developing their infographics.
The Infographic Guide was developed specifically for the BioenergizeME Infographic Challenge to provide tips and guidance for creating an infographic.
• BioenergizeME Infographic Guide
INFOGRAPHICS
The infographics found below provide great examples of high-quality infographics that were produced for DOE and may provide useful examples for students in designing their own.
• Pinterst: Energy Infographics
• POET-DSM: Project LIBERTY
• Alpena Biorefinery
• Warding Off Energy Vampires and Phantom Loads
• Wind Energy in America
• Turning the Holidays into Green Energy
Visit the Challenge Winners page to view the past winning infographics.
EXAMPLES
The following resources provide free image galleries that can be used to find bioenergy-related photos and graphics:
• Department of Energy
• Photo Gallery
• Energy.gov Flickr
• Pacific Northwest National Laboratory—PictureThis
• National Renewable Energy Laboratory—Image Gallery
• Department of Agriculture
• Agricultural Research Service Image Gallery
• Photography Services
Documenting sources for images can be challenging, especially with the variety of electronic resources available. Images, diagrams, and artistic works should be cited as you would cite any other type of work. Please follow the instructions for citations listed on the source website, which typically includes copyright information and a statement of permission for use.
IMAGE RESOURCES
10
Bioenergy Technologies Office11
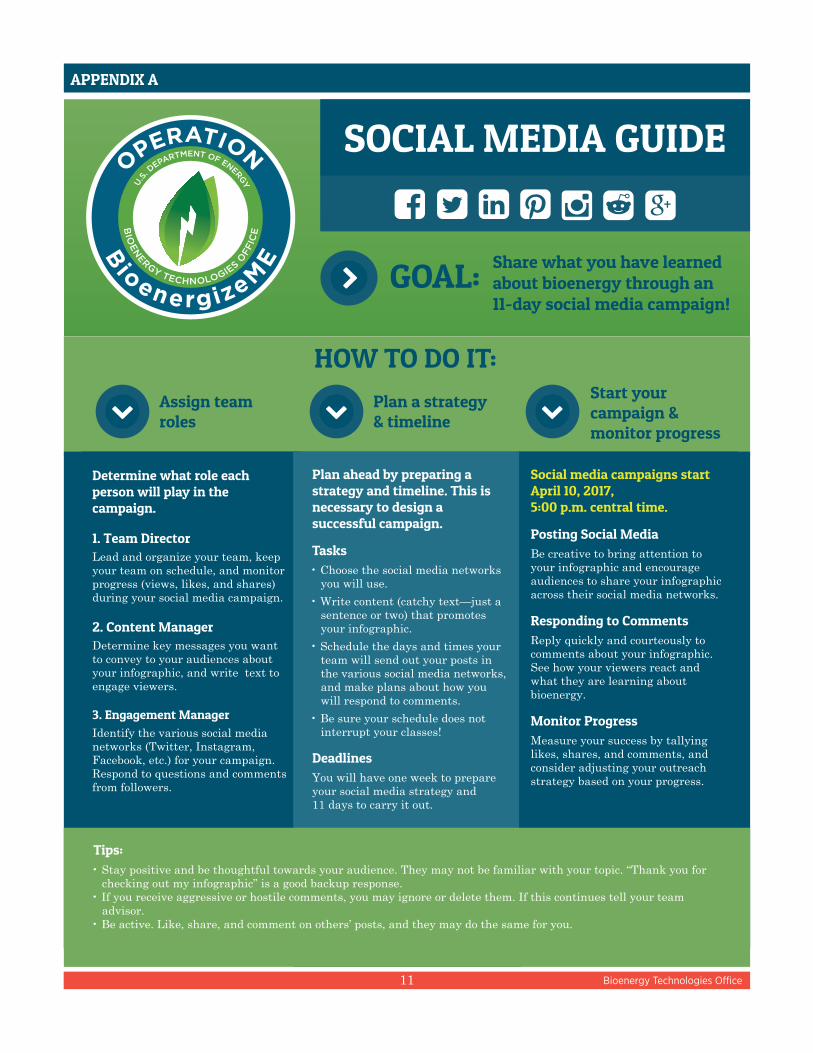
APPENDIX A
� �� � � � �
� GOAL:
SOCIAL MEDIA GUIDE
Share what you have learned about bioenergy through an 11-day social media campaign!
� Assign teamroles
� Plan a strategy & timeline
� Start your campaign & monitor progress
HOW TO DO IT:
Determine what role each person will play in the campaign.
1. Team Director Lead and organize your team, keep your team on schedule, and monitor progress (views, likes, and shares) during your social media campaign.
2. Content Manager
Determine key messages you want to convey to your audiences about your infographic, and write text to engage viewers.
3. Engagement ManagerIdentify the various social media networks (Twitter, Instagram, Facebook, etc.) for your campaign. Respond to questions and comments from followers.
Plan ahead by preparing a strategy and timeline. This is necessary to design a successful campaign.
Tasks• Choose the social media networks
you will use.
• Write content (catchy text—just a sentence or two) that promotes your infographic.
• Schedule the days and times your team will send out your posts in the various social media networks, and make plans about how you will respond to comments.
• Be sure your schedule does not interrupt your classes!
DeadlinesYou will have one week to prepare your social media strategy and 11 days to carry it out.
Social media campaigns start April 10, 2017, 5:00 p.m. central time.
Posting Social MediaBe creative to bring attention to your infographic and encourage audiences to share your infographic across their social media networks.
Responding to CommentsReply quickly and courteously to comments about your infographic. See how your viewers react and what they are learning about bioenergy.
Monitor ProgressMeasure your success by tallying likes, shares, and comments, and consider adjusting your outreach strategy based on your progress.
Tips:• Stay positive and be thoughtful towards your audience. They may not be familiar with your topic. “Thank you for
checking out my infographic” is a good backup response.• If you receive aggressive or hostile comments, you may ignore or delete them. If this continues tell your team
advisor.• Be active. Like, share, and comment on others’ posts, and they may do the same for you.
OPERATION
Bioenergize
ME
BIO
ENERGY TECHNOLOGIES O
FFIC
E
U.S.
DEPARTMENT OF ENERGY
Bioenergy Technologies Office
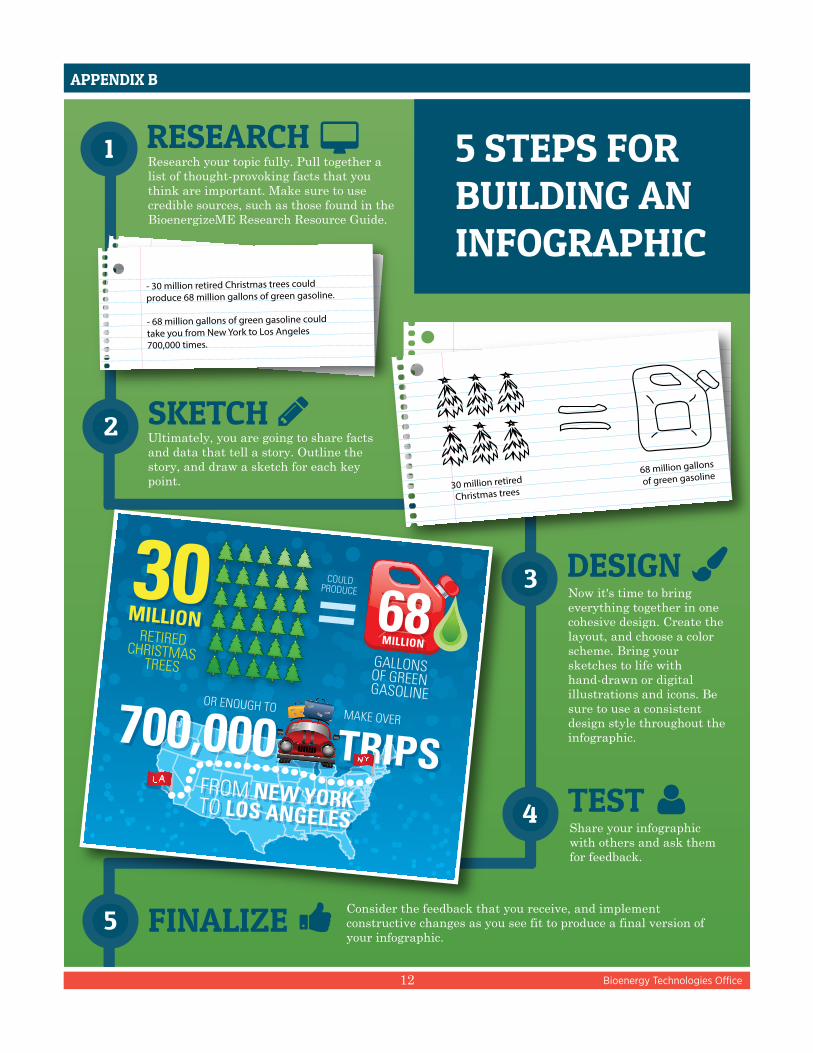
APPENDIX B
�
�
�
�
�
- 30 million retired Christmas trees couldproduce 68 million gallons of green gasoline.
- 68 million gallons of green gasoline could take you from New York to Los Angeles700,000 times.
3 DESIGNNow it's time to bring everything together in one cohesive design. Create the layout, and choose a color scheme. Bring your sketches to life with hand-drawn or digital illustrations and icons. Be sure to use a consistent design style throughout the infographic.
1 RESEARCH 5 STEPS FOR BUILDING ANINFOGRAPHIC
2 SKETCHUltimately, you are going to share facts and data that tell a story. Outline the story, and draw a sketch for each key point.
4 TESTShare your infographic with others and ask them for feedback.
5 FINALIZE Consider the feedback that you receive, and implement constructive changes as you see fit to produce a final version of your infographic.
Research your topic fully. Pull together a list of thought-provoking facts that you think are important. Make sure to use credible sources, such as those found in the BioenergizeME Research Resource Guide.
30 million retired
Christmas trees
68 million gallons
of green gasoline
RETIRED CHRISTMAS TREES
FROM NEW YORK TO LOS ANGELES
FROM NEW YORK TO LOS ANGELES
OR ENOUGH TO MAKE OVER700,000700,000 TRIPSTRIPS
MILLION MILLION MILLION
MILLION
COULD PRODUCE
GALLONS OF GREEN GASOLINE
12
Bioenergy Technologies Office
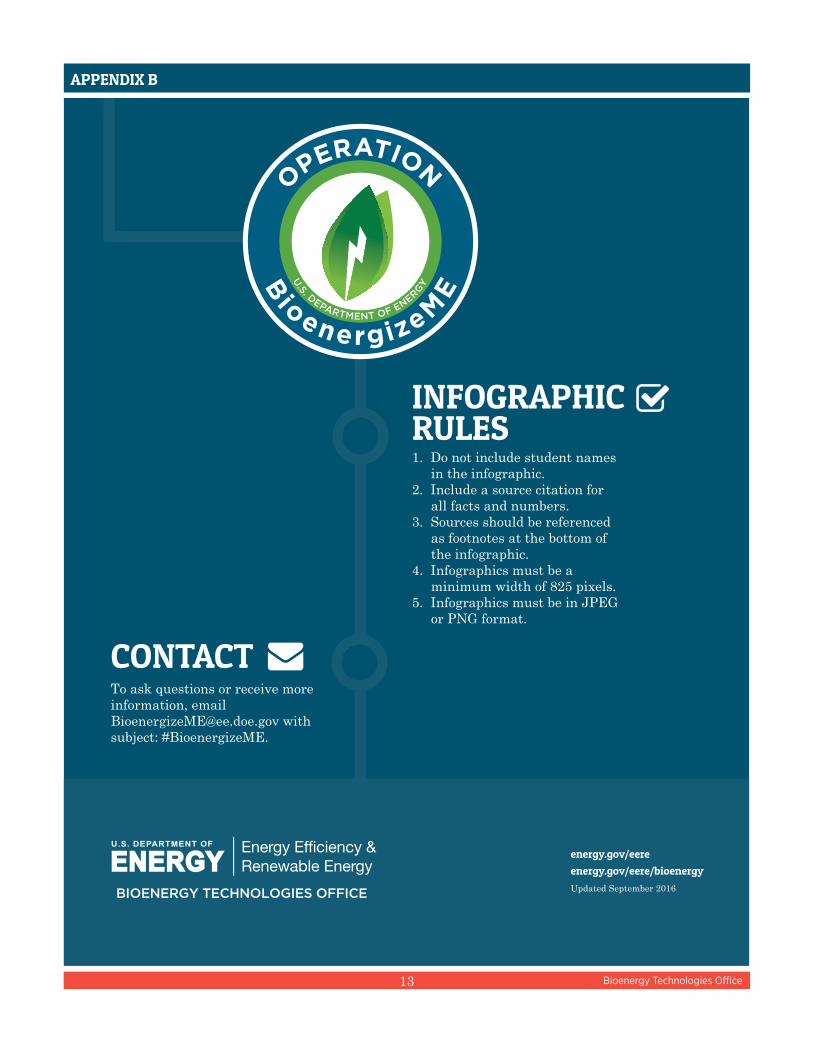
To ask questions or receive more information, email [email protected] with subject: #BioenergizeME.
CONTACT �
OPERATION
Bioenergize
ME
U.S. DEPARTMENT OF ENERGY
1. Do not include student names in the infographic.
2. Include a source citation for all facts and numbers.
3. Sources should be referenced as footnotes at the bottom of the infographic.
4. Infographics must be a minimum width of 825 pixels.
5. Infographics must be in JPEG or PNG format.
INFOGRAPHICRULES
�
energy.gov/eereenergy.gov/eere/bioenergyUpdated September 2016
13
APPENDIX B

Bioenergy Technologies Office
DOE/EE-1139 • October 2016
For more information, visit: energy.gov/eere | energy.gov/eere/bioenergy