bioenergy crop production and climate policies: a von thunen
TRANSCRIPT

Jussi Lankoski &Markku Ollikainen
Bioenergy crop production and climatepolicies:A von Thunen model and case of reedcanary grass in Finland
University of HelsinkiDepartment of Economics and ManagementDiscussion Papers n:o 17Environmental EconomicsHelsinki 2006

1
Jussi Lankoski*) and Markku Ollikainen**)
Bioenergy crop production and climate policies:
A von Thunen model and case of reed canary grass in Finland1
October 30, 2006
*) Agrifood Research Finland, Economic Research, P.O. Box 3, FIN-00411 Helsinki.Finland. E-mail: [email protected], and the OECD, Paris (2005-2007).**) Department of Economics and Management, P.O. Box 27, 00014 University ofHelsinki. E-mail: [email protected]
1 We thank Stefan Bäckman, Wilfrid Legg and Frank van Tongeren for helpful comments.

2
Bioenergy crop production and climate policies:
A von Thunen model and case of reed canary grass in Finland
AbstractWe examine bioenergy crop cultivation in a von Thunen framework with homogenousagricultural land and increasing transportation costs by distance. Bioenergy crops canoffset emissions from fossil fuels but their cultivation causes nutrient runoff. Increasingtransportation costs imply that the fertilizer intensity differs across locations; it alsodefines the socially and privately optimal extensive margin of bioenergy crop production.If climate benefits are only partially capitalized in the bioenergy crop price, the privatelyoptimal fertilizer application is suboptimal calling for location specific input or outputsubsidies. A theoretical model is applied to reed canary grass (Phalaris arundinacea L.)cultivation in Finland. Reed canary grass offsets emissions from peat in electricityproduction. Using oats as an alternative crop and permit price € 20/tonne of CO2emissions as a proxy for the climate benefits, cultivation of reed canary grass is sociallyoptimal at a distance over 100 kilometres from the power plant and still offsets more than6.5 tonnes per ha of CO2 emissions from peat.
Keywords: von Thunen model, climate benefits, bioenergy crops, emission permitmarket, nutrient runoffJEL classification: Q18, Q24, Q25

3
1. Introduction
The agricultural sector is both a source and a sink of greenhouse gases (GHG) (carbon
dioxide CO2, methane CH4, and nitrous oxide N2O). The share of agriculture in OECD
total national gross emissions in CO2 equivalents is below 10%, but for methane and
nitrous oxide agriculture contributes a major share, 40% and 60%, respectively (OECD
2001). The agricultural sector has the potential for absorbing CO2 emissions through
changes in tillage practices, such as adopting no-till, or changes in land use forms, such
as conversion of arable land to grassland.
What is more, agriculture has the potential to offset GHG emissions through production
of bioenergy from agricultural biomass (feedstocks). Agricultural biomass can be used to
produce energy (heat and electricity), and biofuels, for instance, bioethanol and biogas.
The recently established European Union Emission Trading Scheme (EU-ETS) has
opened new possibilities for the production of bioenergy crops in Europe. Emissions
generated using fossil fuels in energy production belong to the EU-ETS, while emissions
from renewable energy do not. Because power plants must pay a permit price for each
unit of CO2 emitted from fossil fuels, the relative energy prices have changed in favour of
renewable energy sources and their use is increasing.2
For farmers bioenergy crop cultivation provides an interesting new production alternative
and for society bioenergy crops provide potential climate benefits and some other
positive environmental effects as well. Given that most bioenergy crops are perennial
crops with less tillage and lower fertilizer intensity than in cereals production, nutrient
runoff to watercourses could be reduced as well. These positive effects are, however, to
some extent offset by the fact that transportation of bioenergy crops causes emissions.
Moreover, transportation is costly relative to the value of transported feedstock, which
implies that the demand for bioenergy crops and the resulting production provides a local
2 In the Finnish energy sector peat is typically replaced by bioenergy from agriculture or from forestry. Peatis subject to EU-ETS and its profitability has decreased quite dramatically. Many power plants currentlyuse a mixture of peat and reed canary grass. Some power plants use a mixture of wood chips and reedcanary grass to hedge against volatile wood chips prices.

4
solution at best. Hence, an interesting research question is whether the production of
bioenergy crops is socially desirable when environmental and economic effects are taken
into account – and to what extent?
In this paper we examine the socially and privately optimal production of bioenergy
crops. We develop a von Thunen framework, which is well-designed to analyse economic
decisions when distance matters. In our model a power plant, locating at the centre of an
area, demands bioenergy crops. The arable land around the power plant is homogenous in
terms of its productivity. Transportation is costly and effectively reduces profitability of
bioenergy crop production when the distance to the power plant increases. Our analysis
comprises both CO2 emissions to air and nutrient runoff to waterways. We define the
optimal fertilizer intensity in each location. For the given alternative crop, we determine
the extensive margin of production; this gives the area that is optimal to allocate to the
production of bioenergy crops. Finally, we examine the private incentives of bioenergy
crop cultivation and design the first-best instruments to encourage bioenergy cultivation
to the socially optimal level.
To assess empirically the private profitability and social returns of bioenergy crop
production, we apply our von Thunen model to Finnish agriculture. We consider
cultivation of reed canary grass (Phalaris arundinacea L.), which is regarded as the most
suitable bioenergy crop for the climatic conditions in northern Scandinavia (Landström et
al. 1996). According to Finnish experiments, reed canary grass can be cultivated on
almost all soil types (textural classes) but highest yields are obtained on organic soils. In
the Finnish climatic and soil conditions reed canary grass produces 6-8 tons of dry mass
per hectare for a time period of 10-12 years (Pahkala et al. 2005). The average net
calorific heat value is 2.45-3.94 MWh per ton of dry mass (with moisture content of 15-
20%), yielding a mean energy production of 19.2 MWh per ha at harvest of 6 tonnes per
ha.
Our work relates to the previous literature as follows. Earlier studies have mainly been
empirical and focused on the potential supply of bioenergy crops. Downing and Graham

5
(1996) and Walsh (1998; 2000) outline an approach to determine the supply function of
bioenergy crops subject to relative prices and government subsidies. Walsh et al. (2003)
estimate the bioenergy potential of U.S. agriculture and the required prices of bioenergy
to compete on land use with other crops. Larsson (2005) applies a supply function
approach to Swedish agriculture. While the above studies neglect the climate effects of
bioenergy crops, Faaij et al. (1998) include climate damage when assessing externalities
of electricity production from biomass and coal. Börjesson (1999a; 1999b) provide a
comprehensive representation of the environmental benefits and economic aspects of
energy crop cultivation. Unlike the present paper, these studies do not describe the
cultivation of bioenergy crops in detail, nor do they provide a theoretical treatment of the
subject.
The rest of the paper is organized as follows. In section 2 we develop the theoretical
representation of von Thunen model. The empirical model is developed in section 3 and
the results of the analysis are presented in section 4. Conclusions and policy implications
are given in section 5.
2. Bioenergy production in the von Thunen model
In this section we develop our theoretical model. The model consists of three basic
components: private profits from bioenergy production, nutrient runoff damage and CO2
reduction benefits.
2.1 The basic framework
Consider a local power plant that buys a bioenergy crop from the neighbouring fields and
uses it to replace some fossil fuel in electricity production. The power plant’s ability to
pay for the bioenergy crop depends among other things on the energy content of the
bioenergy, substitution possibilities between bioenergy and fossil fuel, as well as on the
price of emission permits. The power plant pays a gate price p for bioenergy. We
assume that this price is determined competitively. Moreover, we assume that the net

6
price after transportation cost, p, decreases in distance, k, and is given by )(kpp η−= ,
where )(kη is the (convex) transportation cost with 0)( >′ kη and 0)( >′′ kη .
An important question concerning the gate price is whether the climate benefits are
actually capitalized in the gate price, or not. Referring to empirical evidence, in Finland
the listed gate prices do not include climate benefits but the power plants add to the gate
price an emission trading premium, which implies capitalization. However, as we will
find in the empirical section, this extra payment does not fully capitalize the climate
benefits into the price paid to farmers. We solve the social optimum using the gate price
and accounting fully for the social climate benefits. When comparing the social optimum
to the private optimum, we account for the emission trading premium and distinguish
between partial and full capitalization.
In accordance with the empirical evidence, we assume that the bioenergy crop (such as
reed canary grass, or switch grass) is a perennial crop having n-period long rotation age.
Producing the bioenergy crop requires an initial investment in the first year. It includes
primary tillage (ploughing), seedbed tillage (harrowing), planting, and crop protection.
After the first year, an annual fertilizer input, l, is applied and the crop provides a positive
harvest over 1−n years. The energy crop grows according to a concave response
function, )(lfQ = . We denote the first year’s establishment cost by C and the real
interest rate by r. The private profits of a farmer producing bioenergy crop in the relevant
locations, mk ,...,1= , of the neighbourhood of the power plant is given by,
[ ][ ] Ccllpfrn
ttt
t −∑ −+==
−−
2
)1( )()1(π . (1)
Fertilizer application causes nutrient runoff, z, to waterways. It depends on the fertilizer
application, so that in each period nt ,...,2= we have )( tt lgz = as the per parcel
(location) runoff. We regard the first year’s fertilizer application as technologically fixed

7
( )( 11 lgz = ). Let the periodic damage from runoff be d. The present value of nutrient
damages over the whole rotation period, D, can be expressed as,
∑ ++==
−−n
tt
t lgdrlgdD2
)1(1 ))(()1())(( . (2)
We assume that the damage is increasing and convex ( 0>′D and 0>′′D ).
The bioenergy crop can be used to provide a certain amount of electricity. Let a
coefficient α ( 10 << α ) denote how much electricity is produced from one metric ton
of bioenergy. Furthermore, let ε ( 10 << ε ) denote how much electricity provided by
this ton offsets the fossil fuel-based CO2 emission in electricity production. To ease
notation we let αεε = to denote the offset of CO2 emissions. Let b denote the periodic
social benefits from reduced CO2 emissions. These benefits accrue from the second year
onwards, and we denote their present value over the rotation period by B
∑=
−−+=n
t
tt rlfbB
2
)1()1))(((ε . (3)
The climate benefit function is concave in the CO2 offsets ( 0>′B and 0<′′B ).
2.2 The socially and privately optimal bioenergy crop production
We start with the socially optimal production and assume that society maximizes the sum
of the consumers’ and producers’ surplus. As we treat the price of bioenergy crop as
constant, this amounts to maximizing the sum of equations (1) – (3). Thus, the social
welfare function is,
[ ][ ] ))(())(())(()()1( 12
)1( lgdClfblgdcllpfrSWn
ttttt
t −−∑ +−−+==
−− ε (4)

8
Recall, the establishment of bioenergy crop production is technologically fixed. Thus, the
key economic problem of the social planner is to choose fertilizer application over
periods nt ,...,2= and locations mk ,...,1= so as to maximize (4). The first and the
second order conditions of the social optimum can be expressed as,
0)()()()( =′⋅′+⋅′−−′= lfbgdclfpSW ll ε (5)
0)()())()(()())(()( 22 <′′⋅′+′⋅′′+⋅′−⋅′′−′′= lfblfbgdgdlfpSW lllll εε . (6)
Note first, that equations (5) and (6) hold for any period nt ,...,2= .3 Thus, the real
interest rate does not affect fertilizer intensity, only the present value of the net returns.
Therefore, fertilizer intensity remains the same over the rotation period in each location.
Hence, the economic interpretation of equation (5) is conventional. Society chooses the
level of fertilizer application by equalizing the social marginal benefits to the social
marginal costs, that is, lgdclfblfp )()()()( ⋅′+=′⋅′+′ ε .4 Importantly, fertilizer intensity
differs between locations because the net price of the energy crop is decreasing in
distance k due to transportation costs, as shown by equation (7):
0)()(<
′′=
llSWlfk
dkdl η . (7)
Assuming all external effects are absent, equation (5) reduces to the privately optimal
condition, clfp =′∗ )( , where ∗p refers to the possibility that the price partially or fully
includes the offset benefits via emission trading. Naturally, the privately optimal
condition requires that the value of the marginal product of fertilizer use equals the input
price. Similarly, fertilizer intensity differs between locations.
3 Given that fertilizer intensity is the same over the whole period, we hereafter drop the time subscripts tfrom the equations (5) and (6).4 Denote the alternative crop by hat and its price by q. Then the target function and the first-order condition
are [ ][ ]∑=
−− −−+n
t
t lgdcllfqr1
)1( ))(()()1( and 0)()( =⋅′−−′ lgdclfq , respectively. Interpretation is similar
as above.

9
How do the socially and privately optimal solutions relate to each other? It depends on
the degree of capitalization of the climate benefits in the price of the bioenergy crop. If
no capitalization occurs, the sign of )()())(( lfbgd l ′⋅′−⋅′ ε in equation (5) is decisive. If the
marginal climate benefits dominate the marginal runoff damages then the socially
optimal fertilizer intensity is higher than the privately optimal one; otherwise it is lower.
Under full capitalization, private fertilizer intensity is too high, because runoff damage is
neglected. Depending on the degree of capitalization, the intermediate cases may entail
too high or too low application rates.
The socially and privately optimal extensive margin of bioenergy crop cultivation is
defined by the location where the social returns and private profits from bioenergy crop
equal those of the alternative crop. Denote the social returns (private profits) from
bioenergy crop by ∗SW ( 0π ) and those of the alternative crop by∗
SW and 0π . Then
socially and privately optimal extensive margin of bioenergy cultivation is defined by
∗∗∗ = SWSWk : ; and 000 : ππ =k . (8)
It is easy to demonstrate that the extensive margin of bioenergy crop production depends
positively on the price of the bioenergy crop and climate benefits. Interestingly, the
extensive margin depends positively also on the input price and nutrient runoff damage,
because they decrease the returns of the alternative crop more than those of bioenergy
crop. Finally, provided that the alternative crop can be harvested already in the first year
1=t , a higher interest rate impacts negatively on the extensive margin.
2.3 First-best design of policy instruments
As equations (5) – (8) reveal, the socially and privately optimal solutions differ. The
difference between the optima is given by )()())(( lfbgdSW lll ′⋅′+⋅′−=− επ . Thus, the
privately optimal fertilizer application is either too low or too high depending on the
10
marginal social valuation of climate benefits and nutrient runoff damage. Thus, there is
scope for intervention to correct for the difference. We examine here two alternative
corrective mechanisms. First, the fertilizer intensity can be corrected in each location by a
tax or subsidy, depending on the degree of capitalization and the relation of runoff
damages to climate benefits. Second, if the capitalization rate is partial and the climate
benefits dominate runoff damage, an output subsidy for bioenergy can be provided.
When a tax/subsidy, h, is levied on the fertilizer input the farmer’s optimal choice
becomes 0)1()( =+−′= ∗ hclfplπ . If an output subsidy is provided for bioenergy, the
optimality condition reads as, 0)()1( =−′+= ∗ clfpl θπ . Setting these conditions equal
to the social optimality condition allows us to solve for the optimal tax/subsidy rates:
clfbgdlfpp
kh l )()())(()()()(
′⋅′−⋅′+′−=
∗∗ ε
(9a)
)())(()()()()(
)(lfp
gdlfblfppk l
′⋅′−′⋅′+′−
= ∗
∗∗ ε
θ . (9b)
Under zero capitalization, the price difference in (9a) is zero and we have an input tax or
subsidy depending on whether runoff damage or climate benefits dominate. Full
capitalization in turn means that the price difference equals the marginal climate benefits
and we obtain a tax for excessive fertilization. In the intermediate case, the degree of
capitalization affects not only the rate of the tax/subsidy but it may also switch a subsidy
to a tax and vice versa. The smaller is the capitalization, the more likely a subsidy is
needed to internalize the climate benefits and vice versa.
A similar reasoning holds true for the output subsidy in (9b), but recall, an output subsidy
is meaningful only under zero or partial capitalization (where climate benefits dominate).
Finally, it is evident from (9a) and (9b) that the subsidy/tax schemes are location-specific,
because the optimal fertilizer intensity differs across locations. Thus, differentiated policy
instruments are called for in the von Thunen model (the results resemble differentiated
policies under heterogeneous land quality, see Lichtenberg 2002, and Lankoski and

11
Ollikainen 2003). Furthermore, equations (9a) and (9b) also ensure that the extensive
margin becomes optimal (for a similar proof under heterogeneous conditions, see the
above references).
It is well known that differentiated policies with precise targeting may entail high
transaction costs (see e.g. Vatn 2002 for general discussion). Thus, we complete this
section by outlining an alternative second-best policy option for the case where climate
benefits dominate nutrient runoff damage and promoting bioenergy production becomes
socially optimal.
Suppose that the government pays a lump-sum area payment, A, for bioenergy production
in each location. Then private profits are given by
( )[ ] ACAcllpfrn
t
t +−∑ +−+==
−−
2
)1( )()1(π (10)
Obviously, the area payment A does not affect optimal fertilizer intensity. However, it
makes bioenergy production more profitable relative to the alternative crop, therefore
affecting the extensive margin. If the aim is to expand bioenergy crop production towards
the socially optimal level, the government should use an area payment that makes the
private restricted profit function equal to that under the alternative exogenous crop at the
socially optimal location ∗k . Hence, choosing )()( 00 ∗∗ −= kkA ππ will yield the
socially optimal extensive margin. However, as a result the total amount of bioenergy
produced still differs from the socially optimal level of production, because the fertilizer
intensity has not been corrected to the socially optimal level.
3. The empirical application of the von Thunen model
We illustrate our results empirically using data from the Ostrobothnia region, which is
located in Western Finland. The Ostrobothnia region has two main power plants in
Seinäjoki and Pietarsaari, which have a potential capacity to produce 242 GWh and 310

12
GWh of electricity from reed canary grass, respectively. If the average energy yield of
reed canary grass is 19.17 MWh per ha (with 6 tonnes/ha yield level), then the above data
would mean that 12 624 hectares and 16 171 hectares of arable land are required to be
allocated to reed canary grass cultivation, respectively.
Arable land in the Ostrobothnia region is dominated by three soil types: fine sand (32.4
%), coarse sand (17.9 %), and organic (including peat) soils (21.9 %). While all soil types
suit reed canary grass cultivation, the yields are highest in organic soils. Oats is the most
typical cereal crop in Ostrobothnia, representing 39.6 % (37%) of total cereal cultivation
area in 2004 (2005) (Yearbook of Farm Statistics 2005). Among cereals cultivated in
Finland oats is best suited to peat and organic soils. Therefore, we take oats as our
alternative crop.
3.1. Parametric version of the model
Both reed canary grass and oats are transported by road transportation (truck and trailer
unit).5 To keep the analysis clear, we assume that the power plant and the oats processing
industry are located in the same location. Following Flyktman and Paappanen (2005) we
employ the following cubic transportation cost function, ω , for reed canary grass
(transported as round bales): ηχβαω ++−= kkk 231 . For oats, the Finnish data
suggests a linear transportation cost: kγϕω +=2 . Thus, the net prices of both crops are
given by 1ω−= pp , and 2ω−= qq , respectively, where hat refers to the prices at the
gate of the power plant (p) and the processing firm (q).
We use the following Mitscherlich nitrogen response function for both crops:
)1( ii liii ey νσµ −−= , where y is yield per hectare, l is nitrogen use per hectare, and ,
and are parameters. These parameters are estimated for oats by Bäckman et al. (1997).
On the basis of Finnish experiments and nitrogen use recommendations for different soil
5 In what follows, the superscript 1 refers to reed canary grass and superscript 2 to oats (i = 1,2) and we usesubscripts to refer to time.

13
textural classes (clay, sandy, and organic soils) we calibrate Mitscherlich nitrogen
response function for reed canary grass to reflect average yields of reed canary grass
obtained with the recommended nitrogen use per ha.
Reed canary grass is a perennial crop, which is planted for a 14 year production rotation,
the annual harvests starting from the third year. Fertilizer application is technologically
fixed for the first two years. The private profits from reed canary grass cultivation over
any location are given by
( )[ ] 121
3
)1(1 )1()1()1( −
=
−−− +−−+−−−−+= ∑ rCCAKIcleprn
t
lt νσµπ . (11)
In equation (11), AKEC ++=1 and AKIlcC +++= 22 comprise the establishment
and some other cost items during the first two years, 1 and 2. E is the establishment costs
(fuel and labour costs of primary tillage, secondary tillage, and herbicide application, as
well as fertilizer, seed and herbicide costs), I denotes the variable costs of cultivation, and
K refers to fixed machinery costs. Finally, we denote the annual crop area payment by A.
The profits from the alternative crop, oats are given by
( )[ ]∑=
−−− +−−−−+=n
t
lt AKIcleqr1
)1(2 )1()1( νσµπ . (12)
The climate benefits from reed canary grass are modelled as offset benefits from
emissions of peat in electricity generation. The net calorific heat value is 2.45-3.94 MWh
per tonne of dry matter (with the moisture content of 15-20%) for reed canary grass and
2.68 MWh per tonne for peat. Using the average heat value for reed canary grass, 3.195
MWh/ton, the amount of peat needed to produce same amount of energy is approximately
1.19 tonnes. The emission coefficient for peat is 381.6 kg CO2 / MWh. Thus, one tonne
of reed canary grass can reduce CO2 emissions from peat by 1219 kg CO2 in power
production. We use the price of emission allowances as a proxy for the marginal climate

14
benefits. In the first trading year (2005), the average allowance price was slightly over €
20/tonne and we use this estimate. Oats does not entail any climate benefits, but for reed
canary grass we have,
)](219.120[)1(14
3
)1( lfrBt
t ∗∗+= ∑=
−− . (13)
We describe nitrogen runoff resulting from nitrogen application by the following per
hectare runoff function ]01.01[7.0 ilii ez −−= φ . Parameter φi calibrates this expression so that it
equals the level of nitrogen runoff generated by a nitrogen application rate of 100 kilos
per hectare for oats and 60 kilos per hectare for reed canary grass. We set the parameter
11=iφ kg N/ha for oats and 6=iφ kg N/ha for reed canary grass on the basis of Finnish
experimental studies (Turtola and Jaakkola 1997, Partala and Turtola 1998). For the
social value of nitrogen runoff damage d we use an estimate € 1.6 per reduced kg of
nitrogen provided by Vehkasalo (1999).6 Hence, the present value of runoff damage
differs between the crops and is defined by
( ) ( )]01.01[7.014
3
)1(]01.01[7.02
1
)1(1 *6*6.1)1(*6*6.1)1( l
t
tl
t
t ererD −−
=
−−−−
=
−− ∑ ++∑ += (14)
)*116.1()1( ]01.01[7.014
1
)1(2 l
t
t erD −−
=
−− ∗∑ += . (15)
Finally, we assume that the social returns of crops include the social benefit of retaining
land in farming. We denote the annual benefit by ψ , so that the discounted benefits over
the rotation period, Ω , are
∑ +=Ω=
−−n
t
tr1
)1()1( ψ (16)
6 The nitrogen runoff function is based on Simmelsgaard (1991). Details of its calibration to Finnishconditions can be found in Lankoski and Ollikainen (2003).
15
By assumption, this benefit corresponds to Less Favoured Area (LFA) support in the EU,
and is paid annually.
Combining equations (11) – (16), and neglecting the area payment A, allows us to express
the social welfare function for reed canary grass and oats production as,
Ω++−= BDSW 111 π (17)
Ω+−= 222 DSW π (18)
These equations will be maximized with respect to fertilizer use to provide the results in
section 4.
3.2 Production costs, prices and support payments for reed canary grass and oats
All prices, costs and support payments are calculated as from year 2006 (see Tables 1 and
A1). We use data from production cost calculations (ProAgria 2006) for both crops in
support region C2, where Ostrobothnia belongs. Table 1 shows the cost structure for reed
canary grass and oats cultivation. Oats is an annual crop and its cost items are annual
whereas for reed canary grass cost items are presented separately for establishment (once
per rotation), management (12 times per rotation) and rotation ending (once per rotation).
To make comparison more transparent the total costs of both crops are annualised present
values.
We assume in Table 1 that the cereal farmer owns the basic machinery that is required to
cultivate cereals and this same machinery is suitable for establishing reed canary grass as
well. Thus, farmer bears the fixed costs of machinery (such as depreciation, interest,
insurance) regardless of which crop is cultivated. For the estimation of capital and labour
costs we use a standard activity set for field operations: primary tillage (mouldboard
ploughing), seedbed tillage (harrowing), planting, and herbicide application. Field
operations are conducted annually for oats and once per rotation period for reed canary
grass. The capital cost is based on the machinery required for the above field operations

16
and machinery expense per hectare (which is measured by depreciation costs). The labour
cost is based on estimate of hours/ha for different operations and the farmer’s wage rate
per hour. We assume that for both crops the farmer uses contractor services for
harvesting (which in the case of oats covers both harvest and grain drying).
Table 1. Production costs of reed canary grass and oats, €/ha (own calculations on the
basis of ProAgria 2006).
Oats, €/ha Reed canary grass, €/haSeed 42 1. Establishment (once per
rotation)321
Herbicide 34 • Seed 70Fuel and lubricant 31 • Fertilizer (1. and 2.
year)145
Harvest 87 • Herbicide 21Grain drying 42 • Labour 85Labour cost 130 2. Management (12 times
per rotation)118
Fixed costs ofmachinery
144 • Material costs(plastics and nets)
33
• Harvest 80• Labour, fuel and
lubricant cost5
3. Costs of rotation ending(once per rotation)
25
• Herbicide 19• Labour 6
4. Fixed costs ofmachinery
144
Annualisedtotal costs
411 Annualisedtotal costs
218
As Table 1 reveals, the annualised total cost difference between the two crops is large.
The cost difference is € 238 per ha in favour of reed canary grass. The difference in
labour costs is especially remarkable. The rest of the parameter values, including prices
and area payments, are reported in Appendix 1, Table A.1.

17
4. Reed canary grass cultivation: optima and policies
We start by reporting the socially optimal production of reed canary grass and oats,
which provide a benchmark for our policy analysis. The results are reported in terms of
nitrogen application rate, production, environmental effects and social welfare (SW).
4.1 The social optimum
Society chooses for each location the crop that produces the highest social welfare (SW)
when environmental effects are accounted for as in equation (8). The socially optimal use
of nitrogen, production, environmental effects and the overall social welfare for each
location and for both crops are given in Table 2.7
Table 2. Social optimum: fertiliser use, crop production and social welfare under oats and reed canary grass cultivation.
Reed canary grass OatsLocati
on,
k
Nitrogenuse,
kg/ha
Production,
kg/ha
N-runoff,kg/ha
CO2 –reducti
ontonnes/
ha
SW,€/ha
Nitrogen use,kg/ha
Production,kg/ha
N-runoff,kg/ha
SW,€/ha
0 67.4 6216 6.5 7.58 108.9 75.8 3087 9.29 7.2
10 59.8 5985 6.0 7.30 80.8 74.9 3076 9.23 2.3
20 57.8 5918 5.9 7.22 74.2 74.7 3074 9.21 1.0
30 55.9 5849 5.7 7.13 68.0 74.4 3071 9.20 -0.2
40 53.9 5777 5.6 7.04 62.2 74.2 3068 9.18 -1.5
50 51.9 5703 5.5 6.95 56.7 74.0 3065 9.17 -2.7
60 49.9 5625 5.3 6.86 51.5 73.7 3062 9.15 -3.9
70 47.9 5544 5.2 6.76 46.5 73.5 3060 9.14 -5.2
80 45.9 5460 5.1 6.66 41.8 73.3 3057 9.12 -6.4
90 43.9 5373 5.0 6.55 37.3 73.0 3054 9.11 -7.6
100 42.0 5282 4.9 6.44 33.0 72.8 3051 9.09 -8.9
7 We report all results in 10 km grids in order to make reporting of results less tedious. However, results arecalculated in 1 km grid.
18
Table 2 shows that the socially optimal nitrogen application for both crops varies and
decreases with respect to the distance to the power plant (reed canary grass) or processing
plant (oats). Oats has higher nitrogen intensity than reed canary grass in every location.
Due to the increasing transportation costs, the nitrogen intensity decreases more steeply
for reed canary grass than for oats. The CO2 tonnes/ha replaced by reed canary grass
decreases with decreasing yields. Still, at a distance of 100 km, reed canary grass can
offset almost 6.5 tonnes of the CO2 from the burning of peat. Due to lower nitrogen
intensity and smaller propensity to runoff, reed canary grass has a lower per ha nitrogen
runoff than oats in all locations, the difference being on average about 40%.
Table 2 reports the environmental effects in physical terms. How do they relate in terms
of social valuation of climate benefits and runoff damages? The climate benefits are
obtained by multiplying the CO2 offsets in each location by the allowance price 20
€/tonne. Multiplying, the nitrogen runoff kg/ha by the damage estimate € 1.6 per kg of N
produces the runoff damages in each location. For example, in location 10 we find that
climate benefits are € 146/ha, whereas runoff damage is € 9.6/ha. For all locations the
climate benefits clearly dominate nitrogen runoff damage. Because of the climate benefits
reed canary grass produces higher social returns than oats in every location. Oats
produces positive social returns only up to location 20 and after that the returns become
negative.
4.2 Comparison of the social optimum and the current policy regime
We next compare the social optimum with the current policy regime to see what kind of
incentives current policy provides for bioenergy crop production. Recall that, the
European Union pays a lump-sum energy crop payment (€ 45/ha). This area payment
together with the Common Agricultural Policy and national policy instruments determine
the competitiveness of reed canary grass production relative to oats. We condense our
findings in Figures 1 and 2. Details are presented in Appendix 2, Table A.3, which shows
e.g. the privately optimal fertilization rate under the current policy regime.

19
In Figure 1, RCG denotes reed canary grass, SO denotes the socially optimal solution and
CR refers to current policy regime. The graphs in Figure 1 indicate the optimal nitrogen
intensity as a function of distance for the social optimum and current policy.
Figure 1. Socially (SO) and privately optimal (CR) nitrogen use as a function of distance
for reed canary grass (RCG) and oats.
Nitrogen use as a function of distance
0.0
10.0
20.0
30.0
40.0
50.0
60.0
70.0
80.0
90.0
0 20 40 60 80 100 120
Distance k (km)
N, k
g/ha
SO-RCGSO-OATSCR-RCGCR-OATS
From Figure 1, fertilizer intensity under current policy in oats cultivation is higher than
the socially optimal application. For reed canary grass, current policy implies suboptimal
and deeply decreasing nitrogen intensity with respect to distance. Therefore, from
location 80 onwards the nitrogen intensity becomes so small that yield decreases below
the critical yield level of 3000 kg/ha required for the energy crop payment. Thus, no
energy crop payment is paid for location 80 km and thereafter (see Figure 2). The optimal
nitrogen application rate becomes zero in location 90 km.
Figure 2 shows the annualized net present value profits (€/ha) for both crops in the
current policy regime. Reed canary grass 1 describes the current level of support
payments, whereas reed canary grass 2 assumes the same level of support payments for
20
both crops (the energy crop payment is € 45/ha and the difference in regional payments is
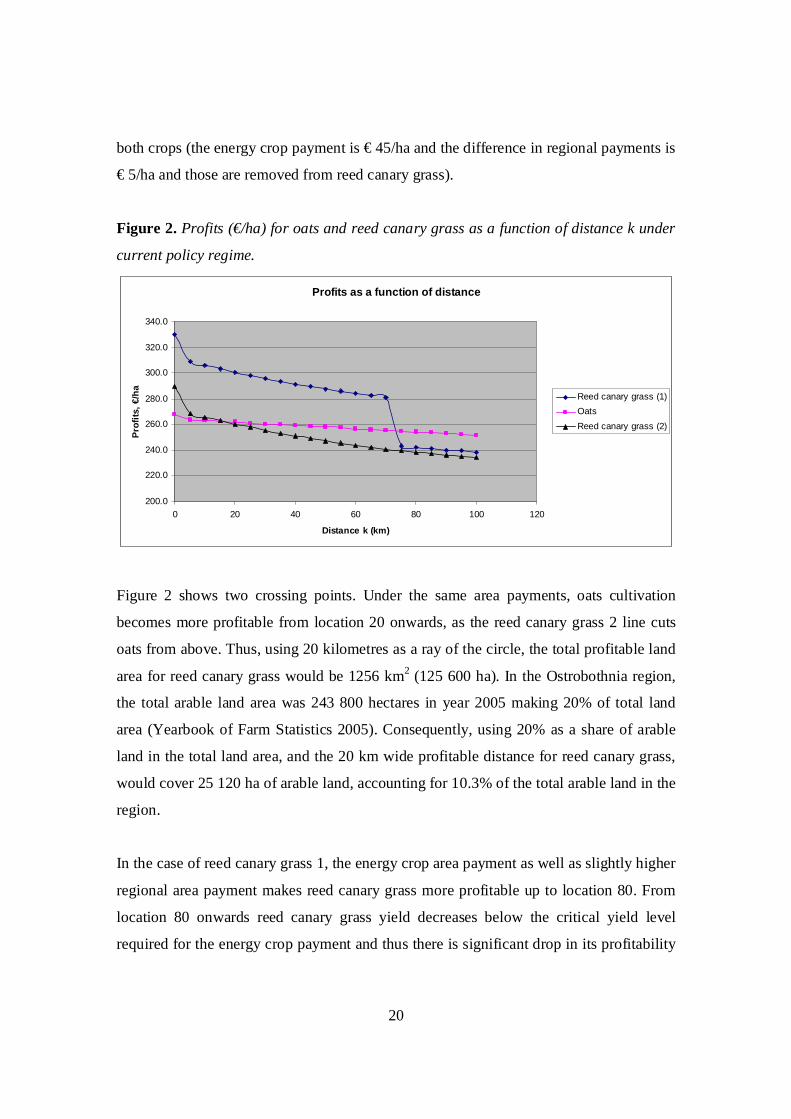
€ 5/ha and those are removed from reed canary grass).
Figure 2. Profits (€/ha) for oats and reed canary grass as a function of distance k under
current policy regime.
Profits as a function of distance
200.0
220.0
240.0
260.0
280.0
300.0
320.0
340.0
0 20 40 60 80 100 120
Distance k (km)
Prof
its, €
/ha
Reed canary grass (1)OatsReed canary grass (2)
Figure 2 shows two crossing points. Under the same area payments, oats cultivation
becomes more profitable from location 20 onwards, as the reed canary grass 2 line cuts
oats from above. Thus, using 20 kilometres as a ray of the circle, the total profitable land
area for reed canary grass would be 1256 km2 (125 600 ha). In the Ostrobothnia region,
the total arable land area was 243 800 hectares in year 2005 making 20% of total land
area (Yearbook of Farm Statistics 2005). Consequently, using 20% as a share of arable
land in the total land area, and the 20 km wide profitable distance for reed canary grass,
would cover 25 120 ha of arable land, accounting for 10.3% of the total arable land in the
region.
In the case of reed canary grass 1, the energy crop area payment as well as slightly higher
regional area payment makes reed canary grass more profitable up to location 80. From
location 80 onwards reed canary grass yield decreases below the critical yield level
required for the energy crop payment and thus there is significant drop in its profitability

21
as shown in Figure 2. Thus, we find that under the current policy regime the profitability
of reed canary grass is mainly driven by support payments (totalling € 591/ha), which are
€ 50/ha higher than the corresponding support payments for oats (totalling € 541/ha).
We, finally, compare the environmental effects associated with the social optimum and
the current policy regime in Table 3.
Table 3. Environmental effects: social optimum (SO) and current policy regime (CR).
Reed canary grassN-runoff, kg/ha
Reed canary grassCO2 reduction, tons/ha
OatsN-runoff, kg/ha
Loca-tion, k
SO CR SO CR SO CR
0 6.5 5.2 7.58 6.76 9.29 9.57
10 6.0 4.4 7.30 5.97 9.23 9.51
20 5.9 4.2 7.22 5.70 9.21 9.50
30 5.7 4.1 7.13 5.40 9.20 9.48
40 5.6 3.9 7.04 5.07 9.18 9.46
50 5.5 3.7 6.95 4.69 9.17 9.45
60 5.3 3.5 6.86 4.27 9.15 9.43
70 5.2 3.3 6.76 3.78 9.14 9.42
80 5.1 3.1 6.66 3.21 9.12 9.40
90 5.0 3.0 6.55 2.73 9.11 9.38
100 4.9 3.0 6.44 2.73 9.09 9.37
For reed canary grass the social optimum implies higher nutrient runoff and CO2
replacement than under the current policy, because current policy fails to account for the
climate benefits of reed canary grass cultivation. For oats we have the opposite situation:
the current policy leads to higher nitrogen intensity and nitrogen runoff than the social
optimum.8
8 We did not include external costs from fuel consumption in cultivation and transportation of the crops.Oats cultivation consumes 150 liters of fuel per ha annually and cultivation of reed canary grass consumes56 liters per ha. This strengthens the case for reed canary grass. However, oats has clear advantage asregards to fuel consumption in transportation. Using the average distance of 50 kilometres and sociallyoptimal levels of production for both crops we estimate that for the required transportation capacity the fuelconsumption is 7.7 liters per ha for reed canary grass and 1.9 liters per ha for oats. Hence, the overalldifference is 88.2 liters in favor of reed canary grass.

22
4.3 Optimal policy instruments
The theoretical model established the need for government intervention to correct for
negative and positive externalities related to runoff damage and climate benefits. The
sign and the level of the instruments depend on the degree of capitalization of climate
benefits in the price of reed canary grass. Therefore, we derive the first-best policy
instruments assuming zero and partial capitalization. For the latter we use the current
Finnish practice where the ETS allowance premium paid over the ordinary gate prices is
on average € 7/tonne at the gate9. The location-specific instruments, the nitrogen and
output subsidies, are reported in Table 4 for reed canary grass under zero (the first figure)
and partial capitalization (the second figure).
Table 4 confirms the theoretical finding that the optimal instrument rates differ over the
various locations under both zero and partial capitalization. In line with the theoretical
analysis, the optimal rates of instruments are much lower under partial than zero
capitalization. As expected, the optimal nitrogen tax on oats varies little and decreases
only slightly over the various locations. The optimal output subsidy rate increases in
distance and shows a rather dramatic (considerable) increase over the various locations in
the case of zero (partial) capitalization. While the rate of subsidy for the nitrogen input
almost doubles over the distance of 100 kilometres, the output subsidy increases by a
factor of nine (two), although the increase in the absolute quantity is not as big as the unit
is kg.
9 Assume that the listed gate price reflects the true marginal costs of production. Then the estimate of thegate price with full capitalization of climate benefits can be developed as follows. Solve first the socialoptimum in the presence of climate benefits but in the absence of nutrient runoff. Define then the gate pricethat makes private profits (in the absence of instruments) equal to the social welfare. This produces a gateprice € 45.4/tonne.
23
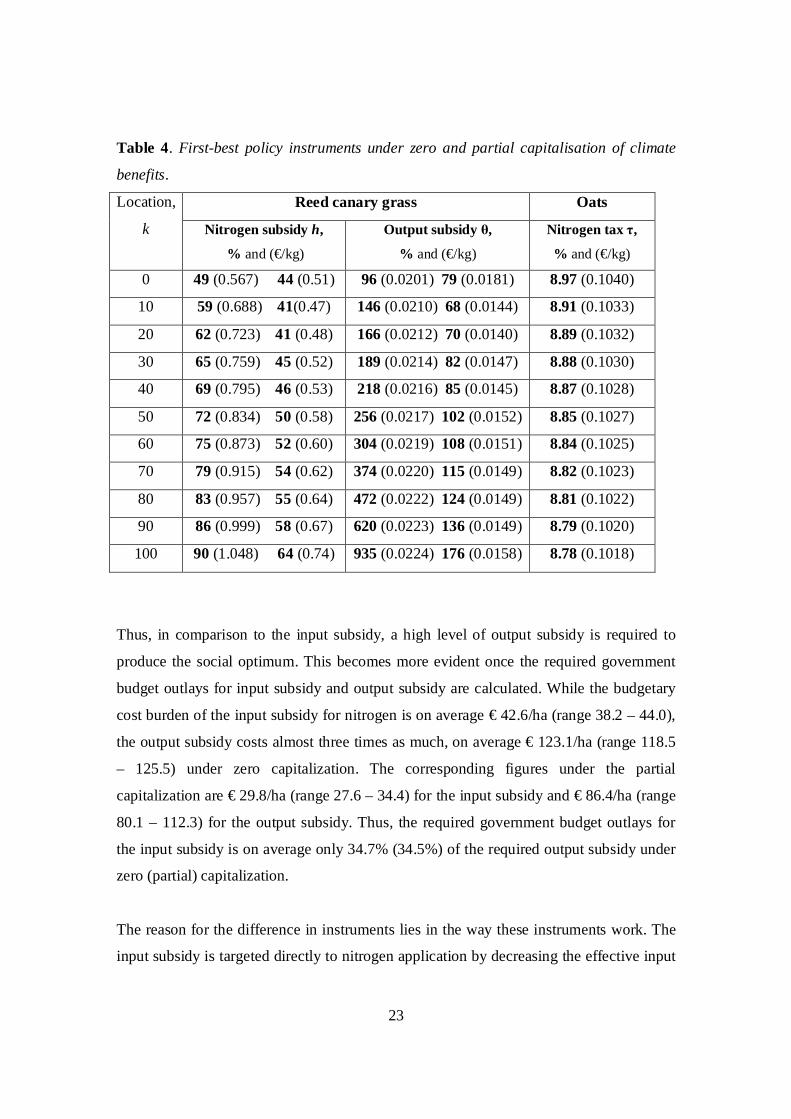
Table 4. First-best policy instruments under zero and partial capitalisation of climate
benefits.
Reed canary grass OatsLocation,
k Nitrogen subsidy h,
% and (€/kg)
Output subsidy ,
% and (€/kg)
Nitrogen tax ,
% and (€/kg)
0 49 (0.567) 44 (0.51) 96 (0.0201) 79 (0.0181) 8.97 (0.1040)
10 59 (0.688) 41(0.47) 146 (0.0210) 68 (0.0144) 8.91 (0.1033)
20 62 (0.723) 41 (0.48) 166 (0.0212) 70 (0.0140) 8.89 (0.1032)
30 65 (0.759) 45 (0.52) 189 (0.0214) 82 (0.0147) 8.88 (0.1030)
40 69 (0.795) 46 (0.53) 218 (0.0216) 85 (0.0145) 8.87 (0.1028)
50 72 (0.834) 50 (0.58) 256 (0.0217) 102 (0.0152) 8.85 (0.1027)
60 75 (0.873) 52 (0.60) 304 (0.0219) 108 (0.0151) 8.84 (0.1025)
70 79 (0.915) 54 (0.62) 374 (0.0220) 115 (0.0149) 8.82 (0.1023)
80 83 (0.957) 55 (0.64) 472 (0.0222) 124 (0.0149) 8.81 (0.1022)
90 86 (0.999) 58 (0.67) 620 (0.0223) 136 (0.0149) 8.79 (0.1020)
100 90 (1.048) 64 (0.74) 935 (0.0224) 176 (0.0158) 8.78 (0.1018)
Thus, in comparison to the input subsidy, a high level of output subsidy is required to
produce the social optimum. This becomes more evident once the required government
budget outlays for input subsidy and output subsidy are calculated. While the budgetary
cost burden of the input subsidy for nitrogen is on average € 42.6/ha (range 38.2 – 44.0),
the output subsidy costs almost three times as much, on average € 123.1/ha (range 118.5
– 125.5) under zero capitalization. The corresponding figures under the partial
capitalization are € 29.8/ha (range 27.6 – 34.4) for the input subsidy and € 86.4/ha (range
80.1 – 112.3) for the output subsidy. Thus, the required government budget outlays for
the input subsidy is on average only 34.7% (34.5%) of the required output subsidy under
zero (partial) capitalization.
The reason for the difference in instruments lies in the way these instruments work. The
input subsidy is targeted directly to nitrogen application by decreasing the effective input

24
price. The output subsidy works through increasing the value of the marginal product of
nitrogen, which is decreasing in fertilizer use. Due to the decreasing marginal
productivity of fertilizer, a change in the input price changes nitrogen application more
than the corresponding output price change. Thus, under zero and partial capitalization
we obtain an interesting and unconventional result: in contrast with the commonly
expressed recommendation not to promote the application of fertilizers, we find that a
fertilizer subsidy is a superior instrument in promoting bioenergy crop production.
4.5 Sensitivity analysis
We performed a sensitivity analysis to examine how the key parameters affect social
returns of reed canary grass cultivation. A part of this analysis was to examine how
robust the findings are with respect to the chosen alternative crop. Therefore, we chose
green set-aside to serve as the alternative crop for reed canary grass.
The social returns for green set aside were calculated using the following items that are
the same over all locations. The social value of retaining land in agriculture is the same as
before (€ 233/ha), the annualised cost of green set aside establishment and management
are € 20.5/ha, the fixed costs of machinery are € 144/ha and nitrogen runoff damage from
green set aside is € 8/ha. This totals € 48.8/ha as the present value net social return for
green set aside. In comparison to baseline results (Table 2) these social returns are higher
than those of oats in every location; they also exceed the returns of reed canary grass
from location 70 onwards.
To see how alternative values for climate benefits (B) affect the social returns of reed
canary grass, we used € 10/ton and € 30/ton as alternative permit prices (these values are
very close to the lowest and highest values of permit prices during year 2005). The
effects are shown in Figure 3 (for details see Table A2.).

25
Figure 3. Social welfare (SW, €/ha) of reed canary grass under alternative values ofclimate benefits (B) in comparison to green set aside with fixed social returns.
Reed canary grass SW as a function of distance
-50.0
0.0
50.0
100.0
150.0
200.0
0 20 40 60 80 100 120
Distance k, km
SW
, €/h
a
B 10 €/ton B 30 €/ton Baseline B 20 €/ton Green set aside
In Figure 3, the baseline case (€ 20/ton) has the switching point in location 70 km for
reed canary grass when green set aside is the alternative crop. For a low estimate of
climate benefits (€ 10/ton), the extensive margin is reduced to 10 km. If climate benefits
are high (€ 30/ton), the extensive margin shifts outwards, much beyond 100 kilometres.
We condense the rest of the sensitivity analysis in Figure 4, which represents the effects
of transportation costs and nutrient runoff damage. Given that a cheaper transportation
technology is under intensive investigation, we decrease the transportation costs by 20%.
For the marginal nutrient runoff damage, we apply a 50% higher estimate, which is
sometimes reported in Finnish studies. A higher runoff damage estimate is linked to our
baseline case (€ 20/ton) and to a lower climate benefit estimate (€ 10/ton). Note that a
higher runoff damage estimate also affects the social welfare performance of green set
aside, so that fixed social returns are reduced to € 45.6 per ha.

26
Figure 4. Social welfare (SW, €/ha) of reed canary grass under reduced transportationcosts and higher nutrient runoff damage under two alternative values of climate benefitsin comparison to green set aside with fixed social returns.
Reed canary grass SW as a function of distance
-20.0
0.0
20.0
40.0
60.0
80.0
100.0
120.0
0 20 40 60 80 100 120
Distance k, km
SW, €
/ha
TC -20% B = 10 and D = 2.4 B = 20 and D = 2.4 Green set-aside
Figure 4 shows that lower transportation costs increase returns to reed canary grass, so
that the switching point is moved from 70 km to slightly over 100 km. A combination of
high runoff damage estimate and low climate benefit estimate make reed canary grass an
inferior option relative to green set aside as from location 10 km. In comparison to the
baseline, a higher runoff damage estimate does not greatly change the relative social
profitability of reed canary grass and green set aside since the higher runoff damage
estimate affects both land use forms.
5. Conclusions and policy implications
The European Union’s programmes for promoting the use of renewable energy resources
and the introduction of the European Union Emission Trading Scheme (EU-ETS) have
increased interest in bioenergy crop cultivation. Bioenergy crops can offset fossil fuels in
electricity production and thereby bring climate benefits to society. This paper examined
the social returns of bioenergy crop cultivation in a von Thunen framework, when the

27
climate benefits are taken explicitly into account. We assumed that agricultural land is
homogenous but transportation costs increase with respect to distance. Although
offsetting emissions from fossil fuels in electricity production, the cultivation of
bioenergy crops causes nutrient runoff to waterways.
We demonstrated that increasing transportation costs determine differing fertilizer
application intensities in each location and the extensive margin of production in both the
social and private optima. Provided climate benefits are only partially priced by the
market, the privately optimal fertilizer application rate is lower than the socially optimal
rate across all locations. Under full capitalization the privately optimal fertilizer
application is higher than the socially optimal rate because of runoff damages. Thus,
differentiated, location-specific policy instruments are needed – input or output subsidies
in the former case, and an input tax in the latter case.
The model was applied to the cultivation of reed canary grass in Finnish agriculture,
where reed canary grass offsets CO2 emissions from peat in electricity production. The
climate benefits were valued by the permit price in the EU-ETS. Using oats as an
alternative crop, we demonstrated that cultivation of reed canary grass is socially optimal
at a distance greater than 100 kilometres from the power plant and can replace more than
6.5 tonnes of CO2 emissions from peat if climate benefits are valued at € 20/ton.
However, it reduces to 70 kilometres if green set-aside is the alternative land-use form.
Our analysis shows that promoting energy crop cultivation is socially optimal when
climate benefits dominate runoff damages and the market only partially prices climate
benefits, which empirically holds for reed canary grass in Finland. An input subsidy on
fertilizer application turned out to be a preferable policy instrument compared to an
output subsidy, because it directly targets the privately suboptimal fertilizer application
rate. Moreover, we found that current agricultural policies do not provide the best
incentives to encourage bioenergy crop cultivation. Thus, a reform that promotes energy
crop cultivation is needed. A good second-best choice is to increase the area payment
(which is a part of CAP-policy) designed specifically to energy crops. By using an area

28
payment any target area for bioenergy crop production can be achieved, although
fertilizer application rates will still differ from the socially optimal rates.
Our analysis relied on the assumption of competitive markets for bioenergy crop. Due to
steeply increasing transportation costs the local power plants may, however, act like local
monopsonists. On the basis of economic theory we know that they would equalize the
marginal buyer cost with the value of the marginal product from the energy crop. This
would lead to a market distortion with too low demand for bioenergy crop. It would be an
interesting future research topic to examine to whether and to what extent this kind of
distortion takes place. Another topic for future work is to focus closely on the social life
cycle costs and benefits of using bioenergy crops to provide electricity and heat.

29
References
Bäckman, S.T., Vermeulen, S. and Taavitsainen, V.-M. 1997. Long-term fertilizer fieldtrials: comparison of three mathematical response models. Agricultural and Food Sciencein Finland 6: 151-160.
Börjesson, P. 1999a. Environmental effects of energy crop cultivation in Sweden – I:Identification and quantification. Biomass and Bioenergy 16, 137-154.
Börjesson, P. 1999b. Environmental effects of energy crop cultivation in Sweden – II:Economic valuation. Biomass and Bioenergy 16, 155-170.
Downing M and R. Graham 1996. The potential supply and cost of biomass from energycrops in the Tennessee Valley Authority region. Biomass and Bioenergy 11, 283-303.
Faaij A., B. Meuleman, W. Turkenburg, A. van Wijk, A. Bauen, F. Rosillo-Calle and D.Hall 1998. Externalities of biomass based electricity production compared with powergeneration from coal in the Netherlands. Biomass and Bioenergy 14, 125-147.
Flyktman, M. and Paappanen, T. 2005. Ruokohelven käyttökapasiteetti selvitys.Tutkimusselostus PRO2105/05. VTT Prosessit.
Landstrom, S., Lomakka, L., and Anderson, S. 1996. Harvest in spring improves yieldand quality of reed canary grass as a bioenergy crop. Biomass & Bioenergy 11(4): 333-341.
Larsson, S. 2005. Supply curves of reed canary grass (Phalaris arundinacea L.) inVästerbotten Counby, northern Sweden, under different EU subsidy schemes. Biomassand Bioenergy 30, 28-37.
Lankoski J. and M. Ollikainen 2003. Agri-Environmental Externalities: A framework fordesigning targeted policies. European Review of Agricultural Economics 30, 51-75.
Lichtenberg, E. 2002. Agriculture and the environment. In B. Gardner and G. Rausser(eds.), Handbook of Agricultural Economics. Vol 2A: Agriculture and its linkages.Amsterdam: North Holland. pp. 1249 – 1313.
OECD 2001. Environmental indicators for agriculture. Volume 3: Methods and results.409 pages. OECD, Paris.
Pahkala K., M. Isolahti, A. Partala, A. Suokannas, A-M. Kirkkari, M. Peltonen, M.Sahramaa, T. Lindh, T. Paappanen, E. Kallio and M. Flyktman 2005. Ruokohelvenviljely ja korjuu energian tuotantoa varten. 2. korjattu painos. Maa- ja elintarviketalous 1.MTT: Jokioinen. 31 s. ISSN 1458-5073. ISBN 951-729-942-7. In Finnish. Available inweb page: http://www.mtt.fi/met/pdf/met1b.pdf
30
Partala, A. and Turtola, E. 1998. Nutrient leaching from a peat soil under reed canarygrass and timothy ley. Nordisk jordbruksforskning 80(1998):2, p. 52.
ProAgria 2006. Crop budgets and production cost calculations.
Simmelsgaard, S. 1991. Estimation of nitrogen leakage functions - Nitrogen leakage as afunction of nitrogen applications for different crops on sand and clay soils. In: Rude, S.(ed.). Nitrogen fertilizers in Danish Agriculture - present and future application andleaching, Institute of Agricultural Economics Report 62 (in Danish: Kvaelstofgödning ilandbruget - behov og udvasking nu og I fremtiden). English summary.Copenhagen.p135-150.
Turtola, E. and Jaakkola, A. 1987. Viljelykasvin vaikutus ravinteiden huuhtoutumiseensavimaasta Jokioisten huuhtoutumiskentällä v. 1983-1986. (in Finnish). Maataloudentutkimuskeskus. Tiedote 22/87. Jokioinen. 33 p.
Vatn, A. (2002). Multifunctional agriculture: some consequences for international traderegimes. European Review of Agricultural Economics 29(3): 309-327.
Vehkasalo, V. 1999. Ympäristötuen yhteiskunnallinen kannattavuus (Abstract: Socialprofitability of the Finnish agri-environmental programme) pp. 42-77. In: Maataloudenympäristöohjelma 1995-1999:n taloudellinen analyysi. Agricultural Economics ResearchInstitute, Publications 90. Finland.
Walsh, M. 1998. U.S. bioenergy crop economic analyses: status and needs. Biomass andBioenergy 14, 341-350.Walsh, M. 2000. Method to estimate bionergy crop feedstock supply curves. Biomass andEnergy 18, 283-289.
Walsh M., D. de la Torre, H. Shapouri, S. Slinksky 2003. Bioenergy Crop Production inthe United States. Environmental and Resource Economics 24, 313-333.
Yearbook of Farm Statistics 2005. Information Centre of the Ministry of Agriculture andForestry. 268 pages. Helsinki, Finland.
31
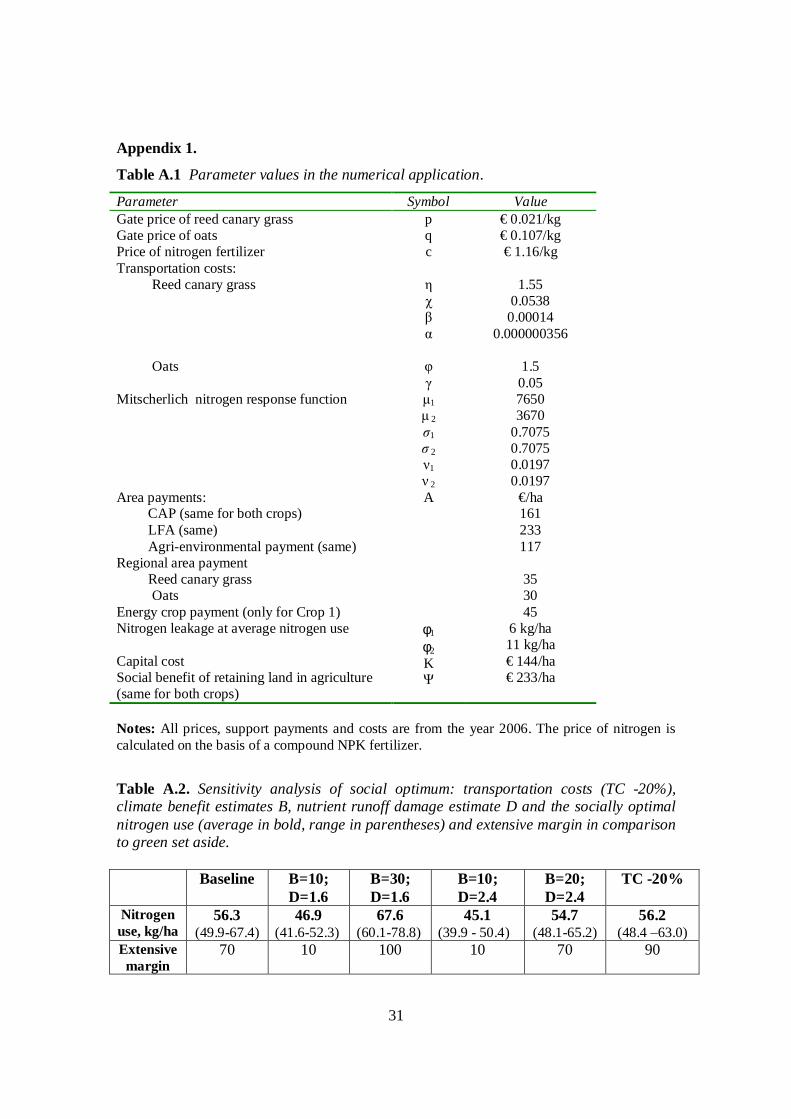
Appendix 1.
Table A.1 Parameter values in the numerical application.
Parameter Symbol ValueGate price of reed canary grass p € 0.021/kgGate price of oats q € 0.107/kgPrice of nitrogen fertilizer c € 1.16/kgTransportation costs: Reed canary grass
Oats
1.550.05380.00014
0.000000356
1.50.05
Mitscherlich nitrogen response function 1
2
1
2
1
2
76503670
0.70750.70750.01970.0197
Area payments: CAP (same for both crops) LFA (same) Agri-environmental payment (same)Regional area payment Reed canary grass OatsEnergy crop payment (only for Crop 1)
A €/ha161233117
353045
Nitrogen leakage at average nitrogen use
Capital costSocial benefit of retaining land in agriculture(same for both crops)
φ1
φ2K
6 kg/ha11 kg/ha€ 144/ha€ 233/ha
Notes: All prices, support payments and costs are from the year 2006. The price of nitrogen iscalculated on the basis of a compound NPK fertilizer.
Table A.2. Sensitivity analysis of social optimum: transportation costs (TC -20%),climate benefit estimates B, nutrient runoff damage estimate D and the socially optimalnitrogen use (average in bold, range in parentheses) and extensive margin in comparisonto green set aside.
Baseline B=10;D=1.6
B=30;D=1.6
B=10;D=2.4
B=20;D=2.4
TC -20%
Nitrogenuse, kg/ha
56.3(49.9-67.4)
46.9(41.6-52.3)
67.6(60.1-78.8)
45.1(39.9 - 50.4)
54.7(48.1-65.2)
56.2(48.4 –63.0)
Extensivemargin
70 10 100 10 70 90
32
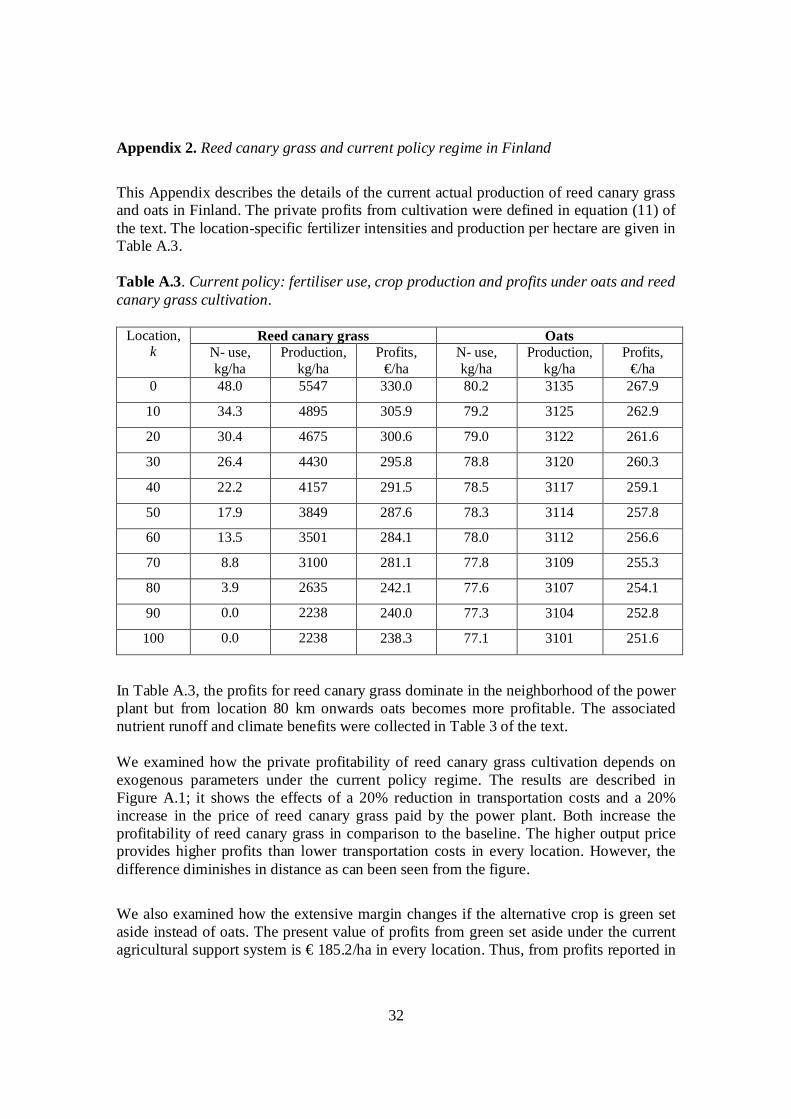
Appendix 2. Reed canary grass and current policy regime in Finland
This Appendix describes the details of the current actual production of reed canary grassand oats in Finland. The private profits from cultivation were defined in equation (11) ofthe text. The location-specific fertilizer intensities and production per hectare are given inTable A.3.
Table A.3. Current policy: fertiliser use, crop production and profits under oats and reedcanary grass cultivation.
Reed canary grass OatsLocation,k N- use,
kg/haProduction,
kg/haProfits,
€/haN- use,kg/ha
Production,kg/ha
Profits,€/ha
0 48.0 5547 330.0 80.2 3135 267.9
10 34.3 4895 305.9 79.2 3125 262.9
20 30.4 4675 300.6 79.0 3122 261.6
30 26.4 4430 295.8 78.8 3120 260.3
40 22.2 4157 291.5 78.5 3117 259.1
50 17.9 3849 287.6 78.3 3114 257.8
60 13.5 3501 284.1 78.0 3112 256.6
70 8.8 3100 281.1 77.8 3109 255.3
80 3.9 2635 242.1 77.6 3107 254.1
90 0.0 2238 240.0 77.3 3104 252.8
100 0.0 2238 238.3 77.1 3101 251.6
In Table A.3, the profits for reed canary grass dominate in the neighborhood of the powerplant but from location 80 km onwards oats becomes more profitable. The associatednutrient runoff and climate benefits were collected in Table 3 of the text.
We examined how the private profitability of reed canary grass cultivation depends onexogenous parameters under the current policy regime. The results are described inFigure A.1; it shows the effects of a 20% reduction in transportation costs and a 20%increase in the price of reed canary grass paid by the power plant. Both increase theprofitability of reed canary grass in comparison to the baseline. The higher output priceprovides higher profits than lower transportation costs in every location. However, thedifference diminishes in distance as can been seen from the figure.
We also examined how the extensive margin changes if the alternative crop is green setaside instead of oats. The present value of profits from green set aside under the currentagricultural support system is € 185.2/ha in every location. Thus, from profits reported in

33
Table A.3 we find that the private profitability of green set aside is always inferior toboth reed canary grass and oats under the current policy regime.
Figure A.1. Profits (€/ha) for reed canary grass under current policy (CR), underreduced of transportation costs (TC-20%) and increased output price (Price +20%).
Profits under alternative scenarios
220
240
260
280
300
320
340
Dis
tanc
e, k 0 5 10 15 20 25 30 35 40 45 50 55 60 65 70 75 80 85 90 95 100
Distance k, km
Prof
its, €
/ha
CRTC-20%Price +20%

Discussion Papers:
No.1. Jussi Lankoski, Markku Ollikainen & Pekka Uusitalo (2004): No-till technology: benefits to farmers and
the environment?" Environmental Economics.2. Stefan Bäckman & Alfons Oude Lansink (2004): Crop and soil specific mineral efficiency and
productivity in Finland. Production Economics and Farm Management.3. Antti Iho (2004): Cost-e ective reduction of phosphorus runo from agriculture: a numerical analysis.
Environmental Economics.4. Jussi Lankoski, Erik Lichtenberg & Markku Ollikainen (2004): Performance of alternative policies in
addressing environmental dimensions of multifunctionality. Environmental Economics.5. Kyösti Arovuori & Jukka Kola (2004): Experts’ opinions on policies and measures for multifunctional
agriculture. Agricultural Policy.6. Erikki Koskela, Markku Ollikainen & Timo Pukkala (2004): Biodiversity policies in commercial boreal
forests: optimal design of subsidy and tax combinations. Environmental Economics.7. Lone Grønbæk Kronbak & Marko Lindroos (2005): Sharing rules and stability in coalition games with
externalities: the case of the Baltic Sea cod fishery. Environmental Economics.8. Nina Hyytiä & Jukka Kola (2005): Citizens’ attitudes towards multifunctional agriculture. Agricultural
Policy.9. H. Dahlbo, M. Ollikainen, S. Peltola, T. Myllymaa & M. Melanen (2005). Combining ecological and
economic assessment of waste management options - case newspaper. Environmental Economics.10. Aleksandar Shivarov, Soile Kulmala & Marko Lindroos (2005). Fisheries Management Costs: The Case
of Baltic Salmon Fishery. Environmental Economics.11. Soile Kulmala, Hanna Peltomäki, Marko Lindroos, Sakari Kuikka & Pirkko Söderkultalahti (2005).
Individual Transferable Quotas in the Baltic Sea Herring Fishery: a Socio-bioeconomic Analysis.Environmental Economics.
12. Hanna-Mari Ahonen & Kari Hämekoski (2005). Transaction costs under the Finnish CDM/JI PilotProgramme. Environmental Economics.
13. Chen Quizhen & John Sumelius (2006). Comparative Study on Chinese and Finnish Experts’ Opinionof Multifunctional Agriculture. Agricultural Economics.
14. Hervé Guyomard, Jussi Lankoski & Markku Ollikainen (2006). Impacts of Agri-environmental Policieson Land Allocation and Land Prices. Environmental Economics.
15. Kyösti Arovuori & Jukka Kola (2006). Farmers’ choice on multifunctionality targeted policy measures.Agricultural Economics.
16. Seppo Vehkamäki & Stefan Bäckman (2006).Evaluation of economic activities and poverty in the regionclose to the National Park of Río Abiseo in Peru.
ISSN 1459-9996Helsinki 2006