bioenergy options for new zealand - niwa | enhancing the ... · the bioenergy options for new...
TRANSCRIPT

2000 2005 2030 2050
New Zealand’s EnergyScape
PATHWAYS ANALYSISEnergy demand | Pathways evaluation
Economics of purpose-grown energy forestsLife Cycle Analysis of biomass resource to consumer energy
Bioenergy Options for New Zealand

Thihis rs rs reepoe rt rt (Biioenoenergergr y Oy OOy OOptiptiptiptpt onsonsoonson - - - - - PatPatPatPatPathwahwahwahways ysysys AnaAnaAnalyslyslyslysis)is)is)s co co cocoverververrs ps ps pss ps artartartartrrts 3s 3s 3s 3s 33 an an an annd 4d 4d 4d 4d of of oofo th th ththe Be Be BBBe Bioeioeioeiooeoenernernernergy gygy y OptOptOptOptionionionons ss ss ssssttutududtudut y. y. y. yy.These se e parparrrts ts s arearearr :
- D- Defi efi fininning e enerrgy gy demdemdemmandd (tttypeypeyp , l, l, locaocaocacatiottiotiotioi n an an and ndndd scascascaascale)ele))le)l )...
- L- LLifeif cyclecll ananalyalyysissisi of of oofof se s s lececle tetedted pa paapaathwthwthwwaysaysysy to to tott ene en enablablabb e de de dddetetaeetaetaileileileileed cd cd cd ompompompompompariariariariaa sonsonsonsonnns os s oos f of of of optiptipptit onsonsonsn ..
TheThe pr prrp evievious phhp asesse ofofof th th thhis is projecject wt wwwas ass sa reprepreportortortoo eded ded d in in inni thethethethethee B Bi B Biioenoenoenoenergergrgergergy Oy Oy Oy Oy OOOptiptiptiptiptip onsonsonsonsns - - SitSitSitSi uatuaatuationionionionono An An A alyalyalyl sississis. T. T. T. Thathathatta re ree rereporporporporporort ct ct ccoveoveoveoveredredrede ::
- BBiomiomioomass resouso rcecees as as aandndnd nnd connnco ververversioisiosion on on oooptiptiptionsonsonsonnoons..
- PPoteoteteeentinttitial aaa patpathwaahways ys ys basbasbasbasba ed ed ed on on o avaavaavav ilaililai blebleblebleble re rere resoussousous cescescese an anaan anand sd sd ssuituituituitablablable e ce ce convonvonvonvonverserserserserserssionionionon te tet technchnchnc nolooloolooloogiegiegiegiess.s.
The fi nall rere reporpopo t, yetyet to to beb coc mplmplmpp eteeteeteed, d, d, d,d, wilwilwilwiwiwi l pl pl pl ropropropropro oseoseoseoseos a a a resresressearearearch ch ch strstrstrt aateateateteegy.gy.gy.y.gy.
ThThe e follllowo inng g oro gagaanininnisasasasatitititioonoons haah vevevee c ccoonono trtrribibibbututuututedededd t tt tto o o ththththisisis p pppprorororooojejejejeectctctc :::

PPPPPPaaattthhhhhhwwwwaaaayyyysssss AAAAAAAnnnnnaaalllyyyyysssssiiissss
AuAuAuAuA gugugustsstt 2 22 200000000008888
AuAuuAuAuA thththororoors:s:s:s: P P Petetetetererer H HHHalalala l l l anananand d dd MiMiMichchchchaeaeaeael lll JaJaJaJJaJackckckckckck
EdEdEddEdE itititoror: : MaMaMaarrgrgrgararra etetet R R RRiciccicchahahahaardrdrdrdr sososooonnnn
ScScScScioioion,n,, E E nenenergrgrgrgy yy y GrGrGrG ouououup,p,p,p 2 222 00000000088888
FRFRFRRSTSTSTST: :: C0C0C0C04X4X4X4X0660606010101011
PRPRPRPROJOJOJOJ: ::: 1212121200010111-1-1--ORORORO I-I-I-FRFRFRFRFRRF I0I0I000I
ISISI BNBNBNBN: : : 0-0-0-0--474747474 8-8-8-1111111020202021-1-1-999
DISCLAIMER
In producing this publication reasonable care has been taken to ensure that all statements represent the best information available. However, the contents are not intended to be a substitute for specifi c specialist advice on any matter and should not be relied on for that purpose.
Scion and its employees shall not be liable on any ground for any loss, damage, or liability incurred as a direct or indirect result of any reliance by any person upon information contained or opinions expressed in this work.

This Pathways Analysis report is one of three reports from the Bioenergy Options project. The purpose of thisreport is to summarise information on:
• The potential role of geographically distributedbiomass resources to meet regional energy demand now and in the future;
• The environmental sustainability of the biomass resource-to-consumer energy pathways identifi ed inthe Bioenergy Options – Situation Analysis report;s
• The economic viability of these pathways now and inthe future in light of rapidly rising energy prices.
A pathway is defi ned as a route from biomass resourcethrough some conversion process to a consumer energy product.
A summary table presenting the potential scale,environmental sustainability and economic viabilityof a number of key biomass resource-to-consumer energy pathways is shown on page 7.
The Bioenergy Options for New Zealand project was initiated to consider the potential contribution of bioenergy to New Zealand’s energy future. The Bioenergy Options workis a part of the larger EnergyScape project which integrates the fi ndings from a range of studies with the aim of considering New Zealand’s overall energy options.
The fi nal report of this study, Bioenergy Options for New Zealand – Bioenergy Research and Development Strategy will identify research priorities for realising the ypotential of bioenergy for New Zealand.
The challenge
The New Zealand Energy Strategy to 2050 was released at the end of 2007. It set out a vision for New Zealand’senergy future in response to global climate change. Thestrategy contained a number of ambitious future targets for New Zealand including:
• A reliable and resilient system delivering NewZealand sustainable low emission energy services;
• 90% renewable electricity by 2030;
• Halving greenhouse gas emissions per capita from transport by 2040.
The New Zealand Energy Strategy to 2050 has playedan important role in framing the scope and direction
4

of the overall EnergyScape project. The EnergyScape project has concluded that:
- New Zealand has a number of options for more renewable electricity from hydro, geothermal, wind, solar and marine resources;
- New Zealand has a number of options for more renewable heat from geothermal, solar and residualbiomass;
- Given our current reliance on fossil fuels fortransportation and its current rate of growth, the transportation target for the New Zealand Energy Strategy is by far the biggest challenge, even withsignifi cant gains from effi ciency and conservation.
Technologies exist for converting woody-biomass to arange of transport fuels (i.e. fossil petrol, diesel and jetfuel replacements).
The criteria
Renewable energy from biomass resources could playan important role in meeting this transportation challenge. To realise this potential, however, these resources must be:
• of suffi cient scale to meet a signifi cant percentageof demand;
• environmentally sustainable (e.g. not compete withfood, not lead to deforestation, have a positivenet energy balance, and reduce greenhouse gasemissions);
• economically viable.
Central to all of the criteria is land use.
The large-scale opportunity
As described in the Bioenergy Options – Situation Analysis report, it is theoretically possible for sNew Zealand to be self-suffi cient in transport fuelproduced from sustainably managed forests. To meet the petrol and diesel fuel demand in 2040 (6.3 billionlitres) would require 2.5 to 2.8 million ha of land - this is 34% of the available medium to low quality grazing land. The total liquid fuel demand, including jet fueland fuel oil for air and sea transport, is expected to be around 8.1 billion litres. It would require approx. 3.7 million ha, or 42% of low to medium quality grazing land, to produce this volume of fuel from forests.
Technologies exist for converting biomass to liquid and gaseous transport fuels, or biofuels. Biofuels areconsidered one of the most rapidly deployable waysof reducing our reliance on fossil transport fuels. Thisassumption drives the focus on transport fuels in thisreport. Transport fuel production from purpose-grown forest provides signifi cant greenhouse gas benefi ts(60-90% reduction) compared to fossil petrol and diesel (see Figure 1) and has an energy return on energyinvestment of approximately 4:1.
Figure 1: Greenhouse gas benefi ts of biofuels
100
50
0
-50
-100
-150
Ethanol from forest residues
Ethanol from purpose-grown forests
FT liquids from purpose-grown forests
Biodiesel from tallow
Biodiesel from canola
FT liquids from coal
(FT = Fischer-Tropsch synthesis)
Per
cen
tag
e re
du
ctio
n in
GH
G e
mis
sio
ns
B I O E N E R G Y O P T I O N S F O R N E W Z E A L A N D
5

Biofuel production from purpose-grown forests iscurrently not economically competitive. For example, for ethanol production from purpose-grown forest to be competitive, the price of oil will have to rise to US$185/bbl (exchange rate of $1NZ=$0.7US) assuming present-day technology. Based on oil price trends over the lastsix years this is likely to occur by 2020. Potential exists for improving the economics of producing biofuels from second-generation feedstocks such as woody biomass.Signifi cant research and development effort is focusedon second-generation technologies internationally, and there is large potential to optimise both feedstocks and the biomass supply chain for biofuel production.
The analysis carried out in this report does not take into account economic and environmental benefi ts toNew Zealand as a whole from the creation of a biofuelsindustry based on purpose-grown forests. These potential benefi ts are:
• job creation;
• regional development;
• carbon sequestration;
• improved landuse management;
• erosion control;
• improved water quality;
• a signifi cant long-term (~10 year) energy store;
• less exposure to international oil prices (New Zealandhas the third highest oil consumption per GDP).
These benefi ts mean that this bioenergy option hasimplications for government policy in a number of areas, in addition to energy.
Niche opportunities
New Zealand has a number of biomass resources that are not of a nationally signifi cant scale, but havesignifi cant environmental benefi ts or have the potential to make a contribution to regional energy demand. Some important pathways are:
• Forest residues for heat – reduces greenhouse gas (GHG) emissions (>95%) compared to coal; canmake a signifi cant contribution to regional heat demand in central North Island, Gisborne, southernNorth Island;
• Agricultural straw residues for heat or combined heat and power (CHP) – reduces GHG emissions(>95%) when compared to grid electricity and heat from coal; can make a signifi cant contribution toregional heat demand in Canterbury;
• Anaerobic digestion of municipal wastes and industrial effl uents for CHP – signifi cant reductions in waste (80%) and GHG emissions (80%); currently economically viable at favourable sites;
• Canola to biodiesel - reduces GHG emissions (70%) compared to fossil diesel; currently economicallyviable in Canterbury when grown in rotation with other arable crops;
• Algae to biodiesel or CHP - Algae were not dealtwith in this study as there were insuffi cient data toperform an accurate LCA. However algae have the potential to make a contribution to regional energywhen grown on nutrient-rich effl uents. Algae canbe used in a variety of ways including biodieselproduction and/or bio-gas via anaerobic digestion.
The Future
High levels of volatility in cost and supply in the energy market are likely to create ongoing uncertainty. Duringthe course of this study (October 07 to July 08) the price of oil went from US$80/bbl to US$144/bbl, and is now (August 08) back to US$114/bbl. Further, there is signifi cant investment in research and developmentglobally in pursuit of renewable energy generally and liquid fuels from biomass in particular. New technological developments are likely to cause step changes in opportunities.
The viability of biofuels and renewable energy isnot driven solely by price. Government policy withincentives and disincentives can have a major impact onthe viability of different solutions or opportunities.
B I O E N E R G Y O P T I O N S F O R N E W Z E A L A N D
6

Table 1: Summary of key biomass resource-to-consumer energy pathways
Pathway Potential scale GHG emissions and environmental sustainability
Economic viability
Straw to combinedheat and power(CHP)
√ Signifi cant contribution at theregional level.
√ Signifi cant GHG reductions(>95%) when compared togrid electricity and heat from coal. The EROEI is 18:1.
x Currently not competitive. Carbon price will infl uence economics.
Canola cropsto biodiesel
x Land use competitionreduces potentialscale.
√ Reduces GHG emissions(60%) compared to fossildiesel; EROEI is 2.2:1.Requires arable land.
√ Currently economicallycompetitive.
Reject kiwifruit to biogas via anaerobic digestion
x Small resource (1.5 PJ) nationally.
√ Signifi cant GHG reductions(>95%) compared tonatural gas. EROEI is 27:1.
x Currently not competitive.
Industrial effl uentto CHP via anaerobic digestion
x Resource is limited. √ Signifi cant reductionsin waste (80%) andGHG emissions (200%),compared to land disposal and grid electricity.
√ Economic at favourable sites, increase in electricity prices 15 to20% would make it viableat a greater range of sites.
Forest residuesto heat via combustion
√ 20% of demand. Can meet demand in some regions.
√ Reduces GHG emissionsby a factor of (90%) compared to coal.Energy return on energyinvestment (EROEI) is 6.4:1.
√ Future economics will beinfl uenced by the price of carbon.
Forest residuesto ethanol via enzymatic conversion
x 10% of demand. √ Signifi cant GHG reductions(~80%). Even lowpercentages blends provide environmental gains. EROEIis 3.5:1.
x Currently only 30% morecostly than petrol.
Purpose-grown forest to ethanol
√ Suffi cient low to moderate value land exists to make NZself-suffi cient in transport fuels.
√ Signifi cant GHG reductions(60-90%). Even lowpercentage blends provideenvironmental gains. EROEIis 4.5:1.
x Currently not competitive.
“We need to leave oil before oil leaves us.”“We— Fatih Birol, Chief Economist, International Energy Agencyency
B I O E N E R G Y O P T I O N S F O R N E W Z E A L A N D
7

B I O E N E R G Y O P T I O N S F O R N E W Z E A L A N D
88

Executive summary Executive summaryExecutive summary 44
ContentsContentsConten 99
1.0 Introduction1 0 Introduction 1010
2.0 Regional demand2 0 Regional demandg 1313
3.0 Life cycle analysis3 0 Life cycle analysiy y 2121
4.0 Biomass to consumer energy pathways evaluation 4.0 Biomass to consumer energy pathways evaluationgy p y 4747
5.0 Economics of wood-to-liquid fuel5.0 Economics of wood-to-liquid fuelq 5757
6.0 Conclusions6.0 Conclusions 6161
7.0 Appendices7.0 Appendices 6666
Appendix I - Forest scenario versus crop scenarioAppendix I - Forest scenario versus crop scenario– options and benefi ts– options and benefi ts
676767
Appendix II - Energy storageAppendix II - Energy storage 6969
Appendix III - Forest energy - multi-product forest scenarioAppendix III - Forest energy - multi-product forest scenario 7070
Appendix IV - Transition issuesAppendix IV - Transition issues 7272
Appendix V Appendix V 7373
GlossaryGlossary 7474
Contents
9

The Bioenergy Options for New Zealand project consists of three parts.
The fi rst is a Situation Analysis (published January 2008) which reviewed residual biomass sresources, conversion technologies and described a strategy to make New Zealand self suffi cient in transport fuels from forests. It also outlined a number of resource-to-consumerenergy pathways which were candidates for further investigation.
This Pathways Analysis is the second report, covering an analysis of the consumer economics sand environmental benefi ts of the promising pathways identifi ed in the Situation Analysis. ThePathways Analysis is summarised in the context of New Zealand’s energy demand and current economics surrounding the production of consumer energy (heat, electricity and transport fuels) from biomass.
The combined results of these two reports will be synthesised into a third document thatinforms a bioenergy research strategy for New Zealand. This strategy will suggest researchwhich enables bioenergy to make its most useful contribution to New Zealand’s energy future. The ultimate goal is to accelerate the implementation of renewable energy, in line with government strategy.
Energy from biomass
Bioenergy is receiving signifi cant political and social interest as well as large research anddevelopment investment. Globally much of this research is focussed on the production ofliquid biofuels. This interest is driven by the rising cost of oil and increasing concern over theimpact of peak oil, as well as climate/GHG concerns. This has been summarised by the Chief Economist of the International Energy Agency in his statement: “We need to leave oil before itleaves us”.
New Zealand, along with the rest of the world, must fi nd a way to produce renewable energy,including bioenergy and biofuels in a way that minimises its impacts on food production and our environment. New Zealand solutions must be tailored to our energy and resource profi le, including our available land resources.
B I O E N E R G Y O P T I O N S F O R N E W Z E A L A N D
10

Fossil fuels are stored solar energy from plants that lived millions of years ago. As we mine this storedenergy we need to consider what we will replace it with, and how we can most effi ciently use that energy. Oneoption is the use of plants to capture and store solarenergy on a large scale (biomass), for a variety of future energy uses. In a New Zealand context this is made possible by large areas of suitable land and a relatively low population density.
The outputs of the EnergyScape asset review have beenbriefl y summarised as:
” We can do electricity and heat, the problem isliquid fuels.” (Don Elder, CEO Solid Energy, Chairman EnergyScape Steering committee).
In more detail this means we have suffi cient natural resources (hydro, geothermal, wind, marine) to create enough renewable electricity to meet our demands.
We also have signifi cant proven lignite, and coal resources, some gas, and a history of gas discoveries. Whilst they are not renewable or low GHG emitters, the resource exists in New Zealand and can be produced andused relatively cheaply.
Further it is apparent that for a resource to be worthyof development or research investment it must be both practical and able to deliver consumer energy on a signifi cant scale. The order of this scale is driven by our
current national energy demand (~740 PJ of primary energy, ~520 PJ of consumer energy).
There are many ways of making bioenergy, and theinitial resources will inevitably be residues and wastes. These resources offer a double benefi t as you can extract energy, and reduce the waste disposal cost and environmental impact at the same time. However, residuals are inevitably limited in scale and competitionfor wastes is growing as different uses are found forthem. For this reason, a large scale bioenergy resourcewill be required in the future, preferably one that offers the possibility of large scale energy storage.
New Zealand is not alone in looking at bioenergy and potential biomass resources. There is a global trend to develop purpose-grown bioenergy resources, asresiduals have typically proven to be limited in scale.The purpose-grown resources are in similar categoriesto those considered in New Zealand such as crops fromarable land and the use of ligno-cellulosic material.
This analysis looks at a range of residual and potential purpose-grown bioenergy resources and some of the key conversion options available to utilise them. Theinformation allows the preferred biomass to consumer energy routes to be identifi ed and highlights areaswhere effi ciency and environmental improvements can be made by research and development.
B I O E N E R G Y O P T I O N S F O R N E W Z E A L A N D
11

The research team consists of:
• Scion;
• Landcare Research;
• Waste Solutions;
• CRL Energy;
• Fuel Technology Ltd.
Structure of summary report
This document contains summaries of the contributingreports, and interpretation of the various results. Thedetailed reports (including references) on each topic arepresented on the CD attached to this report.
This report follows on from the Bioenergy Options for New Zealand Situation Analysis – Biomass Resources and Conversion Technologies.
It provides:
1. A view of New Zealand’s energy demand at a national and regional level by consumer energy type (heat, electricity and liquid fuels).
2. Detailed Life Cycle Assessments of the followingcase studies to identify environmental hotspots:
• agricultural residue (straws);
• horticultural residue (kiwifruit rejects);
• effl uent (meat works);
• purpose-grown crop for production of biodiesel(fi rst generation);
• wood residues and purpose-grown forest wood for heat, electricity and liquid fuels (secondgeneration).
3. A broad comparison of a wide range of bioenergyresource-to-consumer energy pathways.
4. The high level economic drivers of liquid fuel production from woody biomass.
Other opportunities
Beyond the conversion technologies presented herethere are a number of emerging opportunities (e.g.,algae to biodiesel or CHP, biomass to CO to ethanol,biomass and super critical water to liquid fuels, pyrolysis to liquid fuels). There was insuffi cient information onthese technologies to complete LCA analyses.
12

REGIONAL ENERGY DEM
AND AND REGIONAL BIOM
ASS RESOURCES
B I O E N E R G Y O P T I O N S F O R N E W ZW Z E A LE A L A N DA N D
13

Biomass resources are inherently widely distributed. Their distribution is affected by a variety of local infl uences (geography, conservation areas, agriculture, forestry,population and industrial processing). In order to try and match these resources withenergy demand it is useful to consider demand at a regional level.
Regional energy demand
Overall, current energy demand is dominated by Auckland (29% of total energy) with some regionsAuckland (29% of total energy), with some regions having higher than average demands for certain types ofenergy. Energy demand is sometimes driven by industry rather than population. For example: Waikato and theBay of Plenty have a high demand for industrial heat (dairy and wood processing) and Southland for electricity(aluminium smelting).
Regional demand for consumer-energy (heat, transport fuel and electricity) in 2007 is shown in Table 2 Thefuel and electricity) in 2007 is shown in Table 2. The fi gures for 2007 were extrapolated from publicly-available 2002 data assuming a 2% per annum annual growth in energy consumption.
B I O E N E R G Y O P T I O N S F O R N E W Z E A L A N D
14
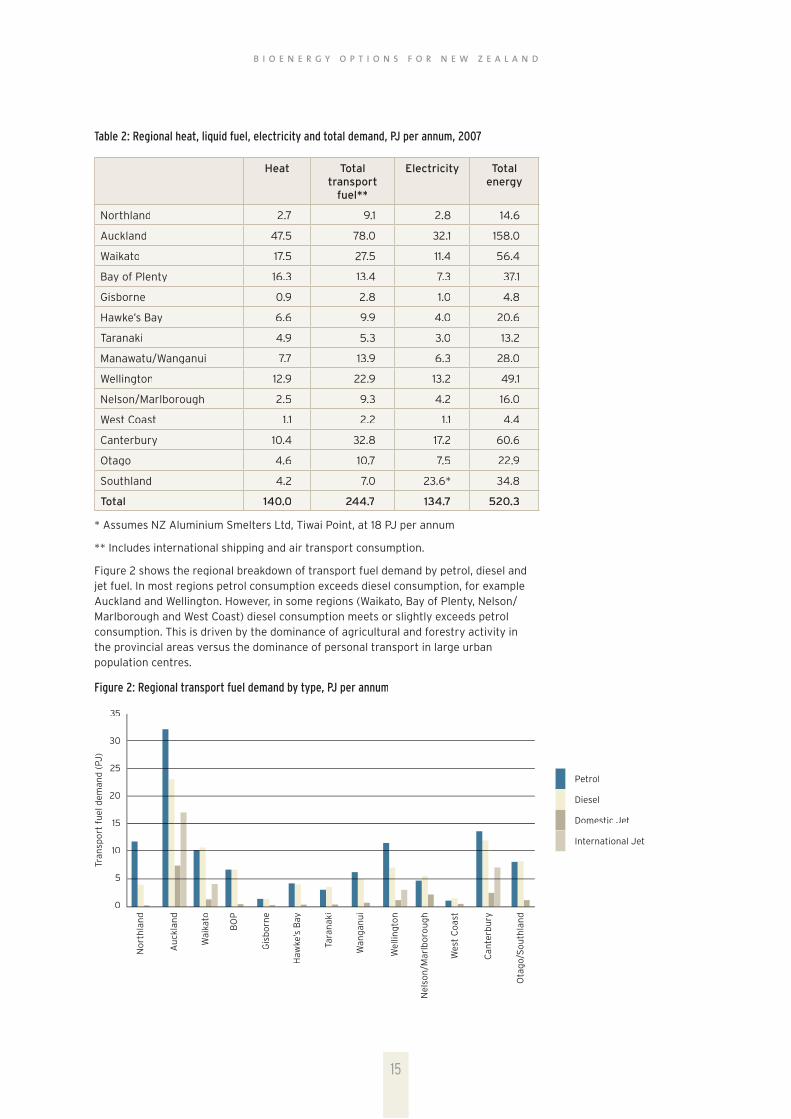
Table 2: Regional heat, liquid fuel, electricity and total demand, PJ per annum, 2007
Heat Totaltransport
fuel**
Electricity Totalenergy
Northland 2.7 9.1 2.8 14.6
Auckland 47.5 78.0 32.1 158.0
Waikato 17.5 27.5 11.4 56.4
Bay of Plenty 16.3 13.4 7.3 37.1
Gisborne 0.9 2.8 1.0 4.8
Hawke’s Bay 6.6 9.9 4.0 20.6
Taranaki 4.9 5.3 3.0 13.2
Manawatu/Wanganui 7.7 13.9 6.3 28.0
Wellington 12.9 22.9 13.2 49.1
Nelson/Marlborough 2.5 9.3 4.2 16.0
West Coast 1.1 2.2 1.1 4.4
Canterbury 10.4 32.8 17.2 60.6
Otago 4.6 10.7 7.5 22.9
Southland 4.2 7.0 23.6* 34.8
Total 140.0 244.7 134.7 520.3
* Assumes NZ Aluminium Smelters Ltd, Tiwai Point, at 18 PJ per annum
** Includes international shipping and air transport consumption.
Figure 2 shows the regional breakdown of transport fuel demand by petrol, diesel andjet fuel. In most regions petrol consumption exceeds diesel consumption, for example Auckland and Wellington. However, in some regions (Waikato, Bay of Plenty, Nelson/Marlborough and West Coast) diesel consumption meets or slightly exceeds petrolconsumption. This is driven by the dominance of agricultural and forestry activity in the provincial areas versus the dominance of personal transport in large urbanpopulation centres.
Figure 2: Regional transport fuel demand by type, PJ per annum
35
30
25
20
15
10
5
0
Petrol
Diesel
Domestic Jet
International Jet
No
rth
lan
d
Au
ckla
nd
Wai
kato
BO
P
Gis
bo
rne
Haw
ke’s
Bay
Tara
nak
i
Wan
gan
ui
Wel
ling
ton
Nel
son
/Mar
lbo
rou
gh
Wes
t C
oas
t
Can
terb
ury
Ota
go/
So
uth
lan
d
Tran
spo
rt f
uel
dem
and
(PJ
)
B I O E N E R G Y O P T I O N S F O R N E W Z E A L A N D
15

Regional residual biomass resources
Biomass can potentially make a contribution to meeting some of the regional energy demand. The primary energy contained in all major residual biomass resources (forestry, agriculture, horticulture, municipal, meat industry and dairy industry), is presented in Figure 3. Typically thesebiomass resources total around 2 to 4 PJ per annum per region, with the exceptions being:
• Central North Island (14 PJ) – driven by forestry residues (wood);
• Canterbury (11 PJ) – driven by agricultural residues (straws);
• West Coast (<1 PJ) – from a variety of small sources.
Figure 3: Regional residual biomass, total primary energy, PJ per annum (Hall and Gifford 2008)
Figure 4 shows the contribution that current residual biomass could potentially make to regional heat demand. Residual biomass can make a signifi cant contribution (>25%) at a regional levelin Northland, Central North Island, Gisborne, Hawke’s Bay, Southern North Island, Nelson/Marlborough and Canterbury.
Figure 4: Potential contribution of residual biomass to regional heat demand
16.0
14.0
12.0
10.0
8.0
6.0
4.0
2.0
0.0
180
160
140
120
100
80
60
40
20
0
Per
cen
tag
e C
on
trib
uti
on
to
Hea
t D
eman
d
Northland
Auckland
CNI
Gisborne
Hawke’s Bay
SNI
Nelson/Marlborough
West Coast
Canterbury
Otago/Southland
Northland
Auckland
CNI
Gisborne
Hawke’s Bay
SNI
Nelson/Marlborough
West Coast
Canterbury
Otago/Southland
Res
idu
al b
iom
ass
(PJ
)
B I O E N E R G Y O P T I O N S F O R N E W Z E A L A N D
16

Comparing the consumer energy that can be derived from residual biomass with the national demand for that type of energy (Table 3) it is clear that residual resources fall far short of current energy demands. The ability of biomass residues to meet heat demand is estimated to remain similar over time to 2050, with an overall increase in the long term.
Table 3: Residual biomass resources versus demand, national level
Demand PJ per annum
All residual biomass resources converted
to meet demand, PJ p.a.
Biomass as a %of demand
Heat 140 42 30
Liquid Fuels 245 15 6
Electricity 135 16 12
Future national demand
The New Zealand Energy Outlook to 2030 presents a scenario for future energy demand by fuel type to 2030. Further projections through to 2050 were made on a straight line basis from thoseof the Energy Outlook. These projections are shown in Table 4.
Table 4: New Zealand Energy Outlook: Future energy demand (PJ per annum)
2010 2020 2030 2040 2050
Oil 250 290 320 340 390
Gas 50 52 61 66 70
Coal 41 42 44 46 48
Electricity 133 155 178 200 222
Renewables 28 30 33 36 39
Total 502 560 636 628 769
Under these assumptions, in 2050 total energy demand will be approximately 50% higher than it is now.
Peak oil and greenhouse gases
The New Zealand Energy Outlook projections were based on an assumed price of oil at US$60 per barrel. Already it is over US$120 (June 2008). These price increases are expected to continue, driven by the onset of peak oil (Figure 5) and increasing demand from China and India.It is predicted that there will be serious supply and cost issues with oil by 2030.
Figure 5: Peak oil supply prediction
35
30
25
20
15
10
5
01930 1940 1950 1960 1970 1980 1990 2000 2010 2020 2030 2040 2050
Bill
ion
bar
rels
a y
ear
(Glo
bal)
Image from, “The End of Oil” Professor Bob Lloyd, Physics Department, University of Otago July 2005: Colin Campbell’s 2004 scenario for world oil and gas liquids.
US-48
Europe
Russia
Other
Middle East
Heavy etc
Deepwater
Polar
NGL
B I O E N E R G Y O P T I O N S F O R N E W Z E A L A N D
17

It is illustrative to consider current fossil fuel usage broken down by consumer energy i.e. heat, electricity and transport fuels (Table 5). Virtually all transport fuels are derived from fossil sources, as is 27% of electricity, and 41% of heat. New Zealand is heavily dependant on fossil fuels with 509 PJ ie. of primary energy 509PJ (68%) being derived from fossil sources.
Table 5: New Zealand’s consumer-energy derived from fossil sources (estimated from MED 2006)
% from fossil sources
Amount offossil energy,
PJ
Comments
Liquid Fuels 100 287 87% imported
Electricity 27 38 Requires 132 PJ of fossil fuel to produce
Heat 41 80 Requires 90 PJ of fossil fuel to produce
Total 65 405 77% of consumer energy
The New Zealand Energy Strategy has made projections for New Zealand’s energy demands in terms of consumer-energy (Table 6). This predicts a 50% increase in demand for transport fuels by 2050.Even under an ambitious scenario of electric cars replacing 40% of the fl eet, the transport fueldemand will still increase 10% from current levels by 2050.
Table 6: New Zealand Energy Strategy: Future consumer-energy demands, PJ per annum
Year Heat Transport fuels Electricity Total
2025 200 325 192 717
2050 328 441 316 1085
2050 with electric cars at40% of fl eet
328 321(-120) 353(+37) 1002
Currently, transport fuels make up 20% of New Zealand’s total greenhouse gas emissions(46% of CO
2). The combination of increasing oil prices and the need to reduce greenhouse gas
emissions strongly suggest that New Zealand needs to reduce its dependence on oil as a source of transport fuels.
Purpose-grown forest
The Bioenergy Options: Situation Analysis report proposed a potential strategy to meet New Zealand’s srenewable energy needs with purpose grown forests; this strategy was driven by the limited nature ofbiomass residuals.
Land potentially available for afforestation (for energy forests) has been identifi ed. Highly productive lands based on land use classes (LUC) and current land use and existing plantation forests were excluded. Also excluded were indigenous forest, Department of Conservation (DOC) estate and otherareas such as wetlands, waterways and urban areas.
Three sets of analysis criteria based on slope, elevation and LUC were used to determine areas of land (low, medium and high) potentially suitable for conversion to forestry. The full set of regional fi gures, by criteria set (low, medium, high area of land) is presented in Table 7.
Currently, greenhouse gas emissions from transport fuels makeCurreup 20% of New Zealand’s total greenhouse gas emissions.ions.
B I O E N E R G Y O P T I O N S F O R N E W Z E A L A N D
18

Table 7 – Land area (ha), potentially available for forestry by region for each set of analysis criteria
Medium land area High land area
Northland Region 6,658 67,759 258,010
Auckland Region 246 26,297 78,147
Waikato Region 5,541 266,872 462,849
Bay of Plenty Region 643 28,506 75,328
Gisborne Region 5,763 244,381 297,830
Hawke’s Bay Region 11,578 392,044 505,106
Taranaki Region 12,765 87,483 119,888
Manawatu-Wanganui Region 34,747 641,184 755,415
Wellington Region 8,852 194,366 240,586
North Island 86,793 1,948,892 2,793,159
Nelson Region 35 1,758 2,667
Tasman Region 2,861 26,515 49,905
Marlborough Region 26,161 113,486 142,316
West Coast Region 4,497 18,773 54,362
Canterbury Region 342,023 572,459 928,048
Otago Region 318,146 521,179 850,602
Southland Region 50,644 169,292 348,017
South Island 744,367 1,423,462 2,375,917
New Zealand 831,160 3,372,354 5,169,076
Assuming forest biomass productivity of 600m3 of solid wood per ha (23-year rotation), a net calorifi c value of 7.1 GJ/m3 for wood, and a conversion-effi ciency to ethanol of 52% on an energybasis, we can estimate the potential contribution to liquid fuels supply. Table 8 shows the potentialcontribution from the medium land area scenario.
Table 8: Potential liquid fuel contribution from purpose grown forest (PGF) medium land area scenario
Liquid fueldemand (PJ p.a.)
Fuel from residues (PJ p.a.)
Fuel from PGF (PJ p.a.)
Northland 17.4 1.3 6.5
Auckland 87.9 2.0 2.5
CNI 43.9 5.8 28.4
Gisborne 2.9 0.6 23.5
Hawke’s Bay 9.0 0.9 37.8
SNI 45.1 1.9 88.9
Nelson/Marlborough 13.5 1.3 13.7
West Coast 2.9 0.1 0.6
Canterbury 38.7 1.3 50.9
Otago/Southland 19.1 1.3 66.5
New Zealand 280.5 16.6 324.8
B I O E N E R G Y O P T I O N S F O R N E W Z E A L A N D
19
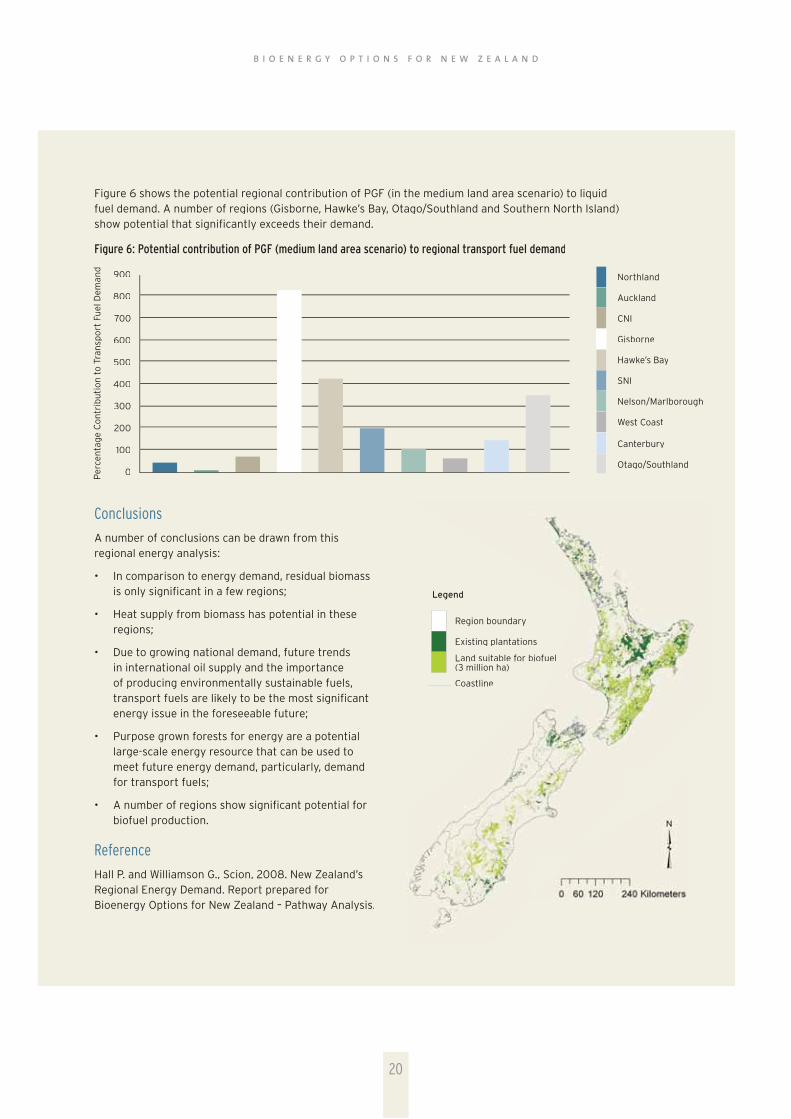
Figure 6 shows the potential regional contribution of PGF (in the medium land area scenario) to liquidfuel demand. A number of regions (Gisborne, Hawke’s Bay, Otago/Southland and Southern North Island)show potential that signifi cantly exceeds their demand.
Figure 6: Potential contribution of PGF (medium land area scenario) to regional transport fuel demand
Conclusions
A number of conclusions can be drawn from this regional energy analysis:
• In comparison to energy demand, residual biomassis only signifi cant in a few regions;
• Heat supply from biomass has potential in theseregions;
• Due to growing national demand, future trends in international oil supply and the importance of producing environmentally sustainable fuels,transport fuels are likely to be the most signifi cant energy issue in the foreseeable future;
• Purpose grown forests for energy are a potentiallarge-scale energy resource that can be used to meet future energy demand, particularly, demand for transport fuels;
• A number of regions show signifi cant potential forbiofuel production.
Reference
Hall P. and Williamson G., Scion, 2008. New Zealand’sRegional Energy Demand. Report prepared for Bioenergy Options for New Zealand – Pathway Analysis.
Northland
Auckland
CNI
Gisborne
Hawke’s Bay
SNI
Nelson/Marlborough
West Coast
Canterbury
Otago/Southland
900
800
700
600
500
400
300
200
100
0Per
cen
tag
e C
on
trib
uti
on
to
Tra
nsp
ort
Fu
el D
eman
d
Region boundary
Existing plantations
Land suitable for biofuel(3 million ha)
Coastline
Legend
B I O E N E R G Y O P T I O N S F O R N E W Z E A L A N D
20

LIFE CYCLE ANALYSISB I OB I OB I O EE NE N E R G Y O P T I OOOOO NN SS NNN FF O RF R N E N EN W W ZW ZZ E AAA LLE LE A A N DNNA N DDA N DNA
21

Life cycle assessment (LCA) is a systematic methodology for assessing the environmental impactsassociated with a product, such as energy. The focus of this work is on greenhouse gas emissions (measuredas CO
2equivalents) and energy return on energy
invested (EROEI).
This section presents detailed LCAs and Life cyclecostings (LCC), to determine the economics of thefollowing New Zealand biomass resource-to-consumerenergy pathways:
1. Agricultural straw to combined heat and power via combustion (CHP);
2. Canola to biodiesel via transesterifi cation;
3. Reject Kiwifruit to biogas via anaerobic digestion;
4. Industrial effl uent to CHP via anaerobic digestion to biogas;
5. Forest residues to heat via combustion;
6. Forest residues to CHP via combustion;
7. Forest residues to heat via gasifi cation;
With the increasing use of biomass for energy, questions arise about the validityof using bioenergy as a means to reduce greenhouse gas (GHG) emissions and dependence on fossil-fuels. There are also questions about which of the many possible routes to take biomass from raw material to consumer energy offers themost effective use of the resource.
8. Forest residues to CHP via gasifi cation;
9. Forest residues to ethanol via enzymatic conversion;
10. Forest residues to Fisher-Tropsch (FT) liquids via gasifi cation followed by a FT process;
11. Purpose-grown forest to heat via combustion;
12. Purpose-grown forest to CHP via combustion;
13. Purpose-grown forest to heat via gasifi cation;
14. Purpose-grown forest to CHP via gasifi cation;
15. Purpose-grown forest to ethanol via enzymatic conversion;
16. Purpose-grown forest to FT liquids via gasifi cation followed by a FT process.
A key purpose of these detailed studies is to identify emissions and energy hot spots along the productionchains. These hotspots can then undergo furtherinvestigation, to fi nd ways of reducing their impact. This work complements the comparative pathway evaluationpresented in Section 4.0.
B I O E N E R G Y O P T I O N S F O R N E W Z E A L A N D
22

In addition to data accuracy, the key factors that affectthe results of an LCA are choice of:
• System boundary – This defi nes what is included in the study. For example, with a waste product (municipal effl uent) the collection of the material is often not included in the modelling, as it would begathered anyway.
• Allocation method - In systems where energy is produced together with non-energy commoditiessuch as agricultural and timber products, themethod by which the environmental impacts from production are allocated between the products strongly infl uence the results. Two common methods are allocation based on economic value or allocation based on mass.
• Functional unit - for energy systems, a unit such as1 GJ of energy is often taken as the functional unit.However, not all consumer energies are equal (i.e.heat versus electricity versus liquid fuel) due to theunavoidable ineffi ciencies involved in interchanging some of these energies (e.g. converting heat to electricity).
When comparing the LCA results of different systemsand/or comparing analyses carried out by differentpractitioners, it is important to take into considerationthese factors.
While there are many advantages to using LCA and LCCto provide a holistic comparison of bioenergy formsconsidering the whole production chain, there are alsolimitations:
• The focus of the life cycle assessments done here has been material and energy fl ows relating to GHGproduction, fossil fuel use and economic costs.
• The assessment approach calculated only the primary environmental impacts of the process chain,(e.g., energy consumption and pollutant emission during the cultivation of energy canola. Secondaryeffects were not covered). For instance, if the demand for canola results in the conversion of forest land or wetlands, the environmental impact of thishas not been included.
• Economic allocation is based on current prices(2008). The price of goods depends on market dynamics and will change over time.
• The process chains investigated represent only a subset of all production processes; many moreproduction paths are conceivable. The paths chosen, however, are considered especially relevant for the current situation in New Zealand.
• The most recently available existing New Zealanddata have been used where possible. Where these data are not available, overseas data have been used.
• Results may not apply to individual production plants, because the environmental impacts inindividual cases may differ greatly from the average situation.
Reference
IEA Bioenergy Task 38 participants, 2008, Comparing Greenhouse Gas Emissions and Energy Balances of Bioenergy and y Other Energy Systems using a Life Cycle Assessment Approach: Strategic Position Paper
B I O E N E R G Y O P T I O N S F O R N E W Z E A L A N D
2323

Background
Each season, arable cropping in New Zealand produceslarge volumes of excess straw that is not used. Unwanted straw is generally disposed of by cutting it up and leaving it on cropped fi elds to break down intoorganic matter. It can also be burnt to reduce the cost of establishing the next crop and vulnerability to pests.However, burning is becoming less common with tighter restrictions being imposed by local authorities.
Some of this material is not required for soil nutritionand could be utilised. For typical New Zealand cropped soils, an average of 50% of the crop residuecan be removed.
This LCA analyses the feasibility of a CHP plant usingstraw as an alternative means of generating energy in New Zealand. CHP is the simultaneous generation of
usable heat and electricity. This means of producingenergy is already used in other countries and largevolumes of surplus straw are used to fi re CHP plants in Europe.
To make the process economic, and fully utilise the heat generated, a CHP plant in New Zealand would need to be located alongside an industrial plant that requires continual heat.
Canterbury is the principle region where arable crop residues are available in suffi cient volumes to consider CHP using straw as a feedstock. The scenario assumed for this LCA is a CHP plant located in Timaru (which has industries that require heat), supplied with surplus strawfrom the surrounding arable farmland. Table 9 lists the surplus tonnage of residues from wheat and barleycrops in Canterbury.
Table 9: Available residue production in Canterbury (tonnes)
Wheat Barley Total
Crop standard moisture content 292,678 204,149 496,827
Dry weight (less 13%) 254,630 166,101 420,731
Harvest index (50%) 0.5 0.5
Residue (dry weight) 254,630 166,101 420,731
Surplus residue (dry weight) 127,315 83,050 210,365
Source: Saggar et al. (2007)
Life cycle assessment of straw CHP in New Zealand Summary Box
• Potential scale of resource: Signifi cant regional resource, 0.6 PJ electricityand 1.8 PJ of heat from 210 000 tonnes of straw/year in Canterbury
• Energy balance: has an EROEI ratio of 17.6:1
• GHG emissions: greater than 90% reduction in comparison with coal for heat and grid electricity
• Other environmental benefi ts: avoids burning crop stubble
• Economics: currently not economically viable
• Technology status: mature
B I O E N E R G Y O P T I O N S F O R N E W Z E A L A N D
24

Straw balingStorage andconveying
Strawshredder
Cyclone
Bagfi lter
Stack/fl ue
Steam for CHPBoiler
Farm for fertiliser
Landfi ll
System boundary
Figure 7 shows the system boundaries used in this LCA. The cost of plant construction, operation, and maintenance is included in the life-cycle inventory.
Figure 7: Boundary of the straw LCA
Bottom ash
Fly ash
Functional unit
The functional unit for this study is 1 GJ of energy.
Allocation method
Allocation of impacts between co-products is based oneconomic value. Since the crop residues are produced as an unwanted by-product of another farming activityand have no economic value to the farmer, no monetaryvalue has been assigned to the straw. All energy inputsand costs of the growing and harvesting operation are allocated to the primary crop.
Key assumptions
Resource
• The cost of straw fuel for the CHP plant is determined by the cost of baling and storage and distance carted.
• Straw has a calorifi c value (at 15% moisture content)of 14.8MJ/kg.
Baling
• $22/tonne to bale.
• $1.465/litre for diesel, conversion rate 37.86MJ/litre.
Transport
• 60 km supply radius to CHP plant in Timaru.
• Mean distance to farm 44km.
Plant
• A 33MW plant capable of generating 33GWh ofelectricity and 327 TJ of heat per year from 40,000tonnes of straw.
• Inputs and outputs cover all processes related toheat and power production including administration and local wastewater treatment.
• Power and heat production is estimated based onan average straw-based CHP plant with a yearlynet electricity effi ciency of 25% and an overall neteffi ciency of 90%.
B I O E N E R G Y O P T I O N S F O R N E W Z E A L A N D
25

Electricity generation
• The cost of the turbines to generate electricity has been included in the LCA. Costs of connection to thegrid have not been included.
Residue waste
• Slag by-products used as fertiliser. Average distanceto distribute 44km.
• No additional cost or energy for spreading.
Capital
• $NZ1.65m per MW (based on plants in Spain and England).
Other assumptions are given in the full report.
Key impacts
1000kg of dry straw (i.e. with all moisture removed) produces 11760MJ of energy, comprised of 3060MJ of electricity and 8700MJ of heat.
Economics
The main costs associated with producing energy from straw are the capital costs ($67.61 per 11760MJ), and operating and maintenance costs ($33.81 per 11760MJ). Together, these costs account for $101.42 of the $164cost of producing 11760MJ of heat and electricity.
Purchasing the equivalent amount of electricity from the grid and using coal to generate the heat would cost $119.8 (excluding capital cost of the existing boiler, wages, operating and maintenance, rates, and overheads).
Energy balance
From an energy perspective there are benefi ts; theamount of primary energy required to produce the above 11760 MJ is 670MJ. Table 10 shows the energyreturn on energy invested for the straw CHP plant, compared with electricity from the grid, and heat from coal. The energy return on investment is calculated as energy out/primary energy in.
Table 10: Energy return on investment for straw CHP plant
Energy in1 (MJ)
Energyout (MJ)
Energy out/energy in
Straw CHP plant 670 11,760 17.6
Grid electricityand coal-fi redheat
14,759 11,760 0.8
Greenhouse gas emissions
The greenhouse gas outputs from producing 3060MJ of electricity and 8700MJ of heat from straw are 40 kg CO
2-e, which compares favourably with those from
electricity from the grid (174 kg CO2-e) and heat from
coal (828 kg CO2-e).
Conclusions
Canterbury is the principle region where arable crop residues are available in suffi cient quantities to consider CHP using straw. The total resource of surplus straws in Canterbury is 210,000 tonnes per annum. This resourceis equivalent to 0.6 PJ electricity and 1.8 PJ heat under the present CHP scenario.
The plant modelled could produce 3060MJ of electricity and 8700MJ of heat at a cost of $164.
The greenhouse gas reductions of straw to heat and electricity via CHP are signifi cant (>90%) whencompared to electricity from the grid and heat from coal.
Energy return on energy invested is highly in favour of straw CHP with an EROEI of 17.6 to 1, where as the same energy from grid electricity and coal for heat is 0.8 to 1.
Reference
Forgie V. and Andrew R. Landcare Research May 2008. Lifecycle assessment of using straw to produce industrial energy in New Zealand. Report prepared for the Bioenergy Options for New Zealand – Pathways Analysis project.
Energy return on energy invested isEnergyhighly in favour of straw CHP with an EROEI of 17.6 to 1, where as the sameenergy from grid electricity and coalnd coalfor heat is 0.8 to 1.
B I O E N E R G Y O P T I O N S F O R N E W Z E A L A N D
26

Life cycle assessment of Canola to Biodiesel in New ZealandSummary Box
• Potential scale of resource: 39 PJ of liquid fuels (1.1 billion litres, assumes maximum crop area of 1 million ha)
• Energy balance: has an EROEI ratio of 2.2:1
• GHG emissions: 62% reduction in comparison with fossil diesel
• Economics: currently economically viable
• Technology status: mature
Background
Biodiesel is a high-quality fuel that is widely accepted in Europe and North America. The creation of biodiesel from oily plant material (seeds and nuts) is a straightforward process based on common technologiesthat are well developed. Glycerol is a key co-product ofbiodiesel production that provides a cost offset.
The best potential source of biodiesel in New Zealand has been identifi ed as canola crops. Canola is a brassica crop that produces seeds with oil content from about 40%–46%, at 8% moisture content. The area most
suited to growing canola in New Zealand is on the Canterbury Plains of the South Island. Canola haspreviously been grown in New Zealand to producecooking oil, and has been grown as a fodder crop for stock. The oil in canola seeds is most commonly extracted either mechanically in an oil press or chemically with a solvent. Normally 65%–80% of the oil can be extracted in an oil press. After the oil has been extracted the most valuable by-product is a protein-richcanola meal, which can be sold for stock food to dairyand beef farming operations.
System boundary
Figure 8 shows the system boundaries used in this LCA. The cost of plant construction, operation, and maintenance is included in the life-cycle inventory.
Figure 8: System boundary of the Canola Biodiesel LCA (T = transport)
Growing
Farm Fertiliser Co.
UseBiodiesel
Alcohol CatalystFertiliser
Transesterifi cation
By-productsMeal
Extraction
T T
TTT
B I O E N E R G Y O P T I O N S F O R N E W Z E A L A N D
27

Functional unit
The functional unit for this study is 1 GJ of energy.
Allocation method
Allocation of impacts between co-products is based oneconomic value.
Key assumptions
Crop Yield
• Dry canola seed yields of 3400 kg per hectare,which can produce 1130 kg of oil.
• Stock food co-product, canola meal, has a yield of 2240 kg/ha. Assumed to be sold by biodiesel plant at $500/tonne.
Growing
• Canola is grown on a 3–5-year rotation with othercereal crops, with a single canola rotation lastingabout six months.
• Nitrogen fertiliser applied at 105 kg N/ha, minus 17.2 kg N/ha credit for canola straw returned to soil.
Transport
• Crops are grown in Canterbury a distance of 50 km(on average) from the processing plant.
Return to farmers
• Biodiesel plant pays farmers $49 per 75 kg ofcanola seed.
Glycerol co-product
• Glycerol is produced at a ratio of 1:10 with biodiesel, with the co-product credit in the order of $0.05–$0.10 per litre of biodiesel produced.
Plant capital and operational costs
• Capital costs of biodiesel plant are 4.89 c/l/yr based on a 20Ml/yr plant.
• Operational costs of biodiesel plant are 9.82 c/l/yrbased on a 20 Ml/yr plant.
Other assumptions are given in full report.
Key impacts
It takes 75 kg of dried canola seed at 8% moisture content to produce 1000 MJ of biodiesel.
Economics
The main cost associated with production is the expense of obtaining the seed. It typically costs farmers approximately $20 to supply 75 kg of seed with the
biggest cost inputs for the grower being nitrogenfertiliser, weed and pest control, and electricity for irrigation.
Given the assumed payout, this will provide farmers a gross margin of $1258/ha if they yield 3.5 tonnes of seed per hectare. In comparison, arable farmers were returning a gross margin of $965/ha for wheat and $708/ha for barley in 2005.
Under the study’s assumptions, conversion of 75 kg of canola seed to 1000 MJ of energy and co-products will cost $37. Of this, $32.30 is allocated to canola biodiesel, $0.58 to potassium salts, and $4.00 to glycerin. Incomparison, diesel fossil fuel retailed for $39 per1000 MJ in April 2008.
Greenhouse gas emissions
The production and combustion of 1 GJ of canola biodiesel results in emissions of about 27 kgCO
2-e,
which compares favourably with fossil diesel at around 83 kgCO
2-e. This is a reduction by 62%.
Energy balance
From an energy perspective there are benefi ts. Theamount of primary energy required to grow 75 kg of seed is 408 MJ, which produces 25 kg of canola oiland 50 kg of meal. When the energy input into growingand pressing the canola seed is split on an economic allocation basis, the 25 kg of canola oil requires 231 MJof energy to produce, and the meal 221 MJ of energy. The transesterifi cation process requires an additional282 MJ of energy.
With credits from sales of potassium salts and glycerol,it therefore takes 449 MJ of energy to produce biodiesel with 1000 MJ of energy from canola seed. The equivalent amount of fossil diesel requires 1193 MJ ofenergy. Fossil fuel energy makes up 70% of the energyrequired to produce the canola, mostly from diesel, electricity, and the production of nitrogen fertiliser and methanol.
Conclusions
At current prices, growing canola to create biodiesel iscost competitive with fossil diesel.
The GHG emissions from producing and using canola biodiesel are favourable compared to producing andusing fossil diesel, with GHG emission reduced by 62%.
The energy balance (energy out:energy in) of the canola to biodiesel production chain is 2.22:1. This means thesystem is viable in the long term, fuelling itself, and producing an excess. This energy balance is better thanthat of fossil diesel.
B I O E N E R G Y O P T I O N S F O R N E W Z E A L A N D
28

The price of canola seed will be driven by the potential revenues from alternative arable crops (wheat oats).
Sensitivity analysis showed that:
• Economic viability depends critically on the price of canola seed. For example, a modest 20% increase in the price of canola seed results in production of canola biodiesel ($42/GJ) no longer beingeconomically viable compared to fossil diesel.
• The use of residual meal from processing the oilseed for stock food , and its associated value, iscritical to the cost competitiveness of biodiesel from canola.
• The price of glycerol has a small but signifi cant effect on the cost competitiveness of producing biodiesel from canola.
Reference
Andrew R and Forgie V. Landcare Research 2008. Life cycle analysis of canola biodiesel in New Zealand.Report prepared for the Bioenergy Options for New Zealand - Pathways Analysis project.
The use of residual meal from processing the oil seed The usfor stock food , and its associated value, is critical to the cost competitiveness of biodiesel from canoola.
B I O E N E R G Y O P T I O N S F O R N E W Z E A L A N D
29

Life cycle analysis of reject kiwifruit to CHP via anaerobic digestion to biogasSummary Box
• Potential scale of resource: Small, 0.06 PJ per annum nationally
• Energy balance: has an EROEI ratio of 11.3:1
• GHG emissions: greater than 90% reduction in comparison with gas for heat and grid electricity
• Other environmental benefi ts: waste reduction
• Economics: currently not economically viable
• Technology status: mature
Background
Kiwifruit orchards typically produce around 23 tonnesof kiwifruit per hectare and output volumes currentlyaccount for 30% of total horticultural exports from the country. It is estimated that nationally there are 60,000 tonnes of reject kiwifruit per year.
Kiwifruit are grown in three main regions of New Zealand – Bay of Plenty, Northland and Nelson.Because the Bay of Plenty region produces 86% of thekiwifruit crop, it is the region with most potential to use reject kiwifruit as a feedstock for biogas. The data usedin the LCA for kiwifruit growing costs, energy use, andCO
2 emissions are based on the Bay of Plenty region.
Reject fruit from the horticultural industry is a potential feedstock for biogas production using anaerobicdigestion (AD). This study tested the viability of thisprocess using kiwifruit as an example, it being one of thebiggest fruit waste resources in New Zealand.
Functional unit
The functional unit is 1 GJ of energy, of combined heat and power.
Allocation method
This study has used economic allocation as the method for analysis. The reject kiwifruit are assumed to have an economic value of $10/tonne. Based on economic value,impacts and costs associated with growing costs have an allocation of only 0.08% to the reject kiwifruit.
Reject fruit from the horticultural Rejectindustry is a potential feedstock for biogas production using anaerobic erobic digestion (AD).
B I O E N E R G Y O P T I O N S F O R N E W Z E A L A N D
30

System boundary
The system boundary is shown in Figure 9.
Figure 9: System boundary of kiwifruit to biogas LCA
Growing PackingDigester
(Anaerobic)
Compost
Biogas storageEnergy
Key assumptions
Growing and packing
• 2420 MJ/tonne is embodied in kiwifruit on deliveryto the packhouse. Using above allocation theembodied energy allocated to the waste kiwifruit is9.9 MJ/tonne.
• Electricity use in packing is 263kWh per tonne andthe electricity allocated to waste kiwifruit comes to0.86 MJ/tonne.
• Packhouse size of 280m2 (excluding the refrigerated area) and a lifetime of 35 years.
• Embodied energy of 590MJ/m2.
• Costs based on construction costs of $1000/m2.
Transport
• Transport costs ($7.50 per tonne) were calculated onthe basis of an average distance of 25km between the pack houses and orchards, and the processing plant.
Biogas plant
• Anaerobic digester assumed to be located at a meat processing plant. The digester is assumed torun on a 50/50 mixture of meat processing wasteand reject kiwifruit for the six months of the yearkiwifruit is available. When reject kiwifruit is not available, it is assumed that some other greenwaste stream is used. As kiwifruit accounts for 25%of the feedstock, 25% of the total plant costs and production were attributed to kiwifruit.
• Cogeneration plant at meat processing plant iscapable of producing 500 kW of electricity and 400 kW of heat in the form of hot water.
• It is assumed the plant operates for 8000 hoursper annum.
Economics
• Total economic inputs per tonne of kiwifruit processed are $38.57.
Key impacts
Approximately 1 tonne of kiwifruit rejects (979kg) is required to produce 1000MJ of energy (596 MJ electricity and 404 MJ heat).
Economics
The main economic costs associated with producing 1000 MJ of energy from waste kiwifruit is from producing the waste kiwifruit ($10 per 1000 MJ), capital costs ($10 per 1000 MJ), transport from the packhouse ($7 per 1000 MJ) and operating and maintenance costs ($5 per 1000 MJ). Together these costs accountfor $32 of the $38 cost of producing 1000 MJ of heatand electricity.
The revenue stream from generating 1000 MJ of energy from the biogas plant is $28. Electricity (valued at 10cents/kWh) contributes $16.54, heat (valued at the costof natural gas used to generate the same amount of heat) is worth $4.04, and the compost from the plant contributes $7.52.
Energy balance
From an energy perspective there are benefi ts. The amount of primary energy required to produce the 596 MJ of electricity (output from 979kg of kiwifruit
Kiwifruit orchards typically produceKiwifruaround 23 tonnes of kiwifruit perhectare and output volumes currently account for 30% of total horticulturaculturalexports from the country.
Heat
B I O E N E R G Y O P T I O N S F O R N E W Z E A L A N D
31

waste) is 70 MJ. This primary energy input is almost allfossil fuel, attributed to inputs from capital, operating and maintenance, and transport, most of which useimported energy. This balance compares very favourablywith the energy requirements to produce the sameamount of electricity purchased from the national grid which is 1179 MJ, approximately 447 MJ of which is from fossil fuels.
Table 11 shows the energy return on investment for the anaerobic digester system, allocated between electricityand heat and for the system as a whole (which includesthe energy allocated to compost production). The energy return on investment is calculated as energy out/primary energy in.
Table 11: Energy return on investment for anaerobic digester
Energyin2 (MJ)
Energyout (MJ)
Energy out/energy in
Electricity (net) 71 596 8.4
Heat (net) 17 404 23.3
Whole system (excl. compost)
115 1000 8.7
Whole system (incl. compost)
88 1000 11.3
Greenhouse gas emissions
The greenhouse gas outputs are correspondingly higher for electricity from the grid (43 kgCO
2-e) compared to
electricity from biogas (5 kgCO2-e).
The energy required to generate 404 MJ of heat from the biogas operation (the output from 979kg of kiwifruit waste) requires just 17 MJ of primary energy comparedto 463 MJ if natural gas is used. Most of the 17 MJ isin capital, operating and maintenance, and transport, and is imported. The CO
2-e emissions for the biogas are
signifi cantly lower than natural gas (1 kgCO2-e compared
to 25 kgCO2-e).
Conclusions
Reject kiwifruit as a biomass resource for energy is small on a national scale.
The greenhouse gas benefi ts of converting rejectkiwifruit to combined heat and power through anaerobicdigestion are signifi cant, with the emissions from fruitderived energy being signifi cantly lower than those forthe current conventional energy sources. Electricityfrom fruit digestion has emission reductions of 89% compared to grid electricity, and heat from fruitdigestion has emission reductions of 96% compared toheat from natural gas.
While the economics are currently unattractive, this may change in the future as the cost of fossil fuels and gridelectricity rise.
There is a competing use for reject fruit as stock food, which currently drives the price of obtaining the material. It also means that there are no credits from avoided disposal costs.
The environmental impacts and economic viability are most sensitive to the cost of the reject kiwifruit, whichdetermines the how much of the growing impacts andcosts are allocated to the reject kiwifruit.
Reference
Forgie, V., Giltrap, D., and Andrew, R. Landcare Research 2008. Life Cycle Assessment of Producing Biogas from Waste Kiwifruit. Report prepared For Bioenergy Options for New Zealand Pathways analysis programme. (Referto CD).
2 The energy input is allocated between electricity, heat andcompost on an economic basis. For the “whole system” line all the energy (including that allocated to compost production) is included.
The greenhouse gas benefi ts of The converting reject kiwifruit to combined heat and power through anaerobicaerobicdigestion are signifi cant...
B I O E N E R G Y O P T I O N S F O R N E W Z E A L A N D
32

Life cycle analysis for effl uent to CHP via anaerobic digestion to biogasSummary
• Potential scale of resource: Nationally 5-6 PJ/annum consumerenergy from processing industry waste material and municipalbiosolids/animal manure to biogas.
• Energy balance: has an EROEI ratio of 7.2:1
• GHG emissions: >200% reduction in comparison usual land disposal and grid electricity
• Other environmental benefi ts: 80% reduction in waste
• Economics: economic at favourable sites
• Technology status: mature
Background
Anaerobic digestion (AD) is a mature technology thatcan yield energy from a wide range of organic waste streams. This biogas can then be used to generateheat and power through a gas motor and genset. Usingcurrent anaerobic digestion technology, New Zealand has the potential to produce about 5-6 PJ/annum consumer energy from processing industry waste material and municipal biosolids/animal manure to biogas.
The specifi c case chosen for this LCA was the anaerobictreatment of dissolved air fl otation (DAF) solids from alarge sheep and beef slaughtering plant (10,000 stock units per day) in New Zealand. This plant is assumed to produce 5.7 tonnes per day of DAF sludge at 9% total solids (TS).
Functional unit
Functional unit is 1 TJ (1 million MJ) of electricity.
System boundary
The physical boundaries for the high level LCA and digester system costing in this report are based on acomparison with a business as usual (BAU) scenario;where:
• The DAF sludge from the end of a DAF pipe of an existing wastewater treatment system is conveyed to a sludge hopper of an existing belt-press for dewatering.
• Dewatered sludge is transported from the sludgehopper to a site 10 km away for land disposal.
The LCA for the digestor facility considered here has thesystem boundaries:
• From the end of a DAF fl oat sludge pipe of theexisting wastewater treatment to the hopper for dewatered DAF sludge at the relocated belt-press aspart of the new digester facility.
• From a low pressure steam connection point at the meat processing plant.
• From a clean water connection point at the meatprocessing plant.
• To the end of the genset exhaust.
• To the end of a pipe delivering treated digester effl uent into the factory wastewater stream upstream or downstream of the existing wastewatertreatment DAF system.
• To a power connection point suitable for sale of electric power.
• To a hopper for dewatered digested DAF sludge tobe transported off site.
• From the sludge hopper, to a site (10 km distance) suitable for land disposal of the dewateredDAF sludge.
Only material and energy fl ows that contribute more than 5% of the total material and energy fl ows wereincluded in the life cycle inventory for this LCA and cost analysis.
B I O E N E R G Y O P T I O N S F O R N E W Z E A L A N D
33

Allocation method
There are no co-products in this system so all impactsare allocated to the electricity produced.
Key assumptions
DAF sludge composition
• The feedstock chemical composition assumed in this work, based on general industry experience, is presented in Table 12. This chemical compositionimplies good degradability of the DAF sludge.
Table 12: DAF sludge material composition
Component Result Unit
pH 4.9 - 5.5 -
Ammonia-N 70 - 130 mg/kg
Nitrate-N <10 mg/kg
Total Kjeldahl Nitrogen 4400 mg/kg(wet)
Total Phosphorus 370 mg/kg
Total Solids 90 g/kg
Oil and Grease 27 g/L
Calcium 0.3 g/kg
Magnesium 0.05 g/kg
Potassium 0.05-0.09 g/kg
Sodium 0.3 g/kg
Sulphur 0.7 g/kg
Digestor facility
• Facility processes 5.7 tonnes per day of DAF sludge at 9 % total solids (TS).
• This produces 2,724 kg of methane per day.
• Biogas calorifi c value 50.7 MJ/kg.
• 8 month season.
Biogas genset
• Electrical conversion effi ciency: 35%.
• Generator set (genset) cooling loop has a thermal heat output of 110% of electrical output (at 90oC).
• Heat output is fed back into digestor and is notavailable for export from the system.
Digester facility energy load
• The total electrical loads for the digester facilities are assumed to be 13% of the gross produced electricity.
• The maximum electrical load for digester, belt press and stripper is 150 kW.
• The thermal load of the digestor facility is assume to have a peak of 0.55 MW (which includes 0.4 MW for the thermal stripper and 0.15 MW for digestor heat).
Effl uent discharge
• 80% of incoming Kjeldahl-N in DAF sludge becomesAmmonia-N.
• Thermal stripper is sized to remove up to 200 kg/day Ammonia-N from the digester effl uent to meet adischarge limit of 50 g/m3 Ammonia-N and a targetof 30 g per m3.
Additional energy savings compared to BAU
• The transport energy saving from avoided DAF sludge disposal is 0.51 TJ/annum.
• The dewatering energy saving through DAF sludgedigestion is 0.037 TJ/annum.
Economics
• All economic costs are based on costs in 2006.
• Analysis based on an electricity price of 15 c/kWh.
Key impacts
Greenhouse gas emissions and other environmentalimpacts
The main air emissions from a DAF sludge digester facility are: Methane, CO
2, CO, NOx, N
2O and SO
2.
The emissions from land disposal of dewatered sludgeare reduced by the dewatering. GHG emissions from disposal of DAF sludge materials from the digestor areestimated to be less than 1/5th of the emissions of the BAU scenario with DAF sludge materials at 9% TS.
For simplicity it is assumed that GHG emissions from dewatered digested DAF sludge are reduced pro-rata with the achieved TS destruction in the anaerobicdigestion. This results in direct GHG emission reductions of at least 80%. Similarly, reduction in the volume of sludge after digestion is assumed to reduce thetransport-related GHG emission by 80%.
Avoided GHG emissions credited from production ofrenewable electricity in New Zealand were estimatedas 0.6 kg CO
2-e/kWh produced. After subtraction of
parasitic electricity used for running the digester plant, the digester facility produces a net result of avoided GHG emissions of 2310 t CO
2-equivalent per annum. If all GHG
reductions are attributed to the exported electricity,this corresponds to a greater than 200% reduction in greenhouse gasses compared to grid electricity and BAU.
B I O E N E R G Y O P T I O N S F O R N E W Z E A L A N D
34

Effl uent nutrient content (BOD, TKN, ammonia-N) andfl ow are key regulatory parameters for the consenting of new industrial installations. Typically, treated discharge concentration of 10:10:10 (BOD, TKN, NH3-N)can be considered as an acceptable quality for discharge to river or marine outfall. The use of anaerobic digestion as described is expected to get the effl uent nutrient concentrations down to these levels.
The second major environmental benefi t of the digesterplant is in the reduced daily volumes of dewateredsludge for fi nal disposal from 35 tonnes per day to7.4 tonnes per day (79%).
Economics
The technology presented here is already economicallyviable in New Zealand in selected favorable situations. Gross annual operating surplus fi gures between about500,000 $/annum and 950,000 $/annum at power prices of 15 c/kWh (depending on local situation) arecontrasted with construction costs of about 3-4 million NZ$/plant.
Energy Balance
The net electricity production from the digester facility is 6.26 TJ electricity/annum from a total
of 13,000 t/annum of DAF sludge. There is no netthermal energy usage or production (see above) as all genset heat is considered as non-saleable, low grade,surplus waste heat. The EROEI is therefore 7.2:1.
Conclusions
The total methane production potential from processingwaste, municipal waste and manure in New Zealand of 5-6 PJ biogas/annum is capable of producing up to630,000 MWh/annum of additional renewable electricityfrom waste. The DAF sludge digestion technology is directly transferable to the dairy processing sector. With both meat and dairy sectors combined this technology could supply 1 PJ of methane biofuel suffi cient toreplace 2% of the current national power productionfrom natural gas.
Anaerobic digestion presents signifi cant environmental benefi ts from avoided emissions from decomposingeffl uent and reduced waste.
Signifi cant technical knowledge gaps do not exist and the technology is suffi ciently mature to proceedto implementation in the New Zealand primaryprocessing sector.
Uptake could be accelerated by an attempt to identifyearly implementation sites and by the creation ofdemonstration facilities.
The anaerobic digestion of effl uents presented here is already economically viable in New Zealand in selected favorable situations.
Extending operation to 12 months would make thissystem more economically attractive. The economicfeasibility of a digester facility design can be improvedwith effl uent irrigation to land instead of “ammoniastripping and discharge to water course” (subject to land availability).
Reference
Thiele J 2008. High level Life cycle analysis Reportfor Anaerobic Digestion of DAF sludge from a meatprocessing plant. Report prepared For Bioenergy Options programme. (Refer to CD).
Thiele J 2008. Potential Assessment from Anaerobic Digestion (AD) of Municipal Biosolids and Effl uent and Dairy Factory, Meat Processing and Wool ProcessingWaste. Report prepared for Bioenergy Options forNew Zealand–Situation analysis.
B I O E N E R G Y O P T I O N S F O R N E W Z E A L A N D
35

Life cycle analysis of woody residues to consumer energyPotential scale: up to 3.372 million ha of forest producing up to 600 PJ p.a. of primary energy.
Energy balance, GHG emissions, other environmental benefi ts, economics, technology status:
Summary
CombustionHeat
Combustion CHP
Ethanol Gasifi cationHeat
Gasifi cation CHP
Gasifi cationBiodiesel
EROEI 7.5:1 4.9:1 3.5:1 5.6:1 4.0:1 3.9:1
Greenhouse gasreductions*
92% 94% 75% 90% 83% 83%
Cost ($/GJ) $15.60 $27.60 $59.40 $31.20 $42.00 $34.50
Technology status
Mature Mature Developing Developing Developing Developing
* Compared to heat from coal, electricity form the grid and fossil transport fuels
Background
The use of forest residues as a source of energy products is attractive because, as a by-product of forestry operations, forest residues do not use additional land. This is important where land competition is present between (for example) dairy, forestry, food crops or energy crops. It isestimated that a forest residue resource of 26PJ/annum is currently available in New Zealand.
Life Cycle Assessments (LCA) of six possible pathways to energy-related products from woodresidues. The six pathways analysed are listed in Table 13.
Table 13: Pathways to energy product production from forest residues
Pathway name Conversion technology End product(s)
Combustion Combustion Heat
Cogeneration Combustion Heat and electricity
Ethanol Enzymatic hydrolysis Ethanol
Gasifi cation – combustion Gasifi cation Heat
Gasifi cation – cogeneration Gasifi cation Heat and electricity
Gasifi cation – Fischer Tropsch Gasifi cation + Fischer Tropsch Biodiesel
System boundary
The analysis took into account all life cycle stages of the energy product life cycle, including forestry and forest residue processing, transport to hogger, hogging, and conversion to an energyproduct. The life cycle of the energy products is displayed in Figure 10. The processes in blue areall included in the system boundary. In this fi gure, ‘conversion’ represents the conversion of theforest residues into an energy product for each of the six pathways.
Included in the forestry life cycle stage are the processes for nursery production, site preparation, forest establishment, forest management and harvesting.
Emissions and impacts associated with the use of the energy product have not been considered, except that the future combustion of ethanol and biodiesel is assumed to release all carbon storedin the fuel.
B I O E N E R G Y O P T I O N S F O R N E W Z E A L A N D
36

Outputs of forestry that do not contribute to the production of the energy products (i.e. industrial wood, saw logs and pruned logs) are excluded from the analysis.
Figure 10: System boundary of forest residue conversion
Industrial wood, saw
logs, prunedlogs
Residueproduction
Transport toHogger
Hogger ConversionUse of energy
productForestry
System Boundary
Functional unit
The functional unit of each pathway is 1 gigajoule (GJ) of energy in the energy product. As each pathway produces a different energy product or products, the functional unit for each pathwayis different. The energy product for each pathway is listed in Table 14.
Table 14: Form of energy for each forest residue pathway
Pathway name Energy product(s) Notes
Combustion Heat Combustion has effi ciency of 60%
Cogeneration Heat and electricityCombustion has effi ciency of 60% steam production
Ethanol Ethanol Effi ciency of ethanol production is 42%
Gasifi cation – combustion Heat Gas Combustion has effi ciency of 85%
Gasifi cation – cogeneration Heat and electricity Combustion has effi ciency of 60%
Gasifi cation – Fischer Tropsch
Biodiesel Fischer-Tropsch has effi ciency of 59%
Allocation method
Allocation has been done on a mass basis for theoutputs of forestry. All outputs therefore have a share of the total impacts of the process proportional to theircontribution by mass.
Key assumptions
Resource
• Forest residues from pine are produced as a by-product of forestry operations.
• Landing residues are gathered, loaded onto a truckand taken to a diesel hogger. The comminuted residues are then reloaded onto a truck and taken to an energy conversion facility.
• Cutover residues are baled, loaded onto a truck and taken to an electric chipper/hogger located at the energy conversion facility. The residues are chipped/hogged and are then ready for conversion.
• Moisture content of the forest residues was assumedto be 53% (wet basis), and the wood was assumedto have a net calorifi c value of 7.6 MJ/kg. The modelling is sensitive to this assumption.
• The embodied energy and greenhouse gas emissions of infrastructure has not been included.
• The quantities and assumptions used for forest residue processing are shown in Tables 15 and 16.
B I O E N E R G Y O P T I O N S F O R N E W Z E A L A N D
37

Table 15: Forest residue inventory data, per tonne of forestresidues
Forestresidue
processing Input Quantity Comment
Residue wood
1000kg
Gathering Diesel 9.8E-2kgFor landingresidues
Baling Diesel 1.10kgFor cutoverresidues
ResidueExtraction
Diesel 0.81kgFor cutoverresidues
Transport
• After hogging, the landing residues are loaded onto a truck, and then transported an assumed distance of 75km to the conversion facility.
• Loading of residues onto the truck requires0.27litres of diesel per tonne of residues, for bothlanding and cutover residues.
• The transport of the residues 75km to the conversion facility requires 3.92litres of diesel pertonne of residues (21 tonne payload).
Table 16: Hogger inventory data, per tonne of forest residues
Hogger Input Quantity Comment
Diesel Hogger
Wood 250kgLandingresidues
Diesel 0.054kg Loading
Diesel 0.37kg Hogging
ElectricHogger
Wood 750kgCutover residues
Diesel 0.027 kg Loading
Electricity 10.5MJ
Source: Hogging data provided by Scion. Emissions data based on
‘universal tractor’ in GaBi 4.2
Pathway of conversion
Plant – combustion and ethanol
• Reliable infrastructure data was not available forsome of the energy conversion processes and hashence been excluded from all conversion pathwaysin order to retain consistency.
• The combustion plant is assumed to have acombustion effi ciency of 60%. In CHP applications an additional loss occurs in converting the steam to electricity, resulting in a net effi ciency of 42%.
• The quantities of wood, water and electricity used toproduce 1GJ of heat were:
- Wood 219kg
- Electricity 12.6MJ
- Water 105kg
• The cogeneration analysis assumed a fl uidised bed biomass combustion plant used to produce 40MW of steam which is converted into 20MW process heat and 7.5MW of electricity.
• The quantities of wood, water and electricity used toproduce 1GJ of heat and electricity were:
- Wood 315.6kg
- Electricity 23.6MJ
- Water 404kg
• The ethanol production plant produces 1kg of ethanol for every 8.4kg of forest residues. This equates to an effi ciency of ethanol production on an energy basis of 42%.
• Ethanol production has a by-product of lignin from the wood. This lignin is burned to provide energy for the ethanol distilation process.
Plant-gasifi cation
• The following three pathways involve gasifi cation of wood residues to produce syn-gas, followed by the production of an energy product(s) from the syn-gas(heat, heat and electricity, and biodiesel).
• All three pathways involve the drying of forestresidues, and the gasifi cation of the dried wood.The drying takes the wood residues from a moisturecontent of 53% (wet basis) to 11%.
• The dryer heat is fuelled by undried forest residuesand requires 2.4GJ of energy from the residues to produce one dried cubic metre of residues. The driedresidues have a net calorifi c value of 16.7MJ. The dryer also requires 18 MJ of electricity to produce1000kg of dried residues.
• The gasifi er is assumed to be a bubbling fl uidisedbed gasifi er operating at atmospheric pressure, with a 60% effi ciency of syn-gas production.
• The quantities used to model the furnace andgasifi cation are shown in Table 17.
• The gas combustor has an assumed effi ciency of 85% and is carbon neutral.
B I O E N E R G Y O P T I O N S F O R N E W Z E A L A N D
38

Table 17: Furnace and gasifi cation inventory data per 1GJ ofsyn-gas produced
Scenario Input Quantity
Furnace
Forest residues to be dried 180kg
Forest residues as fuel 31kg
Electricity 1.8MJ
Gasifi cationDried forest residues 100kg
Electricity 16MJ
• Cogeneration is assumed to be carbon neutral andhas an electricity production effi ciency of 33%.
• The gasifi er is assumed to be a bubbling fl uidised bed gasifi er operating at atmospheric pressure. The Fischer-Tropsch biodiesel production is assumed to becarbon neutral, with an effi ciency of 59%. 1695 MJ ofsyn-gas are required to produce 1GJ of bio-diesel.
Table 18: Costs of forest residue life cycle stages
Life cyclestage
Cost Explanation
Forestry Free
Forest residues areassumed to be a waste product of forestry operations
Residueproduction
$24/tonne
Includes baling,transport to roadside,and loading on to transport
Hogger $9/tonne
Comminutes large pieces of biomass intoa feedstock suitable forprocessing
Transport $0.27 / t/km
Per Tonne kilometre rate is multiplied by transport distance(75km)
Table 19: Costs of conversion processes
Conversionprocess
Cost Explanation
Combustion $3.94/GJIncludes capitalexpenditure, operationand maintenance
Cogeneration $10.76/GJIncludes capitalexpenditure, operationand maintenance
Ethanol $42.8/GJIncludes capitalexpenditure, operationand maintenance
Gasifi cation $14.08/GJIncludes capitalexpenditure andoperating costs
Combustion fromgasifi cation
$3.87/GJ *Includes capitalexpenditure, operationand maintenance
Cogeneration fromgasifi cation
$9.13/GJ *Includes capitalexpenditure, operationand maintenance
Fischer-Tropsch fromgasifi cation
$1.3/GJ *Includes capitalexpenditure, operationand maintenance
* Additional to the $14.08 of the initial gasifi cation process.
Costs
The cost assumptions used in these LCAs are presentedin Table 18 (residue production and delivery) and Table 19 (conversion processes).
Ethanol production has a by-productEthanoof lignin from the wood. This ligninis burned to provide energy for theor theethanol distilation process.
B I O E N E R G Y O P T I O N S F O R N E W Z E A L A N D
39

Key impacts
Greenhouse gas emissions
In Figure 11 we can see that combustion to heat has the lowest greenhouse gas emissions and that ethanol has the highest.
These results compare with the equivalent fossil fuel values as follows:
95 kg-CO2-e from 1GJ of coal; 85 kg-CO2-e for 1GJ of petrol; 83 kg-CO2-e for 1GJ of diesel and; 43 kg-CO2-e for 1GJ of grid electricity. All pathways show signifi cant reductions in greenhouse gases.
Figure 11 - GHG emissions by conversion process
Combustion heat
Combustion CHP
Ethanol
Gasifi cation heat
Gasifi cation CHP
Gasifi cation biodiesel
25
20
15
10
5
0
kg-C
O2eq
uiv
/GJ
Conversion process
300
250
200
150
100
50
0
MJ
in/G
J o
ut
Conversion process
Combustion heat
Combustion CHP
Ethanol
Gasifi cation heat
Gasifi cation CHP
Gasifi cation biodiesel
7.5
4.9
3.5
5.6
4.0 3.9
Figure 12 - Energy Balance by conversion process
The EROEI fi gures are presented at the top of each column.
Economics
The higher inputs of the wood to ethanol conversion route are refl ected in the higher cost per GJ of the ethanol (Figure 13)
Energy balance
The energy return on energy invested (EROEI) is best for combustion (Figure 12) and worst forethanol production. Whilst the effi ciency of the wood to energy conversion effi ciency of the ethanol route is slightly higher than for gasifi cation to biodiesel (Fischer-Tropsch), it requires more externalenergy to get to the end product.
40
B I O E N E R G Y O P T I O N S F O R N E W Z E A L A N D

Figure 13 - Economics by conversion process
70
60
50
40
30
20
10
0
$ p
er G
J
Conversion process
Combustion heat
Combustion CHP
Ethanol
Gasifi cation heat
Gasifi cation CHP
Gasifi cation biodiesel
Conclusions
The six Life Cycle Assessments presented follow the production of 1 GJ of energy product from forest residues. As each pathway produces a differenttype of energy product, the results of the Life CycleAssessments are not directly comparable. However,inferences have been made in this section forthe purpose of interpreting the results and aiding decision making.
The combustion of forest residues to produce heat isthe most economic pathway to produce 1 GJ of energy product. Combustion also requires the least amountof non-biomass embodied energy, and has the lowestgreenhouse gas emissions. Conversely, the production of ethanol from forest residues has the highestembodied energy, and greenhouse gas emissions.
Transportation and the conversion process have the highest contribution to the greenhouse gas emissions and to the embodied energy of all energy pathways.
The effi ciency of energy production signifi cantly affects the relative performance of each energy pathway. The energy required in the conversion process also affectsthe performance of each pathway, but to a lesser extent. The upstream processes that occur before the forestresidues are converted into energy have a greater embodied energy and greenhouse gas emissions than the energy conversion processes themselves. Therefore,a reduction in the amount of forest residues required to produce 1 GJ of energy product would reduce the larger part of the embodied energy and greenhouse gasemissions of the pathways.
B I O E N E R G Y O P T I O N S F O R N E W Z E A L A N D
41

Life cycle analysis of purpose-grown forest to consumer energy
Background
This section considers the products of the six energyproduct pathways, where the wood is sourced from a forest grown specifi cally for energy product production(see Table 13a above). Purpose-grown forest would allow for large scale energy production.
In this scenario, all the costs and environmental burdens of forestry are attributed to the wood used to make bioenergy, and all wood is hogged in an electric hogger/chipper located at the conversion facility.
The goal of this section of the study is to develop a Life Cycle Assessment profi le of the greenhouse gas emissions, embodied energy, and costs associatedwith the generation of energy product from purpose-grown forest. It also allows the comparison of costs and impacts of energy product production from purpose-grown forest with energy products from forest residues.
System boundary
The analysis took into account all life cycle stages of theenergy product life cycle, including forestry, transport tohogger, hogging, and conversion to an energy product.
The life cycle of the energy products is displayed inFigure 14. The processes in blue are all included in the system boundary. In this fi gure, ‘conversion’ representsthe conversion of the wood into an energy product for each of the six pathways.
Included in the forestry life cycle stage are thenursery, site preparation, forest establishment, forestmanagement and harvesting. Also included are material inputs, energy inputs, transport; and outputs as well asthe emissions related to energy use and production.
Embodied energy in capital equipment and infrastructure are excluded from energy and emissions calculations.
Fuel and electricity consumption, together with theirupstream process, were taken into account.
The forest residues were given a share of theenvironmental impact from forestry based on the mass of the residues. Outputs of forestry that do not contribute to the production of the energy products (i.e. industrial wood, saw logs and pruned logs) are excludedfrom the analysis.
Table 13a: Pathways to energy product production from purpose-grown forests
Pathway name Conversion technology End product(s)
Combustion Combustion Heat
Cogeneration Combustion Heat and electricity
Ethanol Enzymatic hydrolysis Ethanol
Gasifi cation – combustion Gasifi cation Heat
Gasifi cation – cogeneration Gasifi cation Heat and electricity
Gasifi cation – Fischer Tropsch Gasifi cation + Fischer Tropsch Biodiesel
Potential scale: current 26 PJ p.a. of primary energy, rising to 46 PJ p.a. by 2030
Energy balance, GHG emissions, other environmental benefi ts, economics, technology status:
Summary
CombustionHeat
CombustionCHP
Ethanol Gasifi cationHeat
Gasifi cation CHP
Gasifi cationBiodiesel
EROEI 10.9:1 6.9:1 4.5:1 7.7:1 5.5:1 5.4:1
Greenhouse gas reductions*
95% 91% 80% 93% 89% 89%
Cost ($/GJ) $34.50 $54.80 $86.60 $53.20 $72.60 $65.40
Technology status
Mature Mature Developing Developing Developing Developing
* Compared to heat from coal, electricity form the grid and fossil transport fuels
B I O E N E R G Y O P T I O N S F O R N E W Z E A L A N D
42

Functional unit
The results of the Life Cycle Assessments are presented for each energy product pathway in terms of 1 gigajoule (GJ) of energy in the energy product (the ‘functionalunit’). As each pathway produces a different energyproduct, the functional unit for each pathway is different.The energy product for each pathway is the same as for the forest residues, and these are listed in Table 13a.
Allocation method
No other wood products are produced in these pathways so all impacts are allocated to the energy products.
Key assumptions
Resource
• Harvested wood from forestry is loaded onto a truck and transported to an electric chipper/hogger located at the energy conversion facility. The wood is chipped/hogged and is then ready for conversion.
• Unlike forest residues, the wood from purpose-grown forest does not need to be gathered or baled. In addition, all wood is hogged in an electric hogger,which is more effi cient than the diesel hogger usedto hog landing forest residues.
• Moisture content of the wood from purpose-grownforest was assumed to be 53% (wet basis), and thewood was assumed to have a net calorifi c value of 7.6 MJ/kg. The modelling is sensitive to thisassumption.
• Forestry includes the processes: nursery production,site preparation, forest establishment, road construction, forest management, and harvesting. Harvesting and road construction contribute themajority of the energy inputs and greenhouse gas emissions.
Transport
• Harvested wood from forestry is loaded onto a truck and transported an assumed distance of 75km to anenergy conversion facility.
• Loading of wood onto the truck requires 0.26 litres of diesel per tonne of wood.
• The transport of the wood 75km to the conversion facility requires 2.9 litres of diesel per tonne of wood. The wood is assumed to be transported by a truck with a 27 tonne payload capacity.
Conversion
• The wood is comminuted in an electric chipper/hogger located at the conversion plant that requires 14 MJ of electricity per tonne of wood produced.
• The conversion processes were the same as thoseused for the forest residues analysis and arepresented in Table 13; previous section.
• All the carbon stored in the wood is assumed to bereleased during energy production and use. The netcarbon output of carbon storage and production/use is zero, as one process absorbs carbon from the environment and the others release it. The greenhouse gas emissions for the production/useof each conversion pathway has therefore beenset to zero. The greenhouse gas emissions forforestry observable in the results is caused by other processes occurring during the forestry life cycle.
Plant
• All plant assumptions are the same as for the previous section – forest residues.
Costs
• The assumed cost of each stage in the purpose-grown-forest energy production life cycle is detailed below (Table 20).
Table 20: Costs of purpose-grown forest life cycle stages
Life cycle stage
Cost Explanation
Forestry $134.7/ tonne
Includes all land,establishment,silviculture, roading and logging costs
Hogger $5/tonneThe electric hogger ismore cost effi cient than the diesel hogger
Transport $0.27 t/kmTransport distance of 75km is assumed
• The costs and effi ciencies of the conversion processes are the same as for forest residues (Table 19).
System Boundary
Forestry
Figure 14: System boundary of wood from purpose-grown forest conversion
Transport toHogger
ConversionUse of product
energy
B I O E N E R G Y O P T I O N S F O R N E W Z E A L A N D
43

Key impacts
Greenhouse gas emissions
In Figure 15 we can see that combustion to heat has the lowest greenhouse gas emissions and that ethanolhas the highest, similar to the impact of residue conversion in the previous section.
Figure 15 – GHG emissions by conversion process
250
200
150
100
50
0
MJ
per
GJ
Conversion process
Combustion heat
Combustion CHP
Ethanol
Gasifi ctation heat
Gasifi ctation CHP
Gasifi ctation biodiesel
11.0
6.9
4.5
7.8
5.5 5.4
18
16
14
12
10
8
6
4
2
0
skg
/CO
2 e
qu
iv/G
J
Conversion process
Combustion heat
Combustion CHP
Ethanol
Gasifi ctation heat
Gasifi ctation CHP
Gasifi ctation biodiesel
Combustion of wood from purpose-grown forest is over twice as expensive as combustion of wood from forest residues, over the life cycle from forestry to combustion. However, the embodied energy and greenhouse gas emissions of combustion from purpose-grown forest is reduced, due to the elimination ofthe forest residue production process, and the more effi cient hogger.
Ethanol from purpose-grown forest has a lower embodied energy and greenhouse gas emissions than ethanol from forest residues, but a higher cost due to the value of the wood from forestry.
In all purpose-grown forest pathways, transport and forestry production make a signifi cant contribution to the cost, embodied energy and greenhouse gas emissions of the pathway.
Energy balance
The energy return on energy invested (EROEI) is best for combustion (Figure 16) and worst for ethanol production, as in the previous section with forest residues. Whilst the wood to energy conversioneffi ciency of the ethanol route is slightly higher than for gasifi cation to biodiesel (Fischer-Tropsch), itrequires more external energy to get to the end product.
Figure 16 – Energy balance by conversion process
The EROEI fi gures are presented at the top of each column.
B I O E N E R G Y O P T I O N S F O R N E W Z E A L A N D
44

The pattern of results is the same for purpose grownforests as it is for forest residues (Figures 15 to 17),although the numbers differ. The costs are higherrefl ecting the additional cost of growing the resource.
Conclusions
Overall, the cost of producing energy from a purpose-grown forest is greater than for forest residues, but theembodied energy, (not including stored solar energy) and greenhouse gas emissions are smaller.
The greenhouse gas emissions and MJ per GJ are lower because the energy inputs to creating the resource arealso lower, due to a more effi cient supply chain being enabled with a large scale process. The production of
energy from a purpose-grown forest is more expensivethan from forest residues, as the cost of all forestry operations are now attributed to the wood, whereas inthe case of forest residues there was no economic value given to the residues.
As the energy and greenhouse gas emissions of forestry was allocated to the forest residues on a mass basis, there is no difference in the burdens of forestry in forestresidues and the purpose-grown forest.
In addition, no transport of wood within the forest isrequired for purpose-grown forest, whereas landingresidues must be transported to the diesel hoggerlocated within the forest in the forest residue pathways.
100
80
60
40
20
0
$ p
er G
J
Conversion process
Combustion heat
Combustion CHP
Ethanol
Gasifi cation heat
Gasifi cation CHP
Gasifi ctation biodiesel
Economics
As with forest residues, the higher inputs of the wood to ethanol conversion route are refl ected in the higher cost per GJ of the ethanol (Figure 17)
Figure 17 – Economics by conversion process
A number of general observations can be deduced fromthe LCA studies presented in this report:
Pathways with large EROEI generally correspondto large reductions in greenhouse gas emissions,demonstrating the signifi cant role of fossil fuels.
The greenhouse gas emissions from intensive farmingof energy crops are signifi cantly higher than fromplantation forestry, which limits their ability to reducegreenhouse gas emissions. For example the greenhousegas emissions from growing canola to produce 1GJ offuel are 19 kg CO
2-e, whereas to produce the equivalent
from forestry produces 6 kg CO2-e.
Greenhouse gas reductions from utilising wastematerial such as effl uent and agricultural waste are very signifi cant. This is due to the fact that little of thefarming emissions are attributed to the waste. There
are also additional benefi ts from avoided methaneemissions from decomposing waste.
In the case of the straw and wood pathways, the biomass supply chain, including harvesting, transportation and pre-processing makes a signifi cantcontribution to the GHG emissions.
Six energy production pathways from forestry-derived biomass (residues and purpose-grown) were analysed which used different energy conversion methods to produce different types of energy product (heat, electricity, ethanol and biodiesel).
Of the six pathways analysed, combustion to produceheat (of forest residues and/or wood from purpose-grown forests) is the most economical, requires the leastamount of energy input, and has the lowest greenhouse gas emissions. Conversely, production of ethanol has the largest embodied energy and greenhouse gas emissions.
Conclusions from detailed life cycle assessments
B I O E N E R G Y O P T I O N S F O R N E W Z E A L A N D
45

A key factor in the embodied energy and greenhousegas emissions is the effi ciency of the pathway. Thus,combustion is the most effi cient pathway (60% effi ciency), and gasifi cation – Fischer-Tropsch to liquidfuels is the least effi cient (35% effi ciency).
The effi ciency of the pathway determines the amount of wood required as an input. If less wood is required, thenthe embodied energy and greenhouse gas emissions associated with forestry, transportation, forest residueproduction and hogging are reduced. Research focussed on improving these effi ciencies is therefore a priority.
The comparison made in Figure 18 can be used to look at energy-used versus energy produced (Energy returnon energy invested or EROEI). This is important for liquid fuels in particular as they have lower effi cienciesthan combustion but their production can be driven by a high value end product. However, it is critical that the process is sustainable in terms of energy. For example, aprocess can produce liquid fuels at a ratio of four units out for every unit in. Then of the four produced, one canbe used in the system and three are available for export to the wider community.
The key cost difference between residues and purpose-grown forestry is that the costs of forestry are allocatedentirely to the wood used for energy production in the purpose-grown forest. Forestry in the forest residuesscenario has no cost, as the forest residues areconsidered a waste product of forestry.
The choice of pathway from resource to consumer energy needs to be made considering cost, scale, demand, energy return and environmental impact.Biomass-based renewables are all superior to fossil fuels in terms of greenhouse gas emissions. Deciding whichroute to take will be a complex decision based on themost effi cient means (least cost) of meeting demand,whilst maximising environmental benefi ts.
A focus on the productivity of the raw material wouldreduce the cost, as the primary productivity of theforest system greatly affects the cost of the raw material going into the conversion process.
Figure 17a: EROEI
18
16
14
12
10
8
6
4
2
0
PG Biomass
Residues
Wo
od
> C
om
bu
stio
n >
Hea
t
Wo
od
> C
om
bu
stio
n >
CH
P
Wo
od
> G
as >
Co
mb
ust
ion
Wo
od
> G
as >
CH
P
Wo
od
> G
as >
FT
Liq
uid
s
Can
ola
> B
iod
iese
l
Co
rn >
Eth
ano
l*
Str
aw >
Co
mb
ust
ion
> H
eat
Str
aw >
Co
mb
ust
ion
> C
HP
Effl
uen
t >
AD
> C
HP
En
erg
y o
ut
for
ener
gy
in
Wo
od
> E
nzy
mes
> E
than
ol
* Data from USDA Agricultural Economic Report No. 813
For the LCA on any given pathway, the system boundaries used can have a signifi cant effect on the environmental impacts and greenhouse gas emissions. A standardised approach for New Zealandwould assist in comparison of results.
B I O E N E R G Y O P T I O N S F O R N E W Z E A L A N D
46

BIOENERGY PATHWAYS
EVALUATION
B I OB I OOOOOOOOOOOOOOOOOOOOO E N EE N EE N EEEEEEE R G YR G O PO PO PO PO PO PPPPPPPPPPPPP T I OT I OT I OT I OT I OT I OTTTTTTTT N S S F O R N ENN W Z E A L A N DDDDDDN DDDDDDDDD
47

In a separate analysis by different authors, 22 biomass resource-to-consumer energy pathways were compared on the basis of economics; energy effi ciency; greenhouse gas emissions; technology status; and risks and benefi ts. Energy effi ciency is defi ned as theamount of energy retrieved from the amount of the raw biomass that was put into a process. Energy return on energy invested (EROEI) is the total amount of energy that goes into the pathway versus that which is generated from it.
Pathway selection was based upon numerous criteriaincluding stakeholder engagement feedback, resourcesize, conversion technologies applicable to the resources of signifi cance, and ability to provide liquidsfor engine use. For the latter, New Zealand is perceivedto have suffi cient energy resources such as renewable electricity, lignite, coal and gas, to provide its electricityand heat needs for the foreseeable future, but does not have ready options to contribute signifi cantly to reducing transport fuel imports. Hence it was deemedimportant to include biomass-to-liquid pathways. Biomass from residues and purpose-grown forestcould also make contributions to electricity and heat demands.
Two coal-based reference chains, based on the use oflignite, have also been provided for comparison with thebiomass energy pathways.
Some of the biomass energy pathways compared hadcomponents in them for which the technology involvedis still at a developmental stage. As such, there issome uncertainty with regard to future economics and process effi ciencies for these pathways. This variance was considered when making comparisons, and meansthat economic and other comparisons were made at a higher, more holistic level.
Pathways description
Table 21 provides a description of the selected pathways. Pathways 1 to 7 and 8 to 14 effectively repeat the same conversion technology, but the latter set of conversions(8 to 14) are applied to wood from a purpose-grown forest resource (PGF), as opposed to wood from residues streams (1 to 7).
B I O E N E R G Y O P T I O N S F O R N E W Z E A L A N D
48

Table 21: Pathway descriptions
Pathway Input (Resource) Process Outputs
1 Wood (Landing Residue) Wood is gathered from the landing site, hogged onsite and transported by truck a distance of 50km to a fl uidised bed biomass combustion plant and used to produce of process heat.
Process Heat
2 Wood (Landing Residue) As above but the wood is supplied to a combined heat and power plant and used to produce 20MW of process heat and additionalelectricity.
Process HeatElectricity
3 Wood (Landing Residue) Wood is gathered and transported the same as chains 1 and 2 but is then subject to enzymatic hydrolysis and fermentation to produce ethanol with electricity also produced as a by-product.
EthanolElectricity
4 Wood (Landing Residue) Wood gathered and transported as above but the wood is then gasifi ed to generate a synthesis gas which is subsequently burnedto produce process heat. The gasifi er is retro-fi tted to an existinggas fi red heat plant
Process Heat
5 Wood (Landing Residue) As for chain 4 but the syngas is burned in a gas turbine to produceelectricity with process heat produced as a by-product.
ElectricityProcess Heat
6 Wood (Landing Residue) As for chain 4 and 5 but the syngas is converted into diesel using aFischer Tropsch process with electricity as a by-product.
FT DieselElectricity
7 Wood (Landing Residue) Wood is gathered and transported the same as chain 1 but is then converted into a bio-oil by pyrolysis and the bio-oil is upgraded to hydrocarbon fuels by hydro-treatment.
PetrolDiesel
8 Wood (Purpose Grown Forests, (PGF))
Same as 1 but using PGF as feedstock. Process Heat
9 Wood (PGF) Same as 2 but using PGF as feedstock. Process HeatElectricity
10a Wood (PGF) Same as 3 but using PGF as feedstock. EthanolElectricity
10b Wood (PGF) Same as 10a but conversion to diesel, not ethanol. DieselElectricity
11 Wood (PGF) Same as 4 but using PGF as feedstock. Process Heat
12 Wood (PGF) Same as 5 but using PGF as feedstock. ElectricityProcess Heat
13 Wood (PGF) Same as 6 but using PGF as feedstock. FT DieselElectricity
14 Wood (PGF) Same as 7 but using PGF as feedstock. PetrolDiesel
15 Straw (AgriculturalResidue)
Same as 1 but using straw as a feedstock. Process Heat
16 Straw (AgriculturalResidue)
Same as 2 but using straw as a feedstock. Process HeatElectricity
17 Waste Vegetable Oil Waste vegetable oil is converted into biodiesel bytransesterifi cation.
Biodiesel
18 Tallow Render material from beef and lamb processing is rendered intotallow and then converted into biodiesel by transesterifi cation.
Biodiesel
19 Rapeseed Oil As for 17 but using rapeseed oil from a purpose grown energy crop. Biodiesel
20 Coal (Lignite) Same as 1 but using lignite as a feedstock. Process Heat
21 Coal (Lignite) Same as 6 but using lignite as a feedstock. FT Diesel
B I O E N E R G Y O P T I O N S F O R N E W Z E A L A N D
49

Results
Energy effi ciency
Table 22: Energy conversion effi ciency and outputs per 1 GJ of energy output.
Pathway Description Energy effi ciency
Heat (GJ)
Electricity(GJ)
Diesel(GJ)
Ethanol(GJ)
1 Wood to Heat 67% 0.7
2 Wood to CHP 46% 0.35 0.13
3 Wood to EtOH 41% 0.12 0.325
4 Wood-Gas-Heat 57% 0.60
5 Wood-Gas-CHP 47% 0.26 0.231
6 Wood to gas to FT** liquids 52% 0.186 0.41
7 Wood to Pyrolysis to LF*** 56% 0.013 0.46*
8 PGF to Heat 63% 0.7
9 PGF to CHP 43% 0.35 0.13
10a PGF to EtOH 43% 0.12 0.325
10b PGF to Biodiesel 43% 0.12 0.325
11 PGF-gas-heat 60% 0.60
12 PGF-gas-CHP 49% 0.26 0.23
13 PGF to gas to FT liquids 54% 0.186 0.413
14 PGF to Pyrolysis to LF 58% 0.13 0.46*
15 Straw to Heat 88% 0.9
16 Straw to CHP 61% 0.45 0.17
17 WVO to Biodiesel 84% 0.99
18 Tallow to Biodiesel 64% 0.73
19 Rapeseed to Biodiesel 69% 0.81
20 Coal to Heat 74% 0.75
21 Coal to gas to FT liquids 53% 0.186 0.43
* The output from pyrolysis is petrol but petrol and ethanol are valued the same in this analysis.
**FT = Fischer Tropsch
***Liquid Fuels
PGF = Purpose-grown forests
• The energy effi ciency of the pathway, defi ned as total energy outputs divided by total energy inputs,is shown in Table 22.
• Total energy inputs encompass: biomass resource inputs, transport fuels and additional energy inputsin the conversion process.
• The energy effi ciency of the pathways varies froma high of 88% for straw to heat through to a low of 41% for wood residues to ethanol.
• Energy effi ciency is an important indicator of effi cient resource use. However, effi ciency should not be viewed in isolation as there are many other drivers to the viability of a pathway. These driversinclude the scale of the resource, its physicallocation, local and national demand for different types of consumer energy, environmental impactand economics.
If the focus is less on electricity and more on liquid fuels, with niche opportunities for heat and distributedcombined heat and power (CHP) also being of interest,
B I O E N E R G Y O P T I O N S F O R N E W Z E A L A N D
50

there is a good argument for more detailed investigation of the pyrolysis to transport fuels pathway. Due to its effi ciency, pyrolysis appears to have some benefi tsin terms of producing liquid fuels in a New Zealandcontext. It is also an area where detailed informationis scarce or emerging due to its relative immaturity of development.
Greenhouse gas emissions
Table 23: Climate change emissions in CO2equivalence, kg per
1GJ of energy output.
DescriptionCO
2 equiv
emissionskg/GJ out
1 Wood to Heat 4.0
2 Wood to CHP 5.9
3 Wood to EtOH 8.5
4 Wood-Gas-Heat 4.7
5 Wood-Gas-CHP 5.7
6 Wood to FT 5.2
7 Wood to Pyrolysis 4.8
8 PGF to Heat 4.3
9 PGF to CHP 6.3
10a PGF to EtOH 8.1
10b PGF to Biodiesel 8.1
11 PGF-gas-heat 4.5
12 PGF-gas-CHP 5.5
13 PGF to FT 5.0
14 PGF to Pyrolysis 4.6
15 Straw to Heat 4.5
16 Straw to CHP 6.5
17 WVO to Biodiesel 7.4
18 Tallow to Biodiesel 42.8*
19 Rapeseed to Biodiesel 32.7**
20 Coal to Heat 128.1
21 Coal to FT 178.8
* This fi gure can vary substantially (12.8-55.8) depending on the
system boudary used.
** Variation due to LCA boundaries (27-51)
• Table 23 shows the greenhouse gas (GHG) emissions from the various pathways.
• GHG emissions are very similar for many of the biomass-to-consumer energy pathways.
• The combustion options have lower GHG emissionsdue to their greater effi ciency.
• Due to differences in demand, it is more appropriate to compare pathways that produce the same fi nalproduct.
- For the heat pathways the biomass is superiorto coal-to-heat pathway in GHG emissions by afactor of 35.
- In the case of liquid fuels, biomass chains are superior to the coal-to-FT liquids pathway (21).The biomass chains are superior by a factor 27. The greenhouse gas reductions for the liquidfuel pathways when used to replace petrol or diesel are shown in Figure 18.
The GHG profi le of the biomass chains, whilst superior to that of the coal pathways, is dependant on their owneffi ciencies, and these profi les could be improved byoptimising the biomass pathways for GHG emissions.
B I O E N E R G Y O P T I O N S F O R N E W Z E A L A N D
51

Figure 18: Liquid fuel options - percentage reduction in GHG emissions when used to replace petrol or diesel
100
50
0
-50
-100
-150
Ethanol from forest residues
Ethanol from purpose-grown forests
FT liquids from purpose-grown forests
Biodiesel from tallow
Biodiesel from canola
FT liquids from coal
(FT = Fischer-Tropsch synthesis)
Per
cen
tag
e re
du
ctio
n in
GH
G e
mis
sio
ns
B I OO E NE N E R G YR G O O P O I OT I O N SN S F OO RF O RO R N E W Z E A LA L A N DA N
Fischer Tropsch (FT) liquids from coal show an increase in emissions when compared to currentuse of fossil fuels (Figure 18).
Economics
Table 24 shows a summary of the potential profi t for each of the chains based on currentknowledge. These results should not be viewed in isolation. The waste vegetable oil chain is high value, but it is a small and limited resource. The chains which show high value are typicallythose that are associated with liquid fuels. The exceptions to this are the straw chains, but again this resource is limited both in scale and location, indicating that it has niche relevance, but not national signifi cance.
A more detailed treatment of economic of the Purpose-Grown Forest (PGF)-to-ethanol pathway is carried out in a later section.
52

Table 24: Cost, value and resulting profi t per 1GJ of energy output.
Pathway Description Cost Value perGJ Out
Profi t (loss)per GJ Out
1 Wood to Heat $6.76 $6.78 $0.33
2 Wood to CHP $11.74 $12.58 $ 1.39
3 Wood to EtOH $20.56 $31.66 $13.80
4 Wood-Gas-Heat $25.14 $6.73 -$18.05
5 Wood-Gas-CHP $30.06 $16.79 -$12.55
6 Wood to gas to FT $24.15 $21.05 $5.71
7 Wood to Pyrolysis to LF $13.09 $14.11 $1.79
8 PGF to Heat $32.40 $6.78 -$24.86
9 PGF to CHP $42.67 $12.58 -$28.63
10a PGF to EtOH $56.53 $31.66 -$23.79
10b PGF to Biodiesel $56.53 $31.66 -$23.79
11 PGF-gas-heat $50.35 $6.73 -$43.62
12 PGF-gas-CHP $61.24 $16.80 -$44.45
13 PGF to gas to FT $52.67 $26.06 -$23.91
14 PGF to Pyrolysis to LF $40.02 $14.11 -$25.66
15 Straw to Heat $5.77 $6.79 $1.17
16 Straw to CHP $9.75 $12.56 $3.02
17 WVO to Biodiesel $18.99 $24.95 $23.76
18 Tallow to Biodiesel $24.92 $24.97 $3.56
19 Rapeseed to Biodiesel $47.15 $25.00 -$16.93
20 Coal to Heat $6.88 $6.79 -
21 Coal to FT $23.62 $26.06 $5.68
Results indicate that the value of the fuels must be considered when deciding on which pathways to develop, as the value of the end product may not be directly infl uenced by the effi ciency of the process but by the willingness of society to pay more for energy in a particular form. This value is related to convenience of the product (electricity and switch on/off) and its ability to provide a service we desire (liquid fuels and relatively unconstrained personal mobility).
Energy pathway comparison and recommendations for the future
There are many factors to consider when comparing energy pathways with an aim of identifyingpreferred options. Focus to this point has been on what are expected to be the most signifi cant defi ning parameters of energy pathways in the future (and assuming, given time, that the practicalities or technical unknowns can be resolved), namely:
• energy effi ciency - as we expect to be resource-limited and require effi cient utilisation ofresources on offer;
• low emission of climate change-related gases - currently driven by social responsibilityand likely to be supported in the future by the way of emissions trading schemes or othertax regimes;
• economics - the pathways are required to be affordable compared to alternatives.
B I O E N E R G Y O P T I O N S F O R N E W Z E A L A N D
53

The comparison includes other factors such as:
• potential showstoppers - mainly concerningthe status of the technology and availabilityof feedstock;
• other risks – such as land and water use competition,scale of operation, etc;
• potential benefi ts.
The conclusions derived from the pathways evaluation are now considered together, across all the selectedpathways, with discussion collated under a number of subject headings.
The role of purpose-grown forests (PGF)
Of the selected bioenergy pathway options, onlypurpose-grown forests can provide a signifi cant changeto New Zealand’s current primary energy profi le.
However, this resource is not currently available and to be a signifi cant resource in the future will require considerable effort to: develop a national plan; identifyor develop appropriate plant species and hybrids; establish the plantations, and manage them. Becauseof the potential signifi cance of purpose-grown forestsin light of the apparent need for a large scale biomassresource, we feel this is priority research.
In contrast, residual woody biomass resources arelimited in scale to around 8 to 10% of primary energy or 23% of heat demand, or 8 to 10% of liquid fuel demand, or a mix of both. On the other hand, residual materialis available now and it is often very cheap to obtain. Its utilisation has environmental benefi ts (reduce green house gas emissions, reduced landfi ll volumes, reduced effl uent etc) and so the use of residual material shouldbe a priority. The cost of the residuals could rise asutilisation and competition for the resource occurs.
Utilisation of purpose-grown forests (PGF)
Wood from PGF is a reasonably costly energy feedstock and consequently the economics for use rely on takingPGF resources through to a high-value energy productsuch as liquid fuels for transport. When consideringexpected economics alone, there are four pathwaysconsidered here that appear reasonably attractivefor the future, all with similar-order economics. Thesepathways are:
• enzymic hydrolysis and conversion through toethanol (a pathway referred to here as the “enzymic pathway”);
• enzymic conversion through to biodiesel (another form of an “enzymic pathway);
• Fisher Tropsch conversion of PGF-derived syngas to liquid fuels (referred to here as the “FT pathway”);
• hydro-treating pyrolysis-derived bio-oils (referred tohere as the “pyrolysis pathway”).
Note that this list is not intended to be exclusive; there are a broad range of other conversion technologies that were not considered in this study. A close watch oninternational trends and advances is critical in the liquid fuels area.
Conversion technologies
The technology supporting these options is currently invarious forms of development. It is therefore diffi cult to identify which will become the preferred option in thefuture. There is signifi cant work being done overseas on a variety of conversion technologies, with an emphasison ligno-cellulosics to liquid fuels.
The gasifi cation pathway is the most advanced of thesein that commercial coal- or natural gas-to-liquids plants do currently exist (although only four in the world).Large-scale gasifi cation of biomass and the logisticssurrounding this has not been proven.
The enzymic pathway has characteristics that suggest it would offer improved economics over the gasifi cation pathway, but the technology is still in its infancy andtherefore this is far from certain in practice. The development of the enzymic pathway is expected to beextremely capital-intensive.
The pyrolysis pathway is in its infancy. Whilst the pathway chosen for the comparison analysis was specifi c, it represents a number of possible options that are being considered, including plantation-localisedbio-crude production and stabilisation (through simplehydrotreating) to make a bio-crude suitable for use as a feedstock for petrochemical refi neries. The pyrolysation and hydrotreating steps are expected to be moderately capital intensive and reliant on research from overseas.
Note that having a supply of low cost hydrogen will be a key to the hydrotreating component of the pyrolysation pathway. The Energyscape Hydrogen Options work (led by CRL Energy) has found that one of the preferredhydrogen production pathways uses biomass as the primary energy resource. There is opportunity tointegrate the two pathways, pyrolysis and hydrogen production, which has the potential to decrease the cost of supplying the hydrogen.
These normally large-scale pathways might be moreattractive if downscaling were an option. Thereis certainly an opportunity for downscaling in the case of pyrolysis and simple hydrotreating to makebiocrude for further refi ning. Research is required to understand what future plant sizes may be so that thisunderstanding can be used in the design of a national PGF model.
B I O E N E R G Y O P T I O N S F O R N E W Z E A L A N D
54

CHP offers a known-technology fallback option for utilising PGF feedstock, and also provides a small-scale option for use in transition periods when plantations are being established or before major fuel plants come on stream (although care would be required to avoidstranding CHP plant in the case of the latter).
Use of wood residue
The use of wood residue offers a low-cost feedstock, but is expected to be limited to small scale operations due tothe signifi cant increases in transport costs and logisticsrequired as plant size increases. Better economics could be gained through the use of improved collection and transport mechanisms and logistics.
Use of wood residues in boilers and in CHP offerssimple, small-scale utilisation of wood residue at similar economics to the use of lignite (which is generally a lower-cost coal option, compared with sub-bituminous coals). Specifi c local conditions could see improved economics for the use of wood residue, for example,where the transport costs for the wood residue areparticularly low and where wood waste is required to bedisposed of.
Including a gasifi cation step in the simple boiler orCHP plant pathway adds a cost that results in poor economics, even when using the syngas in existing gasfi red boilers. These gasifi cation options therefore do not appear economically viable.
The Fisher Tropsch, enzymic and pyrolysis pathways all exhibit attractive economics for the use of wood residue. However, these types of technology areexpected to require large plant to be economic, at leastin the short to medium term. The use of wood residues alone is not expected to meet the demand required forlarge plant (or otherwise requires transport of feedstockfrom a very wide area, which is unlikely to be economic in all but a few locations in the Central North Island).Hence these pathways are not believed to be options for the use of wood residues unless wood residues are used for co-fi ring.
Straw
The results suggest that the use of straw provides slightly improved economics over the use of woodresidue in simple boiler and CHP applications, and hence is an attractive option should the resource be availablelocally (to keep transportation costs low) and insuffi cient quantity. One of the reasons for the improved economics stems from the improved effi ciency of thecombustion of straw over that for wood waste, due mainly to the lower moisture content of straw.
Biodiesel options
The production of biodiesel from used cooking oil andtallow appears economic on small scale. Although the resource is limited, demand for feedstock from other sectors high, and price for the feedstock is increasing.
Based upon the results of the analysis, the production of biodiesel from oil rapeseed (canola) currently appears economic, with economic breakeven with fossil diesel achieved at a price of around US$135/bbl. There are currently plans to begin production of biodiesel from oil rapeseed grown in New Zealand.
The planned development involves production of around 70 million litres of biodiesel per year. This is around 20-times the production we expect to beobtained nationally from used cooking oil and tallow-based biodiesel manufacture, and hence represents a signifi cant increase in volume (although still small compared to the current national consumption of fossil diesel at around 3,000 million litres per year).It is uncertain how land-use and water-use issuesmight restrict further biodiesel production from oil rapeseed cropped in New Zealand and this could be anarea of research. However, it is clear that large scale production of vegetable oil from crops will lead to landuse competition with food crops as the same land is required for both, and it is in limited supply.
Sensitivity to a carbon-based charge
All bioenergy pathways exhibit improvements in economics relative to their fossil fuel alternatives with increasing carbon charge. The options exhibitingparticular improvement are those involving theproduction of heat, in comparison to coal.
Conclusions
The wider EnergyScape project has identifi ed a need to focus on developing renewable alternatives to importedfossil-derived transportation fuels as an important component of New Zealand’s future.
Large scale resources
Of the pathways considered, only those based on the purpose-grown forest resource have suffi cient scale to impact New Zealand’s current primary energy profi le. Analysis has shown that production of liquid fuels from this resource can have a signifi cant impact on reducing GHG emissions compared to petrol and diesel, and in particular to the coal-to-FT liquids option. This option is currently not yet viable economically, but shouldbe viewed in light of rapidly increasing oil prices and broader economic implications of developing a national biofuels industry.
B I O E N E R G Y O P T I O N S F O R N E W Z E A L A N D
55

B I O E N E R G Y O P T I O N S F O R N E W Z E A L A N D
Residual woody biomass resources,Residalthough of limited in scale, are thenext largest biomass opportunity. This material is available now and it is often very cheap to obtain.ain.
56
A purpose grown forest resource does not presently exist. Priority for research should be the development ofan implementation programme for early establishment of plantations leading to:
• detailed analysis on land availability, its productivity,species options (current and future), current use, land use change impacts, water yield and waterquality, erosion etc.;
• downscaling conversion technologies without signifi cant increase in cost. This represents an important opportunity as biomass resources are geographically distributed, e.g. making biocrude through pyrolysis.
Currently available resources
Residual woody biomass resources, although of limitedscale, are the next largest biomass opportunity. This material is available now and it is often cheap to obtain. Its utilisation has environmental benefi ts (reduced greenhouse gas emissions, reduced landfi ll volumes,reduced effl uent etc).
Biodiesel derived from canola offers the next-most signifi cant potential resource. With the recent increasein oil price, it is believed that the economics for thispathway are now becoming viable.
The remaining bioenergy pathway options analysedconcern feedstocks of relatively small annual quantities,which limited their application. The most economicoptions were the simple, small scale heat and CHPp papplications. These were attractive options today,
compared to the use of coal, with the likelihood that the economics could be improved upon further by local niche opportunities.
Reference
Andrew Campbell1, Murray McCurdy2 and Garth Williamson2. CRL Energy 2008: Bioenergy PathwayAnalysis: Comparison of Cost, Energy Balance and GHGEmissions of Selected Biomass to Energy Productionchains. 1Fuel Technology Limited, 2CRL Energy Limited. Report prepared for the Bioenergy Options for New Zealand – Pathways Analysis Project.

ECONOMICS OF W
OOD-TO-LIQUID FUEL
B I O E N E R G Y O P T I O N S F O R N E W Z E A L A N D
57

For New Zealand, plantation forests, purpose-grown for energy, or a mix of timber and energy, may offer solutions for energy security and environmental benefi ts.
Wood can be used for low and high grade heat, and to some extent to make electricity in co-generation facilities. Currently wood is mainly used to make heat (8 PJ per annum of domestic heat, 45 PJ per annum of industrial heat and about 75 MW or 2.3 PJ of electricity).
Wood can also be used to make liquid fuels througha variety of conversion processes. In addition, it isphysically and technically possible for New Zealandto grow large quantities of energy in forests on steep terrain and for this material to make a signifi cantcontribution to our liquid fuel demand (BioenergyOptions for New Zealand – Situation analysis). Due to this potential, it is important to investigate theeconomics of this opportunity in detail.
At the time of writing (July 2008) the followingparameters were used to evaluate the economics of theprice of petrol versus liquid fuels from biomass sources: US exchange rate = ~0.77; oil at US $130+ a barrel (bbl); pump price of petrol $2.18, Carbon price $21/t ofCO
2-equivalent; ethanol ~$1.40 litre (NZ manufacture
from residual softwoods, 2007 estimate), and; biofuels (ethanol) are not subject to excise tax.
Producing ethanol only
Feasibility studies have determined that a 90 Ml perannum bioethanol plant located in the Central North
Island could produce ethanol at approximately ~$1.40per litre utilising available woody biomass residues. Given the differences in calorifi c value (petrol is 33.2MJ/l, ethanol is 22.4 MJ/l) this equates to $1.98 per litre petrol equivalent or $2.25 per litre including GST. These estimates assumed currently available technology, growing practices and effi ciencies, and do not include areturn from co-products.
The biomass residue feedstocks for this plant wereassumed to have a delivered cost of $37 per tonne.Wood from purpose-grown forest will cost more thanresidues, and the delivered raw material cost would likely be in the order of $100 per tonne (increase of $63 pertonne). This could add at least $0.45 per litre to the costof the ethanol, or $0.67 per litre of petrol equivalent.
Ethanol made from purpose-grown forest is estimatedto be $2.08, or $2.97 per litre of petrol equivalent. In comparison, at time of writing (July 2008) the cost ofpetrol was ~$2.18 per litre at the pump. The petrol price less excise tax of $0.45 (plus GST on excise) is $1.62.
For ethanol from purpose-grown forests to becompetitive with petrol, petrol prices would have to riseto ~$3/litre at the pump. Alternatively production costs would need to decrease.
B I O E N E R G Y O P T I O N S F O R N E W Z E A L A N D
58

Table 25 – Price of oil (US$/bbl) that would make liquid biofuels viable, by carbon price and exchange rate (NZ$: US$)
Foreign exchange rate, NZ to US dollars
0.8 0.7 0.6
Carbon tax $20 tCO2eq Residual US$145/bbl US$127/bbl US$109/bbl
Carbon tax $20 tCO2eq Purpose-grown US$211/bbl US$185/bbl US$159/bbl
Carbon tax $30 tCO2eq Residual US$143/bbl US$125/bbl US$107/bbl
Carbon tax $30 tCO2eq Purpose-grown US$208/bbl US$183/bbl US$157/bbl
Future petrol prices
Key infl uences on future petrol prices were considered:cost of carbon ($tCO
2 equivalent); cost of oil ($US
barrel); and NZ$ versus US$ exchange rate. A summary of these infl uences is shown in Table 25, which shows the price of oil that would enable ethanol from wood(from both residual or purpose-grown sources) tocompete directly on a $ per unit of energy basis.
The cost of oil is likely to rise and an estimate of thetrend for the future price of oil was made based on the prices from 2002 to 2008. The rationale for using 2002as the start point is that that was the nearest historiclow, from which point prices have trended up. A straightline trend was used. Using this trend prices would be:2030 = US $348 bbl, 2050 = US $586 bbl.
If prices rise even close to these predictions, then fuelfrom purpose-grown forests would be economically viable by 2020. These prices should be consideredbearing in mind that oil has increased fi ve-fold in cost in the past six years, from US$21 barrel in 2002 to $US$130+ in 2008, a rise of around US$110 per barrel.
Carbon tax/coal and gas cost
A driver for the use of forestry, or any, biomass forfuel will be the cost of carbon emissions. If and when a carbon tax is initiated, the cost of CO
2 emissions will be
added to the cost of fossil fuels, but not to renewablebiomass fuels (which are deemed carbon neutral).
The cost of carbon is likely to be in the order of $15 to $30 per tonne ofCO
2-equivalent. This would increase
the cost of petrol by 3.5 to 7.0 cents per litre, dependingon the level of carbon cost applied. This will not be suffi cient on its own to have a major infl uence on the price of petrol, the impact being just a few percent (2 to 4). However, the impact on the price of coal could besubstantial, with even a low cost of carbon ($15) havingthe effect of driving up coal prices to industrial users by20 to 45%. Higher carbon costs will have an even moredramatic effect. It is highly likely that this will drive increased use of woody residues from all sources as fuel for industrial heat.
Forest residues
At today’s prices, purpose-grown biomass for energy cannot compete economically with fossil fuels for heator transport fuels. However, residual biomass can,and does, compete with coal and gas for heat. Large volumes of residual woody biomass are used for heat on both a large and small scale with around 4.0 million tonnes per annum (53 PJ) of woody biomass used in domestic, commercial and industrial sites.
The majority of this is wood processing residues usedas industrial heat fuels at wood processing sites. This material is derived from a log harvest of 19.3 million tonnes, and the volume will increase over the next 20 years as the harvestable volume rises.
Emerging trends
The future is hard to predict but the assumptions behind the strategy presented in the Bioenergy Options – Situation Analysis report are:
• oil supply will be constrained and the price will rise(peak oil, increasing international and domestic demand for liquid fuels, possible internationalcrises);
• the cost of coal will rise substantially, by at least 23% or more, the cost of gas will rise (at least 6%),the cost of liquid fuels will rise (by at least 4 to 5cents per litre, around 2 to 3%) driven by the cost of carbon at $15 per tonne (ETS)
Future scenarios for technological advances
In the future it is likely that:
• forest growth will be more productive due to improved genetics, forest management andregime changes;
• log harvest and log transport will be more effi cient through innovation and improved transport infrastructure;
• biomass-to-liquid fuel conversion will be moreproductive and effi cient due to technologicaladvances.
B I O E N E R G Y O P T I O N S F O R N E W Z E A L A N D
59

Table 26 presents some scenarios of improved growth and harvest effi ciency, and the impact of theseon the cost of liquid fuels from purpose-grown forest.
Table 26 - Cost of producing liquid fuel (ethanol) from purpose-grown forest with different growth rates andregimes (includes conversion costs – wood to ethanol)
23 23+ 23++ 18 18+ 18++
Volume m3 600 950 950 400 730 730
Grow $/m3 $49.50 $31.25 $31.25 $58.90 $32.25 $32.25
Log $m3 $36.00 $36.00 $30.00 $36.00 $36.00 $30.00
Transport $m3 $10.50 $10.50 $8.50 $10.50 $10.50 $8.50
Total $m3 $96.00 $77.75 $69.75 $105.40 $78.75 $68.75
$ l-peqv $3.00 $2.81 $2.73 $3.13 $2.84 $2.74
Notes: + = large future gains in growth and yield volumes from genetics and regime changes
++ = 20% future gain in logging and transport effi ciency
The table above shows that growth gains combined with a 20% reduction in logging and harvesting costs canreduce the cost in $ per litre of petrol equivalent (l-peqv)to approximately $2.75. At current foreign exchangerates this is the equivalent to oil at US$190 a barrel. If the exchange rate moved back to US$0.60, it would bethe equivalent of US$150 a barrel.
Production of both solid wood and ethanol
An alternative scenario to consider is the situationwhere some of the forest harvest is used for energy andsome goes to high value timber uses (Appendix III). This is similar to the current situation where a proportion of the crop is sold at low prices to pulp and panel mills.
If we assumed that 50% of the crop sold for an average of $130/m3 as saw logs and 50% of the crop went asenergy feed stock at $65 per m3, then the forest grower would get $97.50 on average per m3. The cost of theenergy feedstock would subsequently be reduced. In thiscase the ethanol could be produced for an estimated $2.67 per l-pqev (equivalent to oil at $180 to $140 US per barrel, depending on exchange rate).
Production of multiple products
In addition, research and development on the concept of a biorefi nery is receiving considerable interestinternationally. A biorefi nery co-produces fuels and high-value products in the same production facility(similar to an oil refi nery). Revenue streams from the co-products are anticipated to have a signifi cant impact onthe economic viability of producing fuels from forests.
Key points
Assuming current forest productivity and conversioneffi ciencies, oil prices would have to approach US$210a barrel (currently US$130+ a barrel, July 2008) forethanol from purpose-grown forests to be feasible. Given the current trends in oil price this is likely to occur
before 2020. Carbon taxes are likely to have only a small effect on these prices.
Realistic future improvements in forest yields andharvesting and transport effi ciency could reducethe breakeven cost of oil. This does not includeimprovements in the cost of conversion per litre of ethanol due to improved conversion effi ciencies. Given the intense international research in this area, this is likely to be an area of signifi cant improvement.
A more promising (and therefore more likely) scenariois for forests to produce timber as well as energy feedstocks. Under this scenario, the breakeven cost of oil would be US$180 per barrel. In addition, the co-production of high-value chemicals in the conversion ofwood to biofuels is likely to have a signifi cant impact on the economics in the future.
The above costs assume a US$0.8=NZ$1 exchange rate and the removal of the excise tax from biofuels.These assumptions have a signifi cant impact on costs. If the New Zealand dollar falls against the US dollar the effective cost of oil rises, and the breakeven price for ethanol production drops.
During the course of the study the price of oil varied substantially. In October 2007 oil was as low as US$77 per barrel and peaked at US$147 in July 2008. It has since dropped back to US$114 (August 2008). Suchvolatility in the price and demand for oil is likely toremain over the long term and will always affect the economic viability of biofuels, but is by no means thesole reason for its implementation. In New Zealand, sustainability drivers remain a key reason for developing a national solution for biofuel production.
Reference
Hall P and Turner J. Scion 2008. Economics of purpose grown forests for liquid biofuels. Report prepared for the Bioenergy Options form New Zealand - PathwaysAnalysis Project.
60
B I O E N E R G Y O P T I O N S F O R N E W Z E A L A N D

CONCLUSIONSB I O E N E R G Y O P T I O N S F O R N E W Z E A L A N D
61

The economic well-being of the developed world hasbeen derived from cheap and plentiful fossil fuels. Manykey industries including agriculture and manufacturing are dependent on these fuels. New Zealand’s relativedependence on fossil fuels is illustrated by our third placing in oil consumption per GDP. Modern society’sreliance on fossil fuels for energy is being threatened by the twin pressures of resource depletion (such as peakoil), and climate change.
How individual countries respond to these global challenges is likely to defi ne their future over the next few decades and probably throughout the restof this century.
In response to the 1973 oil crisis, the Brazilian government initiated a nationwide programme of biofuel substitution of oil in order to promote self-suffi ciency.They chose the bioenergy pathway based on an existingindustry and a source that most suited their climatic conditions: sugar cane to ethanol. Now bioethanolmakes up 17% (17 billon litres) of Brazil’s transportationfuel usage. Nearly every fuelling station in Brazil offers
a choice of either a 25% ethanol/petrol blend or pureethanol. Sales of fl exi-fuel vehicles that can run on anyblend of ethanol make up two-thirds of new vehiclesales. Most of Brazil’s fl exi-fuel cars can now run up to 100% ethanol, with a small gasoline tank used to startthe car during cold mornings.
It is not Brazil’s past achievements that are signifi canthere, it is the way in which this initiative has positioned them for the future. The lesson for New Zealand is howthe shift can be achieved through foresight, long-termGovernment commitment, appropriate regulation andtargeted research.
Bioenergy’s Role
Bioenergy has the potential to play an important role inmeeting New Zealand’s challenges. Biomass resourcesare more under human control than other renewables,which are predominantly weather-dependent. In theshort-term, biomass resources can be increased at will,limited only by land availability and growth rates. Due
The potential benefi ts from bioenergy extend well beyond the energy sector, crossing into areas of sustainable land use management, regional development and national economic development. A bioenergy vision may be the national sustainable development opportunity that could enable New Zealand to reach carbon neutrality,without sacrifi cing economic well-being.
B I O E N E R G Y O P T I O N S F O R N E W Z E A L A N D
62

to this fl exibility, bioenergy can be used to fi ll areas of demand not met by other renewable sources. Bioenergy also provides energy storage (Appendix II).
Based on New Zealand’s land availability and otherrenewable resources, two areas have been identifi ed where bioenergy could play an important role inNew Zealand’s energy mix:
• Supply of industrial and community heat and power on a regional level from heat only and; CHP plantsfuelled by biomass residuals;
• Supply of transport fuels on a national level from purpose-grown energy biomass.
Technologies for combined heat and power havealready reached commercial maturity, and are widely deployed in many countries. A number of technologies for woody biomass to liquid biofuel production have reached scale-up and demonstration stage. However,signifi cant research is still required before they are deployed commercially. For New Zealand, the researchfocus needs to be on locally-produced feedstocks and integrated production systems for New Zealand conditions. A detailed research strategy will bepublished in a separate document.
Using biomass residuals
Three bioenergy pathways that have suffi cient scale to play an important role on regional level and also havelarge environmental benefi ts (such as greenhouse gasreductions) are:
• Industrial and municipal organic waste to heat and power via anaerobic digestion;
• Woody biomass residuals (including forest residuesand municipal green waste) to heat and power viacombustion;
• Straw to heat and power in the Canterbury region.
These pathways have potential to make a signifi cantcontribution to rural and regional energy security and the greenhouse gas footprint of industrial productmanufacture.
Growing biomass for energy
To tackle transport fuel problems of national scale it isnecessary to go beyond residuals and consider purpose-grown biomass. The possible purpose-grown biomass resources are:
• Oil (e.g. canola) and carbohydrate (e.g. corn, orsugar beet) crops;
• Algae;
• Woody biomass;
• Other lignocellulosic crops (grasses).
Transport biofuels from oil, carbohydrate and grass-likecrops suffer from restricted land availability, competition with food production and high valueexport products, and limited environmental benefi ts (see Appendix I for a detailed comparison with woody-biomass).
Transport biofuels from algae suffer from risks due totechnology immaturity and infrustructural requirements. For example, the cheapest proposed approach growsalgae on ponds. To meet New Zealand’s current transport fuel demand would require around 330,000 ha (5.5 times Lake Taupo) of man-made ponds.
In contrast, transport biofuels from woody biomass donot have the same land availability restrictions. All of New Zealand’s current fuel consumption of 8 billion litres - including petrol, diesel, jet fuel and fuel oil for ships -can be produced from 42% of New Zealand’s medium to low productivity land, while providing signifi cant environmental benefi ts. The greatest drawback of this option is that it is not currently economically viable.Technology improvements and rising oil prices are likely to see this change in the future.
Establishment of a large-scale woody biomass resource,made up of various short- to long- rotation tree species,could mitigate a number of the risks associated withother options by:
• Acting as signifi cant long term energy store;
• Carbon sequestration during the establishment phase;
• Acting as a sustainable land management option: stabilising erosion prone land, low input (e.g. fertiliser, pesticides) land use, improvingwater quality;
• Producing sustainable co-products such as traditional timber products; high-value biomaterials andchemicals through biorefi nery operations, and;providing the forest industry with a signifi cant alternative market for low value crops (see AppendixIII for more details of multi-product forests);
• Stimulating regional development.
Due to the scale of the energy problem and the inherent limitations of all the bioenergy options it is possiblethat all four purpose-grown biomass options should be pursued. However, there are advantages for a small country to focus resources on one possibility, especially since it signifi cantly surpasses the others in terms of potential benefi t for New Zealand. A study is presently under way to quantify the environmental, macro-
B I O E N E R G Y O P T I O N S F O R N E W Z E A L A N D
63

economic, and land use impacts and benefi ts of the woody-biomass option on a national scale.
New technologies will have a major impact in the future for both niche opportunities and large scaleoptions. For example, the use of algae to makebiodiesel from effl uents shows promise as a signifi cant niche opportunity. Around 9,000 ha of ponds wouldpotentially create 250 million litres of biodiesel spreadover a large number of regional sites.
A bioenergy vision for New Zealand
Any shift from fossil energy to bioenergy will requiremuch more than research. Technology demonstration, infrastructure, industry partnership, the right policy environment and consumer perceptions must all be addressed (see Appendix IV for more transition issues).
The potential benefi ts from this bioenergy visionextend well beyond the energy sector, crossing intoareas of sustainable land use management, regionaldevelopment and national economic development. Givenfull government backing and careful management,this bioenergy vision may be the national sustainable development opportunity that could enable New Zealand to reach carbon neutrality, without
sacrifi cing economic well-being.
A glimpse of New Zealand’s possible energy future?
The map on the opposite page represents a possible future energy scenario, based on large scale bioenergyfrom forestry.
The map shows the current forest estate (dark green); and the area of new forested land (light green) that would be needed to create up to 8.7 billion litres of liquid fuels. The selection of this land areas was by GISanalysis, using a variety of criteria (slope, altitude, land use class) to select land that was of low agriculturalvalue but viable for forestry use.
The tables show the regional areas of land suitable for afforestation. They also show estimates of what these areas could be converted to in terms of energy (PJ) and liquid fuels (litres of petrol equivalent) on an annual basis, assuming a sustainable yield approach and a rotation of 23 years.
The icons are used to indicate the size and general location of biomass to consumer energy conversion plant. It is possible that not all the wood is used for liquid fuels and that some is used for the creation of carbon-neutral heat. Some electricity generation is also viable: as cogeneration at large heat plant; or as small scale distributed generation in areas with limited generation capacity.
New technologies will have a majorNew teimpact in the future for both niche opportunities and large scale optionoptions.
B I O E N E R G Y O P T I O N S F O R N E W Z E A L A N D
64

Figure 19 – Potential forested area (3.372 million ha) by region, potential energy (PJ) and equivalent in biofuels, potential for heat and transport fuel processing
Area, ha PJ p.a. Litres(billions) p.a.
Nelson Region 1,758 0.4 0.005
Tasman Region 26,515 5.2 0.065
MarlboroughRegion
113,486 22.2 0.277
West CoastRegion
18,773 1.3 0.016
Canterbury Region
572,459 91.6 1.144
Otago Region 521,179 99.7 1.246
SouthlandRegion
169,292 35.4 0.442
South Island 1,423,462 255.7 3.196
New Zealand 3,372,354 700.1 8.751
Area, ha PJ p.a.Litres
(billions) p.a.
NorthlandRegion
67,759 16.5 0.207
Auckland Region 26,297 6.8 0.085
Waikato Region 266,872 68.9 0.861
Bay of PlentyRegion
28,506 7.0 0.088
Gisborne Region 244,381 61.7 0.771
Hawke’s Bay Region
392,044 107.3 1.341
Taranaki Region 87,483 19.7 0.246
Manawatu/Wanganui Region
641,184 120.1 1.502
Wellington Region
194,366 36.4 0.455
North Island 1,948,892 444.4 5.555
Regiogion boundary
Existing plantations
Land suitable for biofuel (3 million ha)
Coastline
Legend
B I O E N E R G Y O P T I O N S F O R N E W Z E A L A N D
65

APPENDICES
B I O E N E R G Y O P T I O N S F O R N E W Z E A L A N D
66

Purpose grown forests – benefi ts and options
Forests that are purpose-grown for energy have a signifi cant number of favourable characteristics. Theycan be planted on comparatively low value land and, after establishment, require only sunlight and water in order to absorb carbon from the atmosphere and createstored energy. In this process they provide erosioncontrol, sediment reduction, improved water quality andsome fl ood mitigation. The mature forest then has a
number of utilisation routes. If used for energy then the wood can be converted to heat, power or liquid fuels. If the energy option is not required or economic the wood can be used for traditional solid wood products, reconstituted wood products or exported as logs. Infuture, the creation of biomaterials and chemicals from wood is also likely to be an option. Forests compare favourably in terms of their environmental performance and fl exibility of use when compared to canola-to-biodiesel or other arable crops.
B I O E N E R G Y O P T I O N S F O R N E W Z E A L A N D
67

Canola Crop
Sunlight
WaterIrrigation?
Carbon
Arable Land
Energy-liquid fuels2.2 units outEnergy
1 unit in
1.2 units for export toother uses
Carbon
HerbicidesFertiliser
Tillage
Glycerol
Stock feed
Figure 21 - Canola is renewable, requires greater inputs and has less options
* Energy in - fuel out. It is currently possible to get just over 2 units out for 1 in. There is little room to improve the * Energy in - fuel out. It is currently possible to get just over 2 units out for 1 in. There is little room to improv
conversion technology and crop yield will only increase with greater inputs (irrigation, fertiliser).
Forests
Sunlight
Water
Carbon
Steep Land
Solid wood products; - sawn lumber
Reconstituted wood products;-paper-particle boards
Energy- heat- electricity- CHP- liquid fuels4 units out
Bio-materials-chemicals-plastics
Effluent application
Recreation
Water- Erosion control- Reduced sedimentation- Flood mitigation- Water quality
Energy1 unit in
Biodiversity
3 units for export to other uses
Carbon
Herbicides
Figure 20 - Wood is a renewable, environmentally benign multipurpose product.Figure 20 Wood is a renewable, environmentally benign multipurpose product.
* Energy in – out. It is currently possible to get 4 out for 1 in. This could improve as technology develops, to 5 to 1 in the near
term and possibly as high as 8 to 1 post 2030
Canola cropCC
oresores
B I O E N E R G Y O P T I O N S F O R N E W Z E A L A N D
6868

Energy storage
The world today functions on the extraction and useof stored energy (coal, oil and gas). These materials are typically referred to as fossil fuels, but in fact they are stored solar energy, captured by biomassand geologically processed (heat and pressure over millennia). We are using this store up, and it will run out. Once it is gone our energy options become limited. We will be reliant on sources of energy which are to a largeextent intermittent or cyclical, with the exception ofgeothermal. All other forms of energy are solar driven (including wind) or lunar driven (tidal) or weather reliant (hydro). Storage of energy from these sources is a challenge, especially on large scale.
The value of being able to mine an energy resource atwill, often at short notice should not be underestimated.Until now, our store of energy (as fossil fuels) has beensuffi ciently large that we can all draw on it to meet ourneeds as and when we need to. This will not be the casein the future (long term, post 2050).
In the case of bioenergy, many of the resources that are being considered are small scale and dependanton other processes continuing (residuals) or seasonal (crops). In order to have large scale energy on demand,
we need to have a large energy store to replace thedeclining reserves of fossil energy.
Forests are a natural choice for ths. This is due to the fact that trees are long lived, compared to arable crops.They do not have a critical, must-harvest-by, window limited to a few days or weeks. A forest of radiata pine can be harvested as early as 18 years or as late as 60. The difference between the two options being thevolume harvested, the size of the trees and the cost of time. During this 40-year window the trees simply store more energy (grow). After 60 years the forest may begin to decline in health and lose volume, but other species(Douglas fi r, Redwoods) have greater longevity and may be healthy and growing for a century or more.
Once harvested, the wood (in log form) can be stored for periods of weeks or months with limited dry matter loss at minimal cost (inventory and land area). The logs will dry during storage, raising the effi ciency of subsequentconversion processes.
The question that needs to be investigated furtheris: what is the value of a large scale source of storedenergy, available on demand - like a coal mine butcarbon neutral.
If it does have a value, then this further reinforces theconcept of large scale energy forests.
A way of viewing energy storage/resilience and renew-ability is presented in Figure 22, the scales are logarithmic.
B I O E N E R G Y O P T I O N S F O R N E W Z E A L A N D
69
Figure 22 – Storability of energy
Image courtesy of Andrew Campbell,
Fuel Technology Limited
c + batteryPhotovoltiac
rage tankSolar hot water and stor

Forest energy from multiple log product scenario
The original scenario strategy (Bioenergy Options for New Zealand – Situation Analysis) for a forest energy future had an outline of New Zealand developing a largescale forest resource, to create biofuels from wood, potentially enough to provide all of New Zealand’s liquid fuels demand. All of the logs from these forests were dedicated to energy.
Obviously this takes time; to establish, and then growthe forest. Upper limits on the rate of new forestestablishment are set at 100,000 ha per annum, withmuch of this not producing any harvest for over 20 years. The question then becomes what could we do in the short term? Part of the Situation Analysis Strategy covered the use of short and medium rotation forests to get a harvestable resource developing quickly (5to 15 years). It also assumed that we would use noneof the existing forest estate. These assumptions wereused in order to gain a sense of the scale of the forestestate that might be required to fuel our future and to determine if it was physically and reasonably possible.
In reality forests produce a range of log products and plantation forests could contribute energy logs as well as logs for other purposes as markets demand(FAO 2008). The integration of energy production into plantation forest operations is a means of strengthening energy diversity and security, contributing to climate change mitigation and increasing forest profi tability.Further; not all logs are equal; some are high value($100 - $140) pruned logs suitable for engineering andappearance uses. Some are medium value ($70 - $90) for construction use and some are low value ($30 - $45)industrial logs used in reconstituted products such as paper and particle boards. It is highly likely that a forestplanted with energy in mind would end up having someof the logs used for creation of products other than energy. These products would typically be high value solid wood, which can provide high returns to the forest grower.
If there was real pressure to do something quickly, what could we do now? The solution entails looking at the existing forest harvest residue resource and the existing forest harvest end-use. This could be described as:
• the present resource – unused residues;
• the possible present resource – logs that are exported and potentially some of the industrial logs;
• the future potential resource – the new energy focussed forest estate, with a range of optionsaround what percentage of the crop would be usedfor energy.
How much wood do we need? Our current liquid fuel demand is 8.1 billion litres. If we assume that we willhave effi ciency, conservation, some biofuels produced from various residuals, some canola crop basedbiodiesel, some fuel from algae and some displaced by the introduction of light electric vehicles, we could require in excess of 5 billion litres of fuel to be created from woody biomass in 2050 assuming that oil is either expensive or unavailable.
It should be technically possible to make around 90to 100 litres of diesel equivalent from every cubic metre of wood. Using this as a base for estimates of fuel from wood production we get the fi gures outlined below: progressing from what we could make now outof residues; through to what we could derive from exported logs; adding some industrial wood; and thenutilising the new energy focussed forest estate we could develop now, which would be available for harvest from2030 onwards. This is still a simple estimate of what is possible, as there are many variables and options, including the use of short and medium rotation species. The impact of the options should be examined in moredetail than presented here.
Table 29 - Forest residues – volumes available, millions of cubic metres per annum
2010 2030 2050
Landings 0.92 2.41 2.54
Ground based 1.22 2.46 1.8
Steep 1.44 3.37 2.14
Total 3.58 8.24 6.48
Table 30 - Existing plantation harvest – volumes potentially available from existing harvest, millions of cubic metresper annum
2010 2030 2050
Export Logs 5.8 14.4 15.2
Chip export 0.2 0.5 0.5
50% of Industrial 4.0 9.8 10.4
Total 10.0 24.7 26.1
Note – for 2030 and 2050 the amount of export chip and industrial logs were assumed to be the same proportion of harvest as theyare now.
B I O E N E R G Y O P T I O N S F O R N E W Z E A L A N D
70

Table 31 - Purpose Grown Energy Forest (PGEF) – multi product forest, with varying % of harvest to energy or other uses, based on varying new estate size (Millions of cubic metres per annum).
PGEF hectares % to energy 2010 2030 2050
1.0 million 25 - 5.9 5.9
50 - 11.9 11.9
100 - 23.9 23.9
2.0 million 25 - - 11.9
50 - - 23.9
100 - - 47.8
3.0 million 25 - - 17.9
50 - - 35.8
100 - - 71.7
Note - assumes 550 m3 / ha of recoverable wood and a 23 year rotation
Table 32 - Total wood volume, millions of cubic metres per annum (residues, export logs and 50% ofindustrial wood, and PGEF at varying percentages)
PGEF hectares % to energy 2010 2030 2050
1.0 million 25 13.43 38.61 32.31
50 44.61 44.21
100 56.61 56.21
2.0 million 25 44.21
50 56.21
100 80.11
3.0 million 25 50.21
50 68.11
100 104.01
Table 33 - Total liquid fuel, litres of diesel equivalent which could be generated, using the residues, export logs, 50% of industrial wood and PGEF at varying %’s
PGEF hectares Crop % to energy 2010 2030 2050
1.0 million 25 1,316,140,000 3,791,620,000 3,172,260,000
50 - 4,379,620,000 4,338,460,000
100 - 5,555,620,000 5,514,460,000
2.0 million 25 - - 4,338,460,000
50 - - 5,514,460,000
100 - - 7,856,660,000
3.0 million 25 - - 4,926,460,000
50 - - 6,680,660,000
100 - - 10,198,860,000
From Table 33 it can be seen that with the use of all residues, all export logs and substantial part ofthe industrial log volume (50%) as well as 1.0 million hectares of purpose grown energy forest wecould make 5.5 billion litres of liquid biofuels by 2030.
Without the PGEF we can get to about 1.3 billion litres and would need to divert some of the industrial wood production to fuel to production to achieve this.
This further highlights the need for a large scale purpose grown energy crop.
B I O E N E R G Y O P T I O N S F O R N E W Z E A L A N D
7171

Transition Issues
If the high oil price/peak oil scenario is a reality there will have to be a transition from fossil oil energy for transport to an alternative energy supply/system.
At this stage it is not clear what the future dominant transport fuel supply will be. There are many options, with most still in development and demonstration phases. Which will be the dominant pathway (andthere may be more than one) will to some extent bedriven by national level resources. Oil is effectively aglobal resource; there are few other energy resources that have the ability to reach from source to userso effectively due to more complex and demandingtransmission and distribution issues. This would suggest that we will have a more diverse range of energy optionsboth globally and nationally.
We have signifi cant potential for forests, crops and algae to make a contribution to the primary energy supply for transport fuels, but it will require a lot of effort and some time to create the resources. There are a number of options to build up a supply incrementally over time, they are:
• waste oils (already functioning);
• effl uents (algae and anaerobic digestion);
• municipal wastes (including wood);
• wood process residues (wood);
• forest harvest residues (wood);
• crops from arable land (canola [oil] / miscanthus[ligno-cellulose]);
• short rotation coppice (woody biomass);
• medium and long rotation forests.
Two future scenarios were considered where a range of biomass and other energy sources made a contributionto transport fuel supply in 2050 (see Table 34). Keydifferences in the scenarios were the contributions fromfossil fuels (30% in scenario 1 and 10% in scenario 2)with arable energy crops, algae and electric vehicles making larger contributions in scenario 2. In both scenarios, signifi cant contributions from energy forests are required to meet demand.
Table 34 - Future scenarios (2050); demand is 8.1 billion litres (~277 PJ) of liquid fuels per annum
Contribution Scenario 1
Contribution Scenario 2
Crops (canola)for biodiesel
5% 405 M/l13.9PJ
10% 810 M/l 27.7 PJ
Residualbiomass
5% 405 M/l13.9PJ
5% 405 M/l 13.9PJ
Algae 5% 405 M/l13.9PJ
10% 810 M/l 27.7 PJ
Yet to be developedresource
5% 405 M/l13.9PJ
10% 810 M/l 27.7 PJ
Electric vehicles(~40% of the light vehicles)
20%*Substitutes for1620 M/l 55PJ
30%*Substitutes for2430 M/l 83PJ
Fossil 30% 2430 M/l 83PJ
10% 810 M/l 27.7 PJ
Energy Forest 30% 2430 m/l 83PJ
25% 2025 M/l 69PJ
* Note: % of total transport fuel.
The options presented in Table 34 are both based on the assumption that our future fuel supply will bemore diverse, more distributed and more sustainable. However, given the limits on supply from wastes, andpurpose grown biomass from agricultural and algalresources and taking into account the uncertainty about future oil supply and cost, the option of growing large scale forests for energy seems to bean inevitable choice.
New Zealand is not unique in the energy challenges it faces, and many countries are developing research and implementation strategies and policies to reduce reliance on fossil fuels and to improve theirsustainability. A key to sustainability of renewables is the sustainability of the land use. One of the options for New Zealand to follow is the fast adaptation of ligno-cellulosic conversion technologies developed overseas.However for this strategy to be viable in the medium term we need to consider the resource to which the conversion technology is to be applied, what it is, where it is and how much there is. Given the informationgathered and summarised in the Bioenergy Optionsproject to date it seems clear that one of the most signifi cant opportunities available is based on forests from marginal lands.
B I O E N E R G Y O P T I O N S F O R N E W Z E A L A N D
727272

Table 35 - Pathways evaluation summary energy effi ciency and outputs per 1GJ of resource output.
Pathway Description Scale Energy effi ciency
CO2 equiv
emissionsCost Value
per GJ out
Profi t (loss) per
GJ out
1 Wood Residues to Heat Medium 67% 0.0040 $ 6.76 $6.78 $0.33
2 Wood Residues to CHP Small 46% 0.0059 $11.74 $12.58 $1.39
3 Wood Residues to EtOH Medium 41% 0.0085 $20.56 $31.66 $13.80
4 Wood Residues -Gas-Heat Medium 57% 0.0047 $25.14 $6.73 -$18.05
5 Wood Residues -Gas-CHP Medium 47% 0.0057 $30.06 $16.79 -$12.55
6 Wood Residues - Gas - FT liquids Small 52% 0.0052 $24.15 $21.05 $5.71
7 Wood Residues - Pyrolysis - LF Small 56% 0.0048 $13.09 $14.11 $1.79
8 PGF to Heat Large 63% 0.0043 $32.40 $6.78 -$24.86
9 PGF to CHP Large 43% 0.0063 $42.67 $12.58 -$28.63
10a PGF to EtOH Large 43% 0.0081 $56.53 $31.66 -$23.79
10b PGF to Biodiesel Large 43% 0.0081 $56.53 $31.66 -$23.79
11 PGF-gas-heat Large 60% 0.0045 $50.35 $6.73 -$43.62
12 PGF-gas-CHP Large 49% 0.0055 $61.24 $16.80 -$44.45
13 PGF to gas to FT liquids Large 54% 0.0050 $52.67 $26.06 -$23.91
14 PGF to Pyrolysis to LF Large 58% 0.0046 $40.02 $14.11 -$25.66
15 Straw to Heat Small 88% 0.0045 $ 5.77 $6.79 $1.17
16 Straw to CHP Small 61% 0.0065 $ 9.75 $12.56 $3.02
17 WVO to Biodiesel VerySmall
84% 0.0074 $18.99 $24.95 $23.76
18 Tallow to Biodiesel Small 64% 0.0558 $24.92 $24.97 $3.56
19 Rapeseed to Biodiesel Medium 69% 0.0327 $47.15 $25.00 -$16.93
20* Coal to Heat * VeryLarge
74% 0.1281$ 6.88 $6.79 -
21 Coal to gas to FT liquids Large 53% 0.1788 $23.62 $26.06 $5.68
* Base case
B I O E N E R G Y O P T I O N S F O R N E W Z E A L A N D
737373

Glossary of abbreviations
BTL – Biomass to liquid
C – Carbon
CHP – Combined heat and power
CO – Carbon monoxide
CO2–e - CO
2equivalent
DM – Dry matter
DME – Dimethyl ether
DW – Dry weight
EJ – Exajoule (1 x 10¹⁸)
F-T – Fischer Tropsch
FRST – Foundation for Research, Science and Technology
GHG – Green-house gas
GJ – Gigajoule (1 x 10⁹)
GTL – Gas to liquid
ha – Hectares
kW – Kilowatt
kWh – Kilowatt hour
l = Litre
MRF – Medium rotation forest
MW – Mega watt
NOx – Nitrous oxide
ODT – Oven dry tonnes
p.a. – Per annum
PGF - Purpose-grown forest
PJ – Petajoule (1 x 10¹⁵)
SCWO – Super critical water oxidation
SOx – Sulphur oxide gases
SRC – Short rotation coppice
SRF – Short rotation forest
t – Tonne
Defi nitions
Primary energy = gross fuel/energy consumption
Consumer energy = energy delivered to consumers
User and consumer energy are interchangeable terms, and are always less than primary energy due to conversion effi ciency and distribution losses.
Example;
Primary energy going to heat = 1 GJ for Consumerenergy of heat = 0.7 GJ
$40
$35
$30
$25
$20
$15
$10
$5
$0
Wo
od
res
idu
es t
o h
eat
Wo
od
res
idu
es t
o C
HP
Wo
od
res
idu
es t
o E
tOH
Wo
od
res
idu
es -
Gas
- H
eat
Wo
od
res
idu
es -
Gas
- C
HP
Wo
od
res
idu
es -
Gas
- F
T li
qu
ids
Wo
od
res
idu
es -
Pyr
oly
sis
- L
F
PG
F to
hea
t
PG
F to
CH
P
PG
F to
EtO
H
PG
F to
bio
die
sel
PG
F -
Gas
- H
eat
PG
F -
Gas
- C
HP
PG
F -
Gas
- F
T li
qu
ids
PG
F -
Pyr
oly
sis
- L
F
Str
aw -
Hea
t
Str
aw -
CH
P
WO
- B
iod
iese
l
Tallo
w -
Bio
die
sel
Rap
esee
d -
Bio
die
sel
Co
al -
Hea
t
Co
al -
Gas
- F
T li
qu
ids
Figure 23 – Value per GJ out

More information
For more information on Scion’s extensive research and development capabilities please contact:
ScionTe Papa Tipu Innovation Park49 Sala StreetRotorua, New ZealandPhone: +64 7 343 5899Fax: +64 7 343 5528www.scionresearch.com