bioethanol as renewable transportation fuel for the...
TRANSCRIPT

Bioethanol as renewable transportation
fuel for the future
Daniël Coenrad La Grange
A Study Project
presented to the Graduate School of Business
of the University of Stellenbosch
in partial fulfillment
of the requirements for the degree of
Master of Business Administration
Supervisor: Jako Volschenk
Degree of confidentiality: A December 2007

ii
DECLARATION
Hereby I, Daniël Coenrad La Grange, declare that this study project is my own original
work and that all sources have been accurately reported and acknowledged, and that this
document has not previously in its entirety or in part been submitted at any university in
order to obtain an academic qualification.
______________________________
D.C. La Grange October 2007
Student number: 1117265

iii
ACKNOWLEDGEMENT
I wish to express my sincere gratitude and appreciation to the following persons:
Jako Volschenk, University of Stellenbosch Business School, who acted as supervisor, for
accepting me as a student and for his guidance through this study.
My wife, Marina la Grange for all her love and support and her unending belief in my
abilities. Also for her patience and for supporting and encouraging me throughout the
duration of my study.
My parents and family for all their love and support.
My colleagues, for their support, encouragement and advice.
The Almighty, for this opportunity.

iv
ABSTRACT
Fossil fuel has been the preferred source for the production of transportation fuel for many
years. However, this is not a renewable resource. Many conflicting reports have been
published as to how long this resource will last. One thing is certain: eventually the supply
of cheap crude oil will run out. It is therefore crucial to start the search for renewable
alternatives now.
There are a number of possible candidates vying for replacing fossil fuel as primary
transportation fuel. Hydrogen, methanol, biodiesel and bioethanol all have the
characteristics required of a good transportation fuel. It is unlikely that only one of these
will replace oil. A more likely scenario would be that they all play a role in transportation in
the future. Apart from being renewable, these alternatives have the further advantage of
being less damaging to the environment, something that will become essential in future.
Among the renewable alternatives, bioethanol has the second highest energy density.
Currently, ethanol production worldwide almost exclusively uses sugarcane and maize as
raw material. However, both these are food crops and using them for ethanol could lead
to an increase in food prices. Furthermore, there is not enough agricultural land available
to produce sufficient quantities of sugarcane and maize for ethanol to replace fossil fuel.
Producing ethanol from plant material has the potential to meet the capacity requirements
without impacting directly on food production. Approximately 180 million tons of
agricultural biomass are produced in the United States each year, sufficient to produce 75
to 110 billion litres of ethanol.
Despite its abundance, the technical challenges in converting cellulose to ethanol are
significant. One major obstacle to the production of ethanol out of plant material is that
most of the sugar in plant material is unavailable for fermentation by micro-organisms. In
order to render the sugars in the cellulose fraction accessible to conversion, it is necessary
to treat the plant fibres with a combination of chemical and enzymatic processes. Only
when a complex mixture of enzymes is used, does it become possible to break down
cellulose to glucose for subsequent fermentation to ethanol.

v
Biomass processing by means of enzymes currently involves four separate biological
steps: (i) production of enzymes (cellullases and hemicellulases), (ii) hydrolysis of cellulose
and hemicellulose to sugars, (iii) fermentation of hexose sugars and (iv) fermentation of
pentose sugars. Consolidated BioProcessing (CBP) will combine all these steps into one.
However, CBP is not yet possible and the magnitude of research and developmental
advancement required to realize this goal is significant.
Both sugar and starch ethanol technologies are well established and major process
advances are therefore unlikely. Currently there are no commercial-sized plants for the
production of ethanol from lignocellulosics, however this is likely to change in the near
future considering the progress made in this field during recent years. This study will focus
on the current status of the bioethanol industry, as well as on the potential for future
development.
vi
OPSOMMING
Fossielbrandstof was vir baie jare die hoofbron vir die produksie van brandstof vir die
vervoerbedryf. Fossielbrandstof is nie ’n hernubare energiebron nie en daar is al baie
gespekuleer oor presies hoe lank daar nog goedkoop olie beskikbaar sal wees. Baie min
van die gepubliseerde bronne stem ooreen, maar almal is dit eens dat olie op een of ander
stadium sal opraak. Om hierdie rede is dit noodsaaklik om nou reeds te soek na
alternatiewe.
Daar is ’n hele aantal hernubare alternatiewe wat gebruik kan word in die plek van olie.
Waterstof, metanol, biodiesel en bioetanol beskik almal oor die nodige eienskappe om ’n
effektiewe vervoerbrandstof te wees. Die hoofvoordeel van hierdie brandstowwe is dat
hulle minder skadelik is vir die omgewing as olie, ’n eienskap wat baie belangrik sal wees
in die toekoms. Die kans is eger skraal dat een van bogenoemde bronne die mark totaal
sal oorheers soos wat olie tot op hede oorheers het. ’n Meer waarskynlik uitkoms sou
wees dat al hierdie bronne op een of ander manier ’n rol gaan speel in die vervoerbedryf in
die toekoms.
Etanol het die tweede hoogste energie digtheid van die vier genoemde hernubare
brandstowwe. Etanol word tans uitsluitlik van suikerriet en mielies geproduseer. Beide
suikerriet en mielies is voedselgewasse en die gebruik daarvan vir brandstof kan lei tot ’n
toename in voedselpryse. Daar is ook nie genoeg landbougrond beskikbaar vir die
verbouing van suikerriet en mieles sodat genoeg etanol geproduseer kan word om
fosielbranstof te vergang nie. Die vervaardiging van etanol vanaf lignosellulose het die
potensiaal om etanolkapasiteitprobleme te oorkom sonder om direk met voedselproduksie
te kompeteer. Ongeveer 180 miljoen ton landbouafval word jaarliks in die Verenigde State
geproduseer, genoeg vir die vervaardiging van tussen 75 en 110 biljoen liter etanol.
Die tegniese kompleksiteit gekoppel aan die omskakeling van sellulose na etanol is
beduidend. Die belangrikste hindernis vir die produksie van etanol vanaf plantmateriaal is
die feit dat die meeste van die suiker nie beskibaar is vir fermentasie deur
mikroörganismes nie. Plantvesels moet daarom met ’n kombinasie van chemikalieë en
ensieme behandel word om sodoende die suiker beskikbaar te maak vir omskakeling.

vii
Sellulose kan slegs met ’n komplekse mengsel van ensieme afgebreek word tot glukose
wat dan daarna gefermenteer kan word tot etanol.
Die verwerking van biomassa met behulp van ensieme behels tans vier afsonderlike
biologiese stappe: (i) ensiemproduksie (sellulases en hemisellulases), (ii) hidrolise van
sellulose en hemisellulose tot fermenteerbare suikers, (iii) fermentasie van heksose suikers
en (iv) fermentasie van pentose suikers. Consolidate BioProcessing (CBP) poog om al vier
hierdie stappe te kombineer. Ongelukkig is die CBP proses nog nie moontlik nie en daar
moet nog baie navosing en ontwikkeling gedoen word om dit ’n realiteit te maak.
Beide die metodes vir suiker- en styseletanolproduksie is goed gevestig, dus is die kans vir
beduidende verbeteringe klein. Daar is tans geen aanlegte van kommersiële grootte vir die
produksie van etanol vanaf lignocellulose nie, maar dit gaan waarskynlik binnekort
verander as ’n mens die vordering in ag neem wat daar onlangs gemaak is in hierdie veld.
Hierdie studie fokus op die huidige stand van sake in die etanolbedryf en die
ontwikkelingsmoontlikhede vir die toekoms.

viii
TABLE OF CONTENTS
DECLARATION.................................................................................................................... ii
ACKNOWLEDGEMENT ...................................................................................................... iii
ABSTRACT ......................................................................................................................... iv
OPSOMMING...................................................................................................................... vi
TABLE OF CONTENTS..................................................................................................... viii
LIST OF TABLES .............................................................................................................. xiii
LIST OF FIGURES ............................................................................................................. xv
CHAPTER 1 INTRODUCTION.............................................................................................1
1.1 Introduction ............................................................................................................1
1.2 Aim of the study......................................................................................................2
1.3 Plan of the study.....................................................................................................3
CHAPTER 2 THE FOSSIL FUEL INDUSTRY ......................................................................5
2.1 Introduction ............................................................................................................5
2.2 World peak oil ........................................................................................................6
2.2.1 Mitigating factors .............................................................................................9
2.2.1.1 Efficiency technology ...............................................................................9
2.2.1.2 Improved oil recovery...............................................................................9
2.2.1.3 Heavy oil and oil sands ..........................................................................10
2.2.1.4 Gas-to-Liquids (GTL) .............................................................................10
2.2.1.5 Switching to electricity............................................................................11
2.2.1.6 Renewable liquid fuels ...........................................................................11
2.2.2 Mitigating scenarios ......................................................................................11
2.3 The environment ..................................................................................................12
2.3.1 Impact of oil extraction on the environment...................................................13
2.3.2 Impact of oil usage on the environment ........................................................14

ix
2.4 Oil distribution ......................................................................................................16
2.5 Conclusion ...........................................................................................................19
CHAPTER 3 ALTERNATIVES TO FOSSIL FUEL..............................................................20
3.1 Introduction ..........................................................................................................20
3.2 Hydrogen..............................................................................................................20
3.3 Biodiesel...............................................................................................................21
3.4 Methanol ..............................................................................................................21
3.5 Ethanol .................................................................................................................22
3.6 Conclusion ...........................................................................................................22
CHAPTER 4 IMPACT OF ETHANOL ON THE ENVIRONMENT .......................................23
4.1 Introduction ..........................................................................................................23
4.2 Advantages of ethanol use...................................................................................23
4.2.1 Compatibility with existing technology...........................................................23
4.2.2 Environmental benefits..................................................................................24
4.2.3 Job creation...................................................................................................25
4.2.4 Agricultural benefits.......................................................................................25
4.2.5 Energy security and independence ...............................................................26
4.2.6 Other advantages..........................................................................................26
4.3 Disadvantages of ethanol use ..............................................................................26
4.3.1 Environmental impact....................................................................................26
4.3.2 Energy density ..............................................................................................28
4.3.3 Pipelines .......................................................................................................29
4.3.4 Volatility.........................................................................................................30
4.3.5 Impact of ethanol production.........................................................................30
4.4 Conclusion ...........................................................................................................30
CHAPTER 5 RAW MATERIALS.........................................................................................31
5.1 Introduction ..........................................................................................................31

x
5.2 Sugar....................................................................................................................31
5.2.1 Sugarcane.....................................................................................................31
5.2.1.1 Environmental Impact ............................................................................32
5.2.2 Sugar beet.....................................................................................................34
5.2.2.1 Environmental Impact ............................................................................34
5.2.3 Sweet sorghum (Sorgum bicolor)..................................................................35
5.2.3.1 Environmental Impact ............................................................................37
5.3 Starch...................................................................................................................37
5.3.1 Maize ............................................................................................................37
5.3.1.1 Environmental Impact ............................................................................38
5.3.2 Wheat............................................................................................................39
5.3.2.1 Environmental Impact ............................................................................40
5.4 LignoCellulose......................................................................................................41
5.4.1 Switchgrass (Panicum virgatum)...................................................................41
5.4.1.1 Environmental Impact ............................................................................43
5.4.2 Miscanthus (Miscanthus x giganteus) ...........................................................43
5.4.2.1 Environmental Impact ............................................................................45
5.5 Conclusion ...........................................................................................................45
CHAPTER 6 BIOMASS PROCESSING .............................................................................47
6.1 Introduction ..........................................................................................................47
6.2 Direct combustion.................................................................................................47
6.3 Pyrolysis and gasification .....................................................................................48
6.4 Anaerobic digestion..............................................................................................49
6.5 Fermentation ........................................................................................................49
6.6 Conclusion ...........................................................................................................49
CHAPTER 7 BIOETHANOL PRODUCTION ......................................................................50
7.1 Introduction ..........................................................................................................50

xi
7.2 Ethanol from sucrose ...........................................................................................50
7.2.1 The current industry ......................................................................................50
7.2.2 Production process .......................................................................................51
7.2.3 Environmental impact of ethanol production .................................................52
7.2.4 Energy balance .............................................................................................52
7.2.5 Greenhouse gas balance ..............................................................................53
7.2.6 Impact on food supply and price ...................................................................55
7.2.7 Sugar ethanol in South Africa........................................................................56
7.3 Ethanol from starch ..............................................................................................58
7.3.1 The current industry ......................................................................................58
7.3.2 Production process .......................................................................................59
7.3.3 Environmental impact of ethanol production .................................................61
7.3.4 Energy balance .............................................................................................61
7.3.5 Greenhouse gas balance ..............................................................................63
7.3.6 Impact on food supply and price ...................................................................64
7.3.7 Starch ethanol in South Africa.......................................................................65
7.4 Ethanol from cellulose ..........................................................................................67
7.4.1 The current industry ......................................................................................67
7.4.2 Production process .......................................................................................68
7.4.3 Environmental impact of ethanol production .................................................70
7.4.4 Energy balance .............................................................................................71
7.4.5 Greenhouse gas balance ..............................................................................72
7.4.6 Impact on food supply and price ...................................................................73
7.4.7 Cellulosic ethanol in South Africa..................................................................73
7.5 Conclusion ...........................................................................................................76
CHAPTER 8 BIOETHANOL TECHNOLOGY .....................................................................77
8.1 Introduction ..........................................................................................................77
8.2 Evolution of current technology ............................................................................77
8.2.1 Raw material production ...............................................................................77
8.2.2 Plant construction cost ..................................................................................78

xii
8.2.3 Economies of scale .......................................................................................79
8.2.4 Process automation ......................................................................................79
8.2.5 Molecular sieves ...........................................................................................79
8.2.6 Thermal integration .......................................................................................80
8.2.7 Enzymes .......................................................................................................80
8.2.8 Yeast.............................................................................................................82
8.2.9 Emissions......................................................................................................82
8.2.10 Wastewater ...................................................................................................83
8.3 Future outlook ......................................................................................................83
8.3.1 Future outlook for starch ethanol...................................................................83
8.3.1.1 Raw starch process ...............................................................................83
8.3.1.2 Thermotolerant yeast .............................................................................84
8.3.1.3 Recombinant yeast ................................................................................84
8.3.2 Future outlook for cellulose ethanol ..............................................................85
8.3.2.1 Process technology................................................................................85
8.3.2.2 Recombinant yeast ................................................................................86
8.3.2.3 Plant construction ..................................................................................89
8.3.3 Biorefinery .....................................................................................................89
8.4 Conclusion ...........................................................................................................90
CHAPTER 9 CONCLUSION...............................................................................................92
9.1 Introduction ..........................................................................................................92
9.2 SA biofuture .........................................................................................................92
9.3 Global biofuture....................................................................................................93
9.4 Future research....................................................................................................94
LIST OF SOURCES ...........................................................................................................96
APPENDICES ..................................................................................................................107
GLOSSARY......................................................................................................................110

xiii
LIST OF TABLES
Table 2.1. Predictions of when world oil production would peak..........................................7
Table 2.2. Global natural and anthropogenic sources of greenhouse gases in the 1990s.15
Table 2.3. Size and energy consumption differences between Brazil and the United States.
....................................................................................................................................19
Table 4.1. Average levels of formaldehyde and acetaldehyde in Osaka where ethanol has
never been used and Sao Paulo where fuel ethanol has been used for more than 20
years. ..........................................................................................................................27
Table 5.1 Summary of bioethanol feedstocks....................................................................46
Table 6.1. Biomass technology chart.................................................................................47
Table 7.1. Energy generation and consumption in the production of sugarcane and ethanol
in Brazil. Energy units are expressed per ton sugarcane (tC) processed. ..................54
Table 7.2. Greenhouse gas emissions from the production and use of ethanol from
sugarcane....................................................................................................................54
Table 7.3. Energy generation and consumption in the production of maize ethanol. Eout for
ethanol is 23,5 MJ per litre. .........................................................................................62
Table 7.4. Key parameters of starch ethanol in South Africa.............................................66
Table 7.5 Energy generation and consumption in the production of cellulose ethanol. Eout
for ethanol is 23,5 MJ. .................................................................................................71
Table 7.6. Energy supply and consumption in South Africa in 2000/01. Energy expressed
as petajoule/year (PJ/year)..........................................................................................74
Table 7.7. Sources of potentially available biomass resources in South Africa. ................75

xiv
Table 8.1. A list of a few possible CBP organisms. For each organism the Wild Type (WT)
and the Genetically Engineered (GE) strain properties are indicated..........................88
xv
LIST OF FIGURES
Figure 2.1. Average daily oil consumption by China and India. ............................................5
Figure 2.2. (A). M.K. Hubbert’s prediction of peak oil production in America in 1956. (B)
Actual oil production in America. ...................................................................................7
Figure 2.3. (A) Hubbert’s prediction of world peak oil production published in 1956.
(B) Campbell’s prediction of world peak oil production. .................................................8
Figure 2.4. The effect of improved oil recovery methods on the production of oil from an oil
reservoir. .....................................................................................................................10
Figure 2.5. If mitigation starts when world oil production peaks, it could lead to significant
supply shortages. ........................................................................................................12
Figure 2.6. Oil extraction in the Los Angeles basin in the 1920s. ......................................13
Figure 2.7. Sources of CO2 emissions in the United States...............................................16
Figure 2.8. The price of oil during the last 36 years...........................................................17
Figure 2.9. Map of the world showing the major oil producing countries. ..........................18
Figure 4.1. Ethanol represents a closed carbon cycle. ......................................................25
Figure 4.2. Energy densities of various energy storage systems. Abbreviations: Liquid
petroleum gas (LPG), Liquid Natural Gas (LNG) and Liquid H2 (LH2).........................29
Figure 5.1. Sucrose consists of a glucose and fructose molecule linked to each other. ....31
Figure 5.2. (A) Sweet sorghum is a combination crop producing both grain and sugar rich
stalks up to 5 meters tall. (B) Sweet sorghum ear head. ............................................36
Figure 5.3. Starch is a polysaccharide consisting of many glucose molecules linked to
each other to form long chains. ...................................................................................37

xvi
Figure 5.4. (A) Cellulose is a chain of glucose residues linked to each other to form long
chains while (B) hemicellulose is a chain of xylose residues.......................................41
Figure 5.5. (A) Switchgrass is a hardy, perennial grass which grows to a high of 1,8 –
2,2 m in height. (B) Switchgrass can be cut and baled with standard farming
equipment....................................................................................................................42
Figure 5.6. (A) Mature Miscanthus stand approximately 3,5m high. (B) The Miscanthus
rhizome used for propagation (C) Miscanthus being harvested with a modified forage
harvester .....................................................................................................................44
Figure 6.1. Capital investment cost for liquid fuel facilities (dollars per daily barrel of
capacity). .....................................................................................................................48
Figure 7.1. Simplified representation of the industrial ethanol production process. ...........51
Figure 7.2. The division of raw sugarcane between sugar and ethanol production in Brazil.
....................................................................................................................................56
Figure 7.3. Key parameters of sugar ethanol production in South Africa...........................57
Figure 7.4. The basic flow for the production of ethanol form maize. ................................60
Figure 7.5. Historical area of land used for the production of maize in South Africa..........65
Figure 7.6. The production of ethanol from lignocellulose. ................................................69
Figure 7.7. Learning curves for sugar ethanol showing the (A) decrease in production cost
and (B) the increase in the ethanol yield per hectare as technology improves............72
Figure 7.8. A diagram for evaluating ethanol production processes indicating the use of
primary energy inputs (MJ) and of net greenhouse gas emissions (kg CO2 equivalent)
per MJ of fuel...............................................................................................................73
Figure 8.1. (A) Maize production yields in the United States from 1966 – 2005. (B)
Sugarcane productivity evolution in the Sao Paulo district in Brazil. ...........................78

xvii
Figure 8.2. Maize ethanol production cost. (A) Capital and operating cost (B) Labour cost.
....................................................................................................................................79
Figure 8.3. Comparison of the input costs of the starch and cellulose bioethanol production
processes. ...................................................................................................................81
Figure 8.4. Evolution of fermentation. (A) Increased final ethanol concentrations have been
compromised to achieve (B) higher rates of production. (C) Conversion efficiency is
expressed as a percentage of the theoretical maximum of 0,51 gram ethanol per gram
of glucose. ...................................................................................................................82
Figure 8.5. Evolution of biomass processing configurations featuring enzymatic hydrolysis.
....................................................................................................................................86
Figure 8.6. Alternative organism development strategies to obtain organisms useful in
processing cellulosic feedstocks. ................................................................................87
Figure 8.7. A biorefinery utilizes organic material from agriculture, forestry, fishery, etc and
converts the biomass into value-added products ........................................................89
Figure 8.8. Biomass processing plant. The widths of arrows are proportional to energy
flows. ...........................................................................................................................90
Figure 9.1. Shell Petroleum LTD’s sustained growth scenario. A breakdown of the growth
of various energy forms. ..............................................................................................93
Figure 9.2. Resource consumption and waste assimilation expressed as productive land
area. ............................................................................................................................94

1
CHAPTER 1 INTRODUCTION
1.1 INTRODUCTION
When it had become certain that India would attain independence, a British journalist
interviewing Gandhi asked whether India would now follow the British pattern of
development (Raven, 2002). Gandhi replied immediately, "It took Britain half the resources
of the planet to achieve this prosperity. How many planets will a country like India
require?" Today, about 15% of the world’s population resides in industrialised countries
yet the people of these nations consume 85% of the world’s resources (Gewertz, 2007).
The World Wildlife Fund (WWF) 2006 Living Planet report confirms that we are using the
planet’s resources faster than they can be renewed (World Wildlife Fund, 2006: 1). The
latest data available indicate that humanity’s ecological footprint, has more than tripled
since 1961. It now exceeds the world’s ability to regenerate by about 25%. One of the
consequences of this impact is a continuing loss of biodiversity. Over Earth’s history, the
average extinction rate has been 10 species per year but between 1600 and 1950, this has
increased to 100 per year (Gewertz, 2005). At the moment we are losing thousands of
species every year. If we continue at this rate, two-thirds of Earth’s species will be gone by
the year 2100. Most of these extinctions are the result of habitat destruction. Since
biodiversity supports life on earth and since we might be losing species that can help
scientists develop a sustainable earth, this loss is of serious consequence. For example,
genes from plant species yet to be discovered might help breeders develop hardier, more
productive food plants or plants that can be used for biofuel production in future. Plants
might be the source of treatments that could save the lives millions of people worldwide.
The message is clear: we have been exceeding Earth’s ability to support our lifestyles and
we need to stop doing so (World Wildlife Fund, 2006: 1). The biggest contributor to our
footprint is the way in which we generate and use energy. Our reliance on fossil fuel to
meet our energy needs continues to grow and the resultant climate-changing emissions
now make up 48% of our global footprint. The transportation sector is responsible for a
2
third of the carbon dioxide emissions produced in the United States. Replacing fossil fuel
in this sector will reduce annual emissions of carbon dioxide considerably.
The use of biofuels (bioethanol, biodiesel and biogas) has increased significantly over the
past decade with a total of approximately 30 billions litres consumed in 2003 (Stevens,
Worgetter & Saddler, 2004: 1). The basic driving forces behind this growth are similar
throughout the world. Firstly, biofuels help countries meet their goals of reducing
emissions of carbon dioxide. Secondly, biofuels reduce the dependence of countries on
imported fossil fuel.
To aid in the understanding of policy regarding, and the technical issues of producing
ethanol, the International Energy Agency (IEA) established Task 39 on Liquid Biofuels in
2004 (Mabee & Saddler, 2005; Stevens et al., 2004: 3). Task 39 is part of the IEA
Bioenergy Agreement which is an international agreement that provides a mechanism for
participating countries to exchange information on energy-related topics. It is a
combination of two previous IEA Bioenergy Tasks, Task 26 and 27. Task 26 dealt with the
technical issues related to lignocellulosic ethanol while Task 27 dealt with policy and
regulatory issues. These tasks and other initiatives like this helped ethanol to rapidly grow
into the most-used biofuel in the world at present.
1.2 AIM OF THE STUDY
There is considerable confusion surrounding the production of and trade in ethanol (Berg,
2004). This is hardly surprising given that there are a variety of feedstocks from which
ethanol can be produced, a number of production processes and very different uses for this
commodity. The aim of this study is to provide an overview of the ethanol industry, its
relevance, how it developed to what it is today and what it will look like in future. To do this
we need to answer the following questions:
• Oil is not a renewable resource and will run out sometime in the future. For how many
years will there be oil?
• What are the alternatives to oil?
• Is bioethanol a viable alternative for fossil fuel? What are the advantages and
disadvantages of bioethanol?
3
• Which raw materials are available for the production of bioethanol? What are the
advantages and disadvantages of each?
• What technologies are available for processing biomass?
• What is the energy return on investment for bioethanol from sugar, starch and
lignocellulose, respectively?
• Does bioethanol from sugar, starch and lignocellulose provide a green house gas
benefit?
• What is the status of the sugar, starch and lignocellulose bioethanol industries in South
Africa?
• What progress has been made in the bioethanol industry in recent years?
An in-depth study of published literature will be used to answer these and other related
questions.
1.3 PLAN OF THE STUDY
This study consists of nine chapters and will focus on current and future bioethanol
technology. Chapter 1 introduces the reader to the field of bioethanol. In order to provide
the reader with an overview of the transportation fuel industry as it currently stands,
Chapter 2 focuses on the fossil fuel industry. This includes an estimation of when world
peak oil production is expected to occur, as well as a discussion on the importance of
finding alternatives to non-renewable fossil fuel resources for the transportation industry.
Chapter 3 provides a short discussion of four promising renewable alternatives to oil,
namely hydrogen, biodiesel, methanol and bioethanol. In Chapter 4, the focus is on the
advantages and disadvantages of producing and using bioethanol as transportation fuel.
The discussion in Chapter 5 provides information on the different raw material suitable for
the production of bioethanol. Currently, bioethanol is produced from sugar (obtained from
sugarcane or sugar beet) or from starch (obtained from maize or wheat). This chapter
includes a discussion of two promising lignocellulosic sources of bioethanol, namely
switchgrass and Miscanthus. There are a number of different technologies available for
processing biomass into transportation fuel; these are discussed briefly in Chapter 6. In
Chapter 7, the focus is on the production of bioethanol from the three types of biomass
(sugar, starch and lignocellulose) through fermentation. This includes discussions on the

4
current industry and the processes that are used. For each of these processes, the
environmental impact, the energy and greenhouse gas balances, the impact on food
production and supply, as well as the potential of the particular process in South Africa, are
discussed. Chapter 8 discusses current advances on bioethanol production technology
and look at the development of future technology. Concluding remarks are provided in
Chapter 9.

5
CHAPTER 2 THE FOSSIL FUEL INDUSTRY
2.1 INTRODUCTION
With a demand of more than 84 million barrels per day (mbd) or 30 billion barrels (Gb) per
year, it could realistically be stated that the world is currently heavily dependent on oil
(Energy Information Administration, 2005b). Approximately 73% of crude oil is used for
transportation while the remaining 27% is processed into heating oil, lubricants, asphalt,
etc. (Energy Information Administration, 2005a). World consumption of oil is rapidly
increasing. Twenty years ago, consumption was 60 mbd. This increased to 70 mbd ten
years ago. More than a third of the world’s population lives in China and India, both of
which are industrialising very rapidly. China and India are consuming considerably more
oil each year (Figure 2.1). China increased its consumption to 6 mbd in 2003, which is
10% more than it had been in 2002 (BP, 2004). Depending on who you ask, the worldwide
demand for oil is expected to increase to 120 mbd by 2030 (Aleklett, 2006) or 120 mbd by
2025 (Hirsch, Bezek & Wendling, 2005: 74). Whilst the demand estimates are widely
accepted as reasonable, the supply of oil is highly controversial.
Oil consumption
0
1 000
2 000
3 000
4 000
5 000
6 000
7 000
1992 1994 1996 1998 2000 2002 2004
Thou
sand
bar
rels
dai
ly China India
Figure 2.1. Average daily oil consumption by China and India. Source: BP, 2004

6
The question we have to answer is: For how long can we rely on a stable supply of cheap
oil? To answer this we have to look at historical data on oil discovery and extraction.
2.2 WORLD PEAK OIL
There are many reports on the world’s supply of conventional oil; however, few are in
agreement as to how long resources will last. One of the major reasons for this is the way
in which resources are reported. For example, a mean value of 47 Gb was calculated for a
basin in Greenland from a report stating that there is a 95% probability of it containing more
than zero, namely at least one barrel, and a 5% probability of it containing more than
112 Gb (Campbell, 2003: 5). An analysis of the discovery and production of oil fields
around the world by leading exploration geologist Colin J. Campbell suggests that within
the next decade, the supply of conventional oil will not be able to keep up with the demand
(Campbell, 2002a; Campbell, 2003). Bill Kovarik, on the other hand, argues that the life of
world oil reserves could be measured in centuries at current consumption rates (Kovarik,
2003). These huge differences in opinion can in part be attributed to the fact that some
authors include unconventional oil, like heavy oils, tar sands and oil shale in their
estimates. Crude oil has two forms, conventional and unconventional oil. Conventional oil
is extracted from oil wells in oil reservoirs around the world (George, 1998: 84).
Unconventional oil consists of tar sand oil, oil shale and heavy oil (bitumen). These are
harder and more expensive to extract than conventional oil.
Production of conventional oil from a particular reservoir over time can be described
reasonably well with a bell shaped curve (Campbell & Lailai, 1998: 80). Initially the
production is small as infrastructure such as oil wells and pipelines are built. During the
middle section, production is at its maximum as all of the conventional oil wells are
extracting oil as fast as is practically possible. This is called the peak. Towards the end of
the cycle the conventional oil becomes harder to extract and production starts to decrease.
M. King Hubbert, a world renowned geophysicist, predicted in 1956 that the peak in
conventional oil production in America would occur sometime between 1966 and 1971
(Hubbert, 1956: 22). He assumed that conventional oil production for a region with many
reservoirs at different stages of depletion would also follow a bell shaped curve with a
7
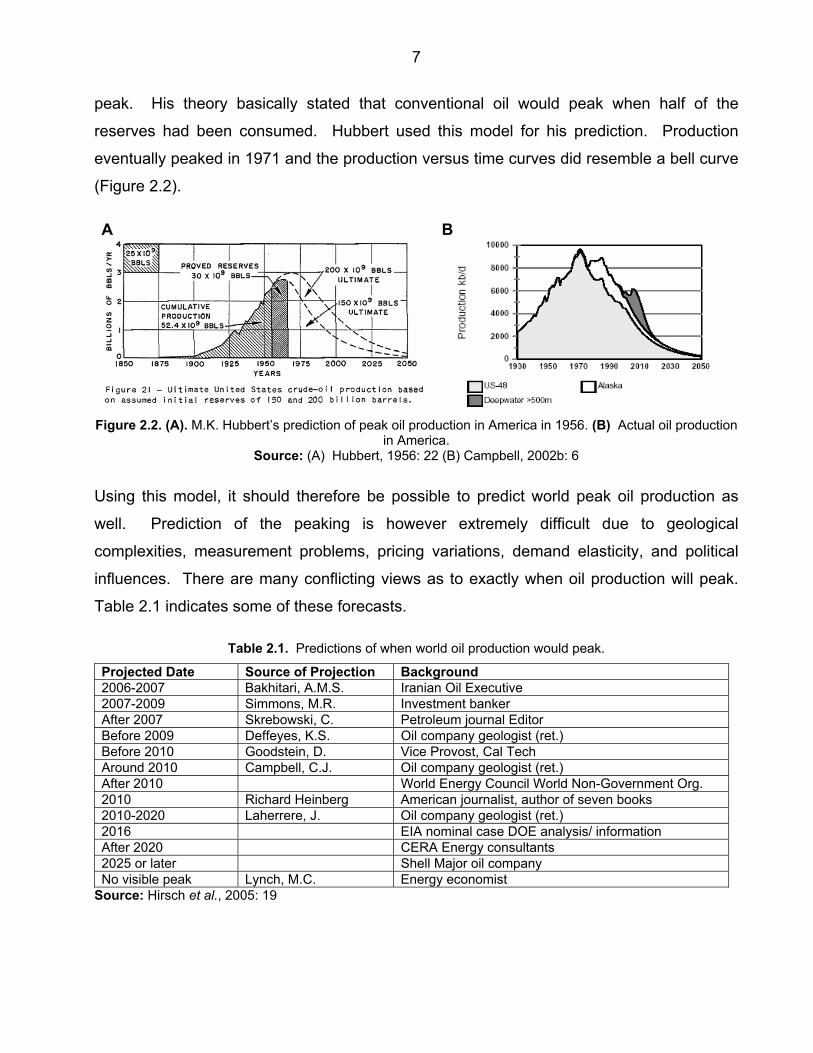
peak. His theory basically stated that conventional oil would peak when half of the
reserves had been consumed. Hubbert used this model for his prediction. Production
eventually peaked in 1971 and the production versus time curves did resemble a bell curve
(Figure 2.2).
A
B
Figure 2.2. (A). M.K. Hubbert’s prediction of peak oil production in America in 1956. (B) Actual oil production
in America. Source: (A) Hubbert, 1956: 22 (B) Campbell, 2002b: 6
Using this model, it should therefore be possible to predict world peak oil production as
well. Prediction of the peaking is however extremely difficult due to geological
complexities, measurement problems, pricing variations, demand elasticity, and political
influences. There are many conflicting views as to exactly when oil production will peak.
Table 2.1 indicates some of these forecasts.
Table 2.1. Predictions of when world oil production would peak.
Projected Date Source of Projection Background 2006-2007 Bakhitari, A.M.S. Iranian Oil Executive 2007-2009 Simmons, M.R. Investment banker After 2007 Skrebowski, C. Petroleum journal Editor Before 2009 Deffeyes, K.S. Oil company geologist (ret.) Before 2010 Goodstein, D. Vice Provost, Cal Tech Around 2010 Campbell, C.J. Oil company geologist (ret.) After 2010 World Energy Council World Non-Government Org. 2010 Richard Heinberg American journalist, author of seven books 2010-2020 Laherrere, J. Oil company geologist (ret.) 2016 EIA nominal case DOE analysis/ information After 2020 CERA Energy consultants 2025 or later Shell Major oil company No visible peak Lynch, M.C. Energy economist
Source: Hirsch et al., 2005: 19

8
An in-depth discussion on exactly when peak oil production could be expected, falls
outside the scope of this study. However, it seems as if most of the specialists agree that it
should be sometime around 2010 (Figure 2.3). Hubbert predicted peak production around
2000 in his paper published in 1956. Since his theory was based on the assumption that
conventional oil production should peak when half of the conventional oil reserves had
been consumed, the Hubbert analysis should use only conventional oil. However, if one
includes the 60 Gb of unconventional oil that is likely to have been produced by 2030, it
creates a relatively conservative estimate of when oil production should peak. Half of the
world’s oil reserves would be 2
2240 =1 120 Gb of which about 1 000 Gb has already been
consumed. Demand for oil is currently approximately 30 Gb per year. Using Hubbert’s
theory with the updated data it can be concluded that conventional oil production will peak
in ≅
−
3010001120 4 years from the time of the study or (2005 + 4) = 2009. Colin
Campbell, who worked under M. King Hubbert recently predicted that oil would peak
around 2010 (Campbell, 2002a).
A B
Figure 2.3. (A) Hubbert’s prediction of world peak oil production published in 1956. (B) Campbell’s prediction of world peak oil production.
Source: (A) Hubbert, 1956: 22 (B) Campbell, 2002a: 05
9
2.2.1 Mitigating factors
Once world oil production has peaked, there is expected to still be large reserves
remaining (Hirsch et al., 2005: 12). Peaking only means that the rate of world oil
production will no longer increase; i.e. production will decline over time. The rate of the
decrease could however be slowed down by a number of factors.
2.2.1.1 Efficiency technology
Technologies that could lead to a decrease in world oil consumption fall into two
categories, namely retrofits and displacements (Hirsch et al., 2005: 37). Retrofit
technologies strive to improve the efficiency of existing vehicles and equipment. These
technologies include replacing less efficient petrol engines with diesel engines, which are
up to 30% more fuel efficient. Displacement technologies would involve replacing existing,
less efficient oil consuming equipment with more economical technologies. A new
technology in early commercial deployment is the hybrid system, which is based on either
petrol or diesel engines and batteries. In all-around driving tests, petrol hybrids have been
found to be 40% more efficient in small cars and 80% more efficient in family sedans.
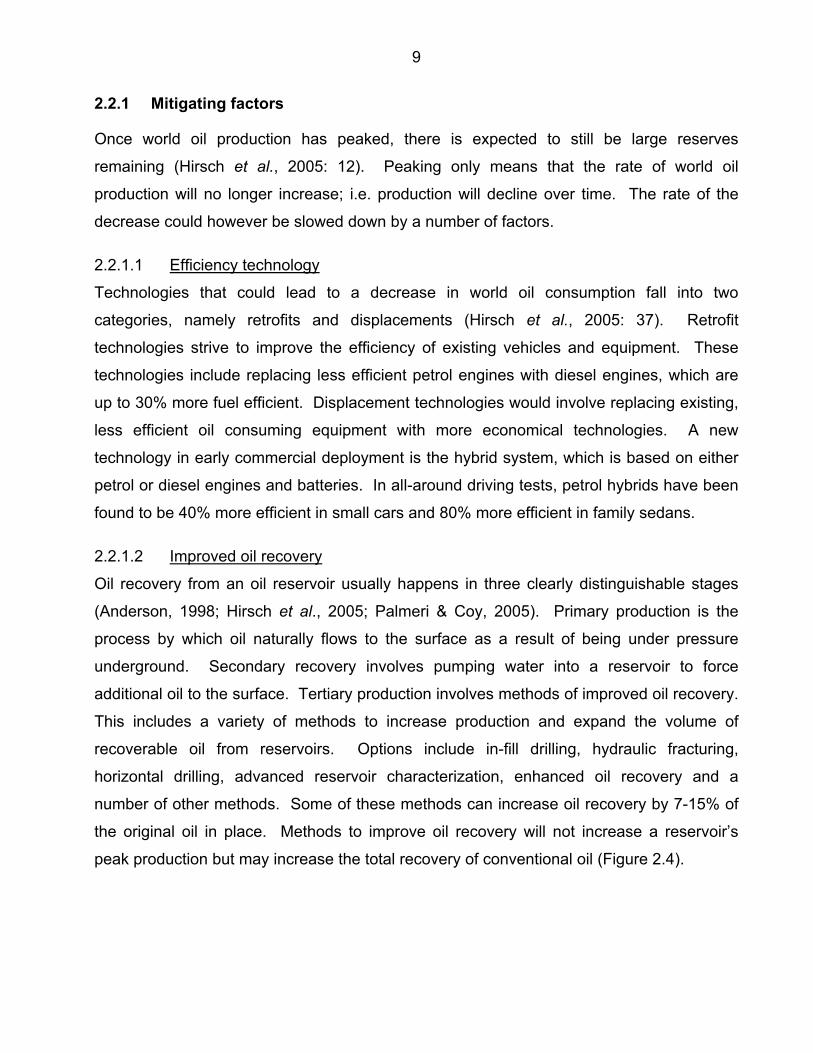
2.2.1.2 Improved oil recovery
Oil recovery from an oil reservoir usually happens in three clearly distinguishable stages
(Anderson, 1998; Hirsch et al., 2005; Palmeri & Coy, 2005). Primary production is the
process by which oil naturally flows to the surface as a result of being under pressure
underground. Secondary recovery involves pumping water into a reservoir to force
additional oil to the surface. Tertiary production involves methods of improved oil recovery.
This includes a variety of methods to increase production and expand the volume of
recoverable oil from reservoirs. Options include in-fill drilling, hydraulic fracturing,
horizontal drilling, advanced reservoir characterization, enhanced oil recovery and a
number of other methods. Some of these methods can increase oil recovery by 7-15% of
the original oil in place. Methods to improve oil recovery will not increase a reservoir’s
peak production but may increase the total recovery of conventional oil (Figure 2.4).
10
Time - Decades
Reservoir Production
Normal production due to primary and secondary recovery
Production improved by enhanced oil recovery
Figure 2.4. The effect of improved oil recovery methods on the production of oil from an oil reservoir. Source: Hirsch et al., 2005: 40
2.2.1.3 Heavy oil and oil sands
This form of unconventional oil includes a variety of viscous oils that are called heavy oil,
bitumen, oil sands, and tar sands (George, 1998; Hirsch et al., 2005: 40). The largest
deposits of these oils exist in Canada and Venezuela, with smaller resources in Russia,
Europe and the United States. These oils have the potential to play a very important role in
satisfying the world’s needs for liquid fuels in the future (Palmeri & Coy, 2005). Both the
Canadian and Venezuelan resources are vast, 3 000 – 4 000 Gb in total. It is however
estimated that only about 600 Gb of this could be recovered economically. This relatively
low recovery is mainly due to the extremely difficult task of extracting these oils.
Processing requires large amounts of natural gas and water which results in significant
CO2 emissions.
2.2.1.4 Gas-to-Liquids (GTL)
Very large reservoirs of natural gas exist around the world (Hirsch et al., 2005). One way
of processing it is to disassociate the methane molecules, add steam, and convert the
resultant mixture to high quality liquid fuels via the Fischer-Tropsch process. This process
results in clean fuels which are ready for use with only modest finishing and blending.
Obtaining liquid fuels from coal, involves gasification of the coal, removal of impurities from
the gas, and then synthesis of liquid fuels using the same Fischer-Tropsch process
described above. Sasol is one of the world leaders in the use of this technology.

11
2.2.1.5 Switching to electricity
Worldwide, electricity is used to a limited extent in the transportation industry (Hirsch et al.,
2005). This is mainly because existing batteries do not provide the vehicle range and
performance that customers demand. This might change if electricity storage improves to
the extent that electric cars can start competing more favourably with fossil fuel powered
vehicles. The price of oil might also encourage consumers to make the switch to electric
automobiles.
2.2.1.6 Renewable liquid fuels
There are a number of different options that might help meet the world’s hunger for
transportation fuel but many of these, including those discussed above, rely on
nonrenewable resources like oil, coal and natural gas as raw material. Fortunately, there is
a group of renewable liquid fuels that could help decrease the demand for oil and hopefully
replace oil as primary liquid fuel in conjunction with other renewable resources. These
include ethanol, methanol, hydrogen and biodiesel. None of these are likely to completely
replace oil on its own, but they will probably all contribute to the world’s liquid fuel
requirements in future. Ethanol will be the focus of this study.
2.2.2 Mitigating scenarios
There are three mitigating scenarios:
Scenario 1: Waiting for peak oil to occur before implementing mitigation programs. This
could leave the world with a significant liquid fuel shortage for roughly 20 years
(Figure 2.5).
Scenario 2: Implementing mitigating programs 10 years before peaking occurs could
decrease the period of liquid fuel shortages by 10 years.
Scenario 3: Implementing mitigation plans 20 years before peaking could effectively
eliminate the possibility of liquid fuel shortages. However, sooner is not necessarily better
because taking action too soon could be costly and may result in a poor use of resources.

12
YEARS BEFORE / AFTER OIL
PRODUCTION(MM bpd)
120
100
80
60
40
20
0-20 -10 0 +10 +20
Extracteddemand
Mitigation
Supply shortfall
Supply = Demand
Figure 2.5. If mitigation starts when world oil production peaks, it could lead to significant supply shortages. Source: Hirsch et al., 2005: 57
Currently, conventional oil is still cheap, making it the preferred resource for the production
of fuel. Over an extended transition time, synthetic fuels made from natural gas (and later
even from coal) using well-known technologies should acquire an increasing market share
(Maly & Degen, 2001). If all the major sources of fossil fuels are utilized at the current rate
of consumption, it is expected to be a long time before we run out. As consumers, we may
view this as a good thing. Whatever happens in the Middle East, oil should remain
plentiful. However, as people concerned about the environment, we should view this as
very bad news. The longer oil remains relatively cheap, the more serious the impact will be
on the environment. The result may be severe environmental damage as well as climate
change. It is therefore vital to find an alternative to fossil fuel that is not only more
environmentally friendly, but also sustainable.
2.3 THE ENVIRONMENT
Most of the world’s economies still depend on the production and trade of oil, which can
cause severe damage to the environment, either knowingly or unintentionally. There are
two ways in which oil negatively impact on the environment, namely during extraction and
when it is burned as fuel (EcoSystems, 2006).

13
2.3.1 Impact of oil extraction on the environment
The oil production process can be divided into a number of different steps, each of which
affects the environment differently (Kharaka & Otton, 2003). Oil production starts with
exploration and extraction followed by transportation and storage and lastly refining.
Exploration requires the use of loud, low frequency seismic guns to map off-shore oil fields.
These can cause injury to marine mammals, even if the area is screened for their presence
(ESA21, 2004). Extraction can have a considerable environmental footprint. It requires
moving heavy equipment into remote environments (Dabbs, 1996). Clearing land for roads
and platforms can lead to deforestation and erosion. Drilling during both exploration and
extraction uses significant quantities of water. The water becomes contaminated through
drilling and is then discharged into the environment. The physical alteration of
environments during these operations can be greater than that of a large oil spill
(Figure 2.6). Major impacts include deforestation, destruction of ecosystems, chemical
contamination of land and water, long term harm to animal populations, human health and
safety risks and displacement of indigenous communities.
Figure 2.6. Oil extraction in the Los Angeles basin in the 1920s. Source: Campbell & Lailai, 1998: 78
The separation between the location of oil reserves and the location of oil consumption
requires that crude oil be transported great distances to refineries and consumer markets
(O'Rourke & Connolly, 2003: 587). Transportation of oil occurs via supertankers, barges,
trucks and pipelines. Oil transportation results in regular oil spills throughout the world.

14
Although large spills are well publicized, smaller yet cumulatively significant spills from
shipping, pipelines and leaks often go undocumented. Accidents occur along all segments
of the transport system and at each point of transfer. These smaller spills generate an
unknown and unrecorded amount of waste. Transport by water is currently more likely to
result in a spill than transport by pipeline. These oil spills cause significant damage to
marine ecosystems and also threaten human health through illness and injury during the
spill, during cleanup, and through consumption contaminated fish or shellfish.
Oil in its crude form has limited uses (ESA21, 2004; O'Rourke & Connolly, 2003). It must
be separated, converted, and refined into useful products such as petrol, heating oil, jet
fuel and petrochemical feedstock. Basic oil refining uses intense heat and pressure to
physically break large molecules into smaller ones. All the useful constituents of crude oil
are sold and the rest is captured by pollution control technologies or released into the
environment. Refineries produce large volumes of air, water, solid, hazardous and toxic
waste. Toxic substances include benzene, ethyl benzene, mixed xylenes and n-heptane
(see Appendix 1 for toxic effects).
Lastly, oil can also cause environmental damage as a result of conflict over oil-producing
regions (Dabbs, 1996). Environmental harm associated with oil resources can either be
attributed to a side-effect of conflict, or, in some cases, it is associated with military
aggression that is intended to damage the natural resources of the region.
2.3.2 Impact of oil usage on the environment
The environmental damage from oil ranges from the sublime to harsh (ESA21, 2004). The
burning of oil products in cars produces greenhouse gases and pollutants such as ground-
level ozone and particulate matter. This contributes to numerous environmental impacts
including air pollution, water pollution and global warming (O'Rourke & Connolly, 2003).
Oil-based fuels like petrol and diesel are composed of hydrocarbons, which include a
number of carcinogenic compounds. In addition, substances like alkyl lead oxygenates,
and other aromatic compounds are added to petrol to improve its performance during
combustion. The acute and chronic health effects from exposure to petrol and its additives
include cancer, central nervous system toxicity and poisoning from additives. The

15
environmental and health impacts of air pollution from gasoline combustion tend to occur
disproportionately among low-income communities. For example, although leaded petrol is
banned in the United State and many other countries in the world, it is still widely used in
the developing world causing residents to be exposed to lead emissions.
Global climate change is increasingly recognized as the main threat to the continued
development and survival of humanity (DOE, 2006a). There are a few key indicators of
global warming, namely heat waves and periods of unusually warm weather as well as
Arctic and Antarctic warming which cause glaciers to melt. This causes sea levels to rise
which leads to coastal flooding. Recent examples of devastating climatic episodes include,
Hurricane Mitch in Central America in 1998 (10 000 dead), flooding in Bangladesh in 1998,
severe storms and flooding in Venezuela in 1999 (20 000 dead, 150 000 homeless) and
flooding in Mozambique in 2000 and 2001.
Looking at man’s contribution to greenhouse gasses in the atmosphere it is almost
unimaginable to think that human activities can have a significant impact on global
temperatures (Table 2.2). There are a number of different theories on this issue; the most
widely accepted one proposes a “positive feedback loop”. It states that man-made
emissions of greenhouse gases warms climate slightly. This extra warming increases
water vapor emissions which in turn warm the climate a bit more, and so on, ending in a
significant effect on global climate over time.
Table 2.2. Global natural and anthropogenic sources of greenhouse gases in the 1990s.
Sources Gas Natural Human-Made Total Carbon Dioxide 770 000,0 23 100,0 793 100,0 Methane 239,0 359,0 576,0 Nitrous Oxide 9,5 6,9 16,4 Source: DOE, 2006b: 5
A major international analysis of climate change recently concluded that the reliance of the
world economy on fossil fuel – coal, fuel oil and natural gas - is to blame for global warming
(O'Driscoll & Vergano, 2007). In 2001 scientists were 66% certain that fossil fuel is to
blame for global warming. This figure had changed to 99% in 2007.
16
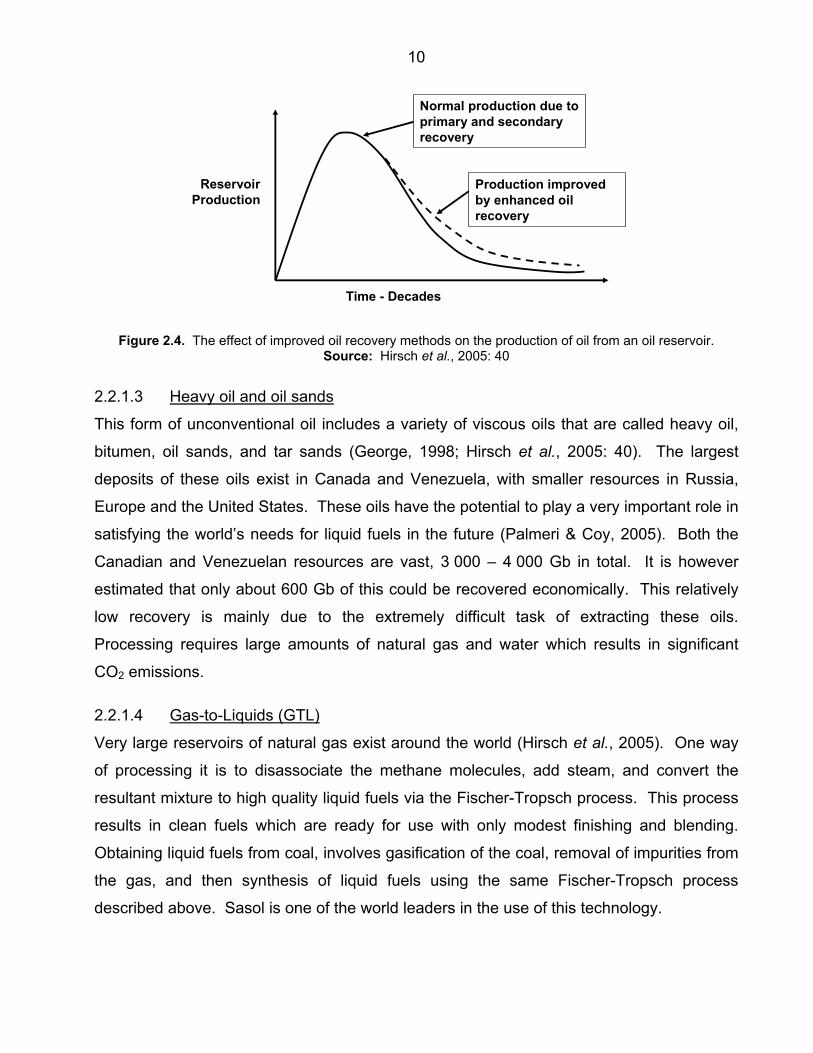
Putting all the blame for global warming on the transport sector is also not fair. However,
reducing emissions in the transport sector is a good start since it is the major contributor to
greenhouse gas emissions in the United States (Figure 2.7) (Kluger, 2007).
Transportation33%
Industrial28%
Commercial17%
Residential21%
Other1%
Figure 2.7. Sources of CO2 emissions in the United States. Source: Kluger, 2007
Exactly what the future holds for transportation is not at all clear but it is highly unlikely that
fossil fuel will continue to play such an important role. It is further unlikely that a single fuel
source would replace fossil fuel.
2.4 OIL DISTRIBUTION
Both of the above arguments for finding alternatives to oil, namely peak oil and
environmental concern are good arguments, but there are strong opposing theories for
both. Even though Hubbert predicted peak oil in the United States relatively accurately in
1965, in 1920 the United States Geological Survey officially estimated that the United
States had only 6,7 Gb of oil left, including undiscovered oil (O'Toole, 2007). Eighty-two
year later, the United States had produced 180 Gb of oil and had 22 Gb of proven
reserves. For many years, doomsayers predicted that there is a fixed amount of oil in the
world and that someday we will without a doubt see prices rise due to disappearing
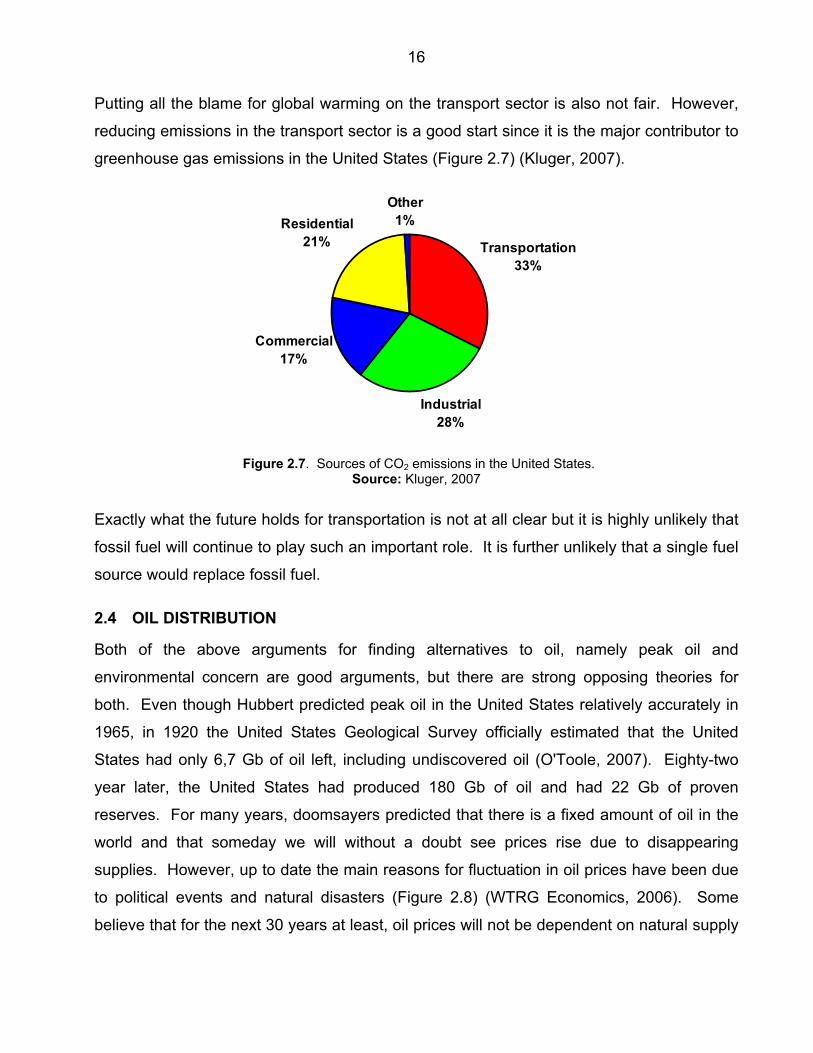
supplies. However, up to date the main reasons for fluctuation in oil prices have been due
to political events and natural disasters (Figure 2.8) (WTRG Economics, 2006). Some
believe that for the next 30 years at least, oil prices will not be dependent on natural supply

17
and that there will still be plenty of oil in the ground after cheap oil has been exhausted.
Extraction costs may increase but those costs may not lead to significantly higher fuel
prices for many decades. There is also the theory of the abiogenic origin of oil. The
original theory by Dmitri Mendeleev (1877) proposes that oil originated from carbon-
bearing fluids that migrated upward from the earth’s mantle and therefore did not have a
biological origin (Lur'e, Kurets & Shmidt, 2004; Mendeleev, 1877). If this theory is true, it
would be impossible to determine the size of the earth’s oil resources.
20
10
50
60
1970 2000198519801975
30
40
1990 2005
$/ba
rrel
70
1995
Arab OilEmbargo
Downturnbegins
1986“Crash”
Gulf War
Yom Kippur War
IranianRevolution
Iran/IraqWar
OPEC 10% Quota increase
Iraq War
9/11
Series of OPEC cuts
Figure 2.8. The price of oil during the last 36 years. Source: WTRG Economics, 2006
Protecting the earth against the damaging effects of carbon dioxide that are produced
whilst burning fossil fuel is a compelling reason for finding an alternative to oil. However,
there are those who believe carbon dioxide is not the cause of global warming. American
hurricane forecaster, William Gray, recently stated that global ocean currents were
responsible for global warming and that Earth might begin to cool on its own in 5 to 10
years (News24, 2007).

18
If neither future oil supply nor global warming is the reason for the frantic search for
alternatives to oil, what is? The answer probably lies in the distribution of oil reserves
around the world (Figure 2.9) (Ahlbrandt, Pierce & Nuccio, 2003). The world’s oil
resources are located in only a few countries leaving most without direct access to oil.
With the price of oil above US$ 50 a barrel, with political instability in the Middle East, and
with little slack in the world oil economy, many countries, especially the United States, are
striving towards oil independence. Following the 1973 Arab oil embargo, the idea of oil
independence captured the imagination of Americans (American Energy Independence,
2006). Improvements in automobile fuel efficiency and new oil discoveries created a
surplus of oil in the world market during the 1980’s and America’s enthusiasm for energy
independence faded. After the 9/11 attack on the World Trade Centre and the ensuing
war in the Middle East, the idea of American energy independence has returned, becoming
a powerful force shaping the political views of Americans. Oil is no longer viewed as just
another commodity. In the minds and hearts of the Americans, oil has become associated
with terrorism, political corruption, corporate greed, and global warming.
Figure 2.9. Map of the world showing the major oil producing countries. Source: Ahlbrandt et al., 2003
19
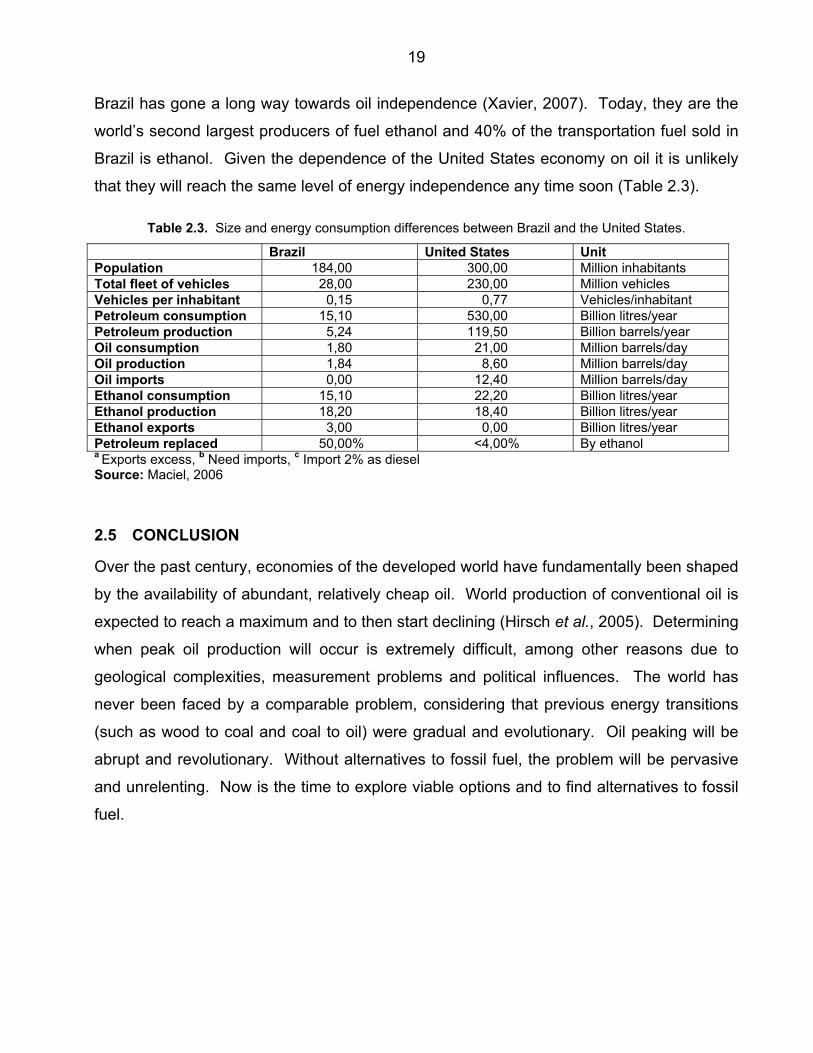
Brazil has gone a long way towards oil independence (Xavier, 2007). Today, they are the
world’s second largest producers of fuel ethanol and 40% of the transportation fuel sold in
Brazil is ethanol. Given the dependence of the United States economy on oil it is unlikely
that they will reach the same level of energy independence any time soon (Table 2.3).
Table 2.3. Size and energy consumption differences between Brazil and the United States.
Brazil United States Unit Population 184,00 300,00 Million inhabitants Total fleet of vehicles 28,00 230,00 Million vehicles Vehicles per inhabitant 0,15 0,77 Vehicles/inhabitant Petroleum consumption 15,10 530,00 Billion litres/year Petroleum production 5,24 119,50 Billion barrels/year Oil consumption 1,80 21,00 Million barrels/day Oil production 1,84 8,60 Million barrels/day Oil imports 0,00 12,40 Million barrels/day Ethanol consumption 15,10 22,20 Billion litres/year Ethanol production 18,20 18,40 Billion litres/year Ethanol exports 3,00 0,00 Billion litres/year Petroleum replaced 50,00% <4,00% By ethanol a Exports excess, b Need imports, c Import 2% as diesel Source: Maciel, 2006
2.5 CONCLUSION
Over the past century, economies of the developed world have fundamentally been shaped
by the availability of abundant, relatively cheap oil. World production of conventional oil is
expected to reach a maximum and to then start declining (Hirsch et al., 2005). Determining
when peak oil production will occur is extremely difficult, among other reasons due to
geological complexities, measurement problems and political influences. The world has
never been faced by a comparable problem, considering that previous energy transitions
(such as wood to coal and coal to oil) were gradual and evolutionary. Oil peaking will be
abrupt and revolutionary. Without alternatives to fossil fuel, the problem will be pervasive
and unrelenting. Now is the time to explore viable options and to find alternatives to fossil
fuel.

20
CHAPTER 3 ALTERNATIVES TO FOSSIL FUEL
3.1 INTRODUCTION
There are a number of reasons why oil became and has remained the preferred
transportation fuel for so long. These include the following:
• It is very abundant and therefore relatively cheap.
• It is rich in energy.
• It is liquid (making it easy to transport and store).
• It works in internal-combustion engines (British Columbia Hydro and Power Authority,
2002).
Therefore, to be able to compete in the transportation industry of the future, candidate fuels
should preferably exhibit most of these characteristics. To be viable as a biofuel it should
in addition
• provide a net energy gain;
• have environmental benefits;
• be economically competitive; and
• be producible in large quantities without reducing food supplies (Hill, Nelson, Tilman,
Polasky & Tiffany, 2006)
The best known alternatives that meet these criteria are hydrogen, biodiesel, methanol and
(bio)ethanol (Maly & Degen, 2001). These fuels have the added advantage that unlike oil,
they are all renewable. The most common definition for renewable energy is that it is an
energy resource that is replaced by a natural process at a rate that is equal to or faster
than the rate at which that resource is being consumed.
3.2 HYDROGEN
Hydrogen is the most abundant element on the planet and is a promising alternative fuel
(Choe, 2004). It is environmentally safe with none of the detrimental effects presented by
fossil fuels in the form of carbon dioxide and other forms of pollution. Hydrogen provides a
great deal of versatility in terms of its usage. However, the current focus of hydrogen
research is towards the development of hydrogen fuel cell technology. The automotive

21
industries of the United States, Europe and Japan have made considerable investments in
this field. This has led to considerable progress towards increasing its viability in the
transportation sector.
Unfortunately, hydrogen in its raw form is difficult to obtain and the amount of energy
required to extract it is roughly equal to its energy output. This creates an imbalance that
raises questions about the economic viability of hydrogen as transportation fuel.
Furthermore, the size and weight of the fuel cells themselves present a significant obstacle
to the automotive industry that seeks to maximize vehicle efficiency.
3.3 BIODIESEL
Biodiesel is a clean-burning fuel extracted from fats and vegetable oils (Choe, 2004). It is
produced when vegetable or animal fats (typically soybean oil or waste cooking oil) are
separated into glycerin and methyl esters by a process known as transesterfication.
Advantages of biodiesel are the fact that it is produced from abundant, recyclable material
often found as waste products with only glycerin as byproduct and that it burns cleaner
than fossil fuels. Unfortunately, like hydrogen, its viability as a substitute to fossil fuels is
limited. The major limiting factors are the production cost, which is currently higher than
normal diesel, and the availability of oil. The African Sustainable Fuels Centre calculated
that biodiesel only becomes profitable at a crude oil price of US$ 76 per barrel (assuming
an exchange rate of R7,35 for 1 US$) (African Sustainable Fuels Centre, 2006)
(Appendix 3).
3.4 METHANOL
Methanol is a colourless, light-weight, combustible compound with a very wide range of
applications. It is primarily produced from biological material, coal or natural gas. Even
though there are vehicles that can run solely on methanol, as transportation fuel methanol
is most commonly blended with conventional fossil fuels to produce a cleaner-burning
petrol oxygenate. Because of the high energy input requirements in the production
process, methanol as a stand-alone fuel has no cost benefits associated with switching
from fossil fuels to methanol.

22
Considerable research has been done on the development of methanol as a producer of
hydrogen fuel. Whether reformed to provide hydrogen for conventional fuel cells or used
directly in the latest liquid-fed cells, the prospects of methanol in the hydrogen fuel industry
are optimistic since it currently offers the only economical way to transport and store the
hydrogen used in fuel cells. Technology using methanol as an efficient hydrogen energy
carrier are still being discovered and developed.
3.5 ETHANOL
The use of ethanol as a transport fuel dates back to the early part of the 20th century. In
the 1920s, Henry Ford's Model T was designed to run on alcohol, petrol or any mix of the
two (Askew, 2003). No modern vehicle with a normal internal combustion engine designed
for use with fossil fuel can run on pure ethanol, therefore it is currently blended with fossil
fuels at a ratio of about 1 to 10 to form what is known as a petrol oxygenate. This mixture
burns cleaner than petrol and has a higher octane level, increasing fuel efficiency.
Ethanol offers a wide range of benefits (cleaner fuel, recyclable inputs and by-products,
etc.), yet there are several hurdles that must be overcome before ethanol will be able to
compete with fossil fuels as transportation fuel.
3.6 CONCLUSION
Petrol is undoubtedly a convenient fuel for cars. It is relatively cheap, has a high energy
density and is easy to store and handle (Figure 4.2). In most countries, the production of
alternative fuels is not at present commercially viable without some form of governmental
assistance, such as subsidies or tariffs. While these alternative fuels have not made a
significant impact worldwide (mainly because they involve more compromises than petrol),
they already have a role to play in areas with special requirements, such as cities with
extreme air pollution, or in undeveloped countries with no indigenous oil deposits.
Nevertheless, alternative fuels will become increasingly important as global concern for the
environment increases and the availability of cheap oil decreases.

23
CHAPTER 4 IMPACT OF ETHANOL ON THE ENVIRONMENT
4.1 INTRODUCTION
Ethanol is a high-performance fuel with a pump octane number of 116 (Brekke, 2007).
This is one of the reasons why the IndyCar Racing League switched to 100% ethanol at
the beginning of the 2007 racing season. The league began the transition from methanol
to ethanol during the 2006 season with a 90% methanol, 10% ethanol fuel blend. In 2007
100% ethanol will be the fuel of choice. Pure, 100% ethanol is not generally used as a
motor fuel. A percentage of ethanol is usually combined with unleaded petroleum
(American coalition for ethanol, 2007). This is beneficial because the ethanol decreases
the fuel’s cost (depending on production method used); increases its octane rating and
decreases its harmful emissions. Any amount of ethanol can be combined with petroleum,
however the most common blends are, E10 (10% ethanol and 90% unleaded petroleum)
and E85% (85% ethanol and 15% unleaded petroleum).
The use of ethanol as transportation fuel has a number of advantages over fossil fuel and
some of the other alternatives. Unfortunately, there are disadvantages to the use of
ethanol as well.
4.2 ADVANTAGES OF ETHANOL USE
4.2.1 Compatibility with existing technology
E10 is approved for use in any make or model of petrol vehicle sold in the United States
(Collingwood Ethanol, 2006). In fact, all petrol vehicles can run on E10 with no
modification to the engine. Many manufacturers even recommend its use because of its
high performance and clean burning characteristics. In the United States, 46% of fuel sold
contains ethanol; most of it is the E10 blend (American coalition for ethanol, 2007). E85 is
used in flexible fuel vehicles. America currently has more than 6 million of these flexible
fuel vehicles. These vehicles have the advantage of being able to run on straight
petroleum or any ethanol blend up to 85%. In a research project, the American Coalition

24
for Ethanol drove a non-flexible fuel 2001 Chevrolet Tahoe for more than 160 000 km
almost exclusively on E85.
4.2.2 Environmental benefits
According to the United States Environmental Protection Agency, fossil fuel-based
petroleum is the largest source of man-made carcinogens and the number one source of
toxic emissions (American coalition for ethanol, 2007). Ethanol is a renewable,
environmentally friendly fuel that is inherently cleaner than petroleum. It cuts down on
harmful tailpipe emissions of carbon monoxide, particulate matter, oxides of nitrogen and
other ozone-forming pollutants. Scientists at the U.S. Department of Energy Argonne
National Laboratory have estimated a 12 to 19% reduction of greenhouse gas emissions
(carbon dioxide, methane and nitrous oxide) when using an E10 blend (Wang, Saricks &
Santini, 1999). It also reduces emissions of carbon monoxide by 30%, fine particle mass
by 50%, toxins by 13% and volatile organic compounds by 12% (Whitten, 2003).
Adding an oxygenate to petroleum allows for more complete combustion, thereby reducing
exhaust emission of carbon monoxide, which can result in lower levels of toxic, ozone
forming pollutants and greenhouse gases (SECO, 2007). Currently the two oxygenate
additives that are being used are methyl tert-butyl ether (MTBE) and ethanol. Both of
these benefit air quality in similar ways. Although MTBE improves air quality, it can
contaminate surface and ground water supplies and therefore require treatment (Stephens,
2001). After it was proven to be a carcinogenic groundwater pollutant, the US Clean Air
Act Amendments of 1990 recommended the addition of ethanol instead of MTBE to
oxygenate petroleum. Ethanol has all the advantages of MTBE without the same dangers,
and it has twice the oxygen of MTBE.
Another important environmental benefit of ethanol is the fact that is nontoxic, soluble in
water and biodegradable. When spilt on land or in water, ethanol is quickly degraded
naturally. Furthermore, the presence of ethanol in petroleum proportionally reduces the
amounts of other toxic components initially present, such as benzene and sulfur.

25
All plants remove carbon dioxide from the air as they grow and therefore have the potential
to slow the buildup of this greenhouse gas in earth's atmosphere (Figure 4.1). Unlike fossil
fuels, which simply release more and more of the carbon dioxide that has been in geologic
storage for millions of years, energy crops "recycle" carbon dioxide over and over again,
with each year's cycle of growth and use (Bioenergy Feedstock Development Program,
2005a).
Atmospheric CO2
Processing
Fuel (e.g. ethanol)Biomass
Photosynthesis Utilization
Electricity
Transportation workSunlight
Figure 4.1. Ethanol represents a closed carbon cycle. Source: Chandel, Chan, Rudravaram, Narasu, Rao & Ravindra, 2007
4.2.3 Job creation
Depending on the method used, ethanol production can create a large number of jobs for
local communities (African Sustainable Fuels Centre, 2006; American coalition for ethanol,
2007). Economic studies showed that approximately 370 jobs are created during the
construction of an ethanol plant, while plant operation can create as many as 4 000 jobs.
This represents a significant income for local communities. In South Africa, E10 has the
potential to create about 50 000 direct jobs, mostly in rural areas.
4.2.4 Agricultural benefits
Ethanol production and use stimulates rural economic development (African Sustainable
Fuels Centre, 2006; American coalition for ethanol, 2007). Because ethanol is mostly
made from sugarcane, maize and other agricultural products, it increases the demand for
these crops. This leads to increases in prices farmers receive for these crops and brings
26
economic development opportunities to the rural areas where ethanol is made. Studies in
the United States have shown that the local price of maize increased by between 5 and
10% in the area around an ethanol plant, adding significantly to the farm income in the
area.
4.2.5 Energy security and independence
Renewable ethanol directly replaces the crude oil that most countries need to import,
offering independence and security from foreign sources of energy (African Sustainable
Fuels Centre, 2006; American coalition for ethanol, 2007). Research has shown that a litre
of ethanol displaces 1.2 litres of petroleum at the refinery. By producing ethanol, many
countries will be able to reduce their deficits.
4.2.6 Other advantages
The use of fuel ethanol has a number of other minor benefits. Ethanol burns cooler than
petroleum and thus prevents engine valves from burning. It has the ability to absorb water,
which prevents condensation in fuel lines. It therefore acts as an antifreeze agent.
Because ethanol helps petroleum burn completely, it reduces the buildup of gummy
deposits in the engine.
4.3 DISADVANTAGES OF ETHANOL USE
4.3.1 Environmental impact
Many regard fuel ethanol as a solution to air pollution. The general feeling is that since
ethanol burns cleaner than petrol, it emits fewer unhealthy emissions (carbon monoxide,
nitrogen oxides and other hydrocarbon emissions) and creates less smog. This is certainly
the case and most publications on the environmental impact of ethanol usage focus on
these properties of fuel ethanol. It is, however, a well-known fact that the combustion of
ethanol in spark ignition engines leads to increased levels of acetaldehyde and
formaldehyde emissions. (Nguyen, Takenaka, Bandow, Maeda, De Oliva, Botelho &
Tavares, 2001). Ethanol is blended with petroleum in various amounts, or can be used
without petroleum, however using ethanol without petroleum increases the emissions of
aldehydes (Patzek, Pimentel, Wang, Saricks, Wu, Shapori & Duffield, 2007). Aldehydes,
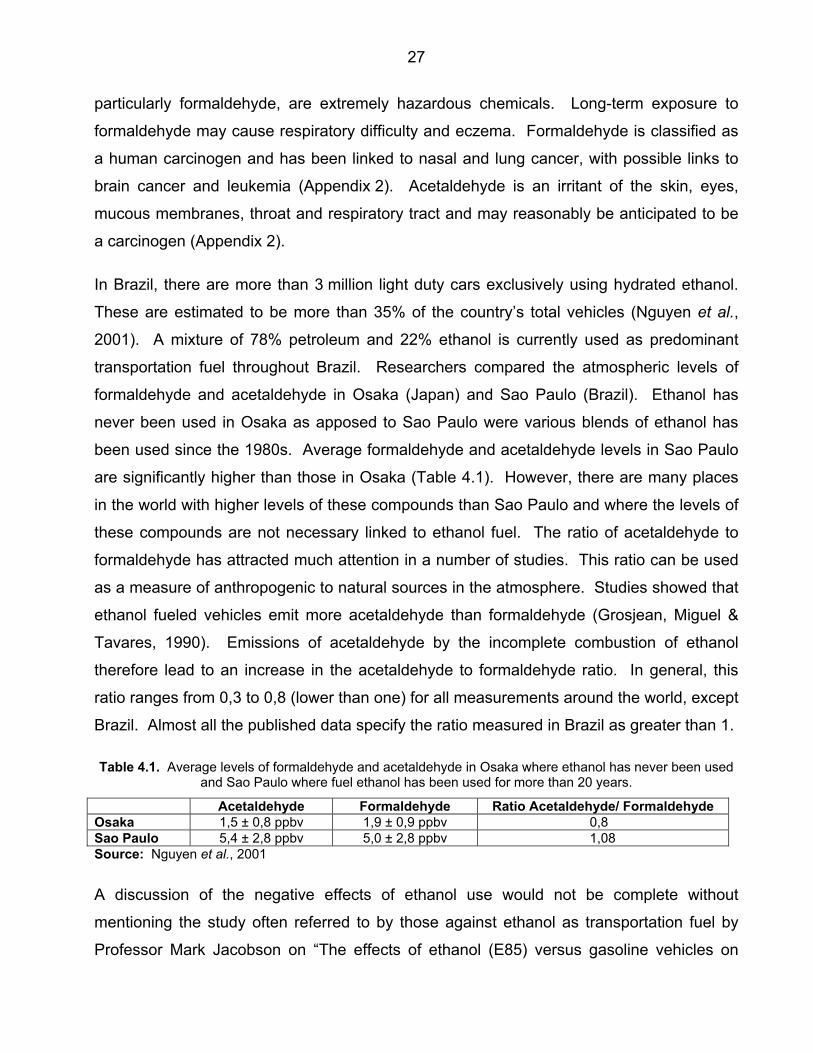
27
particularly formaldehyde, are extremely hazardous chemicals. Long-term exposure to
formaldehyde may cause respiratory difficulty and eczema. Formaldehyde is classified as
a human carcinogen and has been linked to nasal and lung cancer, with possible links to
brain cancer and leukemia (Appendix 2). Acetaldehyde is an irritant of the skin, eyes,
mucous membranes, throat and respiratory tract and may reasonably be anticipated to be
a carcinogen (Appendix 2).
In Brazil, there are more than 3 million light duty cars exclusively using hydrated ethanol.
These are estimated to be more than 35% of the country’s total vehicles (Nguyen et al.,
2001). A mixture of 78% petroleum and 22% ethanol is currently used as predominant
transportation fuel throughout Brazil. Researchers compared the atmospheric levels of
formaldehyde and acetaldehyde in Osaka (Japan) and Sao Paulo (Brazil). Ethanol has
never been used in Osaka as apposed to Sao Paulo were various blends of ethanol has
been used since the 1980s. Average formaldehyde and acetaldehyde levels in Sao Paulo
are significantly higher than those in Osaka (Table 4.1). However, there are many places
in the world with higher levels of these compounds than Sao Paulo and where the levels of
these compounds are not necessary linked to ethanol fuel. The ratio of acetaldehyde to
formaldehyde has attracted much attention in a number of studies. This ratio can be used
as a measure of anthropogenic to natural sources in the atmosphere. Studies showed that
ethanol fueled vehicles emit more acetaldehyde than formaldehyde (Grosjean, Miguel &
Tavares, 1990). Emissions of acetaldehyde by the incomplete combustion of ethanol
therefore lead to an increase in the acetaldehyde to formaldehyde ratio. In general, this
ratio ranges from 0,3 to 0,8 (lower than one) for all measurements around the world, except
Brazil. Almost all the published data specify the ratio measured in Brazil as greater than 1.
Table 4.1. Average levels of formaldehyde and acetaldehyde in Osaka where ethanol has never been used and Sao Paulo where fuel ethanol has been used for more than 20 years.
Acetaldehyde Formaldehyde Ratio Acetaldehyde/ Formaldehyde Osaka 1,5 ± 0,8 ppbv 1,9 ± 0,9 ppbv 0,8 Sao Paulo 5,4 ± 2,8 ppbv 5,0 ± 2,8 ppbv 1,08 Source: Nguyen et al., 2001
A discussion of the negative effects of ethanol use would not be complete without
mentioning the study often referred to by those against ethanol as transportation fuel by
Professor Mark Jacobson on “The effects of ethanol (E85) versus gasoline vehicles on

28
cancer and mortality in the United States” (Jacobson, 2007). This study model the
potential cancer risk and ozone-related health consequences associated with the large
scale use of fuel ethanol in 2020. Jacobson used a sophisticated 3-D computer model to
predict atmospheric conditions in 2020 if petrol or E85 is used as transportation fuel. The
output of the model is then combined with health effect and pollution data to determine
health risks posed by ethanol. The conclusion of the study is that switching to E85 would
lead to an increase of 185 ozone related deaths per year in the United States, 120 of those
in Los Angeles. The model also predicts that the ratio of acetaldehyde to formaldehyde will
be above 4, indicative pollution caused by ethanol use.
To conclude the formaldehyde discussions, it is important to mention that the California
Environmental Policy Committee found that while ethanol does result in slightly increased
levels of acetaldehyde and peroxyacetyl nitrate (a breakdown product of acetaldehyde),
“these compounds are more than offset by reductions in formaldehyde” a toxic air
contaminant many times more harmful than acetaldehyde (New England Interstate Water
Pollution Control Commission, 2001). Computer models used by the United States
Environmental Protection Agency predicts that acetaldehyde emissions will increase by 50
to 70% if ethanol replaces MTBE but formaldehyde levels are predicted to decrease by
15% under the same scenario.
4.3.2 Energy density
The energy density of ethanol is lower than that of diesel and petrol (Figure 4.2). Because
the energy content of a litre of fuel ethanol is approximately 70% that of petrol, it requires
that ethanol cost estimates be multiplied by a factor of 1,46 for expression in terms of petrol
energy equivalents.

29
0
2
4
6
8
10
12
Die
sel
Gas
olin
e
Eth
anol
LPG
LNG
Met
hano
l
LH2
CN
G (3
00 b
ar)
H2
(300
bar
)
Ti-F
e-hy
drid
e
Na/
S
Pb/
PbO
kWh/kg kWh/L
Figure 4.2. Energy densities of various energy storage systems. Abbreviations: Liquid petroleum gas (LPG), Liquid Natural Gas (LNG) and Liquid H2 (LH2).
Source: Maly & Degen, 2001
4.3.3 Pipelines
Pipelines are generally the fastest and most economic method for transporting liquid fuels
(Whims, 2002). Currently, a substantial portion of both petroleum and natural gas are
transported from refineries and other production centers to destinations via pipeline. The
movement of ethanol via pipeline is unfortunately not considered viable for three reasons.
• Ethanol absorbs water and impurities normally found in fuel pipelines. As a result,
transportation and storage systems used for ethanol/petrol blends must be kept free
of water. Water can cause phase separation of the ethanol-petrol blend, which
reduces engine performance. Transportation pipelines could be cleaned to permit the
shipment of ethanol-petrol blends but most companies are reluctant to invest in such
a system upgrade. It is difficult to estimate the costs of keeping the pipeline system
moisture free since it has never been done on a regular basis.
• The location of fuel transportation pipelines is another limitation. Most pipelines
transport product from oil fields to refineries, where it often needs to be stored before

30
continuing distribution. Because ethanol could not be mixed with other fuels and
because of problems associated with its water solubility, it would need designated
tanks for storage.
• A final concern is that the volume of individual ethanol shipments is very small
compared to the quantities of product that are normally shipped via pipeline.
Pipelines that are shared with other fuels would require sufficient volumes of ethanol
to warrant special handling in the system.
4.3.4 Volatility
Ethanol increases the tendency of fuel to evaporate (the volatility) during warm weather
(Wen, Ignosh & Arogo, 2007). Reformulated petrol in smog prone areas requires refineries
to manage the components in petrol fuel in order to reduce the volatility. It is mandatory for
ethanol-blended fuels to meet the same evaporative emissions standards as conventional
petrol.
4.3.5 Impact of ethanol production
The impact of ethanol production on the environment can be significant depending on the
process and the crops used. It is therefore more appropriate to look at these in a
discussion on crops that could be used for ethanol production.
4.4 CONCLUSION
Ethanol is a renewable fuel that has many benefits. It is more carbon-neutral than
fossil-fuel derived fuels, therefore the production and use of ethanol as transportation fuel
will help to diminish man-made contributions to the greenhouse effect. However, it is also
important to consider the disadvantages of using ethanol. Future research and
development on ethanol should therefore be directed towards eliminating, or at least
minimizing, the impact of these problems, in order for ethanol to become one of the viable
alternatives to petrol.

31
CHAPTER 5 RAW MATERIALS
5.1 INTRODUCTION
There are three types of raw material that could be used for bioethanol production, namely,
sugar, starch and cellulose. In 2005, 61% of the world’s bioethanol came from sugar and
the remaining 39% from starch (Berg, 2004). Since the technology for the production of
ethanol from cellulose is still under development, there are no large scale production
facilities able to utilize this resource yet. However, once established, cellulosic ethanol has
the potential to revolutionize the renewable energy industry.
5.2 SUGAR
Worldwide, sugar is produced from two crops, namely sugarcane and sugar beet.
Sugarcane accounts for 70% of sugar produced with sugar beet making up the remaining
30%. The scientific name for sugar is sucrose. It is a disaccharide, consisting of two sugar
molecules, namely glucose and fructose (Figure 5.1).
CH2OH
O
HOOH
OH
O
OH
O
HOH2C
CH2OHHO
Glucose Fructose
Figure 5.1. Sucrose consists of a glucose and fructose molecule linked to each other. Source: Bohinski, 1987
5.2.1 Sugarcane
Sugarcane is a perennial tropical crop, which is processed into raw sugar and molasses.
The highest latitudes at which sugarcane is grown are in KwaZulu - Natal, in South Africa,
Argentina and at the southern extremes of the Australian continent (approximately 30°S),
and at 34°N in northwest Pakistan, and 37°N in southern Spain (Sharpe, 1998). When
32
planted for the first time, it takes between 9 and 24 months before it is ready for the first
harvest (Sharpe, 1998; Smeet, Junginger, Faaij, Walter & Dolzan, 2006). The same
plantation can be harvested up to five times, although intensive soil treatment is necessary
to maintain productivity. Sugar content typically declines by approximately 15% after the
first harvest and 6 - 8% every year in the years that follow. In Brazil, sugar production is
very labour intensive, with 75% of the harvesting being done by hand. There are many
different cultivars of sugarcane, but hybrids with favourable characteristics (e.g. pest
resistance, improved yield and low fibre content) are most often used. Cane yields per
hectare vary widely, depending on the variety, season and location. Yields typically range
between 90 - 110 tons of cane per hectare (35 t/ha dry mass). The cane is where the
sugar (sucrose) is stored. The sugar content of mature cane is approximately 10 - 13% of
the weight of the cane, yielding roughly 10 t/ha. The highest yields, 22 tons of sucrose per
hectare are found in Hawaii, but these crops take two or more years to mature.
Once harvested the sugarcane should be transported and processed as quickly as
possible since delays can lead to significant losses in the amount of sucrose per ton
(Smeet et al., 2006). The cane is washed and shredded at the sugar mill (Figure 7.1).
After these pretreatments, it is extracted into juice and bagasse (the fibre residue). The
bagasse is used as fuel to heat boilers for the production of steam and electricity. Some
boilers produce enough electricity for own use as well as for supplying to the grid. The
next step is to filter and concentrate the juice. This is done to increase the sugar
concentration enabling the sucrose to crystallize. Crystallization leads to a mixture of
sucrose crystal and molasses. The sucrose crystals are sold as sugar, while the molasses
is treated further before fermentation to ethanol.
5.2.1.1 Environmental Impact
Both the production of sugarcane, as well as the production of ethanol from sugarcane
require water. This could impact on the environment. It is estimated that the total rainfall
required for efficient sugarcane production is between 1 500 and 2 500 mm/year, which
should be uniformly spread over the growing cycle. In Brazil, sugarcane production is
mainly rain fed, but many countries in the world cannot produce sugarcane without
irrigation. Irrigation of sugarcane is in most cases not economically feasible. Experimental

33
data showed that only subsurface irrigation can be economically feasible and only under
certain conditions. It has been calculated that current technology uses 21 m3 of water to
process 1 ton of sugarcane. However, the technology exists to decrease this by up to
50%.
The production of sugarcane and the production of sugar and ethanol from sugarcane
result in various waste streams that pollute fresh water resources (Smeet et al., 2006).
The main pollutants from sugarcane production are agrochemicals while waste water is the
major cause of problems during the production of sugar. The main sources of inorganic
pollutants are agrochemicals, disinfectants and clarifying agents. Even though sugarcane
is fairly robust, active pest and disease control is essential and this requires a combination
of mechanical control strategies (e.g. cane burning), biological control (using natural
enemies) and chemical control. The development of resistant sugarcane varieties is a
crucial aspect of minimizing pollution by agrochemicals. The risk of microbial
contamination is particularly high during the sugar extraction process, necessitating the use
of disinfectants. The substance most often used for this purpose is formaldehyde. The
formaldehyde concentration decreases constantly throughout the extraction process,
leaving only 0,1 mg/kg9. Formaldehyde is controversial because, as mentioned previously,
it is considered to be carcinogenic. There are a number of alternatives available but
formaldehyde is still the preferred disinfectant during extraction.
Pre-harvest burning of cane to dispose of dry leaves and superfluous biomass creates
smoke, which causes health problems. Soot and other emissions from such burning is a
major source of air pollution. There is also risk of these fires spreading to neighbouring
forests, fields and infrastructure. The energy in the biomass is neither used for fertilizing
the earth, nor for energy production and can therefore be seen as wasted energy.
Lastly, the production of ethanol from sugarcane could have a negative impact on
biodiversity in a number of different ways, either directly through the conversion of
undistributed land to sugarcane production or indirectly through the pollution or land use
patterns.
34
5.2.2 Sugar beet
Sugar beet is a hardy biennial crop grown commercially for its sucrose-containing root
(IENICA, 2007). Although it is not frost resistant, it is suited to most temperate climates.
The European Union, the United States and Russia are the world’s three largest sugar beet
producers. In the most northern sugar beet producing countries, the growing season can
be as short as 100 days. In these countries, sugar beet is planted in the spring and
harvested in autumn. In warm climates like the Imperial Valley in California, sugar beet is a
winter crop, planted in autumn and harvested in spring. Sugar beet production used to be
very labour intensive. However this has changed and on modern day farms, planting and
harvesting are entirely mechanical. Sugar beet yields vary between 50 and 75 tons per
hectare, depending on the season and location. There are a number of different cultivars
that are commonly used. Original cultivars contained only about 4% sugar but through
selection and breeding this has improved to a maximum of 20%, giving 6 - 7 tons of sugar
per hectare (IENICA, 2007). It has also been shown that herbicide-resistant genetically
modified (GM) sugar beet is 15 - 50% better for the environment because farmers spray
less herbicides (Coghan, 2003). This also saves a lot on tractor fuel, thus reducing the
impact on global warming
Sugar beet processing differs from that of sugarcane at the washing, preparation and
extraction steps (Somani, Aggarwal, & FitzGerald, 1999). After harvesting, the sugar beets
are hauled to the factory. In the UK, loads may be checked at the processing plant since
beet that is frozen and then defrosts produces complex carbohydrates that causes severe
production problems. After washing, the sugar beet is sliced and the slices then pass
through a slow rotating diffuser where a countercurrent flow of water is used to remove
sugar from the slices. The water exiting the diffuser is called the raw juice. It is almost
black with a very high sugar content. The pulp collected from the diffuser contains about
95% water. It is pressed down to 75% moisture. This recovers additional sugar. From
here on, the process is similar to that used for sugarcane.
5.2.2.1 Environmental Impact
Sugar beet is an important break crop for cereal (British Sugar., 2002). Its pests and
diseases are different from those of combinable crops; therefore its cultivation reduces

35
disease and pest levels in the rotation. It contributes to agricultural sustainability by
preventing monoculture.
Sugar beet is not normally irrigated, except in severe drought conditions. It can withstand
much drier conditions than other crops without affecting quality or yield significantly (British
Sugar, 2002a). The amount of water needed to produce sugar beets is highly variable
(Kaffka, 1996). When planted in the fall in California for example, and harvested in July,
the crop requires between 600 and 800 mm of water per growing season for a root yield of
27 to 36 t/ha and a sugar yield of 3,6 to 5,4 t/ha or more. It takes approximately 15 m3
litres of water and 28 kilowatt-hours (kWh) of energy to process one ton of sugar beet
(Somani et al., 1999). Waste stream from processing plants needs to be treated before
releasing it into the environment, mainly because of micro-organisms present as well as
chemicals like formaldehyde used for sterilization.
Sugar beet production can effect the environment in a number of ways. Like all
commercial crops, it impacts on the biodiversity of the region. In the case of sugar beet
however, this is not as significant as with most other crops since it is often used as break
crop (British Sugar, 2002b). Through improved seed treatment technology, certain
pesticides can now be applied in the seed pellet in small doses thus reducing the need for
blanket treatments as used in the past. This, however, does not completely eradicate the
need for spraying crops as they still require treatment with pesticides (for aphid),
nematicides (for eelworm), molluscicides (for slugs), herbicides (for weeds) and fungicides
(for powdery mildew). The use of GM sugar beet also reduces the amount of pesticides
needed. The use of nitrogen fertilizers on sugar beet has decreased by about 30% during
the last 30 years but significant quantities are still used. Nitrogen fertilizers, other fertilizers
and pesticides all have a negative impact when released into the environment.
5.2.3 Sweet sorghum (Sorgum bicolor)
Sweet sorghum is a grain crop but it has stalks rich in sugar; such as sugarcane (Nimbkar,
Kolekar, Akade & Rajvanshi, 2006). World production of sorghum trails far behind the four
main cereals (rice, maize, wheat and barley). About 90% of the area planted with sorghum
lies in developing countries, mainly in Africa and Asia, where it is grown generally for food

36
by low income farmers. It is planted for the simultaneous production of grain, juice and
biomass. The grain is used as food while the juice from the stalks is used for making
syrup, jaggery or ethanol. The bagasse and green foliage is used as fodder for animals,
organic fertilizer or for paper manufacturing. Compared to most other crops, sweet
sorghum has very low water and fertilizer requirements resulting in relatively low cultivation
cost (Lau, Richardson, Outlaw, Holtzapple & Ochoa, 2006). It is often called “a camel
among crops” due to its adaptability, resistance to drought and saline-alkaline soils and
tolerance to water logging. It has a very high rate of photosynthesis which is able to
produce leafy stalks up to 5 meters tall in a relatively short period of 110 – 130 days
(Figure 5.2 A and B). It typically yields 1,5 to 2 tons of grain per hectare, 2,5 t/ha sugar
and approximately 90 t/ha vegetal biomass of which dry matter account for 25 tons (dos
Santos, 1996).
Figure 5.2. (A) Sweet sorghum is a combination crop producing both grain and sugar rich stalks up to 5 meters tall. (B) Sweet sorghum ear head.
Source: Agriculture21, 2002
Like other commercial crops, sweet sorghum farming is mostly mechanical from planting to
harvesting (Nimbkar et al., 2006). Depending on the end use, sweet sorghum can be
harvested with either a forage harvester or cane harvester. Existing sugar mills and small
factories running on sugarcane are often used for the processing of sweet sorghum during
off-season, as sweet sorghum can be grown round the year as a supplementary feedstock.
A B

37
5.2.3.1 Environmental Impact
Sweet sorghum requires significantly less water and fertilizers than most other commercial
crops (Reddy, Kumar, & Ramesh, 2007). This therefore reduces the impact on water
resources and decreases the possibility of nitrogen, phosphate and potassium surface
runoffs. Like most other crops, sweet sorghum is susceptible to a number op diseases and
pests, all of which are controlled by spraying. Successful breeding programs yielded
strains that are more resistant to pests with improved seed quality and quantity (Rajvanshi
& Nimbkar, 2001; Reddy et al. 2007).
5.3 STARCH
Starch is a polysaccharide consisting of only glucose units linked to each other to form very
long chains, typically more that 200 glucose units in length (Figure 5.3) (Bohinski, 1987).
Starch is the form in which plants store nutrients to enable them to survive lean times.
Starch is often found in fruit, seeds and tubers. The major resources for starch are maize,
wheat, rice and to a lesser extend potatoes.
CH2OH
O
OH
OH
CH2OH
O
OH
OH
O
CH2OH
O
OH
OH
O
CH2OH
O
OH
OH
O
CH2OH
O
OH
OH
O
CH2OH
O
OH
OH
O
CH2OH
O
OH
OH
O
CH2OH
O
OH
OH
O
CH2OH
O
OH
OH
O
OO
CH2OH
O
OH
OH
CH2OH
O
OH
OH
O
CH2OH
O
OH
OH
O
CH2OH
O
OH
OH
O
CH2OH
O
OH
OH
O
CH2OH
O
OH
OH
O
CH2OH
O
OH
OH
O
CH2OH
O
OH
OH
O
CH2OH
O
OH
OH
O
CH2OH
O
OH
OH
O
CH2OH
O
OH
OH
O
CH2OH
O
OH
OH
O
CH2OH
O
OH
OH
O
OO
Figure 5.3. Starch is a polysaccharide consisting of many glucose molecules linked to each other to form long chains.
Source: Bohinski, 1987
5.3.1 Maize
Maize is a cereal grain widely cultivated throughout the world. A greater weight of maize is
produced each year than any other grain (McAuliffe, 2005). The United States of America

38
produces more than half (51%) of the world’s harvest, with China producing 24%, the
European Union 9% and countries like Argentina, Mexico, Thailand and South Africa most
of the rest. In temperate zones, maize must be planted in the spring since it is relatively
cold-intolerant. It has a shallow root system and is therefore dependent on soil moisture.
Depending on the location, maize requires between 500 and 800 mm rain during the
growing season of between 80 and 110 days (Critchley, Siegert, & Chapman, 1991). This
means that at time of harvesting, each plant would have consumed 250 litres of water (Du
Plessis, 2003). It produces between 80 and 90 tons of green material per hectare within a
relatively short period. This makes it one of the most efficient grains in terms of water
utilization. Maize is often produced under full irrigation to obtain these yields. At maturity,
the total leaf area may exceed one m2 per plant, allowing the plant to absorb sunlight more
effectively than any other grain crop. There is no other grain crop with a higher yield per
hectare than maize. Maize yields vary greatly, depending on the location (National Corn
Growers Association, 2003). At 12,3 t/ha, Chile is the world’s most efficient producer with
the world’s largest producers, the United States, averaging 9 t/ha. At 2,9 t/ha, South Africa
is below the world average of 3,4 t/ha. Maize kernels consist of 84% carbohydrates stored
in the form of starch (Figure 5.3). This means that the United States produces 7,6 tons of
carbohydrate per hectare. Soil preparation is the foundation of any crop production system
and is the biggest cost factor in maize production (Du Plessis, 2003). On modern day
farms this, as well as planting and harvesting, is done mechanically,. Most of the maize
cultivars currently used are hybrids. Over half of the maize planted in the United States
has been genetically modified to express agronomic traits desired by farmers.
5.3.1.1 Environmental Impact
Even though maize uses water efficiently, it still requires a large amount and it is therefore
often produced under full irrigation (Du Plessis, 2003). This puts serious strain on water
resources and the environment, especially in countries with limited resources. Apart from
its water requirements, it also needs large amounts of fertilizer to maintain a high grow
rate. These normally include nitrogen, phosphate and potassium, all of which can be
damaging to the environment. Successful cultivation of maize depends to a great extent
on efficient weed control, especially for the first six to eight weeks after planting. During
this period, weeds compete vigorously with the crop for nutrients and water. The annual

39
yield loss in maize as a result of weed problems is estimated to be approximately 10%.
Weeds can be removed mechanically or with chemical herbicides, both impacting
negatively on the environment. Integrated pest control is a system whereby various
strategies are used to protect crops, suppress the insect population and limit environmental
damage. These practices incorporate all practical methods of pest control, namely
preventative control, cultivation control and biological control. The susceptibility of maize to
a wide variety of nematodes has lead to the development of GM maize expressing the
Bacillus thuringiensis toxin. “Bt maize” is resistant to especially the European maize borer
and is widely grown in the United States. It has been approved for release in Europe. All
the above measures are relatively environmentally friendly although they are not always
adequate, necessitating the use of some amount of chemical pesticides. Surface runoff
and spray drift are major concerns when pesticides are used.
Another cause of environmental concern is the loss of biodiversity caused by maize
farming. In 2006, 146 million hectares were used for maize production worldwide (Karvy
Comtrade Ltd, 2006). This represents a significant area of natural vegetation.
5.3.2 Wheat
Wheat is the most important human food grain and ranks second in total production behind
maize (Curtis, 1996; Pingali, 1999). It is a grass that is adapted to a wide variety of climatic
conditions. Although it is most successful between the latitudes of 30° and 60°N, and 27°
and 40°S, it can be grown well beyond these limits. The optimum growing temperature is
25°C, therefore wheat can be grown where annual temperatures of 4 to 31°C prevail.
Where winters are mild, wheat can be sown in the fall and harvested the next summer. In
countries with harsh winters, wheat must be sown in the spring because of its limited
tolerance to frost. Sensitivity to frost and low competitiveness amidst wild vegetation limits
its chances of survival outside of cultivated areas. Optimal wheat production requires an
adequate source of moisture during the growing season. Three-quarters of the land used
for wheat production receives an average rainfall of between 375 and 875 mm per year.
Wheat normally requires between 110 and 130 days between planting and harvest,
depending on the climate, seed type and soil conditions. Wheat yields typically vary
between 1 and 7 t/ha, with South Africa averaging 1,78 t/ha, well below the world average

40
of 2,75 t/ha. The highest ever yield was recorded in New Zealand, at 15,048 t/ha. The
carbohydrate content in wheat grains is typically 70%, depending on the cultivar. On
average, wheat therefore yields 5,6 ton carbohydrate from starch per hectare. Virtually
every variety of wheat used on commercial farms is a hybrid or mutant of some sort
(NUEweb, 2005). They have been selected through many generations for a specific trait
or feature, like improved yield, drought resistance or because they produce wheat with a
stiffer shorter straw. In 2004, 81 million hectares of GM crop were grown worldwide.
Genetic modification improved yield, decreased pesticide use, improved biodiversity and
decreased cost, without any reported health problems. The first GM wheat was only
recently approved for use. Unlike maize and rice it is relatively difficult to genetically
modify wheat.
5.3.2.1 Environmental Impact
The first real gains in wheat productivity were seen in the so-called favourable production
environments (Pingali, 1999). These are either in areas with high rainfall or under full
irrigation. Irrigating large fields of wheat puts a lot of strain on environmental water
resources. Maintaining high wheat production yields requires proper crop management
before and during the growing season. It involves the application of spring fertilizers at
very specific growth stages. Furthermore, it requires spraying with the appropriate
pesticides and herbicides at the grain filling stage to prevent disease or insect attack. All of
these, as well as the growth regulators typically used for wheat production are potentially
damaging to the environment.
By 2020, demand for wheat is expected to be 40% greater than its current level of 600
million tons, but the resources available for wheat production are likely to be significantly
lower (Pingali, 1999). Fortunately, wheat yields between 1961 and 1994 increased at an
average annual rate of more than 2% in all developing countries except China and India,
the two largest wheat producers. Here, yields grew extremely rapidly over much of the
period. Even with the expected increase in demand it is likely that the acreage devoted to
wheat in future may decline for the first time since the Stone Age. This, together with the
fact that improved strains require less water, pesticides and fertilizers, means that the
environmental impact of wheat might decrease in future.

41
5.4 LIGNOCELLULOSE
Cellulose, hemicellulose and lignin are the major components in woody and fibrous plants
such as trees and grasses (Bohinski, 1987). It is therefore the most abundant polymers on
earth. The cellulose content in plant cells is relatively constant across all species and
represents 40 - 50% of cell wall substances, while hemicellulose account for 30 - 35% and
lignin 25 - 35%. Like starch, cellulose consists of a chain of glucose residues. The type of
bonds between the glucose residues and the fact that cellulose is never branched are the
only differences between starch and cellulose (Figure 5.4). These features allow the
cellulose chains to associate very closely with each other, making it a very resistant
structure to break down. Hemicellulose is a chain consisting mainly of xylose sugars.
Unlike glucose with 6 carbon atoms, xylose has only 5 carbon atoms and is often referred
to as a pentose sugar and glucose as a hexose sugar. Lignin acts like glue, binding the
components in plant material together. Lignin does not have a repeating structure and is
not converted into ethanol during fermentation. A number of different grass species have
been considered as feedstock for the production of lignocellulosic bioethanol.
O
OH
OH
O
OH
OH
O
O
OH
OH
O
O
OH
OH
O
O
OH
OH
O
O
OH
OH
OO
O
CH2OH CH2OH CH2OH CH2OH CH2OH CH2OHA 6
5
4
3
1
2
O
OH
OH
O
OH
OH
O
O
OH
OH
O
O
OH
OH
O
O
OH
OH
O
O
OH
OH
OO
O
CH2OH CH2OH CH2OH CH2OH CH2OH CH2OH
O
OH
OH
O
OH
OH
O
O
OH
OH
O
O
OH
OH
O
O
OH
OH
O
O
OH
OH
OO
OO
OH
OH
O
OH
OH
O
O
OH
OH
O
O
OH
OH
O
O
OH
OH
O
O
OH
OH
OO
O
CH2OH CH2OH CH2OH CH2OH CH2OH CH2OHA 6
5
4
3
1
2
O
OH
OH
O
OH
OH
O
O
OH
OH
O
O
OH
OH
O
O
OH
OH
O
O
OH
OH
OO
O
B5
4
3
1
2
O
OH
OH
O
OH
OH
O
O
OH
OH
O
O
OH
OH
O
O
OH
OH
O
O
OH
OH
OO
OO
OH
OH
O
OH
OH
O
O
OH
OH
O
O
OH
OH
O
O
OH
OH
O
O
OH
OH
OO
O
B5
4
3
1
2
Figure 5.4. (A) Cellulose is a chain of glucose residues linked to each other to form long chains while (B) hemicellulose is a chain of xylose residues.
Source: Bohinski, 1987
5.4.1 Switchgrass (Panicum virgatum)
Switchgrass is a hardy, warm season, perennial, bunch grass which grows up to 1,8 –
2,2 m in height (Figure 5.5) (Bioenergy Feedstock Development Program, 2005a; New

42
Crop Opportunities Center, 2005). It grows fast, capturing lots of solar energy and turning
it into chemical energy in the form of cellulose. It has a very efficient root system allowing it
to reach deep into the soil for water. Switchgrass evolved over millions of years to thrive in
different climates and growing conditions and is therefore remarkably adaptable. It used
to be a major component of the central North American tall-grass prairie before it had to
make way for superior forage species. Today, switchgrass is used to a limited extent for
grazing for certain animals and as ground cover to control erosion. Annual cultivation of
many agricultural crops depletes the soil's organic matter, steadily reducing fertility.
Switchgrass adds organic matter to the soil. It extends even further below ground than
above. Depending on the soil type, switchgrass root can grow to a depth of 3,3 m. It
produces a network of stems and roots that even in winter holds onto soil to prevent
erosion.
Figure 5.5. (A) Switchgrass is a hardy, perennial grass which grows to a high of 1,8 – 2,2 m in height. (B) Switchgrass can be cut and baled with standard farming equipment.
Source: Bioenergy Feedstock Development Program, 2005a
Cultivating switchgrass as an energy crop would require only minor changes in farm
management and harvesting (Bioenergy Feedstock Development Program, 2005a).
Switchgrass can be cut and baled with conventional mowers and balers. It is hardy and
very adaptable, so once it has been established in the field, it can be harvested as a cash
crop once or twice a year for 10 years or more before replanting is needed. Because it has
multiple uses (e.g. as ground cover, for foraging and for ethanol production), farmers who
plant switchgrass can be certain that a switchgrass crop will be put to good use.
A B
43
To make switchgrass even more promising for biomass production, researchers are
working to boost its hardiness and yields, adapt varieties to a wide range of growing
conditions and reduce the need for nitrogen and other chemical fertilizers. By screening for
desirable physiological characteristics, numerous potential breeding varieties of
switchgrass that show great promise for the future have been identified.
Switchgrass yield per hectare typically varies between 8 and 12 tons of dry matter per
hectare (Knott, 2007). With an average cellulose content of 60%, switchgrass produces
6 tons of fermentable sugar per hectare.
5.4.1.1 Environmental Impact
The low value of switchgrass makes irrigation uneconomical and it is therefore essential to
plant switchgrass where there is adequate rainfall, or readily available soil water, or both
(Hall, 2003). If planted in ecologically sensitive areas, it could deplete the available water
resources and cause adverse hydrological impacts. These could include reducing aquifer
recharge and/or stream flow feeding reservoirs, wetlands, water meadows or other fragile
ecosystems. The impact of switchgrass on surface and groundwater quality depends on
many factors, including the previous land-use, soil type, hydrological regime and the past
use of fertilizers and pesticides. On good quality agricultural land, the impact of
switchgrass on water quality is likely to be beneficial because less pesticides and fertilizer
would be used than with traditional farming.
Switchgrass used to stretch as far as the eye could see on the American prairie where this
grass once fed millions of bison and offered excellent habitat for a wide variety of birds and
small mammals. This was centuries ago however, prior to the coming of the white man.
Today, America's tall grass prairies are confined mostly to parks and preserves. However,
switchgrass may prove equally vital in future.
5.4.2 Miscanthus (Miscanthus x giganteus)
Miscanthus originated in Asia (Bioenergy Feedstock Development Program, 2005b). It is a
perennial grass with lignified stems almost like bamboo (Figure 5.6-A). It has been
evaluated in Europe during the past 5 - 10 years as a bioenergy crop (Bioenergy
Feedstock Development Program, 2005b). It is sometimes confused with elephant grass

44
Pennisetum purpureum. Most of the Miscanthus cultivars used as commercial crop in
Europe are sterile hybrids that originated in Japan. Miscanthus is planted in spring and
once planted, can be harvested for at least 15 years before it needs to be replanted
(Department of Agriculture & Food, 2006). Weeds compete with the crop for light, water
and nutrients. It is therefore important to clear proposed sites before any planting takes
place. Rhizome division is the preferred method used to produce new planting material
(Figure 5.6-B). Even though specialist Miscanthus planting machines are available,
modular potato planters work just as well once the rhizomes has been sorted to make sure
they will pass through the planting tube (Nixon & Bullard, 2001). During the establishment
years, an annual spring application of herbicide is necessary to control weeds. Once the
crop is mature (two to three years), weed interference is effectively suppressed by the leaf
litter layer and by the crop canopy, which reduces light penetration. Miscanthus species
are susceptible to pests and diseases in the areas to which they are native (Asia) but none
of these has been reported in Europe as yet. A number of different machines could be
used at harvest time,, depending on the availability and the requirements of the end market
(Figure 5.6-C).
Figure 5.6. (A) Mature Miscanthus stand approximately 3,5m high. (B) The Miscanthus rhizome used for propagation (C) Miscanthus being harvested with a modified forage harvester
Source: Bioenergy Feedstock Development Program, 2005b
The first season’s growth yield of between 1 and 2 t/ha is not worth harvesting (Nixon &
Bullard, 2001). From the second year onwards the crop is harvested annually. The
second year’s harvest typically yields 4 to 10 t/ha and those in the third year 10 to 13 t/ha.
After 3 to 5 years, yields reach a plateau which is sometimes in excess of 20 t/ha/year.
A B C

45
The average cellulose content of dry Miscanthus is 67% providing a cellulose yield of
13,5 t/ha (Scurlock, 1999).
5.4.2.1 Environmental Impact
Miscanthus requires a rainfall of between 500 and 1 000 mm per year, which is quite
significant. Irrigation is not justified by the increase in biomass that is obtained.
Miscanthus has very low herbicide requirements and the annual fertilizer demand has been
reported to be as low as 50 kgN/h (Hall, 2003). Compared with growing arable crops,
Miscanthus, like switchgrass, has a positive effect on groundwater in that once established,
it can lead to low levels of nitrate leaching and improve groundwater quality. Once
established it also has a very deep root systems, which very efficiently prevent water
erosion (Fernando & Santos Oliveira, 2000).
Studies comparing Miscanthus with cereals indicated that it provides a habitat for a greater
diversity of species than cereal crops (Department of Agriculture & Food, 2006). On the
other hand, the danger of reducing biodiversity might exist when Miscanthus is cultivated in
monoculture.
5.5 CONCLUSION
Table 5.1 provides a summary of the properties and yields of the ethanol feedstocks
discussed in this study. There is significant variation in published values, since the growth
conditions and production procedures that have been used vary between data sources.
Therefore, the data presented here should only serve as basis for broad comparison of the
feedstocks discussed. Technologies for the processing of biomass into usable energy will
be the focus of the next chapter.
The discussion on raw materials that can be used to produce ethanol focused only on a
few of the energy crops available for ethanol production. Since many of these are food
crops, food prices would certainly be impacted if these crops were used for the production
of transportation fuel. Once the technology for producing lignocellulosic ethanol has been
established, the number of crops available for ethanol production would become almost
limitless. By focusing on the development of endemic plant species for energy production,
the impact on the environment can be minimized.

46
Table 5.1 Summary of bioethanol feedstocks.
Yield Growth cycle
Water needs
Total dry biomass sugar grain Ethanol
Months mm/
season t/ha t/ha t/ha l/ta l/hab l/hac
biomass Sugarcane 15 2 000 35 10,0 na 70 6 000 13 000 Sugar beet 9 700 7,0 na 95 5 000 Sweet Sorghum 4 400 25 2,5 1,7 86 3 010 11 000 Maize 3 600 15 na 4,7 380 4 300 10 000 Wheat 3 500 14 na 3,4 395 1 400 5 000 Switchgrass 12 500 15 na na 4 500 10 700 10 700 Miscanthus 12 750 20 na na 14 000 14 000
a Ethanol yield per ton of feedstock in the case of sugarcane, sugar beet and sweet sorghum and ethanol yield per ton of grain in the case of maize and wheat. It does not include the cellulose and hemicellulose in the plant.
b Ethanol yield per hectare of feedstock in the case of sugarcane, sugar beet and sweet sorghum and ethanol yield per ton of grain in the case of maize and wheat. It does not include the cellulose and hemicellulose in the plant.
c Ethanol yield per hectare biomass
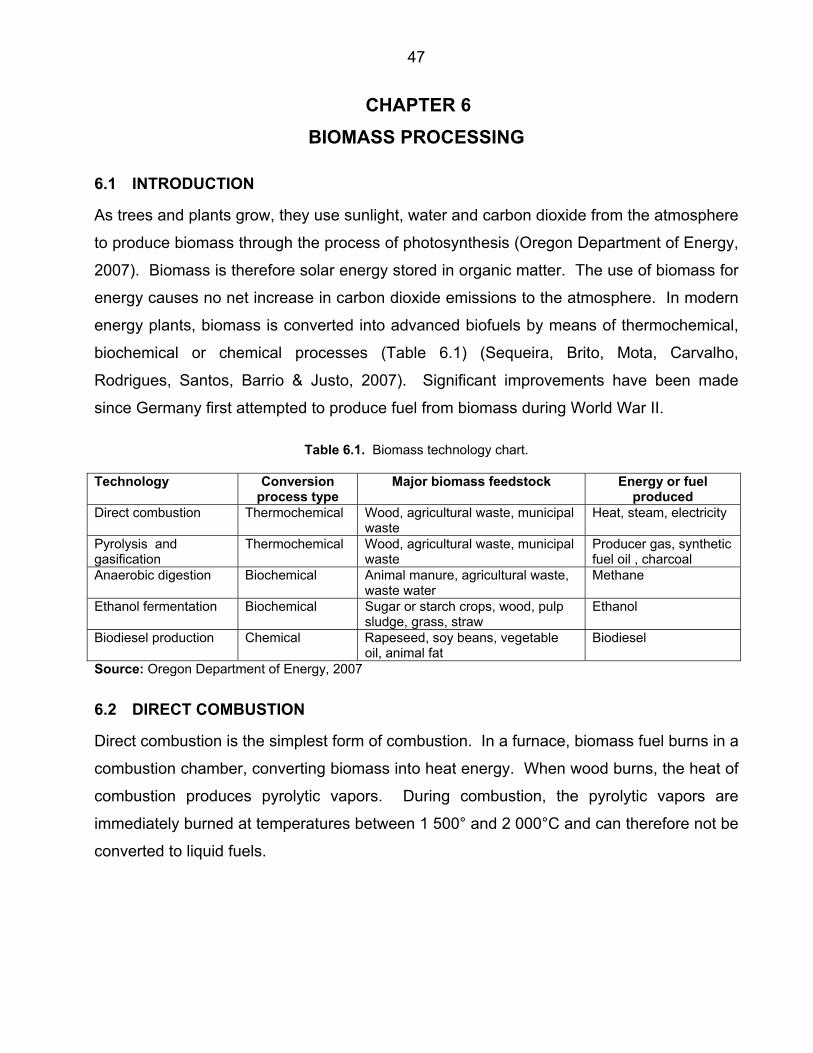
47
CHAPTER 6 BIOMASS PROCESSING
6.1 INTRODUCTION
As trees and plants grow, they use sunlight, water and carbon dioxide from the atmosphere
to produce biomass through the process of photosynthesis (Oregon Department of Energy,
2007). Biomass is therefore solar energy stored in organic matter. The use of biomass for
energy causes no net increase in carbon dioxide emissions to the atmosphere. In modern
energy plants, biomass is converted into advanced biofuels by means of thermochemical,
biochemical or chemical processes (Table 6.1) (Sequeira, Brito, Mota, Carvalho,
Rodrigues, Santos, Barrio & Justo, 2007). Significant improvements have been made
since Germany first attempted to produce fuel from biomass during World War II.
Table 6.1. Biomass technology chart.
Technology Conversion process type
Major biomass feedstock Energy or fuel produced
Direct combustion Thermochemical Wood, agricultural waste, municipal waste
Heat, steam, electricity
Pyrolysis and gasification
Thermochemical Wood, agricultural waste, municipal waste
Producer gas, synthetic fuel oil , charcoal
Anaerobic digestion Biochemical Animal manure, agricultural waste, waste water
Methane
Ethanol fermentation Biochemical Sugar or starch crops, wood, pulp sludge, grass, straw
Ethanol
Biodiesel production Chemical Rapeseed, soy beans, vegetable oil, animal fat
Biodiesel
Source: Oregon Department of Energy, 2007
6.2 DIRECT COMBUSTION
Direct combustion is the simplest form of combustion. In a furnace, biomass fuel burns in a
combustion chamber, converting biomass into heat energy. When wood burns, the heat of
combustion produces pyrolytic vapors. During combustion, the pyrolytic vapors are
immediately burned at temperatures between 1 500° and 2 000°C and can therefore not be
converted to liquid fuels.

48
6.3 PYROLYSIS AND GASIFICATION
Pyrolysis and gasification are thermal processes that use high temperatures to break down
carbon containing material like biomass (Friends of the Earth, 2002). Both these
technologies use less oxygen than direct combustion. Gasification involves using a small
amount of oxygen whereas pyrolysis uses none. Both produce a synthetic gas (syngas)
made up of mainly carbon monoxide and hydrogen (85%) and smaller amounts of carbon
dioxide and methane. Other products include liquids (pyrolytic oil) and solid residues
(char).
Both pyrolysis and gasification produce fewer emissions than direct combustion because
the process is easier to control. They also produce more useful products than direct
combustion. Like cellulosic ethanol, gasification technology is still in development and
there are only a few demonstration plants in operation worldwide (Oregon Department of
Energy, 2007). A major problem with biomass gasification is the high capital cost involved
in plant construction (Figure 6.1). Gasification and pyrolysis has one big advantage
compared to cellulosic fermentation to produce ethanol. Unlike fermentation that only
utilize the cellulose and hemicellulose components in biomass (about 80%), gasification
and pyrolysis converts all the carbon compounds in biomass, namely cellulose,
hemicellulose and lignin. Linked with the Fischer-Tropsch process for converting syngas to
methanol, ethanol or diesel, gasification and pyrolysis has the potential to play a major role
in renewable fuel production in the future.
0 20 40 60 80 100 120 140 160
Biomass to liquid
Coal to liquid
Biomass to ethanol
Gas to liquid
Oil ref inery
Ethanol
Fuel
1000 US$
Figure 6.1. Capital investment cost for liquid fuel facilities (dollars per daily barrel of capacity). Source: Shapouri, 2006

49
6.4 ANAEROBIC DIGESTION
Anaerobic digestion is a biochemical process in which a symbiotic group of bacteria digest
biomass in an oxygen free environment to produce biogas (Oregon Department of Energy,
2007). Biogas is a mixture of gasses, with methane and carbon dioxide making up more
than 90% of the total. The gas is typically used to fuel generator engines or gas turbines to
produce electricity. It can also be used to fuel a boiler to produce heat or steam.
6.5 FERMENTATION
Fermentation typically refers to the microbial conversion of sugar to ethanol and carbon
dioxide. The remainder of this study will focus on the conversion of the three different
classes of biomass, namely sugar, starch and lignocellulose, to ethanol through
fermentation.
6.6 CONCLUSION
There are a number of different technologies available for converting solar energy stored in
biomass into liquid fuel. Each of these has unique advantages and disadvantages.
Certain technologies are better suited to processing of a particular kind of biomass.
Therefore, the viability of any single processing facility depends on the identification of the
most appropriate technology for processing the biomass that is available.
50
CHAPTER 7 BIOETHANOL PRODUCTION
7.1 INTRODUCTION
Bioethanol is an alcohol-based fuel produced from biomass. It is technically feasible to
make ethanol from a wide variety of available feedstocks (Shapouri, Salassi & Fairbanks,
2006). Bioethanol could be made from crops which contain starch, such as feed grains,
food grains, and tubers (e.g. potatoes and sweet potatoes), or from crops containing sugar,
such as sugar beets, sugarcane, and sweet sorghum. In addition, food processing
byproducts, such as molasses, cheese whey, and cellulosic materials including grass and
wood, as well as agricultural and forestry residues could be processed to bioethanol. Any
raw material that contains high levels of easily fermentable sugar may be considered. The
fermentable sugar content of biomass determines the levels of ethanol that can be
produced.
7.2 ETHANOL FROM SUCROSE
7.2.1 The current industry
In developing countries, the best example of the large growth in the use of renewable fuel
is given by the sugarcane ethanol program in Brazil (Glodemberg, 2007). Today, ethanol
production from sugarcane in Brazil is 16 billion litres per year, requiring around 3 million
hectares of land. Brazil has 850 million hectares of land in total of which 320 hectares is
arable land (this excludes the Amazon rainforest, nature reserves and indigenous land) (De
Carvalho, 2005; Lagercrantz, 2006). Only 60 million hectares of arable land is used for
farming, of which sugarcane accounts for 5,8 million hectares. Brazil’s total petroleum
consumption in 2006 was 15,1 billion litres (Table 2.3), which equals 21,6 billion litres of
ethanol, bearing in mind the energy density of ethanol (Figure 4.2). By devoting an
additional 4 million hectares of arable land to ethanol production, Brazil can in theory
replace petroleum altogether.
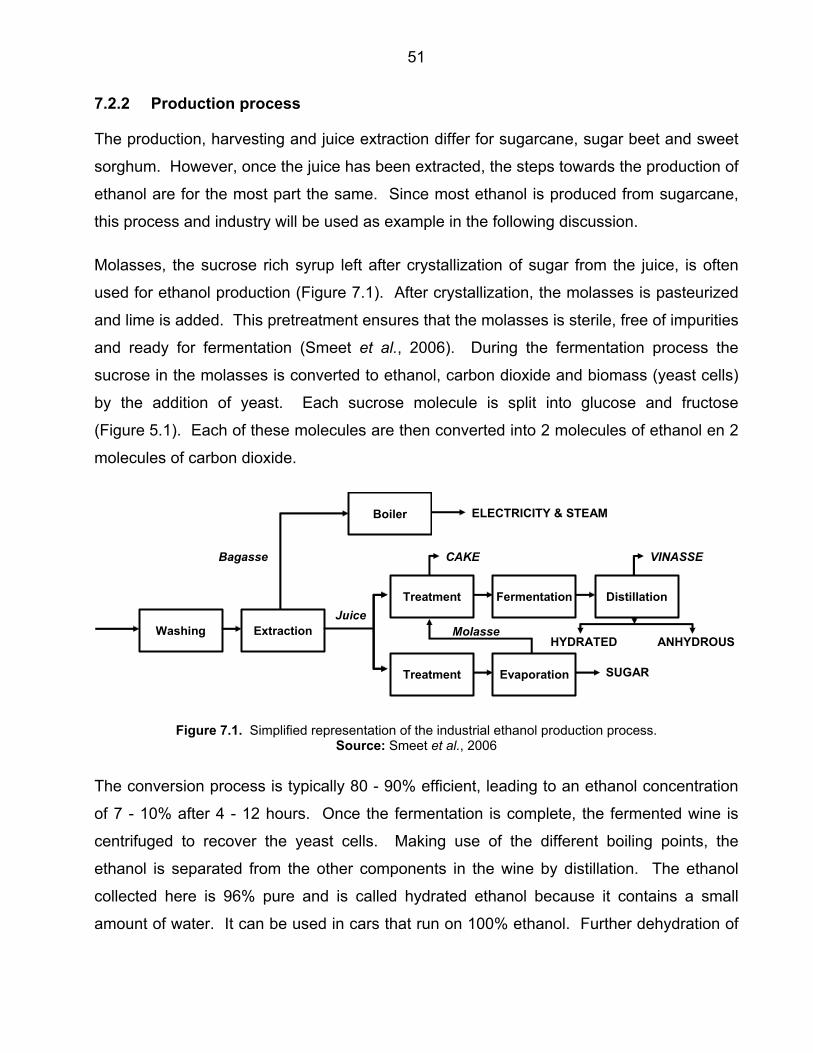
51
7.2.2 Production process
The production, harvesting and juice extraction differ for sugarcane, sugar beet and sweet
sorghum. However, once the juice has been extracted, the steps towards the production of
ethanol are for the most part the same. Since most ethanol is produced from sugarcane,
this process and industry will be used as example in the following discussion.
Molasses, the sucrose rich syrup left after crystallization of sugar from the juice, is often
used for ethanol production (Figure 7.1). After crystallization, the molasses is pasteurized
and lime is added. This pretreatment ensures that the molasses is sterile, free of impurities
and ready for fermentation (Smeet et al., 2006). During the fermentation process the
sucrose in the molasses is converted to ethanol, carbon dioxide and biomass (yeast cells)
by the addition of yeast. Each sucrose molecule is split into glucose and fructose
(Figure 5.1). Each of these molecules are then converted into 2 molecules of ethanol en 2
molecules of carbon dioxide.
Washing Extraction
Treatment Fermentation Distillation
Boiler
Treatment Evaporation
CAKE
ELECTRICITY & STEAM
VINASSE
HYDRATED ANHYDROUS
SUGAR
MolasseJuice
Bagasse
Figure 7.1. Simplified representation of the industrial ethanol production process. Source: Smeet et al., 2006
The conversion process is typically 80 - 90% efficient, leading to an ethanol concentration
of 7 - 10% after 4 - 12 hours. Once the fermentation is complete, the fermented wine is
centrifuged to recover the yeast cells. Making use of the different boiling points, the
ethanol is separated from the other components in the wine by distillation. The ethanol
collected here is 96% pure and is called hydrated ethanol because it contains a small
amount of water. It can be used in cars that run on 100% ethanol. Further dehydration of

52
up to 99,7% is required to produce anhydrous ethanol. Anhydrous ethanol is used as
oxygenate for gasoline. This is normally done by the addition of cyclohexane.
7.2.3 Environmental impact of ethanol production
As mentioned previously, sugarcane production can unfortunately have a number of
different impacts on the environment. The main form of pollution on an ethanol production
plant is the organic waste water stream (Smeet et al., 2006). This is cooling water, vinasse
and water used for cane washing,. Vinasse is a black liquid formed during the distillation
process. It is produced in large volumes, it is hot and therefore needs cooling and it has a
high organic load. When released into rivers, it causes pollution which can impact the
aquatic environment seriously. Presently, vinasse and other waste water are either used
for ferti-irrigation or it is treated in a number of different ways to remove organic pollutants.
Biofuels use water at both ends of the process (African Sustainable Fuels Centre, 2006).
Water is used in the cultivation process, whether crops are rain-fed or irrigated, and
processing plants can also be large users of water. When sugarcane is processed to
bioethanol, 87% of the water use occurs in four processes: sugarcane washing, condenser
evaporation, fermentation cooling and alcohol condenser cooling. India and Brazil have
made large advancements in their water usage, indicating that water use efficiency can be
improved with new technologies. Maize to ethanol plants has even higher water needs.
7.2.4 Energy balance
The overall belief is that the use of fuel ethanol has a positive impact on the environment.
When determining environmental impact, the net effect of energy and greenhouse gas
balances should be evaluated during the complete well-to-wheel cycle of ethanol, i.e.
during ethanol production from sugarcane as well as during its use as fuel in the transport
sector. There are only a few estimates of greenhouse gas emissions and energy balances
for ethanol production from sugarcane in literature. The studies most cited are by Macedo
and co-workers, and De Oliveira and co-workers (De Oliveira, Vaughan & Rykiel, 2007;
Macedo, Leal & Da Silva, 2004). However, there is strong evidence suggesting that De
Oliveira and co-workers allocated diesel for agricultural operations incorrectly, therefore the
Macedo figures will be used for this discussion (Smeet et al., 2006).
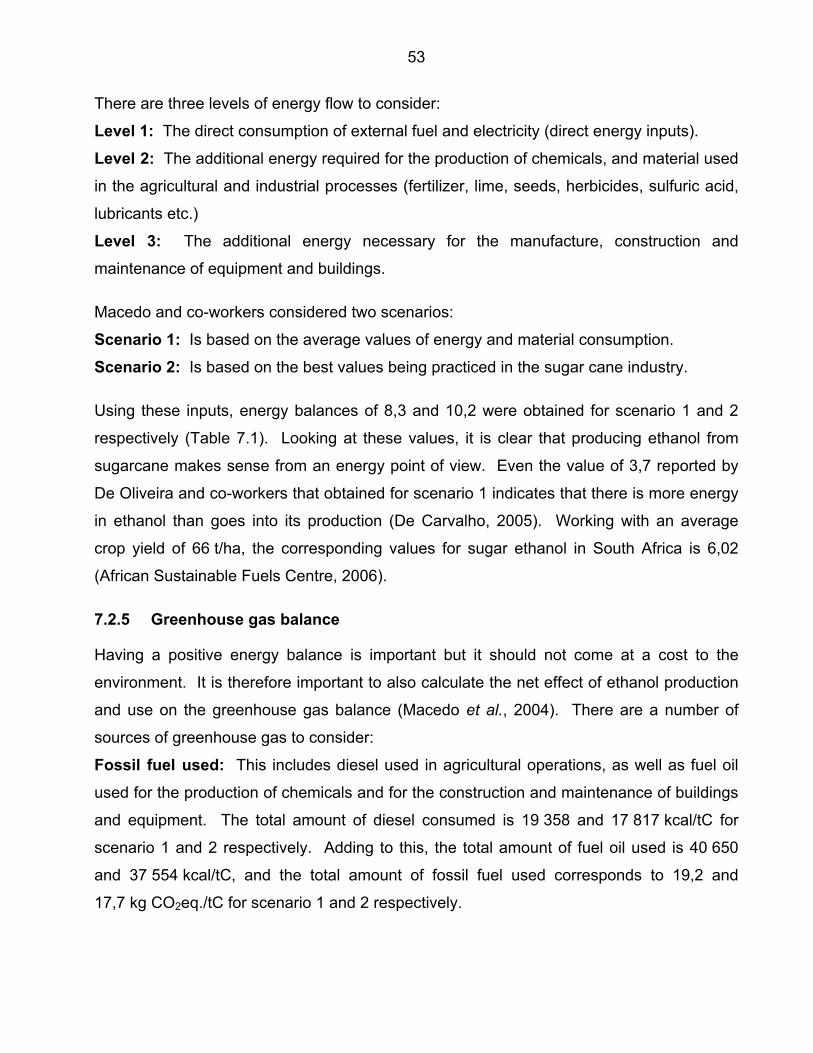
53
There are three levels of energy flow to consider:
Level 1: The direct consumption of external fuel and electricity (direct energy inputs).
Level 2: The additional energy required for the production of chemicals, and material used
in the agricultural and industrial processes (fertilizer, lime, seeds, herbicides, sulfuric acid,
lubricants etc.)
Level 3: The additional energy necessary for the manufacture, construction and
maintenance of equipment and buildings.
Macedo and co-workers considered two scenarios:
Scenario 1: Is based on the average values of energy and material consumption.
Scenario 2: Is based on the best values being practiced in the sugar cane industry.
Using these inputs, energy balances of 8,3 and 10,2 were obtained for scenario 1 and 2
respectively (Table 7.1). Looking at these values, it is clear that producing ethanol from
sugarcane makes sense from an energy point of view. Even the value of 3,7 reported by
De Oliveira and co-workers that obtained for scenario 1 indicates that there is more energy
in ethanol than goes into its production (De Carvalho, 2005). Working with an average
crop yield of 66 t/ha, the corresponding values for sugar ethanol in South Africa is 6,02
(African Sustainable Fuels Centre, 2006).
7.2.5 Greenhouse gas balance
Having a positive energy balance is important but it should not come at a cost to the
environment. It is therefore important to also calculate the net effect of ethanol production
and use on the greenhouse gas balance (Macedo et al., 2004). There are a number of
sources of greenhouse gas to consider:
Fossil fuel used: This includes diesel used in agricultural operations, as well as fuel oil
used for the production of chemicals and for the construction and maintenance of buildings
and equipment. The total amount of diesel consumed is 19 358 and 17 817 kcal/tC for
scenario 1 and 2 respectively. Adding to this, the total amount of fuel oil used is 40 650
and 37 554 kcal/tC, and the total amount of fossil fuel used corresponds to 19,2 and
17,7 kg CO2eq./tC for scenario 1 and 2 respectively.
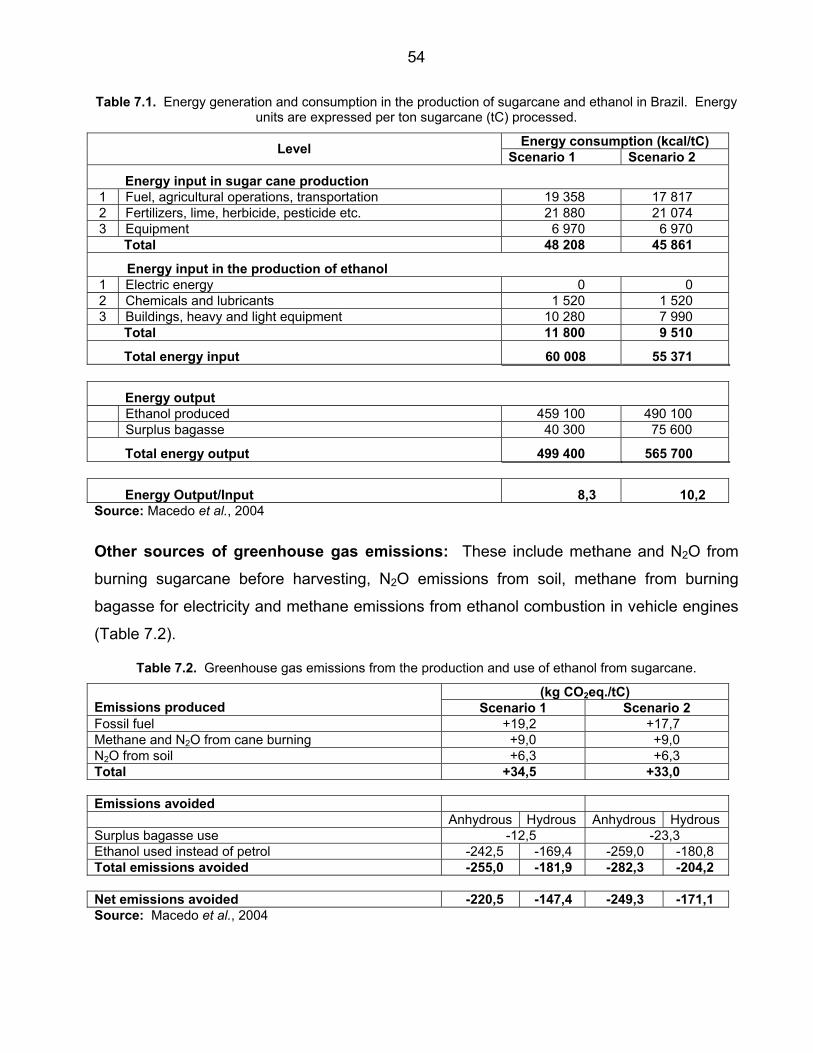
54
Table 7.1. Energy generation and consumption in the production of sugarcane and ethanol in Brazil. Energy units are expressed per ton sugarcane (tC) processed.
Energy consumption (kcal/tC) Level Scenario 1 Scenario 2
Energy input in sugar cane production 1 Fuel, agricultural operations, transportation 19 358 17 817 2 Fertilizers, lime, herbicide, pesticide etc. 21 880 21 074 3 Equipment 6 970 6 970
Total 48 208 45 861
Energy input in the production of ethanol 1 Electric energy 0 0 2 Chemicals and lubricants 1 520 1 520 3 Buildings, heavy and light equipment 10 280 7 990
Total 11 800 9 510
Total energy input 60 008 55 371
Energy output Ethanol produced 459 100 490 100 Surplus bagasse 40 300 75 600
Total energy output 499 400 565 700
Energy Output/Input 8,3 10,2 Source: Macedo et al., 2004
Other sources of greenhouse gas emissions: These include methane and N2O from
burning sugarcane before harvesting, N2O emissions from soil, methane from burning
bagasse for electricity and methane emissions from ethanol combustion in vehicle engines
(Table 7.2).
Table 7.2. Greenhouse gas emissions from the production and use of ethanol from sugarcane.
(kg CO2eq./tC) Emissions produced Scenario 1 Scenario 2 Fossil fuel +19,2 +17,7 Methane and N2O from cane burning +9,0 +9,0 N2O from soil +6,3 +6,3 Total +34,5 +33,0 Emissions avoided Anhydrous Hydrous Anhydrous Hydrous Surplus bagasse use -12,5 -23,3 Ethanol used instead of petrol -242,5 -169,4 -259,0 -180,8 Total emissions avoided -255,0 -181,9 -282,3 -204,2 Net emissions avoided -220,5 -147,4 -249,3 -171,1 Source: Macedo et al., 2004

55
Compared to petrol, ethanol made from sugar crops such as sugarcane or sweet sorghum
produces significantly less global warming pollution. Ethanol produced from sugar also
causes less greenhouse gas than ethanol produced from maize since the fibre from sugar
crops (bagasse) can be used to produce substantial amounts of heat and renewable
electricity, which can both power the bio-refinery and produce excess power for the grid
(Environmental Entrepreneurs, 2006). In an ethanol optimized production facility, only
about 35% of the total electricity produced is needed to convert sugarcane to ethanol. Low
steam utilization technology is used in these types of factories and distilleries. This allows
heat integration, which entails the use of waste heat in heat exchangers to heat other
processes. Such an approach uses less steam, leaving more steam for electricity
generation. This increases the overall energy output of the process leading to improved
production economics.
7.2.6 Impact on food supply and price
In Brazil, subsidies and other incentives given for sugar production and for fuel ethanol in
the 70’s and 80’s lead to a shift in land use patterns from food crops to sugarcane
production (Smeet et al., 2006). This shift occurred despite the fact that Brazil has an
abundance of suitable land and a favourable climate for agriculture. The greatest impact
was on maize and rice, of which the planted area declined by 35% between 1974 and
1979. The result was higher food prices that affected especially the poor.
Furthermore, landowners in Brazil can expect larger revenues with sugarcane production.
Sugarcane is a crop that requires good quality soil and for this reason sugarcane
plantations in Sao Paulo are now located in areas previously used for orange production
and cattle farming. For comparison, the annual net income per hectare in Brazil in 2005
were US$ 487 for forestry, US$ 350 for sugarcane, US$ 170 for crops like beans, maize
and soybean and US$ 58 for cattle farming. Higher profit margins obtained through
subsidies caused a shift form other crops to sugarcane, especially in areas surrounding
sugar mill plants.
There is a direct link between ethanol production and sugar production since many mills
produce both sugar and ethanol. The ratio of sugar to ethanol that is being produced is
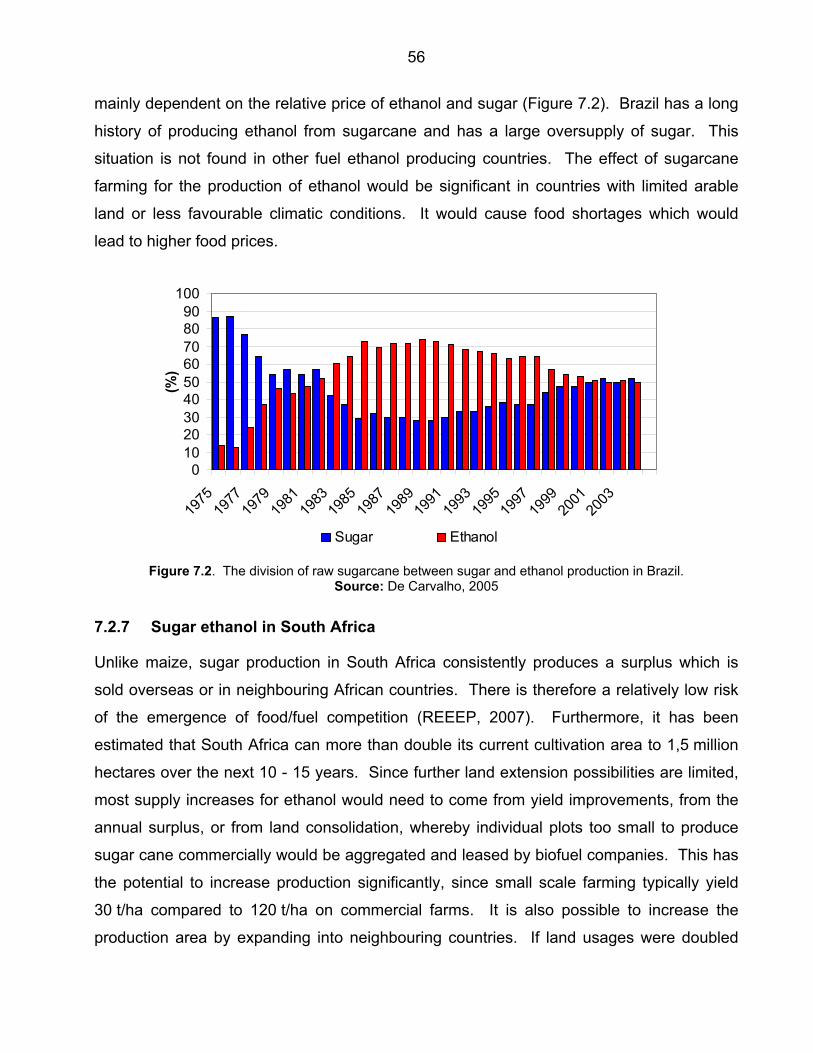
56
mainly dependent on the relative price of ethanol and sugar (Figure 7.2). Brazil has a long
history of producing ethanol from sugarcane and has a large oversupply of sugar. This
situation is not found in other fuel ethanol producing countries. The effect of sugarcane
farming for the production of ethanol would be significant in countries with limited arable
land or less favourable climatic conditions. It would cause food shortages which would
lead to higher food prices.
0102030405060708090
100
1975
1977
1979
1981
1983
1985
1987
1989
1991
1993
1995
1997
1999
2001
2003
(%)
Sugar Ethanol
Figure 7.2. The division of raw sugarcane between sugar and ethanol production in Brazil. Source: De Carvalho, 2005
7.2.7 Sugar ethanol in South Africa
Unlike maize, sugar production in South Africa consistently produces a surplus which is
sold overseas or in neighbouring African countries. There is therefore a relatively low risk
of the emergence of food/fuel competition (REEEP, 2007). Furthermore, it has been
estimated that South Africa can more than double its current cultivation area to 1,5 million
hectares over the next 10 - 15 years. Since further land extension possibilities are limited,
most supply increases for ethanol would need to come from yield improvements, from the
annual surplus, or from land consolidation, whereby individual plots too small to produce
sugar cane commercially would be aggregated and leased by biofuel companies. This has
the potential to increase production significantly, since small scale farming typically yield
30 t/ha compared to 120 t/ha on commercial farms. It is also possible to increase the
production area by expanding into neighbouring countries. If land usages were doubled

57
and production optimized, sugarcane production would meet more than twice the current
regional sugar consumption while also creating 7,3 billion litres of bioethanol each year.
Ethanol Africa claims that maize is a crop better suited for conditions in South Africa
(section 7.3.7) (Ethanol Africa, 2007). According to this source, South Africa would not be
able to produce more than 0,2 billion litres of ethanol from sugarcane. The South African
government intends to introduce a biofuel blending program into the South African fuel
market. It is expected that ethanol would account for 10% of the 12 billion litre annual
transportation fuel consumption. This would create a local annual demand of 1,2 billion
litres.
The African Sustainable Fuels Centre prepared an in-depth report on the feasibility of
biofuels in South Africa (African Sustainable Fuels Centre, 2006). They calculated a
number of parameters in order to compare different strategies South Africa could use to
produce biofuels. Crops considered for the immediate future are sugarcane and maize for
bioethanol production and soybean for biodiesel production. Key parameters of sugar
ethanol production in South Africa are summarized in Table 7.3 and Figure 7.3. (see Table
7.4 for a comparison with maize ethanol).
Figure 7.3. Key parameters of sugar ethanol production in South Africa.
A Capital expenditure of a 466 kT/year plant R million 1845,0 B Co-product sales income R million/year 101,0 Co-product sales income cent/liter 17,3 C Savings on greenhouse gas emissions kt/CO2 equivalent 916,0 Carbon credit cent/liter 11,3 D Production cost: Net crop feed price cent/liter 231,0 E Production cost: Net biofuel production price cent/liter 375,0
A. The capital expenditures reflect the construction of a “greenfield” plants and include site preparation costs. In practice it is possible to integrate the proposed sugar cane plants with current sugar mills, which will cut out the feed preparation section of crushing and juice extraction. In a conservative approach, it is prudent to rather consider the erection of totally new facilities as it would be the most expensive option and provide a ceiling breakeven price for the biofuels produced.
B. Bagasse from sugarcane can be used as heating fuel or pulp for paper manufacture D. Crop prices are market-based ensuring a reasonable profit to the commercial farming sector E. The biofuel production prices are net of co-product sales, carbon credits and allow return on capital of
16% per annum. Source: African Sustainable Fuels Centre, 2006
The profitability of biofuels depends on a variety of factors. Some of these factors will be
influenced by government action, legislation and farming practices. Others, such as

58
climatic changes, exchange rates and oil price movements are exogenous to South Africa’s
economy and all participants in the economic system need to adapt to these factors. The
profitability of the biofuels industry has significant sensitivity to the exogenous impact of
exchange rates and crude oil price movements (Appendix 3). It is also possible to
interpolate the required crude oil price at any specific exchange rate to allow a reasonable
return on capital employed (ROCE) of 20%. At R7,35/US$ for example, sugar cane-based
ethanol production would only be sufficiently profitable at a crude oil price of
US$ 66,6/barrel.
Bioethanol from sugarcane and maize, both of which South Africa produces in excess (in
“average” yield years), can together roughly meet the E10 demand according to the African
Sustainable Fuels Centre report (African Sustainable Fuels Centre, 2006). At an oil price
in the vicinity of US$ 65/barrel (assuming 95 % of Basic Fuel Price) and without any
subsidies, both these industries are viable and can presently be expected to generate
acceptable returns to growers and plants. However, given South Africa’s limited
agricultural land and water availability, it is important to guard against an over-investment
in biofuel production. Rather, a healthy balance between the production of food and fuel is
needed.
7.3 ETHANOL FROM STARCH
7.3.1 The current industry
Almost all ethanol in the United States is manufactured from maize, with starch as
fermentable substrate for the production of fuel ethanol (Wald, 2007). Bioethanol from
starch has been in commercial-scale production for many decades, and the production
technology has undergone significant development and refinement (Ethanol Africa, 2006).
By 2001, bioethanol production in the United States consequently required about 50% less
energy than in the early 1980s, and ethanol yields had increased by more than 22%.
Simultaneously, capital costs to construct a bioethanol plant had decreased by 25% over
the 20 years. Since 2001, the refinement of the technology has continued, with average
yields of bioethanol having increased by an additional 5% by 2005. Furthermore, process
efficiency is also improving with regards to agricultural efficiency and yield. These
59
improvements should further decrease gross energy input over time although no large,
sudden changes are expected.
Currently, there is no commercial production of ethanol from sugarcane or sugar beets in
the United States, where 97% of ethanol is produced from maize. Annual production is
about 5,68 billion litres of maize ethanol, a total that consumes about 6% of annual
domestic maize production (Wang et al., 1999). Considering the fact that the United States
consumes 530 billion litres of petrol per year, they would require 760 billion litres of ethanol
to replace petrol (Patzek et al., 2007). Production of this much ethanol would require
5 times more land than the amount of land actually and potentially available for crops in the
United States.
7.3.2 Production process
From a technological point of view, producing ethanol from sugarcane is simpler than
converting maize into ethanol (Jacobs, 2006). The conversion of maize to ethanol requires
cooking as well as the application of enzymes, whereas the conversion of sugar requires
only a yeast fermentation process. Ethanol is commercially produced in one of three ways,
using either wet milling, dry milling or the dry grinding process (ICM, 2006; Rausch &
Belyea, 2006). Wet and dry milling involves separating the maize kernel into its component
parts (germ, fibre, protein and starch) prior to fermentation. With the dry-grinding process
the entire maize kernel is ground into flour. Maize wet milling and dry-grind processing
account for nearly all ethanol production, whereas dry milling accounts for very little. Wet-
milling processors have a much wider variety of marketable co-products than dry-grind
processors. The dry-grind process has only CO2 and dried grains with solubles (DDSG) as
co-product.
Unlike sugarcane that needs to be processed as soon as possible, maize can be stored
prior to processing (Smeet et al., 2006; U.S.Grains Council, 2007). It is delivered to
ethanol plants where it is kept in storage bins designed to hold enough grain to supply the
plant for 7 - 10 days. After screening to remove debris, it is ground to a course flour. The
milled grain is mixed with process water, cooked and cooled down to 60°C. The pH is
adjusted to about 5,8 and α-amylase enzyme is added (Figure 7.4). The slurry is heated

60
and kept at 60°C for 30 – 45 min. During this time, the α-amylases break the long glucose
chains in starch into shorter fragments causing an increase in viscosity. The slurry is then
pumped through a pressurized jet cooker at 105°C and held for 5 min to reduce the
viscosity. The mixture is then cooled to 33°C, the pH adjusted to 4 and a second enzyme,
glucoamylase, is added as it is pumped into the fermentation tanks. In the fermentation
tank, the glucoamylase breaks the short glucose chains down to glucose. Yeast is then
added to convert the glucose to ethanol and carbon dioxide. The fermentation process
continues for 50 – 60 hours resulting in a mixture that contains 15% ethanol, as well as
solids from the grain and from the yeast that has been added. This fermented mash is
pumped though a distillation column where the ethanol is boiled off and separated from the
water. After distillation, the product stream contains 95% ethanol. It is then passed
through a molecular sieve to physically separate and remove the remaining water.
Distillation
Slurrycooking
Stillagedrying
Slurry
FermentationCO2
Maize CleaningMilling
Dehydration Ethanol
Water
DDSG
Steam
Steam Steam
Figure 7.4. The basic flow for the production of ethanol form maize. Source: African Sustainable Fuels Centre, 2006
During the production of ethanol from maize, two valuable co-products are formed, namely
carbon dioxide and distillers grains. As yeast ferments, it releases large amounts of carbon
dioxide gas. It can be released into the atmosphere, but it is commonly captured, purified
and sold to the food processing industry for use in carbonated beverages and flash
freezing applications. The stillage from the bottom of the distillation tanks is centrifuged to
separate it into thin stillage and wet distillers’ grain. Some of the thin stillage is routed back
to the cook/slurry tanks reducing process water requirements. The rest is dried and sold
together with the wet distillers’ grain as animal feed.

61
7.3.3 Environmental impact of ethanol production
Apart from the water needed for the cultivation of maize, ethanol production from maize
also requires water (Patzek, 2004). The following amounts of process water are needed
per litre of ethanol:
• 10 - 12 litres for maize fractionation.
• 20 – 25 litres for the fermentation process.
The total amount of process water needed is 30 – 37 litres per litre of ethanol. Recycling
technology in modern ethanol plants reduces the amount of clean water used per litre of
ethanol to only about 4,2 litres (Keeney & Muller, 2006). The total amount of process water
required is about 100 times smaller than the amount of water needed to grow maize in the
field. Depending on the location and the weather conditions, maize requires about
10 million litres of water per hectare. With a yield of approximately 3 000 litres of ethanol
per hectare, this equates to a total of almost 3 400 litres of water to produce 1 litre of
ethanol.
The co-products obtained from both the wet milling and dry grind processing of maize are
commonly processed into animal feed (Rausch & Belyea, 2006). Its high protein content is
very desirable in animal feed, but it also contains high concentrations of phosphorous.
Most ruminant production diets contain adequate amounts of phosphorous, adding
additional phosphorous would thus cause an increase in phosphorous excretion. This
creates disposal problems. Environmental regulations for land application of animal
wastes are based partly on phosphorous concentrations due to its negative impact on the
environment.
7.3.4 Energy balance
Over the past 25 years, the energy return on investment of ethanol has been a hotly
debated topic. Hammerschlag published a survey on six studies published on the net
energy balance of ethanol produced from maize (Hammerschlag, 2006). This is similar to
the work published by Macedo et al. (2004) for sugar ethanol. He defined the term Energy
Return on Investment (rE) as the ratio of energy in a litre of ethanol to the nonrenewable
energy required to make it:
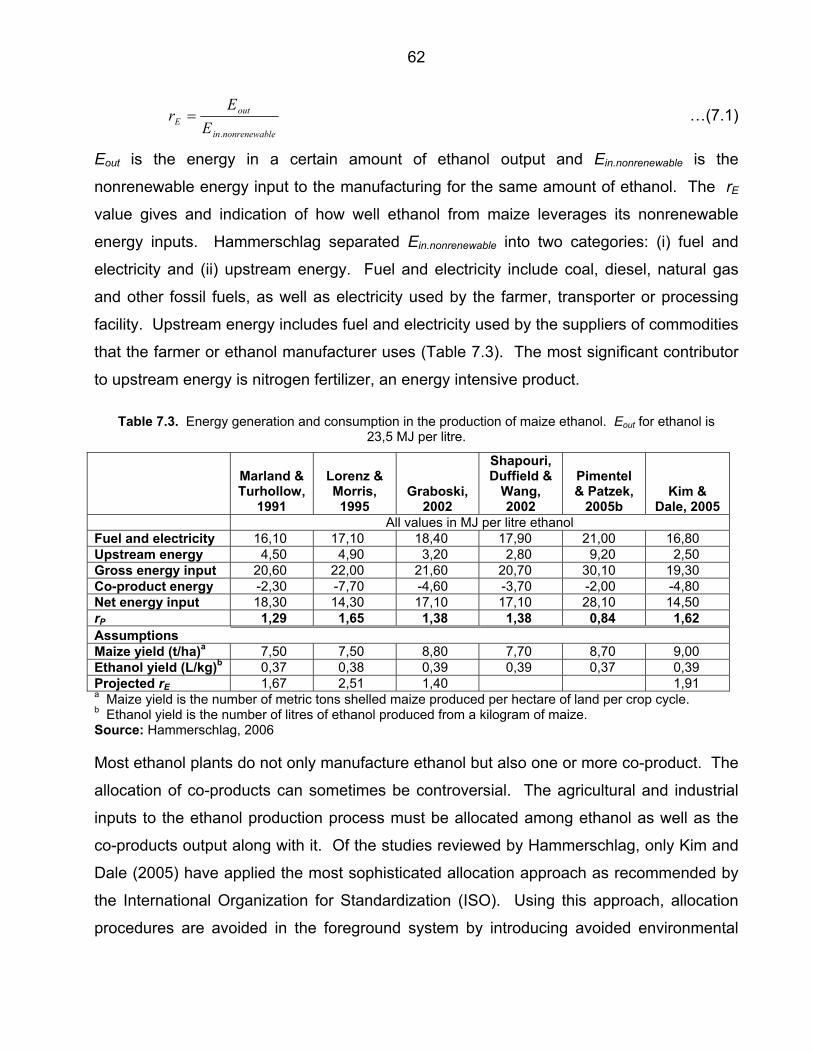
62
lenonrenewabin
outE E
Er
.
= …(7.1)
Eout is the energy in a certain amount of ethanol output and Ein.nonrenewable is the
nonrenewable energy input to the manufacturing for the same amount of ethanol. The rE
value gives and indication of how well ethanol from maize leverages its nonrenewable
energy inputs. Hammerschlag separated Ein.nonrenewable into two categories: (i) fuel and
electricity and (ii) upstream energy. Fuel and electricity include coal, diesel, natural gas
and other fossil fuels, as well as electricity used by the farmer, transporter or processing
facility. Upstream energy includes fuel and electricity used by the suppliers of commodities
that the farmer or ethanol manufacturer uses (Table 7.3). The most significant contributor
to upstream energy is nitrogen fertilizer, an energy intensive product.
Table 7.3. Energy generation and consumption in the production of maize ethanol. Eout for ethanol is 23,5 MJ per litre.
Marland & Turhollow,
1991
Lorenz & Morris, 1995
Graboski, 2002
Shapouri, Duffield &
Wang, 2002
Pimentel & Patzek,
2005b Kim &
Dale, 2005 All values in MJ per litre ethanol Fuel and electricity 16,10 17,10 18,40 17,90 21,00 16,80 Upstream energy 4,50 4,90 3,20 2,80 9,20 2,50 Gross energy input 20,60 22,00 21,60 20,70 30,10 19,30 Co-product energy -2,30 -7,70 -4,60 -3,70 -2,00 -4,80 Net energy input 18,30 14,30 17,10 17,10 28,10 14,50 rP 1,29 1,65 1,38 1,38 0,84 1,62 Assumptions Maize yield (t/ha)a 7,50 7,50 8,80 7,70 8,70 9,00 Ethanol yield (L/kg)b 0,37 0,38 0,39 0,39 0,37 0,39 Projected rE 1,67 2,51 1,40 1,91 a Maize yield is the number of metric tons shelled maize produced per hectare of land per crop cycle. b Ethanol yield is the number of litres of ethanol produced from a kilogram of maize. Source: Hammerschlag, 2006
Most ethanol plants do not only manufacture ethanol but also one or more co-product. The
allocation of co-products can sometimes be controversial. The agricultural and industrial
inputs to the ethanol production process must be allocated among ethanol as well as the
co-products output along with it. Of the studies reviewed by Hammerschlag, only Kim and
Dale (2005) have applied the most sophisticated allocation approach as recommended by
the International Organization for Standardization (ISO). Using this approach, allocation
procedures are avoided in the foreground system by introducing avoided environmental

63
burdens associated with alternative products (Kim & Dale, 2005). For example, the
distillers dried grain with solids (DDGS) produced during the dry-grind processing of maize
for ethanol production can replace soybean meal. The environmental burdens associated
with soybean meal production are therefore avoided through the use of DDGS.
The large energy inputs reported by Pimentel and Patzek are due to conservative
assumptions regarding efficiency, the inclusion of a few upstream energy burdens not
included by other analysts and a very small energy allocation to co-products. The
unusually low agricultural energy input by Kim and Dale is due to the fact that they
examined no-till maize farming.
Excluding the Pimentel and Patzek data, rE ranges from 1,29 to 1,65 in the surveys
published by Hammerschlag, with an average of 1,46 ± 0,16. This indicates that even with
existing technology, maize ethanol is returning at least some renewable energy on its
investment of fossil energy. The Pimentel and Patzek data is the exception, with rE < 1
implying that there is no renewable energy return on the fossil fuel invested.
Hammerschlag used data published by Graboski (2002) to calculate a rE of 0,76 for the
energy return on investment for petrol. Even if the low rE value calculated by Pimentel and
Patzek is correct, maize ethanol still appears to provide an improvement in fossil fuel
consumption on a MJ-for-MJ basis when it is used to displace petrol.
7.3.5 Greenhouse gas balance
In recent years, a number of authors have calculated the environmental implication of
maize ethanol production and use (Graboski, 2002; Pimentel & Patzek, 2005a; Shapori &
McAloon, 2004). These calculations are highly sensitive to assumptions on both system
boundaries and key parameter values. However, a comparison of published studies for
evaluating how these assumptions affect outcomes is difficult owing to the use of different
units and system boundaries. To better understand the energy and environmental
implications of ethanol, Farrel et al. (2006) conducted a survey of published literature and
made a comparison of six studies on ethanol from maize (Farrel, Plevin, Turner, Jones,
O'Hare & Kammen, 2006). They used a computer model to replicate the published data.
Sensitivity analysis showed that calculations are most sensitive to assumptions about co-

64
product allocation. Co-products of ethanol production displace competing products that
impact on the environment when they are produced.
The authors used the model to add co-product credits where needed, applied a consistent
system boundary by adding missing parameters, accounted for different energy types and
calculated policy relevant metrics. Calculations with the corrected data showed that
ethanol production from maize had a net positive energy balance (also see 7.3.4) and
reduced greenhouse gas emissions by 13%. The analysis also showed that agricultural
practices were the main contributor to greenhouse gas emissions (34 – 44%) and
petroleum inputs (45 – 80%). This suggests that policies aimed at reducing the
environmental impact are likely to result in improved environmental performance. For
example, conservation tillage reduces petroleum consumption and greenhouse gas
emissions, as well as soil erosion and agricultural runoff.
7.3.6 Impact on food supply and price
In the United States as well as the rest of the developed world, maize is primarily used as a
livestock fodder. In contrast, 96% of the maize produced in Africa is consumed directly by
humans (McCann, 2006). Among the 22 countries in the world where maize is a staple
food, sixteen are in Africa. In Zambia for example, maize consumption accounts for 58% of
total calories in the national diet. In agricultural terms, the world’s appetite for
transportation fuel is insatiable (Brown, 2006). The grain required to fill a 95 litre tank of
the average 4 x 4 vehicle with ethanol is enough to feed one person for a year.
The profitability of maize ethanol in the United States, where ethanol is subsidized with
US$ 0,51 per gallon (in effect until 2010), caused many investors to jump on the
bandwagon (Brown, 2006; Wen et al., 2007). In May 2005, the 100th ethanol distillery
started production in the United States and another 34 were under construction. With so
many distilleries being built, livestock and poultry producers are concerned that there might
not be enough maize to produce meat, milk and eggs. Maize importing countries are also
concerned since the United States supplies 70% of world maize exports.
Food and livestock producers that convert maize into products for supermarket shelves
used to be the only buyers of maize. Now a new buyer has entered the market, a buyer

65
that buys maize for the distilleries in order to supply ethanol to service stations. As oil’s
price per barrel continues to increase, producing ethanol for farm commodities becomes
increasingly profitable. The price of oil in effect becomes the support price for food
commodities. The danger is that whenever the food value of a commodity drops below its
value as fuel, the market will convert it into fuel. If this happens and unless the United
States government intervenes to prevent the food-fuel conflict, low income consumers will
be hit hardest by the resultant increase in grain prices.
7.3.7 Starch ethanol in South Africa
South Africa has an established maize industry with a generally growing surplus, as well as
land available to further increase production (Figure 7.5). It is estimated that South Africa
is currently only using 25% of the land suitable for maize production. Current production is
sufficient to meet, and sometimes exceed local demand. The land used for maize
production has halved since 1970, but the yield per hectare has doubled. In 2004,
2,8 million hectares were used for maize production in South Africa. The yield per hectare
is currently between 3 and 4 tons with an average of 370 litres of ethanol produced per ton
of maize (Hammerschlag, 2006). This implies that South Africa would be able to produce
3,6 billion litres of ethanol if the total current maize harvest were to be used for ethanol.
This would not be possible with the current demand for maize. However, if all suitable land
were used for maize production, South Africa could in theory meet local maize demand and
furthermore produce 10,2 billion litres of ethanol.
0500
1 0001 5002 0002 5003 0003 5004 0004 5005 000
1920 1940 1960 1980 2000Production year
Are
a un
der m
aize
(100
0 H
a)
Figure 7.5. Historical area of land used for the production of maize in South Africa
Source: Ethanol Africa, 2007
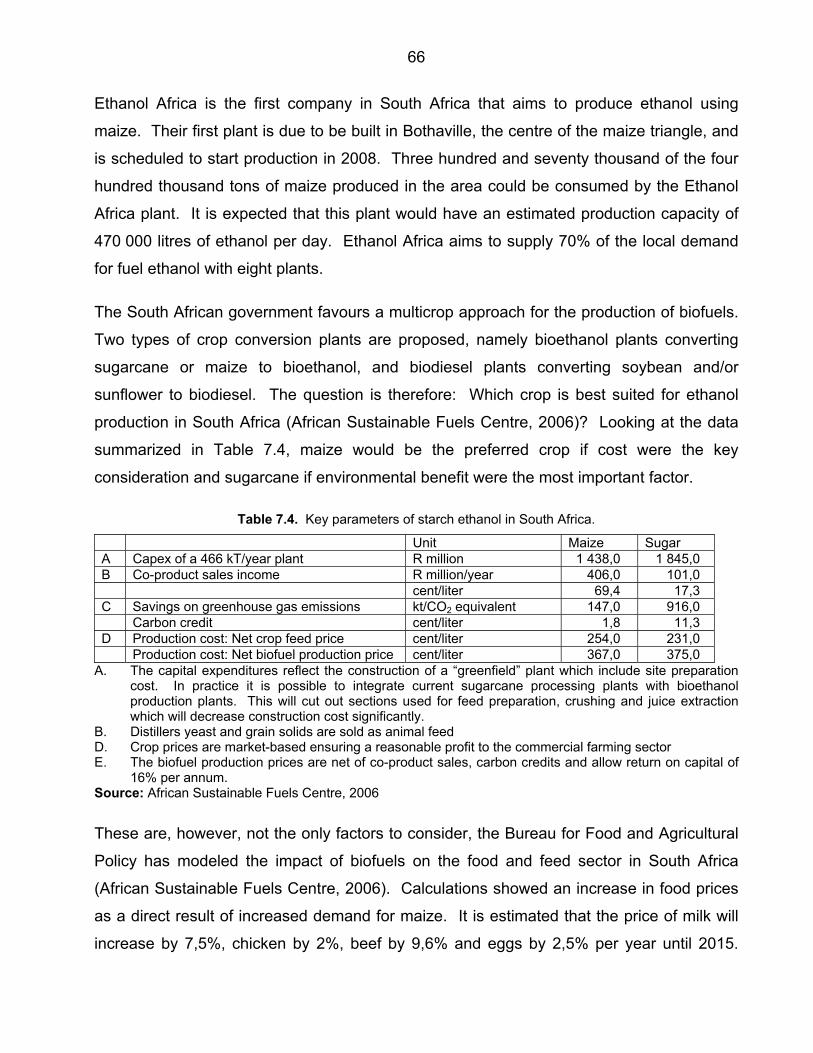
66
Ethanol Africa is the first company in South Africa that aims to produce ethanol using
maize. Their first plant is due to be built in Bothaville, the centre of the maize triangle, and
is scheduled to start production in 2008. Three hundred and seventy thousand of the four
hundred thousand tons of maize produced in the area could be consumed by the Ethanol
Africa plant. It is expected that this plant would have an estimated production capacity of
470 000 litres of ethanol per day. Ethanol Africa aims to supply 70% of the local demand
for fuel ethanol with eight plants.
The South African government favours a multicrop approach for the production of biofuels.
Two types of crop conversion plants are proposed, namely bioethanol plants converting
sugarcane or maize to bioethanol, and biodiesel plants converting soybean and/or
sunflower to biodiesel. The question is therefore: Which crop is best suited for ethanol
production in South Africa (African Sustainable Fuels Centre, 2006)? Looking at the data
summarized in Table 7.4, maize would be the preferred crop if cost were the key
consideration and sugarcane if environmental benefit were the most important factor.
Table 7.4. Key parameters of starch ethanol in South Africa.
Unit Maize Sugar A Capex of a 466 kT/year plant R million 1 438,0 1 845,0 B Co-product sales income R million/year 406,0 101,0 cent/liter 69,4 17,3 C Savings on greenhouse gas emissions kt/CO2 equivalent 147,0 916,0 Carbon credit cent/liter 1,8 11,3 D Production cost: Net crop feed price cent/liter 254,0 231,0 Production cost: Net biofuel production price cent/liter 367,0 375,0
A. The capital expenditures reflect the construction of a “greenfield” plant which include site preparation cost. In practice it is possible to integrate current sugarcane processing plants with bioethanol production plants. This will cut out sections used for feed preparation, crushing and juice extraction which will decrease construction cost significantly.
B. Distillers yeast and grain solids are sold as animal feed D. Crop prices are market-based ensuring a reasonable profit to the commercial farming sector E. The biofuel production prices are net of co-product sales, carbon credits and allow return on capital of
16% per annum. Source: African Sustainable Fuels Centre, 2006
These are, however, not the only factors to consider, the Bureau for Food and Agricultural
Policy has modeled the impact of biofuels on the food and feed sector in South Africa
(African Sustainable Fuels Centre, 2006). Calculations showed an increase in food prices
as a direct result of increased demand for maize. It is estimated that the price of milk will
increase by 7,5%, chicken by 2%, beef by 9,6% and eggs by 2,5% per year until 2015.

67
These predicted increases are not as severe as those predicted for other countries since
South Africa would mostly use surplus and export-directed production for biofuel.
7.4 ETHANOL FROM CELLULOSE
7.4.1 The current industry
Although ethanol is typically produced from starch contained in grains such as maize, or
sucrose obtained from sugarcane, it can also be produced from cellulose (Renewable
Fuels Association, 2007; Wald, 2007). Cellulose is the main component in the cell walls of
plants and is therefore the most abundant organic compound on earth. Making ethanol
from cellulose significantly expands the types and amounts of materials available for
ethanol production. Many of these materials are presently regarded as waste requiring
disposal, such as maize stalks, rice straw, wood chips and bagasse (Sheehan, Aden,
Paustian, Killian, Brenner, Walsh & Nelson, 2004). Cellulosic ethanol can also be
produced from energy crops grown specifically for fuel production, such as switchgrass
(see section 5.4.1) and Miscanthus (see section 5.4.2).
With an average of 0,77 vehicles per inhabitant, the United States is the largest consumer
of transportation fuel in the world (Table 2.3). The question is whether biofuels could
replace fossil fuel in such an economy. If one assumes no improvement in vehicle
efficiency and a continued growth in driving, the United States would consume 1 100 billion
litres of petrol by 2050 (Renewable Fuels Association, 2007). There is no foreseeable way
of meeting this demand by any renewable resource. However, if vehicle efficiency is
increased to 21 km/l petrol or better and smart growth policies are instituted, total
consumption could be limited to 410 billion litres. Current technology allows the production
of 210 litres of ethanol per dry metric ton of biomass. Experts believe technology could
improve sufficiently to increase this figure to 488 litres per dry ton of biomass. Current
average yields of switchgrass are 11 tons of dry biomass per hectare. Crop experts predict
that standard breeding techniques could more than double this to 27,8 dry tons per
hectare. Once it is possible to achieve such yields, it would be possible to grow sufficient
switchgrass on 46 million hectares of land for producing 624 billion litres of ethanol, which
is equivalent to 410 billion litres of petroleum. This would imply a whole new scale of

68
agriculture considering the fact that the United States is the world largest maize producer,
an industry built on 28 million hectares of land.
With such lucrative possibilities, why are there still no commercial-sized production facilities
using cellulosic materials? The answer lies in the production process. Although there are
similarities between the cellulosic and starch processes, the techno-economic challenges
facing the former are large. The only cellulose to ethanol plant in the world is the 4 million
litres per annum Iogen plant in Ottawa, Ontario. Iogen makes ethanol from agricultural
residues such as wheat straw, maize stalks and other fibrous material (Dent, 2005). The
ethanol they produce is chemically identical to ethanol made from maize but has the added
advantage of providing producers with a value-added option for utilizing excess crop
residues.
7.4.2 Production process
The recalcitrance of cellulosic biomass is an obstacle to the cost-effective production of
both fuels and chemicals from cellulose-rich materials (Lynd, Wyman & Gerngross, 1999).
Approaches for overcoming the recalcitrance of cellulosic biomass include gasification,
acid hydrolysis and pretreatment/enzymatic hydrolysis (Chandra, Bura, Mabee, Berlin,
Pan, & Saddler, 2007). All have been thought to be competitive in terms of cost during the
1990s although the economics of these processes differ with respect to their potential for
future improvement. Enzyme hydrolysis has in the context of modern molecular biology
been studied and developed for only about a decade. Gasification and acid hydrolysis
have been practiced to a degree for more than 50 years and further significant process
improvements are therefore unlikely. On the other hand, an order of magnitude reduction
in cost of biological processing in the pretreatment/enzymatic hydrolysis is expected within
the next decade. This discussion will therefore focus on the enzymatic hydrolysis.
Iogen make use of the pretreatment/enzymatic hydrolysis process and thus uses all three
main components of agricultural residues (namely. cellulose, hemicellulose and lignin), and
therefore generates very little waste (Dent, 2005). The typical lignocellulose to ethanol
process consists of a number of separate steps: biomass pretreatment, enzyme
production, cellulose hydrolysis, hexose fermentation, pentose fermentation, distillation and

69
effluent treatment (Figure 7.6) (Cardona & Sanchez, 2007). During pretreatment, the
tough, fibrous plant material is physically broken down into a pulp. The resulting solid
fraction contains mostly cellulose and lignin while the liquid fraction contains hemicellulose
and a number of inhibitors (i.e. compounds that limit enzyme action and microbial growth).
In the next step, cellulose hydrolysis, the cellulose fraction is treated with enzymes to break
it down to glucose. The enzymes used for this step is produced in a separate step by the
fungus Trichoderma reesei. It is also possible to hydrolyze cellulose with diluted acid, but
this is a harsh process with toxic degradation products.
HexoseFermentation
CelluloseHydrolysis
Production ofCellulases
PentoseFermentation
Distillation
Detoxification
EthanolDehydration
EffluentTreatment
Pre-treatment
CBP
SSFSSCF
CF
Biomass
Liquid fractionSolid fraction
EthanolEthanolAnhydrous
Ethanol
Waste streams
HexoseFermentation
CelluloseHydrolysis
Production ofCellulases
PentoseFermentation
Distillation
Detoxification
EthanolDehydration
EffluentTreatment
Pre-treatment
CBP
SSFSSCF
CF
Biomass
Liquid fractionSolid fraction
EthanolEthanolAnhydrous
Ethanol
Waste streams
Figure 7.6. The production of ethanol from lignocellulose. Source: Cardona & Sanchez, 2007
After hydrolysis of the cellulose, the resulting glucose is fermented to ethanol with the
Saccharomyces cerevisiae yeast. Separate Hydrolysis and Fermentation (SHF) is one of
the configurations that has been tested for ethanol production from cellulose. A variation of

70
SHF is Simultaneous Saccharification and Fermentation (SSF). During SSF enzymes and
yeast are added to the cellulose fraction. Cellulose breakdown and glucose fermentation is
therefore done in a single step. Once fermentation is complete, the ethanol is recovered
by means of distillation. Lignin has an energy density similar to coal and is burned for the
production of energy during the ethanol production process while the surplus is used for
the production of electricity.
Pentose fermentation is generally carried out in a separate unit after detoxification of the
liquid fraction to remove inhibitors. Separate fermentation is necessary since pentose
utilizing microorganisms ferments pentoses and hexoses more slowly than S. cerevisiae,
which only ferments hexoses. Furthermore, pentose fermenting microorganisms are more
sensitive to inhibitors and ethanol. For this reason, the hemicellulose fraction needs to be
detoxified before pentose fermentation can start. Detoxification increases the cost of
ethanol production. Therefore, by separating the hexose and pentose fermentation
processes, a smaller volume of pretreated material needs to be detoxified. For this reason,
Co-fermentation (CF) and Simultaneous Saccharification and Co-Fermentation (SSCF) are
not often used in industry. Due to the cost involved in detoxification, many lignocellulosic
ethanol plants do not process the hemicellulose fraction at all but treat it as waste.
Consolidated BioProcessing (CBP) is being developed to combine enzyme preparation,
cellulose hydrolysis, hexose fermentation and pentose fermentation into a single step. It
would greatly reduce lignocellulosic ethanol production cost. Unfortunately, CBP is not yet
possible, since it requires a microorganism capable of producing the enzymes required to
break down cellulose as well as hemicellulose, and it should be capable of fermenting both
hexose and pentose sugars. No known microorganism currently exhibits all these
characteristics.
7.4.3 Environmental impact of ethanol production
The process for the production of ethanol from cellulosic material generates very little
waste. Effluents from biomass processing facilities are compatible with conventional
treatment technologies and are not expected to present a significant burden on the
environment if managed responsibly (Lynd, 2003). However, a real danger to the
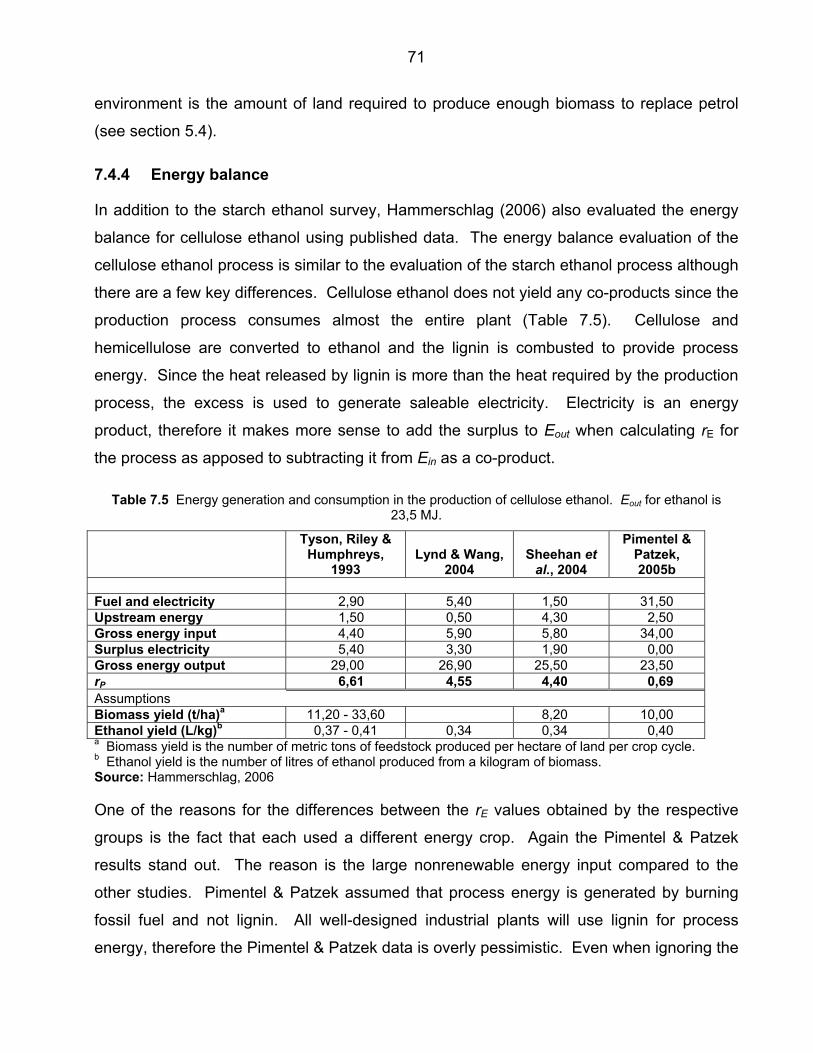
71
environment is the amount of land required to produce enough biomass to replace petrol
(see section 5.4).
7.4.4 Energy balance
In addition to the starch ethanol survey, Hammerschlag (2006) also evaluated the energy
balance for cellulose ethanol using published data. The energy balance evaluation of the
cellulose ethanol process is similar to the evaluation of the starch ethanol process although
there are a few key differences. Cellulose ethanol does not yield any co-products since the
production process consumes almost the entire plant (Table 7.5). Cellulose and
hemicellulose are converted to ethanol and the lignin is combusted to provide process
energy. Since the heat released by lignin is more than the heat required by the production
process, the excess is used to generate saleable electricity. Electricity is an energy
product, therefore it makes more sense to add the surplus to Eout when calculating rE for
the process as apposed to subtracting it from Ein as a co-product.
Table 7.5 Energy generation and consumption in the production of cellulose ethanol. Eout for ethanol is 23,5 MJ.
Tyson, Riley & Humphreys,
1993 Lynd & Wang,
2004 Sheehan et
al., 2004
Pimentel & Patzek, 2005b
Fuel and electricity 2,90 5,40 1,50 31,50 Upstream energy 1,50 0,50 4,30 2,50 Gross energy input 4,40 5,90 5,80 34,00 Surplus electricity 5,40 3,30 1,90 0,00 Gross energy output 29,00 26,90 25,50 23,50 rP 6,61 4,55 4,40 0,69 Assumptions Biomass yield (t/ha)a 11,20 - 33,60 8,20 10,00 Ethanol yield (L/kg)b 0,37 - 0,41 0,34 0,34 0,40 a Biomass yield is the number of metric tons of feedstock produced per hectare of land per crop cycle. b Ethanol yield is the number of litres of ethanol produced from a kilogram of biomass. Source: Hammerschlag, 2006
One of the reasons for the differences between the rE values obtained by the respective
groups is the fact that each used a different energy crop. Again the Pimentel & Patzek
results stand out. The reason is the large nonrenewable energy input compared to the
other studies. Pimentel & Patzek assumed that process energy is generated by burning
fossil fuel and not lignin. All well-designed industrial plants will use lignin for process
energy, therefore the Pimentel & Patzek data is overly pessimistic. Even when ignoring the

72
Pimentel & Patzek study, the data still ranges from 4,40 to 6,61. This is because unlike
sugar and starch ethanol, cellulosic ethanol is still a developing technology. Since the
technology is still developing, there is potential for mature processes to deliver ethanol with
considerably greater rE values. If one assumes the same improvement as those obtained
with sugar, it would not be unreasonable to expect rE values of more than 10 (Figure 7.7).
0
200
100
300
700
1980 2005199519901985
Prod
uctio
n co
st
600
500
400
2000
A
+3,77% aa em29 anos2 000
4 000
3 000
5 000
6 000
1975 2004199719901982
Litre
s et
hano
l per
hec
tare
B
Figure 7.7. Learning curves for sugar ethanol showing the (A) decrease in production cost and (B) the increase in the ethanol yield per hectare as technology improves.
Source: Glodemberg, 2007; Khosla, 2006
7.4.5 Greenhouse gas balance
Farrel and co-workers used the best data from six studies to calculate the greenhouse gas
emissions for three ethanol production scenarios, two of which are discussed here (Farrel
et al., 2006). Scenario 1 (Maize) uses typical values for the current United States maize
ethanol industry and Scenario 2 (Cellulosic) assumes the production of ethanol from
switchgrass (Figure 7.8). For both these scenarios, producing one mega joule (MJ) of
ethanol requires significantly less fossil fuel than is required to produce one MJ of petrol.
The greenhouse gas emissions vary greatly depending on the production process. Maize
ethanol production causes far more greenhouse gas emissions at 81 kg CO2–equivalent
per MJ ethanol compared to 11 for cellulosic ethanol.

73
CoalNaturalGas OtherPetroleum
Petroleum production Refinery
Inputs Farm Biorefinery
Petroleum
Ethanol
MaizeCellulosic
0.050.08
0.30.02
0.4-0.02
0.040.02
Otherproducts
Petrol 1.1 0.03 0.05 0.01
GHGs in theatmosphere
94
8111
Figure 7.8. A diagram for evaluating ethanol production processes indicating the use of primary energy inputs (MJ) and of net greenhouse gas emissions (kg CO2 equivalent) per MJ of fuel.
Source: Farrel et al., 2006
The calculation of the energy and greenhouse gas balances is based on current
technology. It is important to keep in mind that cellulosic ethanol production is undergoing
major technological development and that the cultivation of cellulosic feedstocks is not as
far advanced as maize agriculture. It is therefore not unrealistic to expect significant
process improvements in future.
7.4.6 Impact on food supply and price
It is unlikely that cellulosic ethanol would directly impact on food supply and price. The
feedstock used for the production of cellulosic ethanol is mostly agricultural waste products
or fast growing perennial grass. The only way it might impact, is if land currently used for
maize farming is planted with crops to be used for the production of cellulosic ethanol.
7.4.7 Cellulosic ethanol in South Africa
As a response to the threat of continued sanctions as well as the increase in oil prices,
South Africa aggressively worked towards the development of alternatives to petroleum-
based fuels during the 1970s. “From the late 1970s to the early 1990s South Africa’s
research and development effort to convert cellulosic biomass to fuels and chemicals was
among the largest anywhere and in several respects can be said to have been ahead of its
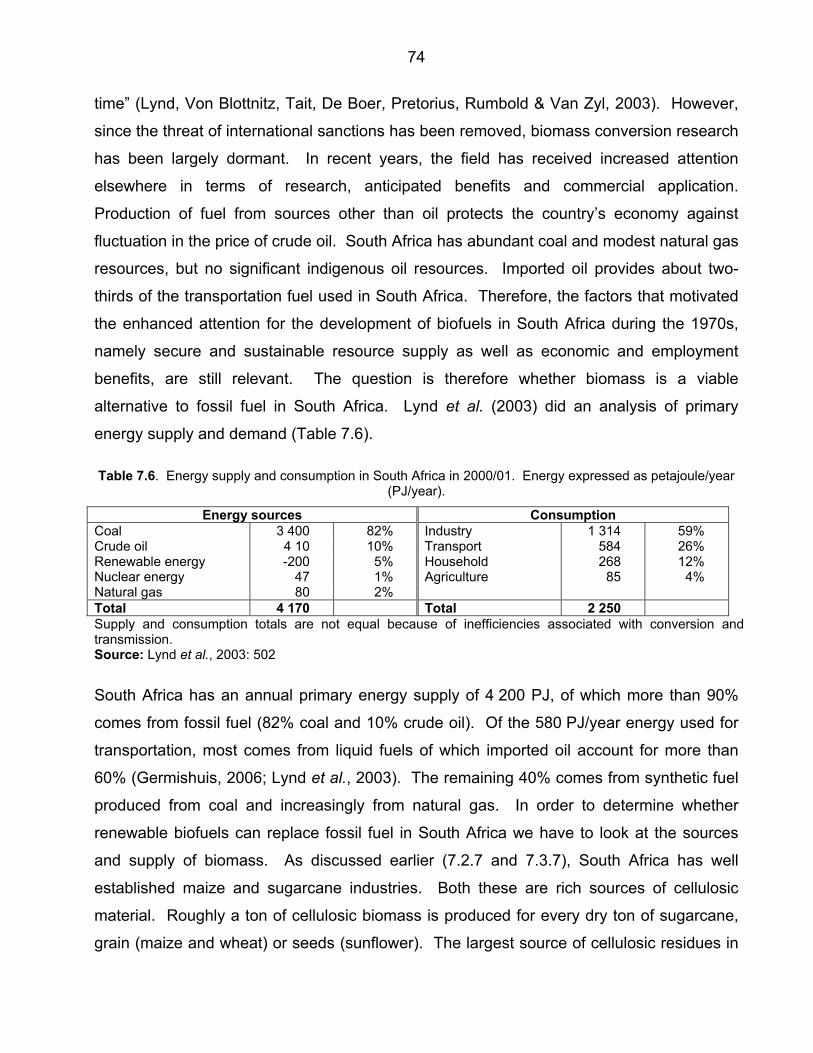
74
time” (Lynd, Von Blottnitz, Tait, De Boer, Pretorius, Rumbold & Van Zyl, 2003). However,
since the threat of international sanctions has been removed, biomass conversion research
has been largely dormant. In recent years, the field has received increased attention
elsewhere in terms of research, anticipated benefits and commercial application.
Production of fuel from sources other than oil protects the country’s economy against
fluctuation in the price of crude oil. South Africa has abundant coal and modest natural gas
resources, but no significant indigenous oil resources. Imported oil provides about two-
thirds of the transportation fuel used in South Africa. Therefore, the factors that motivated
the enhanced attention for the development of biofuels in South Africa during the 1970s,
namely secure and sustainable resource supply as well as economic and employment
benefits, are still relevant. The question is therefore whether biomass is a viable
alternative to fossil fuel in South Africa. Lynd et al. (2003) did an analysis of primary
energy supply and demand (Table 7.6).
Table 7.6. Energy supply and consumption in South Africa in 2000/01. Energy expressed as petajoule/year (PJ/year).
Energy sources Consumption Coal 3 400 82% Industry 1 314 59% Crude oil 4 10 10% Transport 584 26% Renewable energy -200 5% Household 268 12% Nuclear energy 47 1% Agriculture 85 4% Natural gas 80 2% Total 4 170 Total 2 250 Supply and consumption totals are not equal because of inefficiencies associated with conversion and transmission. Source: Lynd et al., 2003: 502
South Africa has an annual primary energy supply of 4 200 PJ, of which more than 90%
comes from fossil fuel (82% coal and 10% crude oil). Of the 580 PJ/year energy used for
transportation, most comes from liquid fuels of which imported oil account for more than
60% (Germishuis, 2006; Lynd et al., 2003). The remaining 40% comes from synthetic fuel
produced from coal and increasingly from natural gas. In order to determine whether
renewable biofuels can replace fossil fuel in South Africa we have to look at the sources
and supply of biomass. As discussed earlier ( 7.2.7 and 7.3.7), South Africa has well
established maize and sugarcane industries. Both these are rich sources of cellulosic
material. Roughly a ton of cellulosic biomass is produced for every dry ton of sugarcane,
grain (maize and wheat) or seeds (sunflower). The largest source of cellulosic residues in

75
South Africa therefore comes from agriculture (Table 7.7). Another significant resource
stems from forestry. This industry is broadly distributed throughout South Africa with the
greatest quantities available in the eastern third of the country. Finally, invasive alien plant
species could be added to the total amount of biomass available for ethanol production.
These plants emerged recently as a matter of concern, particularly in the Western Cape
where non-native Acacia species are seen as a threat to the unique fynbos ecotype. The
Department of Water affairs and Forestry initiated the Working for Water program in 1995
to remove these plants. The aim of the program is to: (i) prevent the loss of biodiversity, (ii)
avoid the loss of water, (iii) regain potential productive land and (iv) control the cost of fire
protection. More than R1 billion has been spent and 21 700 jobs have been created. The
biomass collected is converted to wood chips and charcoal for which there is a demand of
145 000 tons per year. This is far less than the estimated 8,7 million tons of biomass
available in the form of invasive aliens per year, a figure which could double in the next
15 years if left uncontrolled.
Table 7.7. Sources of potentially available biomass resources in South Africa.
Million tons/year Petajoule/year 1. Residues Agricultural Maize stover 6,7 118 Sugarcane bagasse 3,3 58 Wheat straw 1,6 28 Sunflower stalks 0,6 11 Subtotal 12,3 214 Forestry industry Left in forest 4,0 69 Saw mill residue 0,9 16 Paper & board mill sludge 0,1 2 Subtotal 5,0 87 2. Energy cropsa From 5% of available land 34,0 584 From 10% of available land 67,0 1170 From 20% of available land 134,0 2330 Total annual basis (assuming 10% available land) 84,0 1470 3. Invasive plant species 8,7 151 aAvailable land is land in excess of cropland required for food production and land currently used for forest or wilderness. Source: Lynd et al., 2003: 504
76
Using the above three resources, with 50% conversion efficiency, South Africa could
theoretically provide 40% of the total liquid fuel required by the transport sector without
producing any energy crops (Table 7.7). By using 10% of the available land for energy
crops, it would be possible to increase this figure to 125%. Once the necessary technology
has been developed, South Africa could theoretically become energy self-sufficient without
the need for producing large amounts of energy crops. When ethanol from sugarcane and
maize is added to the equation, South Africa could go a long way towards satisfying its
total energy requirements.
7.5 CONCLUSION
There are three types of energy feedstocks that can be used for the production of ethanol,
namely: sugar, starch and cellulose. Sugar and starch feedstocks are food crops and
using them for the production of transportation fuel would lead to an increase in food
prices. The production and use of ethanol from either sugar or starch, would lead to a net
decrease in green house emissions. Under optimal conditions, ethanol from sugar has a
very high net energy return of more than 10 compared to 1,4 for maize ethanol. Although
the technology for the production of ethanol from cellulose is still under development, it has
the potential to contribute significantly to the transportation industry worldwide, without
directly impacting food production. Depending on the technology used, the net energy
return for ethanol from cellulose will range between 4 and 40, and it will also lead to a
significant net decrease in green house gas emissions.
77
CHAPTER 8 BIOETHANOL TECHNOLOGY
8.1 INTRODUCTION
In 1925, Henry Ford called ethanol “the fuel of the future”. He also said, “The fuel of the
future is going to come from apples, weeds, sawdust – almost anything. There is fuel in
every bit of vegetable matter that can be fermented” (Chandel et al., 2007). Since then, oil
has dominated as transportation fuel although the importance of an alternative energy
source has become increasingly important (section 2.2, 2.3 and 2.4). The production of
ethanol not only predates Henry Ford, it also predates the Industrial Revolution
(Novozymes & BBI International, 2005). Technological developments since the late 20th
century have made ethanol production, especially ethanol production for fuel use, much
more efficient. As the industry has grown, tremendous improvements aimed at reducing
cost and environmental impact have been achieved. Once World War II ended, there was
no need for war materials and with the low price of petrol, the use of ethanol as fuel was
drastically reduced. This period lasted for approximately 30 years, from the late 1940s until
the 1970s. In 1973, the Arab countries of the Organization of the Petroleum Exporting
Countries (OPEC), together with Egypt and Syria announced an oil embargo against
countries that supported Israel in the ongoing Yom Kippur War (Figure 2.8) (Cole, 2006).
The embargo triggered a series of recessions that caused a worldwide increase in oil
prices for a period of almost ten years. During this time, ethanol became cheaper than oil.
In 1974, the United States president Richard Nixon announced “Project Independence”,
with the very ambitious goal of reaching total independence from foreign energy sources.
The following year, Brazil started their ethanol from sugar program, also with energy
independence in mind (Glodemberg, Coelho, Nastari & Lucon, 2004; Regis, 2007). Since
then, ethanol production technology has improved on a number of different levels.
8.2 EVOLUTION OF CURRENT TECHNOLOGY
8.2.1 Raw material production
Maize production in the United States increased from 106 million tons in 1966 to 282
million tons in 2005 (Cassman, Eidman & Simpson, 2006). More than 80% of this increase

78
is the result of higher crop yields while only approximately 20% is the result of increased
crop area. During this 40-year period, maize yields rose at a linear rate of 113 kg per
hectare (Figure 8.1A). Investment in agricultural research made this steady rate of
improvement possible. Programs that paid off included crop breeding, nutrient
management, conservation tillage systems, integrated pest management and recombinant
DNA technology. In Brazil, sugarcane production went through a similar process of crop
improvement (Figure 8.1B).
2
6
4
12
1960 2000199019801970
Gra
in y
ield
(T/h
a)
8
A
10
Improvedhybrids
Expansion of irrigation areaIncreased N fertilizer rates
Conservation tillage, soiltesting, NPK fertilization
Transgenic insectresistance
Integrated pestmanagement
Reduced nitrogenfertilizer and
irrigation
65
70
60
80
85
1977 2003199719901982
Sug
arca
ne (T
/ha)
B
75
Figure 8.1. (A) Maize production yields in the United States from 1966 – 2005. (B) Sugarcane productivity evolution in the Sao Paulo district in Brazil.
Source: (A) Cassman et al., 2006 (B) Regis, 2007
8.2.2 Plant construction cost
Since the early 1980s, the cost of constructing an ethanol production plant in the United
States has decreased from an average of US$ 2,25 per gallon to around US$ 1,00 per
gallon (Figure 8.2A) (Novozymes & BBI International, 2005). Most of this cost reduction
has been the result of small incremental improvements in the design of each new plant, the
tweaking of the process and the negotiation of lower prices from suppliers on account of
increased volumes. Not only did the construction cost come down, but also the time
involved in building a new plant. The construction time during the 1990s ranged between
16 to 24 months. This declined to 12 months or less in 2005. The capital cost involved in
ethanol production decreased and the operating cost also decreased significantly through a
number of process improvements.

79
8.2.3 Economies of scale
Increased plant capacities helps producers take advantage of economies of scale. As the
conversion process improves, plant sizes increase, thereby decreasing operation costs
(Figure 8.2A).
0,5
1,0
0
2,5
3,0
1970s 2000199519901980s
A
1,5
2,0
Cost of operation ($/gal)Capital cost ($/gal)
$/ga
l
0,05
0
0,20
0,25
1970s 2000199519901980s
B
0,10
0,15
Figure 8.2. Maize ethanol production cost. (A) Capital and operating cost (B) Labour cost. Source: Novozymes & BBI International, 2005
8.2.4 Process automation
Computer automation has reduced the number of employees required, while technological
advancements implemented throughout operations reduce equipment requirements,
enabling plants to become more streamlined (Figure 8.2A &B) (Novozymes & BBI
International, 2005). Computerized control enables much narrower process tolerances to
be achieved so that costs are further reduced and productivity increased.
8.2.5 Molecular sieves
The introduction of the molecular sieves was probably the single most significant
improvement made to the ethanol production process (U.S.Department of Energy, 2002).
Molecular sieves are often compared with a bed of ceramic beads that absorb water
molecules as vaporized ethanol passes though the bed. Molecular sieve technology is low
in cost and easy to operate. It quickly became the system of choice for dehydration
because it eliminated the use of hazardous chemicals like cylohexane or benzene from the
distillation (Novozymes & BBI International, 2005). Furthermore, it eliminated the need for
a second distillation column from the dehydration process saving up to US$ 250 000 per
installation. It also reduced the energy consumed during distillation by as much as 20%.

80
8.2.6 Thermal integration
Heating and cooling liquids are part of the ethanol production process (U.S.Department of
Energy, 2002). Modern engineering enables the capturing of process heat, which can then
be re-used or redirected to other areas. This significantly reduces the total energy
requirements of the plant.
8.2.7 Enzymes
Enzymes are of particular importance for the ethanol industry. They were first used during
the 1950s (Novozymes & BBI International, 2005). Since then, enzyme technology has
improved significantly and a much wider range of enzymes is available for industrial
processes.
Enzymes are proteins produced by microorganisms under controlled conditions
(Novozymes & BBI International, 2005). These proteins act as catalysts, allowing specific
chemical reactions to take place at moderate temperatures and pH’s. Biotechnology has
selected and modified these enzymes to operate efficiently in industrial conditions. Modern
enzyme preparations used in the starch to ethanol industry are more productive in breaking
down starch to fermentable sugars, leading to improved fermentation yields. They operate
at a much wider pH range and therefore do not require the addition of lime. The use of
enzymes for the breakdown of starch also lowers the viscosity of the mash. Lower
viscosity mash translates into less process water, which subsequently leads to a reduction
in process energy since less heating and cooling energy is required.
Historically, starch breakdown (saccharification) required temperatures of approximately
60°C, a temperature that allows bacteria to grow. Therefore, it is not uncommon to loose a
batch of mash during saccharification as a result of bacterial contamination. This
represents a significant loss in terms of raw materials and reactor time. By combining
saccharification and fermentation (Simultaneous Saccharification and Fermentation, SSF)
the yeast can convert glucose to ethanol as it is released from starch by the enzymes,
never allowing bacteria to take over. Furthermore, SSF prevents inhibition of enzyme
activity as a result of high glucose concentration, since the process does not allow glucose

81
to accumulate to inhibiting levels. Improved yields are also possible with SSF since the
yeast is not stressed by adding it to mash with a high glucose concentration.
For those who still prefer pre-fermentation saccharification, more heat stable enzymes are
available which allows saccharification at 65°C, thus reducing the risk of bacterial
contamination. Improvements in enzyme technology and a reduction in the enzyme
production cost of starch enzymes have lowered the price of ethanol by US$ 0,016 per
litre.
In order to reduce cellulose breakdown cost, four approaches have been used (Mabee &
Saddler, 2005). (i) The production cost of the enzymes has been decreased (ii) breakdown
performance and enzyme activity have been improved (iii) enzymes have been recycled or
re-used and (iv) better reactors have been designed for the application of enzymes. In
2001, a major study was undertaken by the National Renewable Energy Laboratory
(NREL), in partnership with Novozymes and Genencor, to reduce the cost of enzymes for
the cellulose ethanol industry. By January 2004, both Genencor and Novozymes had
succeeded in reducing costs by a factor of 12, thereby exceeding the original target
(Novozymes, 2005). By April 2004, Novozymes enzymes combined with NREL’s
improvements in pretreatment were shown to achieve a 20x cost reduction. The
Novozymes contract was concluded with a validated enzyme cost of US$ 0,10 – 0,18 per
gallon ethanol produced, a more than 30 fold cost reduction (Figure 8.3).
3
-1
6
7
4
5
US$
/gal
Starch Cellulose2001
Cellulose2005
2
1
0
Enzyme
Feedstock
Variable OperatingCosts
Labor, Supplies andOverheads
Depreciation
Co-Products
Total
EnzymeEnzyme
FeedstockFeedstock
Variable OperatingCostsVariable OperatingCostsVariable OperatingCosts
Labor, Supplies andOverheadsLabor, Supplies andOverheadsLabor, Supplies andOverheads
DepreciationDepreciation
Co-ProductsCo-Products
TotalTotal
Figure 8.3. Comparison of the input costs of the starch and cellulose bioethanol production processes. Source: Novozymes, 2005
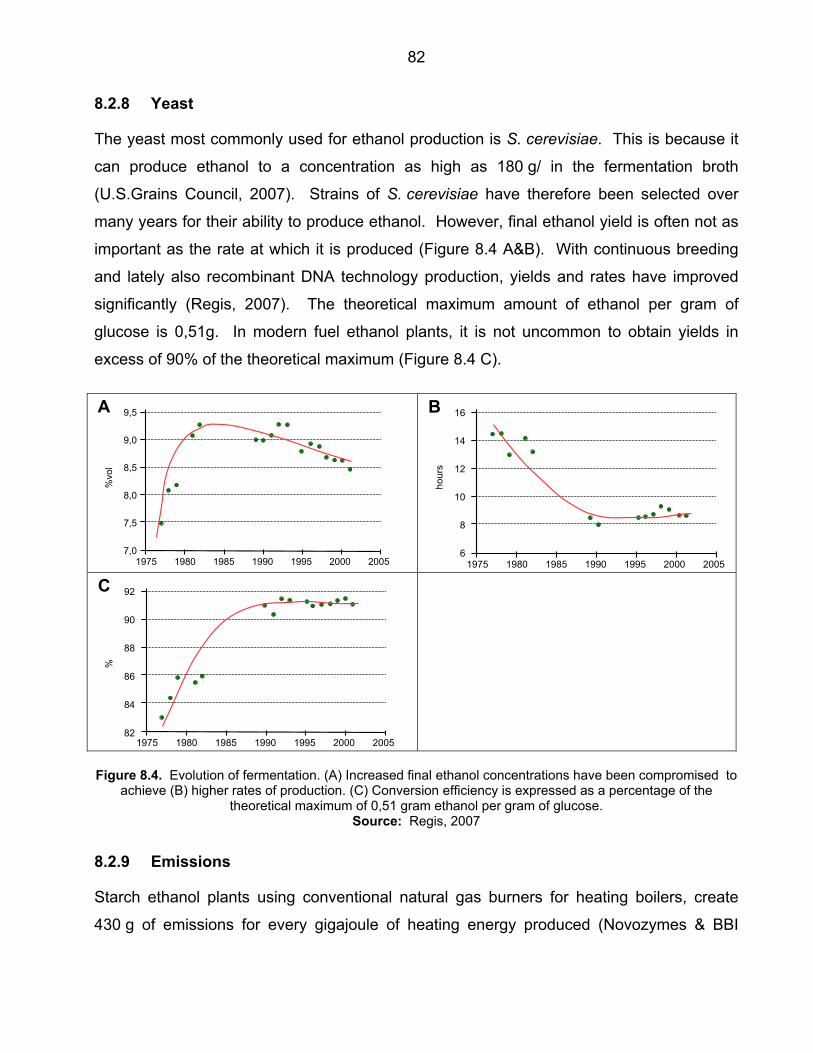
82
8.2.8 Yeast
The yeast most commonly used for ethanol production is S. cerevisiae. This is because it
can produce ethanol to a concentration as high as 180 g/ in the fermentation broth
(U.S.Grains Council, 2007). Strains of S. cerevisiae have therefore been selected over
many years for their ability to produce ethanol. However, final ethanol yield is often not as
important as the rate at which it is produced (Figure 8.4 A&B). With continuous breeding
and lately also recombinant DNA technology production, yields and rates have improved
significantly (Regis, 2007). The theoretical maximum amount of ethanol per gram of
glucose is 0,51g. In modern fuel ethanol plants, it is not uncommon to obtain yields in
excess of 90% of the theoretical maximum (Figure 8.4 C).
7,5
7,0
9,0
9,5
1975 2000199019851980
A
8,0
8,5
1995 2005
%vo
l
8
6
14
16
1975 2000199019851980
B
10
12
1995 2005
hour
s
84
82
90
92
1975 2000199019851980
C
86
88
1995 2005
%
Figure 8.4. Evolution of fermentation. (A) Increased final ethanol concentrations have been compromised to achieve (B) higher rates of production. (C) Conversion efficiency is expressed as a percentage of the
theoretical maximum of 0,51 gram ethanol per gram of glucose. Source: Regis, 2007
8.2.9 Emissions
Starch ethanol plants using conventional natural gas burners for heating boilers, create
430 g of emissions for every gigajoule of heating energy produced (Novozymes & BBI

83
International, 2005). With modern burners, this has decreased to 21 g and in some plants
as low as 15 g. Emissions created by the DDGS dryers have also been reduced
significantly. Particular attention has been given to the volatile organic compounds in dryer
emissions in order to minimize odors. Today, nearly all plants being built are fitted with a
thermal oxidizer. Exhaust gases from the DDGS dryer are directed to the thermal oxidizer
where pollutants in the stream are incinerated at high temperatures.
8.2.10 Wastewater
In most modern ethanol plants, wastewater is directed to anaerobic reactors (anaerobic
digester) where anaerobic bacteria degrades and remove up to 95% of the organic matter
left after fermentation (Novozymes & BBI International, 2005). This process produces
methane gas, which is used for heating elsewhere on the plant. Water from the digester is
recycled back into the process stream, thereby reducing the amount of wastewater
discharged. Plants now only discharge water from the makeup water treatment system
and cooling tower. Other than the cost saving associated with wastewater treatment in
traditional plants, modern plants could be designed as “zero process water discharge”
facilities. The need to connect to local wastewater treatment services is eliminated
allowing these plants to be built in rural areas near sources of raw materials.
8.3 FUTURE OUTLOOK
8.3.1 Future outlook for starch ethanol
Both sugar and maize ethanol are mature technologies compared to cellulose ethanol.
However, this does not mean all new development is focused only on cellulose. Scientists
are continuously searching for ways of improving the starch process.
8.3.1.1 Raw starch process
The first step in the maize ethanol process is the addition of process water to the milled
grain. During the next step the slurry is cooked. This is done for two reasons: to kill
potential contaminating organisms, and to cook the raw starch since enzymes currently
used for the breakdown of starch are not very efficient at hydrolyzing raw starch
(Novozymes & BBI International, 2005). New process technologies are in development

84
that would allow the production of ethanol from raw starch. Some of these technologies
have been tested successfully in full scale production plants, but needs further
optimization. The raw starch process has the advantages of using significantly less
heating and cooling energy.
8.3.1.2 Thermotolerant yeast
The starch hydrolyzing enzymes used in the maize ethanol process typically functions
optimally at a temperature of 60°C (Novozymes & BBI International, 2005). Currently, the
mash needs to be cooled to 32°C prior to adding the yeast , as the yeast functions
optimally at 32°C. The fermentation process would clearly be significantly more efficient if
the yeast were able to function at 60°C. If typical fermentation kinetics could be applied at
60°C, fermentation time at 60°C would be one fourth of the fermentation time at 32°C.
Fortunately, modern heat exchangers would have no problem removing the additional heat
generated at such a high fermentation rate. A further advantage of a higher fermentation
temperature would be the fact that ethanol would start evaporating, leaving a lower
concentration of ethanol in the reactor. Therefore, ethanol would be less likely to inhibit the
fermentation process.
While thermotolerant yeasts are still only a dream, it is not unrealistic to expect
biotechnology to make this a reality. The yeast Kluyveromyces marxianus grows very well
at 50°C (Hack & Marchant, 1998a; Hack & Marchant, 1998b; Pecota, Rajgarhia & Da Silva,
2007). It does not produce ethanol at the same rate as S. cerevisiae, but it would be
possible to increase this through genetic engineering and selection.
8.3.1.3 Recombinant yeast
In recent years, a number of different recombinant yeast strains have been developed for
the maize ethanol industry. Most of these will probably never find direct application in the
ethanol industry. However, they all provide valuable stepping stones towards the
development of the ultimate starch fermenting yeast.
Previously developed recombinant strains include yeasts capable of producing the
necessary enzyme for breaking down starch (Nakamura, Sawada & Komatsu, 2002). If

85
optimized, this strain would eliminate the enzyme production step. This would simplify the
ethanol production process and would take SSF to the next level.
8.3.2 Future outlook for cellulose ethanol
The technical challenges in converting cellulose to ethanol are significant. One main
obstacle to producing ethanol out of plant material is the fact that most of the sugar is not
readily available for fermentation by bacteria, yeast or other micro-organisms. In order to
render the sugars in the cellulose fraction accessible to conversion, it is necessary to treat
the plant fibres with a combination of chemical and enzymatic processes. Using a complex
mixture of enzymes, it is possible to break down cellulose to glucose for subsequent
fermentation to ethanol.
8.3.2.1 Process technology
Biomass processing using enzymes typically involves four biological steps: the production
of enzymes (cellullases and hemicellulases), the hydrolysis of polysaccharides (cellulose
and hemicellulose) to sugars, the fermentation of hexose sugars, and the fermentation of
pentose sugars (Figure 8.5) (Lynd, Van Zyl, McBride & Laser, 2005: 785). This 4-step
process is commonly referred to as Separate Hydrolysis and Fermentation (SHF). Other
process configurations include Simultaneous Saccharification and Fermentation (SSF), and
Simultaneous Saccharification and Co-Fermentation (SSCF), and ultimately Consolidated
BioProcessing (CBP). SHF, SSF and SSCF all rely on the production of enzymes in a
dedicated unit that operates separately from the unit used for the production of ethanol.
Reducing the enzyme production cost was therefore a significant challenge (Figure 8.3).
Research by NREL showed that there is substantially lower processing cost for SSF as
compared with SHF, and for CBP as compared to SSF and SSCF (Lynd, Elander &
Wyman, 2007). CBP is therefore likely to become the preferred technology for the future.

86
EnzymeProduction
HexoseFermentation
PolysaccharideHydrolysis
PentoseFermentation
SHF CBPSSCFSSF
O2O2 O2O2O2O2
SHF: Separate Hydrolysis & Fermentation
SSF: Simultaneous Saccharification & Fermentation CBP: Consolidated Bioprocessing
SSCF: Simultaneous Saccharification & Co-Fermentation
Figure 8.5. Evolution of biomass processing configurations featuring enzymatic hydrolysis. Sources: Lynd et al., 1999: 785
8.3.2.2 Recombinant yeast
The key to CBP is the engineering of a microorganism with all the required characteristics.
The ideal CBP organism should be able to: (Hahn-Hagerdal, Galbe, Gorwa-Grauslund,
Liden & Zacchi, 2006; Lynd et al., 2005):
• Efficiently de-polymerize biomass polysaccharides (cellulose and hemicellulose) to
fermentable sugars
• Efficiently ferment a mixed-sugar hydrolysate (hexose and pentose as well as
fermentation inhibitory compounds)
Furthermore the following characteristic would be nice to have in a CBP organism
(Zaldivar, Nielsen & Olsson, 2001).
• Ability to utilize sugars (hexose and pentose) simultaneously

87
• GRAS status (Generally Regarded As Safe). This would allow the use of the CBP
organism elsewhere i.e. as animal feed
• Ability to recycle (reuse organism in several fermentations)
• Minimal nutrient supplementation
Tolerance to low pH and high temperature
No known organism exhibit all these characteristics, therefore a CBP organism will
probably have to be genetically engineered. This would involve altering the DNA of a
microbe by adding the desired genetic material from one or more other organisms. The
development of a CBP organisms thus far has focused on one of two strategies; the
engineering of an organism that ferments well in order to hydrolyze biomass
polysaccharides, or the engineering of an organism that hydrolyze cellulose and
hemicellulose well in order to produce ethanol (Figure 8.6) (Lynd et al., 1999).
Engineer to improveproduct properties
Engineer to improvesubstrate utilization
OBJECTIVEOrganism with the ability to
convert biomass to commodity products at high
yield and concentration
Microbes with desired substrate utilization
properties – e.g..•Able to utilize pentose sugars (E.coli)•Able to utilize cellulose (C.thermocellum)
Microbes with desired product related properties – e.g.
Ethanol production (S.cerevisiae)
Figure 8.6. Alternative organism development strategies to obtain organisms useful in processing cellulosic feedstocks.
Source: Lynd et al., 1999
A number of recombinant organisms have been engineered using both these strategies.
Relevant questions are “How far are we from reaching the goal?” and “Is it a realistic goal”?
To answer these, it is necessary to look at the wild type organisms available in nature and
how they have been engineered towards meeting CBP requirements (Table 8.1).
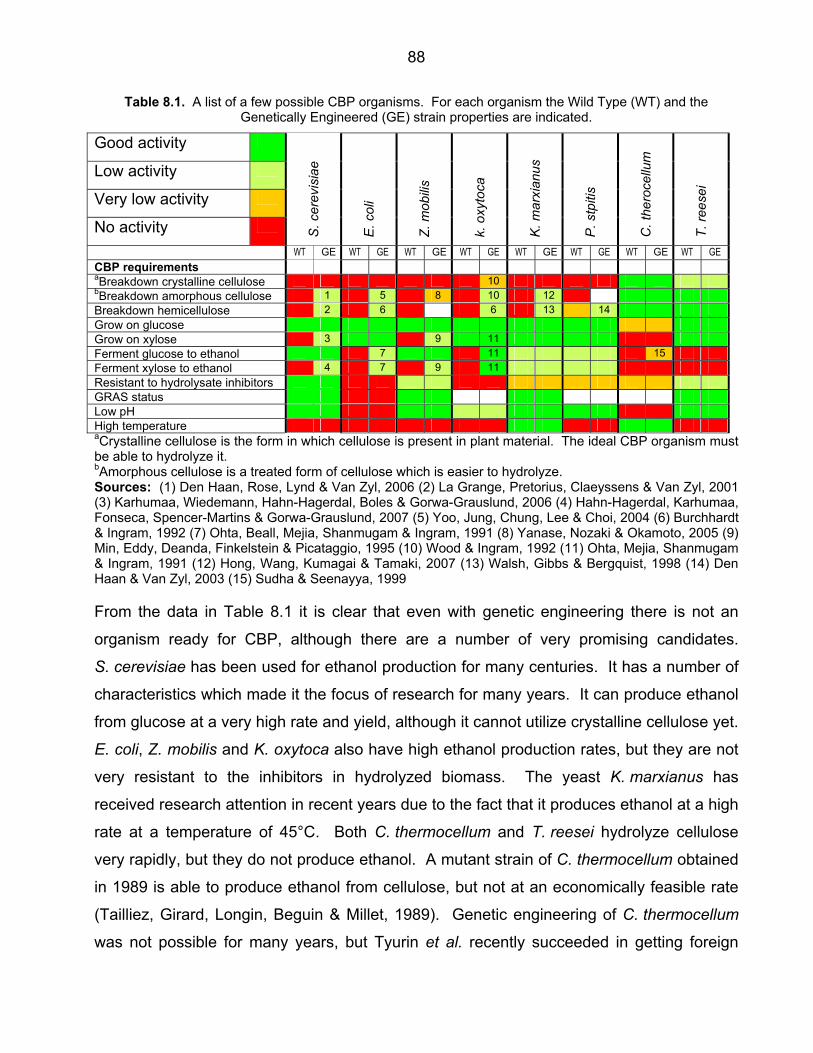
88
Table 8.1. A list of a few possible CBP organisms. For each organism the Wild Type (WT) and the Genetically Engineered (GE) strain properties are indicated.
Good activity
Low activity
Very low activity
No activity S. c
erev
isia
e
E. c
oli
Z. m
obili
s
k. o
xyto
ca
K. m
arxi
anus
P. s
tpiti
s
C. t
hero
cellu
m
T. re
esei
WT GE WT GE WT GE WT GE WT GE WT GE WT GE WT GE CBP requirements aBreakdown crystalline cellulose 10 bBreakdown amorphous cellulose 1 5 8 10 12 Breakdown hemicellulose 2 6 6 13 14 Grow on glucose Grow on xylose 3 9 11 Ferment glucose to ethanol 7 11 15 Ferment xylose to ethanol 4 7 9 11 Resistant to hydrolysate inhibitors GRAS status Low pH High temperature aCrystalline cellulose is the form in which cellulose is present in plant material. The ideal CBP organism must be able to hydrolyze it. bAmorphous cellulose is a treated form of cellulose which is easier to hydrolyze. Sources: (1) Den Haan, Rose, Lynd & Van Zyl, 2006 (2) La Grange, Pretorius, Claeyssens & Van Zyl, 2001 (3) Karhumaa, Wiedemann, Hahn-Hagerdal, Boles & Gorwa-Grauslund, 2006 (4) Hahn-Hagerdal, Karhumaa, Fonseca, Spencer-Martins & Gorwa-Grauslund, 2007 (5) Yoo, Jung, Chung, Lee & Choi, 2004 (6) Burchhardt & Ingram, 1992 (7) Ohta, Beall, Mejia, Shanmugam & Ingram, 1991 (8) Yanase, Nozaki & Okamoto, 2005 (9) Min, Eddy, Deanda, Finkelstein & Picataggio, 1995 (10) Wood & Ingram, 1992 (11) Ohta, Mejia, Shanmugam & Ingram, 1991 (12) Hong, Wang, Kumagai & Tamaki, 2007 (13) Walsh, Gibbs & Bergquist, 1998 (14) Den Haan & Van Zyl, 2003 (15) Sudha & Seenayya, 1999
From the data in Table 8.1 it is clear that even with genetic engineering there is not an
organism ready for CBP, although there are a number of very promising candidates.
S. cerevisiae has been used for ethanol production for many centuries. It has a number of
characteristics which made it the focus of research for many years. It can produce ethanol
from glucose at a very high rate and yield, although it cannot utilize crystalline cellulose yet.
E. coli, Z. mobilis and K. oxytoca also have high ethanol production rates, but they are not
very resistant to the inhibitors in hydrolyzed biomass. The yeast K. marxianus has
received research attention in recent years due to the fact that it produces ethanol at a high
rate at a temperature of 45°C. Both C. thermocellum and T. reesei hydrolyze cellulose
very rapidly, but they do not produce ethanol. A mutant strain of C. thermocellum obtained
in 1989 is able to produce ethanol from cellulose, but not at an economically feasible rate
(Tailliez, Girard, Longin, Beguin & Millet, 1989). Genetic engineering of C. thermocellum
was not possible for many years, but Tyurin et al. recently succeeded in getting foreign

89
DNA into C. thermocellum for the first time (Tyurin, Desai & Lynd, 2004). This will surely
lead to the development of new ethanol producing C. thermocellum strains. Even though
CBP is yet not possible, the future for this process technology certainly looks very
promising (Lynd et al., 2005).
8.3.2.3 Plant construction
Comparing the 2005 cellulose bioethanol production costs in Figure 8.3 with the starch
ethanol production costs, it is clear that feedstock, labour, supplies and overheads and
depreciation should be the key areas of focus for future cost reductions. All these costs
are likely to decrease significantly once lignocellulosic ethanol production achieves the
same level of development reached in the maize ethanol industry (Figure 8.2).
8.3.3 Biorefinery
A biorefinery is analogous to a petroleum refinery that produces multiple fuels and products
from petroleum (NREL, 2007). By producing multiple products, a biorefinery can take
advantage of the differences in biomass components and intermediates and maximizes the
value derived from the biomass feedstock (Figure 8.7). It might for example produce one
or several low-volume, but high-value chemical products (pharmaceuticals or cosmetics)
and a low-value but high-volume liquid fuel (ethanol, diesel or methanol) (Gravitis, 2007).
Fuel production in this case would provide economies of scale, thereby lowering the
production cost of high value chemical products.
Plantation
Fishery
Municipalwaste
HarvestTransportation
Storage
HarvestTransportation
Storage
Waste
FoodFeed
BiofuelsTextilesPaper
ChemicalsPolymers
CompositesVitaminsEnzymes
Pharmaceuticals
Farm
Forest
Sugar Platform“Biochemical”
Syngas Platform“Thermochemical”
Biorefinery
CombinedHeat &
Gas
Clean gas
Residues
Figure 8.7. A biorefinery utilizes organic material from agriculture, forestry, fishery, etc and converts the biomass into value-added products
Source: Gravitis, 2007; NREL, 2007

90
Biorefineries typically have more than one processing platform. A sugar platform uses
biochemical processes (enzymes and microorganisms) to convert biomass to ethanol and
various other useful products. Fermentation can, however, only convert the sugar
(cellulose and hemicellulose) in biomass to ethanol, leaving the lignin fraction (20 to 30% of
the dry mass) untreated (Figure 8.8). This fraction is usually incinerated to provide process
heat, although this is not optimal use of the energy in the lignin fraction. A syngas platform
uses thermochemical processes (gasification or pyrolysis) to convert lignin to fuel and other
high value chemicals.
Ethanol Production
Gasification or
Pyrolysis
Power Cycle
Gasification or
Pyrolysis
Power Cycle
100% 97.6%
Steam 14.6%Steam 14.6%
Process Power1.3%
Exported power20.8%
Exported power20.8%
Sugar fermentation to ethanol52.0%
Sugar fermentation to ethanol52.0%
Biomass100%
Pre
treat
men
tP
retre
atm
ent
Bio
logi
cal C
onve
rsio
nB
iolo
gica
l Con
vers
ion
Sep
arat
ion
Residues45.6%
Residues45.6%
Figure 8.8. Biomass processing plant. The widths of arrows are proportional to energy flows. Sources: Lynd, 2002
The NREL is currently involved in the development of six biorefineries. They are working
towards the development of new process technologies that would allow the integration of
biomass derived fuels with the production of a number of other chemical products (NREL,
2007).
8.4 CONCLUSION
There is much ongoing research into bioethanol (Robson, 2007) and research has
bolstered the standing of bioethanol as a viable and relatively cheap alternative to petrol.
With the development of lignocellulosic bioethanol technology, the efficiency of this fuel is

91
expected to continue improving. Further research and development will undoubtedly
continue to decrease the carbon footprint of bioethanol, thus helping to reduce global
carbon emissions.

92
CHAPTER 9 CONCLUSION
9.1 INTRODUCTION
Biofuels have the potential to solve many of the world’s fuel-related problems. In this
regard, ethanol has a long history (Solomon, Barnes & Halvorsen, 2007). Production has
gone through many ups and downs, but it is currently at the highest it has ever been.
Ethanol is experiencing unprecedented levels of attention due to its potential as alternative
to petrol. Particularly, the production of ethanol from cellulose by means of fermentation
shows great potential given that cellulose is such an abundant raw material. Since the
chemical composition of biomass varies greatly among different plant species, it would be
unwise to focus all our attention on the development of fermentation technology only.
Furthermore it is unlikely that a single biomass processing method would be suitable for
the processing of all available biomass resources. Having more than one option, each with
its own unique advantages and disadvantages, is more likely to ensure optimal utilization of
the energy locked inside various biomass resources towards the development of a
sustainable future.
9.2 SA BIOFUTURE
High oil prices and uncertainties regarding future reserves, as well as the phenomenon of
global warming have led many countries, including South Africa, to consider alternative
means of generating energy (Meyer, Strauss, Cutts, De Beer, Du Toit, Funke &
Gebrehiwet, 2007: 1). Since the South African economy is highly dependent on oil and
because much of the agricultural sector is suffering from low commodity prices, a biofuel
industry based on agricultural crops has the potential to promote agricultural development.
The African Sustainable Fuels Centre (2006) estimated that the establishment of a biofuels
industry in South Africa based on E8 (8% bioethanol blended with 92% petrol) and B2 (2%
biodiesel blended with petroleum diesel) would generate R1 700 million in domestic
product which would constitute 0,11% of the current GDP. It would also lead to a net
reduction of R3 700 million per year on the current account and create 55 000 additional
jobs, reducing unemployment by 1,25%.

93
If South Africa creates a biofuels industry, it is very important to determine the optimum
magnitude and nature of such an industry before implementation, since considerable
investment would be necessary. If implemented wisely after sufficient planning, it could
lead to economic growth and development, however if not, it could be detrimental to the
environment, the agricultural industry and the economy as a whole.
9.3 GLOBAL BIOFUTURE
It does not matter whether one believes fossil fuel will last for another 10 or 1 000 years,
there is no doubt that it will run out at some stage. An even more important fact to consider
in a fossil fuel based economy is global warming and the damage fossil fuel is doing to the
environment. Therefore, it is imperative to find renewable alternatives to fossil fuel.
Biomass will undoubtedly play an important roll in the energy equation of the future,
although the probability of a single energy source dominating the future in the same way
that fossil fuels dominated the past is very unlikely (Figure 9.1). We are more likely to see
a combination of different renewable sources, all contributing to satisfy a wide variety of
human energy needs.
500
01860 2060198019401900
1 000
1 500
2020
Surprise
Geothermal
Solar
Biomass
WindNuclearHydroGasOilCoalTraditional Biomass
Exa
joul
es Renewable resources
Figure 9.1. Shell Petroleum LTD’s sustained growth scenario. A breakdown of the growth of various energy forms.
Sources: Overend, 2003
Renewable energy sources have the potential to meet a significant portion, or even all of
the world’s energy requirements, but not at the world’s current rate of fuel consumption.

94
Wackernagel and Rees (1995) calculated that it would require the equivalent of three
“Earths” to sustain the current world population at the standard of living found in most
industrialized countries, such as the United States (Figure 9.2).
Energy
Built-up
Forest
Cropland Grazing landFishing
1961 1986197619711966 1981 1991
Num
ber o
f ear
ths
6
0
12
14
8
10
Bill
ion
glob
al h
ecta
res
4
2
1996
1,2
0,2
0
0,4
0,6
0,8
1,03,70United States2,40Denmark0,29India1,301995
Number of earthsAssumed footprint
3,70United States2,40Denmark0,29India1,301995
Number of earthsAssumed footprint
Figure 9.2. Resource consumption and waste assimilation expressed as productive land area. Source: Wackernagel, Schulz, Deumling, Linares, Jenkins, Kapos, Monfreda, Loh, Myers, Norgaard &
Randers, 2007
Extrapolation of current trends does not point to a sustainable future. A sustainable future
would require big changes relative to the current situation. High efficiency is the only way
of ensuring a sustainable world. For biomass, this would mean efficient production and
processing of raw materials as well as efficient vehicles to ensure optimal utilization of all
resources. The contribution of increased efficiency is likely to be more important than the
discovery new sources of energy. Renewable resource can go a long way towards
satisfying man’s energy requirements provided that resources are used optimally and
wastage is eliminated from all processes. In the words of Gandhi, "The world provides
enough to satisfy every man's need, but not every man's greed."
9.4 FUTURE RESEARCH
From this study it is clear that ethanol has a number of advantages that makes it a good
alternative to fossil fuel. However, it is unlikely that ethanol will dominate the world the

95
way fossil fuel did previously. There is a number of promising alternative transportation
fuels that has the potential to contribute significantly to the industry in future.
Future research should therefore focus on clarifying the following:
• Biodiesel has a high energy density and can be produced using animal fat, as well as a
wide range of vegetable oils. Production and use have a net energy gain of 3,2, and
biodiesel is environmentally cleaner than petroleum diesel. The technology for the
production of biodiesel is well established, but significant development has nevertheless
occurred in recent years. Many questions remain, such as: What can oil producing
algae contribute to the biodiesel industry? What does the future hold for biodiesel in
terms of technological development? And what is the potential for biodiesel worldwide,
as well as in South Africa?
• Methanol is a clean burning fuel produced from petroleum or natural gas. It shares
many characteristics with ethanol. What is the future of methanol in the transportation
industry?
• Hydrogen has a number of favorable characteristics causing many specialists to believe
it to be the transportation fuel of future. Hydrogen fuel cell technology has improved
significantly in recent years, but there are still many hurdles to overcome before
hydrogen can take its place in the transportation industry. What progress has been
made in recent years in hydrogen technology? When will hydrogen be ready for the
transport industry?
• Landfills are responsible for large amounts of methane (biogas) released into the
atmosphere. The technology to harvesting this gas for the production of electricity is
well established. What is the potential of biogas for the transportation industry?
• There are a number of alternative fuels with great potential as transportation fuel, yet
some are better suited to certain applications. Furthermore, some of these alternatives
are more likely to succeed in specific countries. A comparative study would therefore
be beneficial in providing insight into the transportation industry of the future.

96
LIST OF SOURCES African Sustainable Fuels Centre. 2006. An investigation into the feasibility of establishing a biofuels industry in the Republic of South Africa. African Sustainable Fuels Centre [Online] Available: http://asfc.org.za/index.php?option=com_docman&task=doc_download&gid=11. Accessed: 24 May 2007.
Agriculture21 2002. Sweet sorghum in China. [Online] Available: http://www.fao.org/ag/magazine/0202sp2.htm. Accessed: 24 May 2007.
Ahlbrandt, T. S., Pierce, B. S., & Nuccio, V. 2003. USGS World Petoleum Assessment 2000. USGS Report number FS-062-03. [Online] Available: http://pubs.usgs.gov/fs/fs-062-03/. Accessed: 1 May 2007.
Aleklett, K. 2006. International Energy Agency accepts peak oil. The Association for the Study of Peak Oil and Gas. [Online] Available: http://www.peakoil.net/uhdsg/weo2004/TheUppsalaCode.html. Accessed: 15 November 2006.
American coalition for ethanol 2007. Ethanol. [Online] Available: http://www.ethanol.org/. Accessed: 4 May 2007.
American Energy Independence 2006. America is addicted to oil. [Online] Available: http://www.americanenergyindependence.com/. Accessed: 1 May 2007.
Anderson, R. N. 1998. Oil production in the 21st century. Scientific American, 3, 86-91.
Askew, M. 2003. Energy crops. [Online] Available: http://www.csl.gov.uk. Accessed: 4 July 2006.
Berg, C. 2004. World fuel ethanol analysis and outlook. [Online] Available: http://www.distill.com/World-Fuel-Ethanol-A&O-2004.html
Bioenergy Feedstock Development Program. 2005a. Biofuels from switchgrass: Greener energy pastures. [Online] Available: ftp://bioenergy.ornl.gov/pub/pdfs/biofuels-switchgrass.pdf. Accessed: 28 April 2007a.
Bioenergy Feedstock Development Program 2005b. Miscanthus. [Online] Available: http://bioenergy.ornl.gov/papers/miscanthus/miscanthus.html. Accessed: 28 April 2007b.
Bohinski, R. C. 1987. Modern concepts in biochemistry. Allyn and Bacon, Inc.: Boston.
BP 2004. Table of world oil consumption. [Online] Available: www.bp.com/liveassets/bp_internet/globalbp/globalbp_uk_english/publications/energy_reviews/STAGING/local_assets/downloads/pdf/table_of_world_oil_consumption_2004.pdf . Accessed: 16 November 2006.
Brekke, K. 2007. IndyCar series makes switch to ethanol power in 2007 season at March 24 season opener. [Online] Available: http://www.grainnet.com/articles/IndyCar_Series_Makes_Switch_to_Ethanol_Power_in_2007_Season_at_March_24_Season_Opener-42664.html. Accessed: 7 May 2007.
British Columbia Hydro and Power Authority 2002. Oil as a Transportation Fuel. [Online] Available: http://www.bchydro.com/education/8-12/8-12_2794.html. Accessed: 4 July 2006.
British Sugar 2002a. Environmental impact. [Online] Available: www.britishsugar.co.uk. Accessed: 14 April 2007a.
British Sugar. 2002b. Sugar beet and the environment in the UK. DEFRA-2002 [Online] Available: www.britishsugar.co.uk. Accessed: 14 April 2007b.

97
British Sugar. 2002. Environmental impact. [Online] Available: www.britishsugar.co.uk. Accessed: 14 April 2007.
Brown, L. 2006. Starving for Fuel: How Ethanol Production Contributes to Global Hunger. [Online] Available: http://www.theglobalist.com/printStoryId.aspx?StoryId=5518. Accessed: 25 April 2007.
Burchhardt, G. & Ingram, L. O. 1992. Conversion of xylan to ethanol by ethanologenic strains of Escherichia coli and Klebsiella oxytoca. Applied and Environmental Microbiology, 58(4), 1128-1133.
Campbell, C. J. 2002a. Forecasting global oil supply 2000 - 2050. [Online] Available: http://www.hubbertpeak.com/campbell/Campbell_02-3.pdf. Accessed: 25 June 2006a.
Campbell, C. J. 2002b. Newsletter No 23. The Association for the study of peak oil. Staball Hill, Ireland.
Campbell, C. J. 2003. Oil depletion - The heart of the matter. [Online] Available: http://www.hubbertpeak.com/campbell/TheHeartOfTheMatter.pdf. Accessed: 25 June 2006.
Campbell, C. J. & Lailai, L. 1998. The end of cheap oil. Scientific American, 3, 78-83.
Cardona, C. & Sanchez, O. J. 2007. Fuel ethanol production: Process design trends and integration opportunities. Bioresource Technology, 98, 2415-2457.
Cassman, K., Eidman, V., & Simpson, E. 2006. Convergence of Agriculture and Energy: Implications for Research and Policy. Council for Agricultural Science and Technology Report number QTA2006-3. Accessed: 23 June 2007.
Chandel, A. K., Chan, E. S., Rudravaram, R., Narasu, M. L., Rao, V., & Ravindra, P. 2007. Economics and environmental impact of bioethanol production technologies: an appraisal. Biotechnology and Molecular Biology Reviews, 2(1), 14-32.
Chandra, R. P., Bura, R., Mabee, W. E., Berlin, A., Pan, X., and Saddler, J. N. 2007. Substrate pretreatment: The key to effective enzymatic hydrolysis of lignocellulosics? Advances in Biochemical Engineering / Biotechnology. 64. In Press
Choe, J. 2004. Alternative fuels. [Online] Available: http://www.socsci.mcmaster.ca/polisci/gcpr/fuelchoice.cfm. Accessed: 6 July 2006.
Coghan, A. 2003. GM sugar beet 'far more environmentally friendly'. New Scientist, 180, 17-17.
Cole, B. 2006. A timeline of the ethanol industry. [Online] Available: http://minnesota.publicradio.org/projects/2006/09/energyproject/timeline.shtml. Accessed: 21 June 2007.
Collingwood Ethanol, L. P. 2006. About ethanol. [Online] Available: http://www.collingwoodethanol.com/ethanol.htm. Accessed: 9 August 2007.
Critchley, W., Siegert, K., & Chapman, C. 1991. A Manual for the Design and Construction of Water Harvesting Schemes for Plant Production. Food and Agriculture Organization of the United Nations: Rome.
Curtis, B. C. 1996. Wheat in the world. [Online] Available: http://www.fao.org/DOCREP/006/Y4011E/y4011e04.htm. Accessed: 13 April 2007.
Dabbs, W. C. 1996. Oil Production and Environmental Damage. [Online] Available: http://www.american.edu/TED/projects/tedcross/xoilpr15.htm#r0. Accessed: 27 March 2007.

98
De Carvalho, E. P. 2005. Industrial perspective on expansion of ethanol production capacity for export in Brasil. Sao Paulo Sugarcane Agroindustry Union [Online] Available: www.unica.com.br. Accessed: 19 May 2007.
De Oliveira, M. E. D., Vaughan, B. E., & Rykiel, E. J. 2007. Ethanol as Fuel: Energy, Carbon Dioxide Balances, and Ecological Footprint. Bioscience, 55, 593-599.
Den Haan, R., Rose, S. H., Lynd, L. R., & Van Zyl, W. H. 2006. Hydrolysis and fermentation of amorphous cellulose by recombinant Saccharomyces cerevisiae. Metabolic Engineering, 9(1), 87-94.
Den Haan, R. & Van Zyl, W. H. 2003. Enhanced xylan degradation and utilisation by Pichia stipitis overproducing fungal xylanolytic enzymes. Enzyme and Microbial Technology, 33, 620-628.
Dent, E. 2005. Iogen: a leader in cellulose ethanol. Bio-Prospects, 2(1), 1-2.
Department of Agriculture & Food. 2006. Planting and growing Miscanthus. [Online] Available: http://www.agriculture.gov.ie/schemes/bioenergy/BestPracticeManual_Miscanthus.doc. Accessed: 28 April 2007.
DOE. 2006b. Emissions of greenhouse gases in the United States 2005. Energy Information Administration Report number DOE/EIA-0573. [Online] Available: http://www.eia.doe.gov/oiaf/1605/ggrpt/pdf/057305.pdf. Accessed: 5 April 2007b.
DOE. 2006a. Emissions of greenhouse gases in the United States 2005. Energy Information Administration Report number DOE/EIA-0573. [Online] Available: http://www.eia.doe.gov/oiaf/1605/ggrpt/pdf/057305.pdf. Accessed: 5 April 2007a.
dos Santos, M. A. 1996. Energy analysis of crops used for producing ethanol and CO2 emissions. International Virtual Institute of Global Change [Online] Available: www.ivig.coppe.ufrj.br/doc/alcofoen.pdf . Accessed: 30 April 2007.
Du Plessis, J. 2003. Maize production. [Online] Available: www.nda.agric.za/publications. Accessed: 20 April 2007.
EcoSystems 2006. The coming global oil crisis. [Online] Available: http://www.oilcrisis.com/. Accessed: 29 March 20070.
Energy Information Administration 2005a. Crude Oil Production . [Online] Available: http://eia.doe.gov/. Accessed: 16 November 2006a.
Energy Information Administration. 2005b. Short-term energy outlook. US Department of Energy [Online] Available: www.eia.doe.gov/pub/forecastng/steo/oldsteos/aug05.pdf. Accessed: 15 November 2006b.
Environmental Entrepreneurs. 2006. Developing low carbon ethanol for California. [Online] Available: www.e2.org. Accessed: 19 May 2007.
ESA21 2004. Environmental Science Activity for the 21st Century. Fossil Fuels: Oil. [Online] Available: http://esa21.kennesaw.edu/activities/oil/oilactivity.pdf
Ethanol Africa 2006. Ethanol Africa - Engineering and technology. [Online] Available: http://www.ethanol-africa.co.za/about_engineering.php. Accessed: 19 September 2006.
Ethanol Africa 2007. FAQ. [Online] Available: http://www.ethanol-africa.com/faq.php?section=faq#. Accessed: 24 May 2007.

99
Farrel, A. E., Plevin, R. J., Turner, B. T., Jones, A. D., O'Hare, M. O., & Kammen, D. M. 2006. Ethanol can contribute to energy and environmental goals. Science, 311, 506-508.
Fernando, A. L. & Santos Oliveira, J. F. 2000. Some aspects of environmental impact assessment of Miscanthus x giganteus production in Portugal. Grupo de Disciplinas de Ecologia da Hidrosfera Accessed: 28 April 2007.
Friends of the Earth 2002. Pyrolysis and gasification. [Online] Available: www.foe.co.uk/resource/briefings/gasification_pyrolysis.pdf . Accessed: 16 June 2007.
George, R. L. 1998. Mining for oil. Scientific American, 3, 84-85.
Germishuis, H. 2006. Republic of South Africa, Bio-fuels Annual Report 2006. GAIN Report number SF6021. [Online] Available: www.fas.usda.gov/gainfiles/200606/146197935.pdf .
Gewertz, K. 2005. Third rock blues. [Online] Available: http://www.hno.harvard.edu/gazette/2005/03.10/07-raven.html. Accessed: 3 July 2007.
Gewertz, K. 2007. Third rock blues. [Online] Available: http://www.hno.harvard.edu/gazette/2005/03.10/07-raven.html. Accessed: 3 July 2007.
Glodemberg, J. 2007. Ethanol for a sustainable energy future. Science, 315, 808-810.
Glodemberg, J., Coelho, S. T., Nastari, P. M., & Lucon, O. 2004. Ethanol learning curve—the Brazilian experience. Biomass and Bioenergy, 26, 301-304.
Graboski, M. S. 2002. Fossil energy use in the manufacture of corn ethanol. National Corn Growers Association [Online] Available: www.ncga.corn/ethanol/main. Accessed: 19 May 2007.
Gravitis, J. 2007. A biochemical approach to attributing value to biodiversity - The concept of the zero emissions biorefinery. [Online] Available: www.unu.edu/zef/publications_e/intro_to_biorefinery.pdf. Accessed: 9 July 2007.
Grosjean, D., Miguel, A. H., & Tavares, T. M. 1990. Urban air pollution in Brazil: acetaldehyde and other carbonyls. Atmospheric Environment, 24, 101-106.
Hack, C. J. & Marchant, R. 1998a. Characterisation of a novel thermotolerant yeast, Kluyveromyces marxianus var marxianus: development of an ethanol fermentation process. Journal of Industrial Microbiology & Biotechnology, 20, 323-327.
Hack, C. J. & Marchant, R. 1998b. Ethanol adaptation in a thermotolerant yeast strain Kluyveromyces marxianus IMB3. Journal of Industrial Microbiology & Biotechnology, 20, 227-231.
Hahn-Hagerdal, B., Galbe, M., Gorwa-Grauslund, M.-F., Liden, G., & Zacchi, G. 2006. Bio-ethanol – the fuel of tomorrow from the residues of today. [Online] Available: http://www.aseanbiotechnology.info/Abstract/21020762.pdf
Hahn-Hagerdal, B., Karhumaa, K., Fonseca, C., Spencer-Martins, I., & Gorwa-Grauslund, M. F. 2007. Towards industrial pentose-fermenting yeast strains. Applied Microbiology and Biotechnology, 74, 937-953.
Hall, R. L. 2003. Grasses for energy prodcution, hydrological guidelines. DTI Report number URN 03/882. [Online] Available: http://www.dti.gov.uk/files/file14946.pdf. Accessed: 29 April 2007.
Hammerschlag, R. 2006. Ethanol's energy return on investment: A survey of the literature 1990 - present. Environ.Sci.Technol., 40, 1744-1750.

100
Hill, J., Nelson, E., Tilman, D., Polasky, S., & Tiffany, D. 2006. Environmental, economic, and energetic costs and benefits of biodiesel and ethanol biofuels. Proceedings of the National Academy of Science of the United States of America, 103(30), 11206-11210.
Hirsch, R. L., Bezek, R., & Wendling, R. 2005. Peaking of world oil production: Impacts, mitigation, & risk management. [Online] Available: http://www.hilltoplancers.org/stories/hirsch0502.pdf. Accessed: 16 November 2006.
Hong, J., Wang, Y., Kumagai, H., & Tamaki, H. 2007. Construction of thermotolerant yeast expressing thermostable cellulase genes. Journal of Biotechnology, 130, 114-123.
Hubbert, M. K. 1956. Nuclear Energy and the Fossil Fuels. Paper delivered at The Spring Meeting of the Southern District, American Petroleum Institute, San Antonio, Texas. March 1956.
ICM 2006. Ethanol production process. [Online] Available: http://www.icminc.com/ethanol/production_process/. Accessed: 23 April 2007.
IENICA 2007. Sugar beet. [Online] Available: http://www.ienica.net/crops/sugarbeet.htm. Accessed: 16 April 2007.
Jacobs, J. 2006. Ethanol from sugar. [Online] Available: http://www.rurdev.usda.gov/rbs/pub/sep06/ethanol.htm. Accessed: 7 April 2007.
Jacobson, M. Z. 2007. Effects of ethanol (E85) versus gasoline vehicles on cancer and mortality in the United States. Environmental Science and Technology.
Kaffka, S. 1996. Sugarbeet Production and the Environment. [Online] Available: http://sugarbeet.ucdavis.edu/Environment/sb_env.html. Accessed: 17 April 2007.
Karhumaa, K., Wiedemann, B., Hahn-Hagerdal, B., Boles, E., & Gorwa-Grauslund, M.-F. 2006. Co-utilization of L-arabinose and D-xylose by laboratory and industrial Saccharomyces cerevisiae strains. Microbial Cell Factories, 5, 1-11.
Karvy Comtrade Ltd. 2006. Maize outlook report. Karvy Comtrade Ltd [Online] Available: http://www.karvycomtrade.com/downloads/karvySpecialReports/karvysSpecialReports_20060727_01.pdf. Accessed: 24 April 2007.
Keeney, D. & Muller, M. 2006. Water use by ethanol plants. The Institute for Agriculture and Trade Policy Accessed: 28 May 2007.
Kharaka, Y. K. & Otton, J. K. 2003. Environmental impacts of petroleum production: Initial results from the Osage-Skiatook petroleum environmental research sites, Osage County, Oklahoma. U.S. Geological Survey. California. Report number 03-4260. [Online] Available: http://pubs.usgs.gov/wri/wri03-4260/pdf/WRIR03-4260.pdf. Accessed: 27 March 2007.
Khosla, V. 2006. Biofuels: Think outside the Barrel. [Online] Available: www.khoslaventures.com/presentations/Biofuels.Apr2006.ppt . Accessed: 15 June 2007.
Kim, S. & Dale, B. 2005. Environmental aspects of ethanol derived from no-tilled corn grain: nonrenewable energy consumption and greenhouse gas emission. Biomass and Bioenergy, 28(5), 475-489.
Kluger, J. 2007. What now? Time, 169(15), 38-49.
Knott, T. 2007. Back to a bio future. Frontiers, 4, 17-23.

101
Kovarik, B. 2003. The oil reserve fallacy: Proven reserves are not a measure of future supply. [Online] Available: http://www.radford.edu/~wkovarik/oil/6oilbiblio.html. Accessed: 4 July 2006.
La Grange, D. C., Pretorius, I. S., Claeyssens, M., & Van Zyl, W. H. 2001. Degradation of xylan to D-xylose by recombinant Saccharomyces cerevisiae coexpressing the Aspergillus niger beta-xylosidase (xlnD) and the Trichoderma reesei xylanase II (xyn2) genes. Applied and Environmetal Microbiology, 67, 5512-5519.
Lagercrantz, J. 2006. Etahnol production from sugar cane in Brazil. Grona Bilister Report number 1:06. [Online] Available: www.gronabilister.se. Accessed: 19 May 2007.
Lau, M. H., Richardson, J. W., Outlaw, J. L., Holtzapple, M. T., & Ochoa, R. F. 2006. The economics of ethanol from sweet sorghum using the MixAlco Process. Agricultural and Food Policy Center Report number 06-2. Accessed: 30 April 2007.
Lorenz, D. & Morris, D. 1995. How much energy does it take to make a gallon of ethanol. Institute for local Self-Reliance [Online] Available: www.eere.energy.gov/afdc/pdfs/0039.pdf . Accessed: 30 May 2007.
Lur'e, M. A., Kurets, I. Z., & Shmidt, F. K. 2004. The possible abiogenic origin of oil and gas. Chemistry and Technology of Fuels and Oils, 39, 1-5.
Lynd, L. R. 2002. The sustainable resource transition and the role of plant biomass. Unpublished data. Thayer School of Engineering, Department of Biological Sciences, Dartmouth College, Hanover, New Hampshire, USA. Accessed: 11 July 2007.
Lynd, L. R. 2003. Cellulosic ethanol fact sheet. National Commission on Energy Policy Forum [Online] Available: www.energycommission.org/files/finalReport/IV.4.c%20-%20Cellulosic%20Ethanol%20Fact%20Sheet.pdf . Accessed: 9 June 2007.
Lynd, L. R., Elander, R., & Wyman, C. E. 2007. Likely feature of cost of mature biomass ethanol technology. Applied Biochemistry and Biotechnology, 57, 741-761.
Lynd, L. R., Van Zyl, W. H., McBride, J. E., & Laser, M. 2005. Consolidated bioprocessing of cellulosic biomass: an update. Current Opinion in Biotechnology, 16, 577-583.
Lynd, L. R., Von Blottnitz, H., Tait, B., De Boer, J., Pretorius, I. S., Rumbold, K., & Van Zyl, W. H. 2003. Converting plant biomass to fuels and commodity chemicals in South Africa: a third chapter? South African Journal of Sciences, 99, 499-507.
Lynd, L. R. & Wang, M. Q. 2004. A product-nonspecific framework for evaluating the potential of biomass-based products to displace fossil fuels. Journal of Industrial Ecology, 7(17), 32.
Lynd, L. R., Wyman, C. E., & Gerngross, T. U. 1999. Biocommodity engineering. Biotechnology, 15, 777-793.
Mabee, W. E. & Saddler, J. N. 2005. Liquid biofuels from biomass. IEA Bioenergy Report number ExCo56 Doc 07.10a. Accessed: October 2005.
Macedo, I. d. C., Leal, M. R. V., & Da Silva, J. E. A. R. 2004. Assessment of greenhouse gas emissions in the production and use of fuel ethanol in Brazil. Secretariat of the Environment of the State of São Paulo, Brazil [Online] Available: http://www.unica.com.br/i_pages/files/pdf_ingles.pdf. Accessed: 19 May 2007.
Maciel, M. 2006. Ethanol from Brazil and the USA. [Online] Available: http://wwwenergybulletin.net. Accessed: 4 May 2007.

102
Maly, R. R. and Degen, W. 2001. Trends in future fuels for mobile applications. Paper delivered at The Fifth International Symposium on Diagnostics and Modeling of Combustion in Internal Combustion Engines, Nagoya. July 2001.
Marland, G. & Turhollow, A. F. 1991. CO2 emissions from the production and combustion of fuel ethanol from corn. Energy, 16, 1307-1316.
McAuliffe, P. 2005. Summary world corn outlook for 2005/06. [Online] Available: http://www.wcacorp.com/nss-folder/grainoilseeds/20051210%20Summary%20World%20Corn%20Situation.pdf. Accessed: 19 April 2007.
McCann, J. C. 2006. Maize and grace: Africa's encounter with a new world crop1500-2000. American Journal of Agricultural Economics, 88(4), 1117-1119.
Mendeleev, D. 1877. L' Origine du petrole. Revue Scientifique, 2, 409-416.
Meyer, F., Strauss, P. G., Cutts, M., De Beer, J., Du Toit, G., Funke, T., & Gebrehiwet, Y. 2007. Bio-ethanol production in South Africa: An objective analysis. Bureau for Food and Agricultural Policy [Online] Available: www.bfap.co.za. Accessed: 20 August 2007.
Min, Z., Eddy, C., Deanda, K., Finkelstein, M., & Picataggio, S. 1995. Metabolic engineering of a pentose metabolism pathway in ethanologenic Zymomonas mobilis. Science, 267(4), 240-243.
Nakamura, Y., Sawada, T., & Komatsu, A. 2002. Ethanol production from raw starch by a recombinant yeast having sacchrification and fermentation activities. Journal of Chemical Technology and Biotechnology, 77, 1101-1106.
National Corn Growers Association 2003. The world of corn. [Online] Available: http://www.ncga.com/03world/main/production.htm. Accessed: 20 April 2007.
New Crop Opportunities Center. 2005. Switchgrass for biomass. University of Kentucky, College of Agriculture Report number AGR-175. [Online] Available: http://www.uky.edu/Ag/NewCrops/introsheets/switchgrassintro.pdf. Accessed: 27 April 2007.
New England Interstate Water Pollution Control Commission. 2001. Environmental ethanol. [Online] Available: http://www.ethanol-gec.org/information/briefing/8.pdf. Accessed: 10 May 2007.
News24 2007. Oceans cause global warming. [Online] Available: http://www.news24.com. Accessed: 1 May 2007.
Nguyen, H. T. H., Takenaka, N., Bandow, H., Maeda, Y., De Oliva, S. T., Botelho, M. M. F., & Tavares, T. M. 2001. Atmospheric alcohols and aldehydes concentrations measured in Osaka,Japan and in Sao Paulo,Brazil. Atmospheric Environment, 35, 3075-3083.
Nimbkar, N., Kolekar, N. M., Akade, J. H., & Rajvanshi, A. K. 2006. Syrup production form sweet sorghum. Nimbkar Agricultural Research Institute. Phaltan. [Online] Available: http://nariphaltan.virtualave.net/syrup.pdf. Accessed: 30 April 2007.
Nixon, P. & Bullard, M. 2001. Planting and growing Miscanthus. Department for Environmental, Food & Rural Affairs. London. Report number PB5424.
Novozymes 2005. White biotechnology: Biological solutions by Novozymes. [Online] Available: www.novozymes.com/NR/rdonlyres/A0E8CDF5-DC67-42E7-9182-E023AC973BE5/0/white_biotechnology_2005_1.pdf . Accessed: 19 June 2007.

103
Novozymes & BBI International. 2005. Fuel ethanol: A technological evolution. BBI International [Online] Available: http://www.bbibiofuels.com/ethanolevolution/.
NREL 2007. What is a biorefinery. [Online] Available: http://www.nrel.gov/biomass/biorefinery.html. Accessed: 7 July 2007.
NUEweb 2005. Ears of plenty. [Online] Available: http://nue.okstate.edu/Crop_Information/The_Story_of_Wheat.htm. Accessed: 23 April 2007.
O'Driscoll, P. & Vergano, D. 2007. Fossil fuels are to blame, world scientists conclude. [Online] Available: http://www.usatoday.com/weather/climate/globalwarming/2007-01-30-ipcc-report_x.htm. Accessed: 3 April 2007.
O'Rourke, D. & Connolly, S. 2003. Just oil? The distribution of environmental and social impacts of oil production and consumption. Annual Reviews of Environmental Resources, 28, 587-617.
O'Toole, R. 2007. The myth of peak oil. [Online] Available: http://libertyunbound.com/archive/2005_12/otoole-oil.html. Accessed: 1 May 2007.
Ohta, K., Beall, D. S., Mejia, J. P., Shanmugam, K. T., & Ingram, L. O. 1991. Genetic improvement of Escherichia coli for ethanol production: Chromosomal integration of Zymomonas mobilis genes encoding pyruvate decarboxylase and alcohol dehydrogenase. Applied and Environmental Microbiology, 57(4), 893-900.
Ohta, K., Mejia, J. P., Shanmugam, K. T., & Ingram, L. O. 1991. Metabolic engineering of Klebsiella oxytoca M5A1 for ethanol production from xylose and glucose. Applied and Environmental Microbiology, 57(10), 2810-2815.
Oregon Department of Energy 2007. Biomass energy. [Online] Available: http://www.oregon.gov/ENERGY/RENEW/Biomass/BiomassHome.shtml#char. Accessed: 16 June 2007.
Overend, R. P. 2003. Challenges for the chemical sciences in the 21st century. Paper delivered at Energy and Transportation, Washington, D.C. January 2003.
Palmeri, C. & Coy, P. 2005. Is There Plenty Of Oil? [Online] Available: http://www.businessweek.com/magazine/content/05_28/b3942038_mz011.htm. Accessed: 23 November 2006.
Patzek, T. 2004. Thermodynamics of the corn-ethanol biofuel cycle. Critical Reviews in Plant Sciences, 23(6), 519-567.
Patzek, T., Pimentel, D., Wang, M., Saricks, C., Wu, M., Shapori, H., & Duffield, J. 2007. The many problems with ethanol from corn: Just how unsustainable is it? [Online] Available: http://www.phoenixprojectfoundation.us/. Accessed: 4 May 2007.
Pecota, D. C., Rajgarhia, V., & Da Silva, N. A. 2007. Sequential gene integration for the engineering of Kluyveromyces marxianus. Journal of Biotechnology, 127, 408-416.
Pimentel, D. & Patzek, T. 2005a. The net energy value of corn ethanol: Is it positive or negative? Natural Resource Research, 14, 65-69.
Pimentel, D. & Patzek, T. W. 2005b. Ethanol production using corn, switchgrass, and wood; Biodiesel production using soybean and sunflower. Natural Resources Research, 14(1), 65-76.

104
Pingali, P. L. 1999. World wheat facts and trends: Global wheat research in a changing world: Challenges and achievements. CIMMYT: Mexico.
Rajvanshi, A. K. & Nimbkar, N. 2001. Sweet sorghum R&D at the Nimbkar Agricultural Research Institute (NARI). [Online] Available: http://nariphaltan.virtualave.net/sorghum.htm. Accessed: 30 April 2007.
Rausch, K. D. & Belyea, R. L. 2006. The future of coproducts from corn processing. Applied Biochemistry and Biotechnology, 128, 47-86.
Raven, P. H. 2002. Scienc, sustainability and the human prospect. [Online] Available: http://www.mindfully.org/Sustainability/Science-Sustainability-Human-RavenAAAS14feb02.htm. Accessed: 3 July 2007.
Reddy, B. V. S., Kumar, A. A., and Ramesh, S. 2007. Sweet sorghum: A water saving bio-energy crop. Paper delivered at International conference on Linkages between Energy and Water Management of Agriculture in Developing Countries, Hyderabad, India.
REEEP 2007. REEEP looks at complexity of producing biofeuls in South Africa. [Online] Available: http://www.reeep.org/index.cfm?articleid=1632. Accessed: 24 May 2007.
Regis, M. 2007. The evolution of the Brazilian ethanol industry. Paper delivered at The Royal Society International Biofuels Opportunities, London. April 2007.
Renewable Fuels Association 2007. Cellulosic ethanol. [Online] Available: http://www.ethanolrfa.org/resource/cellulosic/. Accessed: 2 June 2007.
Robson, G. 2007. The history and development of bioethanol as an alternative fuel. [Online] Available: http://www.scribd.com/doc/21260/The-History-and-Development-of-Bioethanol-as-an-Alternative-Fuel. Accessed: 29 September 2007.
Scurlock, J. M. O. 1999. A review of European experience with a novel energy crop. US Department of Energy Report number ORNL/TM-13732. [Online] Available: http://bioenergy.ornl.gov/reports/miscanthus/toc.html. Accessed: 28 April 2007.
SECO 2007. MTBE & Ethanol. [Online] Available: http://www.seco.cpa.state.tx.us/re_ethanol_mtbe.htm. Accessed: 7 May 2007.
Sequeira, C. A. C., Brito, P. S. D., Mota, A. F., Carvalho, J. L., Rodrigues, L. F. F. T. T. G., Santos, D. M. F., Barrio, D. B., & Justo, D. M. 2007. Fermentation, gasification and pyrolysis of carbonaceous residues towards usage in fuel cells. Energy Conversion and Management, 48(2203), 2220.
Shapori, H. & McAloon, A. 2004. The 2001 net energy balance of corn-ethanol. U.S. Department of Agriculture (USDA), [Online] Available: www.usda.gov/oce/oepnu. Accessed: 19 May 2007.
Shapouri, H., Salassi, M., & Fairbanks, J. N. 2006. The economic feasibility of ethanol production from sugar in the United States. USDA
Shapouri, H. 2006. Bioenergy. Paper delivered at Renewable Resources and Biorefineries Conference, York, UK. September 2006.
Shapouri, H., Duffield, J. A., & Wang, M. 2002. The energy balance of corn ethanol : An update. United States Department of Agriculture Report number 814. [Online] Available: www.transportation.anl.gov/pdfs/AF/265.pdf . Accessed: 30 May 2007.
105
Sharpe, P. 1998. Sugar cane: Past and present. [Online] Available: http://www.siu.edu/~ebl/leaflets/sugar.htm. Accessed: 11 April 2007.
Sheehan, J., Aden, A., Paustian, K., Killian, K., Brenner, J., Walsh, M., & Nelson, R. 2004. Energy and environmental aspects of using corn stover for fuel ethanol. Journal of Industrial Ecology, 7, 117-146.
Smeet, E., Junginger, M., Faaij, A., Walter, A., & Dolzan, P. 2006. Sustainability of Brazillian bio-ethanol. Copernicus Institute. Universiteit Utrecht. Report number NWS-E-2006-110. Accessed: 11 April 2007.
Solomon, B. D., Barnes, J. R., & Halvorsen, K. E. 2007. Grain and cellulosic ethanol: History, economics, and energy policy. Biomass and Bioenergy, 31, 416-425.
Somani, A., Aggarwal, S., & FitzGerald, A. 1999. Sugar manufacturing. World Bank Group: Washington, DC.
Stephens, M. 2001. Comparison of ethanol and MTBE and their use as additives to gasoline. [Online] Available: www.bgsu.edu/departments/envh/final492paper/ComparisonofEthanolandMTBE.pdf . Accessed: 7 May 2007.
Stevens, D. J., Worgetter, M., & Saddler, J. N. 2004. Biofuels for transportation: An examination of policy and technical issues. Report number T39:2004:02. [Online] Available: www.greenfuels.org/biodiesel/pdf/res/200409_IEA_Final_Report_Task_39.pdf. Accessed: 5 July 2007.
Sudha, R. K. & Seenayya, G. 1999. High ethanol tolerance of new isolates of Clostridium thermocellum strains SS21 and SS22. World Journal of Microbiology and Biotechnology, 15, 155-159.
Tailliez, P., Girard, H., Longin, R., Beguin, P., & Millet, J. 1989. Enhanced Cellulose Fermentation by an Asporogenous and Ethanol-Tolerant Mutant of Clostridium thermocellum. Applied and Environmental Microbiology, 55(1), 203-206.
Tyson, K. S., Riley, C. J., & Humphreys, K. K. 1993. Fuel cycle evaluations of biomass-ethanol and reformulated gasoline. National Renewable Energy Laboratory. Golden. Report number NREL/TP-463-4950. Accessed: 9 June 2007.
Tyurin, M. V., Desai, S. G., & Lynd, L. R. 2004. Electrotransformation of Clostridium thermocellum. Applied and Environmetal Microbiology, 70, 883-890.
U.S.Department of Energy. 2002. The U.S. dry-mill ethanol industry biobased products and bioenergy initiative success stories. U.S. Department of Energy [Online] Available: www.brdisolutions.com/pdfs/drymill_ethanol_industry.pdf . Accessed: 19 June 2007.
U.S.Grains Council. 2007. Ethanol production and its co-products. [Online] Available: www.grains.org/galleries/DDGS%20User%20Handbook/11%20-%20Overview%20of%20Ethanol%20Production.REVISED.pdf . Accessed: 23 June 2007.
Wackernagel, M., Schulz, N. B., Deumling, D., Linares, A. C., Jenkins, M., Kapos, V., Monfreda, C., Loh, J., Myers, N., Norgaard, R., & Randers, J. 2007. Tracking the ecological overshoot of the human economy. Proceedings of the National Academy of Science of the United States of America, 99, 9266-9271.
Wald, M. L. 2007. Is ethanol for the long haul. Scientific American, 1, 42-49.
Walsh, D. J., Gibbs, M. D., & Bergquist, P. L. 1998. Expression and secretion of a xylanase from the extreme thermophile, Thermotoga strain FjSS3B.1, in Kluyveromyces lactis . Extremophiles, 2, 9-14.
Wang, M., Saricks, C., & Santini, D. 1999. Effects of fuel ethanol use on fuel-cycle energy and greenhouse gas emissions. Center for Transportation Research Report number ANL/ESD-38. Accessed: 4 May 2007.

106
Wen, Z., Ignosh, J., & Arogo, J. 2007. Fuel Ethanol. [Online] Available: http://www.ext.vt.edu/pubs/bse/442-884/442-884.html. Accessed: 8 May 2007.
Whims, J. 2002. Pipeline consideration for ethanol. [Online] Available: www.agmrc.org/NR/rdonlyres/4EE0E81C-C607-4C3F-BBCF-B75B7395C881/0/ksupipelineethl.pdf . Accessed: 8 May 2007.
Whitten, G. Z. 2003. Air quality and ethanol in gasoline. [Online] Available: http://www.ethanolrfa.org/objects/documents/69/nec_whitten.pdf. Accessed: 8 May 2007.
Wood, B. E. & Ingram, L. O. 1992. Ethanol production from cellobiose, amorphous cellulose, and crystalline cellulose by recombinant Klebsiella oxytoca containing chromosomally integrated Zymomonas mobilis genes for ethanol production and plasmids expressing thermostable cellulase genes from Clostridium thermocellum. Applied and Environmental Microbiology, 58(7), 2103-2110.
World Wildlife Fund. 2006. Living planet report. WWF International. Gland, Switzerland. Accessed: 27 March 2007.
WTRG Economics 2006. Oil price history and analysis. [Online] Available: http://www.wtrg.com/prices.htm. Accessed: 14 July 2007.
Xavier, M. R. S. 2007. The Brazilian sugarcane ethanol experience. Competitive Enterprise Institute Report number No.3. [Online] Available: http://www.cei.org/pdf/5774.pdf. Accessed: 10 April 2007.
Yanase, H., Nozaki, K., & Okamoto, K. 2005. Ethanol production from cellulosic materials by genetically engineered Zymomonas mobilis. Biotechnology Letters, 27, 259-263.
Yoo, J. S., Jung, Y. J., Chung, S. Y., Lee, Y. C., & Choi, Y. L. 2004. Molecular cloning and characterization of CMCase gene (celC) from Salmonella typhimurium UR. Journal of Microbiology, 42, 205-210.
Zaldivar, J., Nielsen, J., & Olsson, L. 2001. Fuel ethanol production from lignocellulose: a challenge for metabolic engineering and process integration. Applied Microbiology and Biotechnology, 56, 17-34.

107
APPENDICES
Appendix 1
Toxic effect of common fossil fuel related chemicals
Chemical Toxic effects Benzene Benzene is a known carcinogen. Short-term exposure may cause a variety of effects,
including nausea, vomiting, dizziness, narcosis, reduction in blood pressure, Central Nervous System depression. Skin contact may lead to dermatitis. Long-term exposure may lead to irreversible effects. Severe eye irritant. Skin and respiratory irritant.
Ethylbenzene May be harmful by inhalation, ingestion or through skin contact. Causes severe eye irritation. Skin and respiratory system irritant. Experimental teratogen. Narcotic in high concentration.
Xylene Harmful if inhaled or absorbed through the skin. Narcotic. May cause lung irritation, chest pain or fatal oedema. May impair fertility. Skin irritant.
Heptane Harmful if inhaled or swallowed. May be harmful in contact with skin. Repeated contact may cause dermatitis
Appendix 2
Toxic effect of common ethanol related chemicals
Chemical Toxic effects Formaldehyde Causes burns. Very toxic by inhalation, ingestion and through skin absorption. Readily
absorbed through skin. Probable human carcinogen. Mutagen. May cause damage to kidneys. May cause allergic reactions. May cause sensitization. May cause heritable genetic damage. Lachrymator at levels from less than 20 ppm upwards. Very destructive of mucous membranes and upper respiratory tract, eyes and skin.
Acetaldehyde Harmful by inhalation, ingestion and through skin absorption. Some experiments with animals suggest that this substance may be anticipated to be a carcinogen. Contact with skin or eyes may cause severe irritation or burns. EC carcinogen category 3. Lachrymator. Note that a workplace exposure limit is in place for this chemical.

108
Appendix 3
An illustration of the impact of exogenous factors on the economic viability of biofuels
(African Sustainable Fuels Centre, 2006: 25). The following 3 tables presents the return on
capital employed (ROCE) by the agriculture sector and the biofuels producers in relation to
varying crude oil prices and the R/US$ exchange rate.
ROCE for agricultural sector and biofuels producers for sugarcane to ethanol Crude Oil price (US$/barrel) 40,0 52,0 64,0 76,0 88,0 100,0 112,0
6,20 -22% -9% 3% 15% 27% 39% 51% 6,36 -20% -8% 5% 17% 30% 42% 55% 6,53 -19% -6% 7% 20% 32% 45% 58% 6,69 -18% -4% 9% 22% 35% 48% 61% 6,85 -16% -3% 11% 24% 38% 51% 65% 7,02 -15% -1% 13% 27% 40% 54% 68% 7,18 -13% 1% 15% 29% 43% 57% 71% 7,35 -12% 2% 17% 31% 46% 60% 74% 7,51 -11% 4% 19% 34% 48% 63% 78% 7,67 -9% 6% 21% 36% 51% 66% 81% 7,84 -8% 7% 23% 38% 54% 69% 84%
Exch
ange
rate
(R/U
S$)
8,00 -6% 9% 25% 41% 56% 72% 88%
ROCE for agricultural sector and biofuels producers for maize to ethanol Crude Oil price (US$/barrel) 40,0 52,0 64,0 76,0 88,0 100,0 112,0
6,20 -31% -16% 0% 16% 31% 47% 63% 6,36 -29% -13% 3% 19% 35% 51% 67% 6,53 -27% -10% 6% 23% 39% 55% 72% 6,69 -25% -8% 9% 26% 43% 60% 77% 6,85 -23% -5% 12% 29% 47% 64% 81% 7,02 -20% -3% 15% 33% 50% 68% 86% 7,18 -18% 0% 18% 36% 54% 72% 90% 7,35 -16% 2% 21% 39% 58% 76% 95% 7,51 -14% 5% 24% 43% 62% 81% 100% 7,67 -12% 8% 27% 46% 66% 85% 104% 7,84 -10% 10% 30% 50% 69% 89% 109%
Exch
ange
rate
(R/U
S$)
8,00 -7% 13% 33% 53% 73% 93% 113%
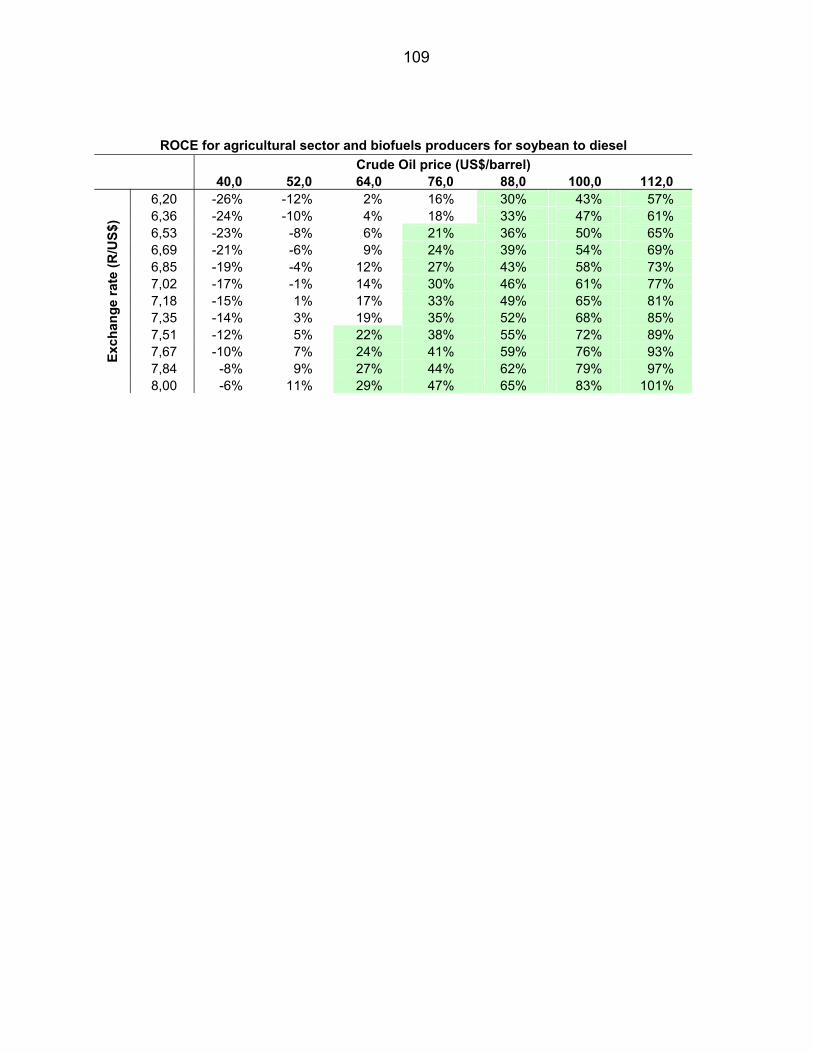
109
ROCE for agricultural sector and biofuels producers for soybean to diesel Crude Oil price (US$/barrel) 40,0 52,0 64,0 76,0 88,0 100,0 112,0
6,20 -26% -12% 2% 16% 30% 43% 57% 6,36 -24% -10% 4% 18% 33% 47% 61% 6,53 -23% -8% 6% 21% 36% 50% 65% 6,69 -21% -6% 9% 24% 39% 54% 69% 6,85 -19% -4% 12% 27% 43% 58% 73% 7,02 -17% -1% 14% 30% 46% 61% 77% 7,18 -15% 1% 17% 33% 49% 65% 81% 7,35 -14% 3% 19% 35% 52% 68% 85% 7,51 -12% 5% 22% 38% 55% 72% 89% 7,67 -10% 7% 24% 41% 59% 76% 93% 7,84 -8% 9% 27% 44% 62% 79% 97%
Exch
ange
rate
(R/U
S$)
8,00 -6% 11% 29% 47% 65% 83% 101%

110
GLOSSARY
Anhydrous ethanol "Fuel grade" ethanol has virtually no water in it (E10 or E85).
Ethanol with no water is anhydrous ethanol
Anthropogenic effects Processes or materials that are derived from human activities,
as opposed to those occurring in natural environments without
human influences
Bagasse Fibre left after removing the sugar from sugarcane
CBP Consolidated BioProcessing
Conventional oil Is typically the highest quality, lightest oil, which flows from
underground reservoirs with comparative ease
DDGS Distillers dried grain with solids is a co-product from the dry-
grind processing of maize to produce ethanol
Ecological footprint Measures the human demand on nature and compares
human consumption of natural resources with the earth’s
ability of regenerate them.
Eczema Is a form of dermatitis, or inflammation of the upper layers of
the skin
Gb Giga barrels = 109
GM Genetically Modified
GMO Genetically Modified Organisms
Global footprint See Ecological Footprint
Hydrated ethanol When ethanol is first fermented from sugars, it contains water.
Ethanol with water is hydrated ethanol
Hydrocarbon An organic compound consisting entirely of hydrogen and
carbon
Hydrolysis The type of chemical reaction used to break down polymers
like cellulose
IEA International Energy Agency
Jaggery Crude sugar
mbd Million barrels per day
MJ Megajoules = 106 joule (unit used for energy)

111
MTBE Methyl tert-butyl ether is a fuel oxygenate
NREL National Renewable Energy Laboratory
Octane number Is a measure of the autoignition resistance of petrol and other
fuels. It is measured relative to a mixture of iso-octane and n-
heptane. 87-octane petrol, for example, has the same octane
rating as a mixture of 87% iso-octane and 13% n-heptane.
PJ Petajoule = 1015 joule (unit used for energy)
Pump octane number There is more than one way of determining and reporting
octane number. The Research octane number (RON) is
determined in a specific test engine under controlled
conditions. Motor octane number (MON) is determined in a
similar test engine and is a good measure of how the behaves
under load. The pump octane number (PON) is
(RON+MON)/2.
Rhizome The underground storage organs of Miscanthus
ROCE Return On Capital Employed
SHF Separate Hydrolysis and Fermentation
SSCF Simultaneous Saccharification and Co-Fermentation
SSF Simultaneous Saccharification and Fermentation
t/ha Metric tons per hectare
Unconventional oil Includes a variety of viscous oils that are called heavy oil,
bitumen, oil sands, and tar sands. It is not readily recovered
since production typically requires a great deal of capital
investment and supplemental energy in various forms
WWF World Wildlife Fund