biofeedback special issue - neurofeedback - brainmaster ... · 133 coben biofeedback Ô winter 2007...
TRANSCRIPT
BiofeedbackVolume 35, Issue 4, pp. 131–135
©Association for Applied Psychophysiology & Biofeedbackwww.aapb.org
Bio
feedb
ack Ô Win
ter 2007
131
SPECIAL ISSUEConnectivity-Guided Neurofeedback for Autistic Spectrum DisorderRobert Coben, PhDNeurorehabilitation & Neuropsychological Services, Massapequa Park, NY
Keywords: neurofeedback, autism, QEEG, coherence, connectivity
Research on autistic spectrum disorder (ASD) has shown related symptoms to be the result of brain dysfunction in multiple brain regions. Functional neuroimaging and electroencephalography research have shown this to be related to abnormal neural connectivity problems. The brains of individuals with ASD show both areas of excessively high connectivity and areas with deficient connectivity. This article reviews emerging evidence that neurofeedback guided by connectivity data can remediate these connectivity anomalies leading to symptom reduction and functional improvement. This evidence raises the hopes for a behavioral, psychophysiological intervention moderating the severity of ASD. Both empirical data and a case example are presented to exemplify this approach.
Autism is a neurodevelopmental disorder characterized by deficits in social interaction, communication, and restricted repetitive behavior (Santangelo & Tsatsanis, 2005; Tidmarsh & Volkmar, 2003; Turner, Frost, Linsenbardt, McIIroy, & Muller, 2006). The heterogeneous range of pervasive developmental disorders (with onset by 3 years of age) includes the following classifications: autistic disorder, Rett’s disorder, childhood disintegrative disorder, Asperger’s disorder, and pervasive developmental disorder–not otherwise specified (Diagnostic and Statistical Manual of Mental Disorders, fourth edition [DSM-IV]; American Psychiatric Association [APA], 1994;).
DSM-IV Criteria for Autistic DisorderIn autistic disorder, social interaction is marked by a lack of appropriate eye gaze, facial expression, or gestures to regulate social interaction. There is often a failure to sustain developmentally appropriate peer relationships and an inability to initiate spontaneous shared activities. Delayed or lack of spoken language is frequently cited. Children with autism often fail to initiate or sustain conversation. Communication is associated with stereotyped repetitive verbalizations or idiosyncratic language. Behavior may include an all-encompassing preoccupation with one or more
restricted area(s) of interest, inflexible adherence to routines or rituals, and repetitive motor patterns such as hand or finger flapping or twisting (APA, 2000). Other pervasive developmental disorders (as listed above) share similar features, but often have varying severity levels. The notion of a spectrum of autistic disorders was coined to describe this spectrum of disorders and severity levels. Rett’s and Child Disintegrative Disorder are associated with regressions in functioning from previous levels of functioning. In Asperger’s Disorder, language dysfunction is absent.
The term Autistic Spectrum Disorder (ASD) represents a group of disorders which includes all five diagnostic subtypes above including Autism, PDD-nos, Rett’s Disorder, Child Disintegrative Disorder, and Asperger’s Disorder (CDC, 2006).
Prevalence of Autistic Spectrum DisorderThe Centers for Disease Control and Prevention (2006) reported the prevalence of autistic spectrum disorder (ASD) as 2 to 6 per 1,000 children. The frequency of ASD can be summarized as ranging between 1 in 500 to 1 in 166 children in the United States. Over the past 20 years, approximately 500,000 individuals (infants to age 21) were diagnosed with ASD. In fact, their most recent report (CDC, 2007a,b) suggests a prevalence of 1 in 150.
Autism as a Disorder of Cerebral ConnectivityNeuroimaging findings have shown dysfunction in various regions in the brains of autistic individuals. The findings of a voxel-based magnetic resonance imaging (MRI) study indicated that children with autism had a significant reduction in total gray matter volume as well as frontostriatal and parietal networks. In addition, white matter was reduced in the cerebellum, left internal capsule, and fornices (McAlonan et al., 2004). Anomalies in brain metabolites have also been reported in the amygdala-hippocampal regions in ASD (Page et al., 2006). Boddaert et al. (2002) used positron emission tomography to assess localized brain dysfunction in autism.
132
Connectivity-Guided Neurofeedback for ASD
Win
ter
2007
Ô B
iofe
edb
ack
Findings indicated significant bilateral temporal hypoper- fusion in the superior temporal gyrus and sulcus. In the study, temporal hypoperfusion was noted in 77% of the children with autism. Other research using functional neuroimaging has linked social cognition dysfunction and language deficits in autism to neural substrates (Just et al., 2004; McAlonan et al., 2004; Pelphrey, Adolphs, & Morris, 2004; Welchew et al., 2005), especially related to the amygdala, the superior temporal sulcus, and fusiform gyrus. With so many brain regions implicated, there is reason to believe that connectivity between these multiple regions may be problematic.
Cherkassky, Kana, Keller, and Just (2006) used functional MRI to compare the resting-state network in autism to con- trols. In the group with autism, functional underconnectivity was observed in anterior-posterior connections. Mizuno, Villalobos, Davies, Dahl, and Muller (2006) examined the functional connectivity between the thalamus and cerebral cortex with blood oxygen level–dependent cross-correlation in autism compared with control subjects. The group with autism had more extensive connectivity, especially in the left insula and right postcentral middle frontal regions. “Connectivity” is defined as any number of means of measuring the communication between two or more neural locations.
Turner et al. (2006) found that individuals with autism had diffusely increased connectivity in pericentral brain regions, as reflected by functional connectivity MRI. Rippon, Brock, Brown, and Boucher (2007) proposed a model of autism associated with information integration deficits resulting from reduced connectivity between specialized local neural networks and overconnectivity within individual neural assemblies.
A fascinating theory has been put forth by Courchesne and Pierce (2005). They theorized that early developmental neuroinflammatory reactions may cause malfunction of frontal minicolumn microcircuitry. This includes brain overgrowth that interferes with connectivity between units of cerebral information processing. Buxhoeveden, Semendeferi, Schenker, and Courchesne (2002) have shown that by the age of 3 these regions have expanded and neuropil space is reduced. This, then, would lead to excessive connectivity within the frontal lobes and limited connectivity between the frontal cortex and other systems.
These processes would, in effect, produce a condition in which the frontal systems of the brain would experience a stunting of development that prevents or limits further growth in cerebral connectivities and specialization. This is of significant concern given their crucial role in developing linguistic, cognitive, emotional control, and social processes.
EEG/QEEG Connectivity Findings in AutismBased on electroencephalograph (EEG) data, it was observed more than 20 years ago (Dawson, Warrenburg, & Fuller, 1982; Ogawa et al., 1982) that autistic brains do not show the typical lateralization pattern of normal children. Dawson et al. (1982) found that 7 of 10 autistic children studied had atypical patterns of cerebral lateralization, involving right-hemisphere dominance for both verbal and spatial functions.
Cantor, Thatcher, Hrybyk, and Kaye (1986) conducted computerized EEG analyses of 11 children with autism between the ages of 4 and 12 years, in contrast to three other groups of children: (a) 88 normal children, (b) a matched group of 18 mentally handicapped children, and (c) a group of 13 mental-age–matched normal toddlers. The findings indicated that children with autism had significantly greater coherence between hemispheres in the beta band than mentally handicapped, normal children, or normal toddlers. Children in the autistic group had higher coherence in the alpha band than did those in the normal group and less interhemispheric and intrahemispheric asymmetry than participants in the normal or mentally handicapped group. “Coherence” is one means of measuring connectivity based on EEG data and represents a specific mathematical calculation of the cross correlation between two waveforms within a frequency band. These findings would appear to suggest that the EEG is a useful and valid means of measuring connectivity anomalies in this population.
The theory that autistic brains have both regions of excessive connectivity and other areas that are too loosely connected appears to have been recently confirmed by at least three separate EEG studies (Coben, Hudspeth, Clarke, & Barry, 2006; Coben & Hudspeth, 2007; Murias, Webb, Greenspann, & Dawson, 2006).
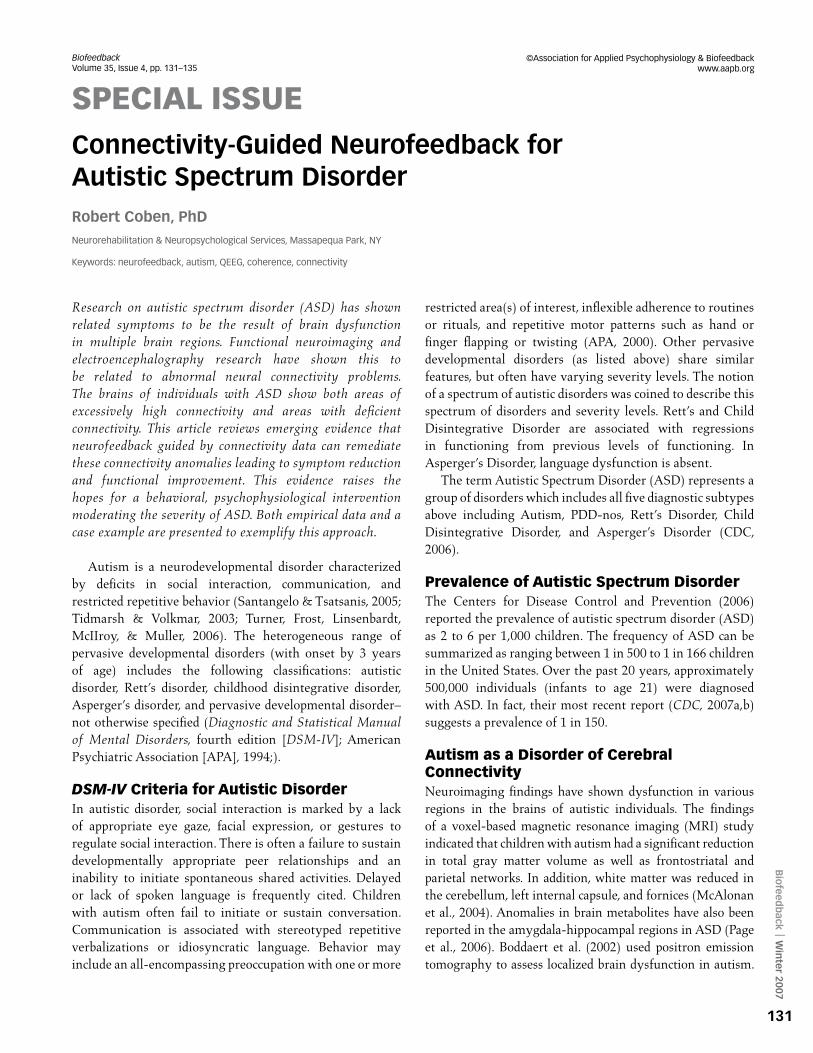
Using 124-channel EEG recordings in autistic adults, Murias et al. (2006) found a combination of higher than normal neural connectivity and lower than normal connectivity between the frontal lobes and other brain regions. We have shown similar findings for autistic children in a study (Coben et al., 2006) that compared EEG connectivity in 27 autistic individuals
Figure 1. Connectivity anomalies in a sample of autistic children compared with normal controls. From Coben et al. (2006)
133
Coben
Bio
feedb
ack Ô Win
ter 2007
with 27 controls matched for age, race, gender, and medication usage. Figure 1 shows these results, which reveal significant degrees of frontal hyperconnectivity in the alpha band and significant hypoconnectivity in many other regions of the brain, especially from frontal to more posterior structures.
Connectivity-Guided NeurofeedbackOf course, we are interested not only in understanding this at a physiological level but also in determining how we can alter these brain anomalies in a therapeutic fashion. Any form of intervention that can accomplish this (normalize brain connectivity) should lead to a reduction in autistic symptoms. In fact, Coben (2006) has recently shown that assessment-guided (based on connectivity) neurofeedback does lead to improvements in connectivity anomalies and reductions in autistic symptoms. Neurofeedback protocols were all individually designed based on quantitative EEG (QEEG) power and connectivity findings, with an emphasis on the latter. All neurofeedback protocols were single-channel, interhemispheric sequential/bipolar arrangements (e.g., F7–F8). Reward bands were established based on the regions and frequencies of maximal hyperconnectivity. The hypothesis underlying this approach is that as the two waveforms at these locations become more disparate (i.e., reward band increases its amplitude), the coherence (or similarity) between the sites should decrease.
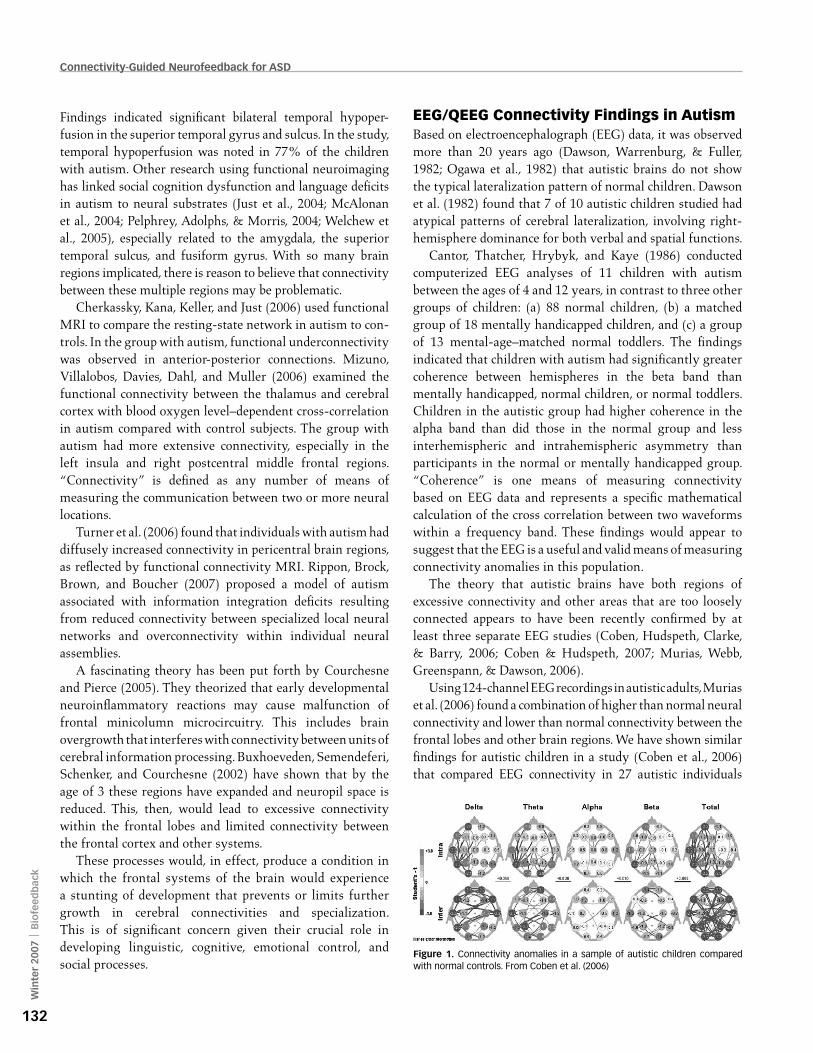
Following 20 sessions based on this approach, pre-post analyses showed a 40% reduction in autistic symptoms, enhancement of neuropsychological functions, and reduction of hyperconnectivity, as shown in Figure 2.
These significant decreases in beta hyperconnectivity were evident, and 78% of the persons trained had reward bands that included low beta frequency ranges. These data begin to verify the theory that interhemispheric, bipolar neurofeedback montages can lead to reductions in hyperconnectivity based on the reward band trained. It has been our choice to train down hyperconnectivity first in autistics when this is a prominent feature, as it frequently is. It is hoped that the
following case example will further explain this approach and its potential impact and therapeutic benefits.
Case PresentationThe patient presented as a 5-year, 11-month-old boy with a diagnosis of pervasive developmental disorder, not otherwise specified. According to his parents, he showed regression at the age of 18 months, became echolaliac with flapping hands, and did not develop speech utterances until the age of 4 years (echolalia involves the parrotlike echoing of the sounds and words made by another and is a symptom of ASDs and also of schizophrenia). Symptom presentation included problems with attention, communication, pragmatics, social skills, eye contact, hyperfocusing, and poor transitioning. Neuropsychological testing, performed in our office, resulted in average intelligence and cognitive impairments related to attention, comprehension, and executive functions. Autistic rating scales were elevated consistent with his diagnosis and related symptoms. Selected findings from his baseline QEEG are shown in Figure 3.
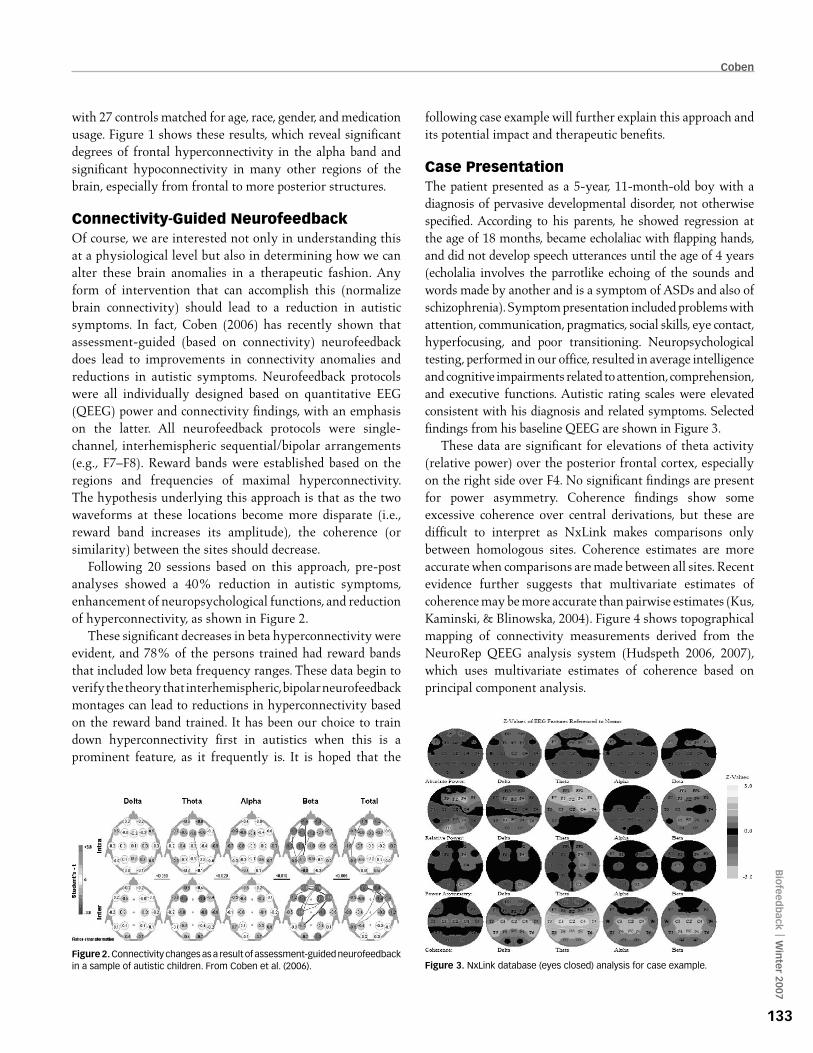
These data are significant for elevations of theta activity (relative power) over the posterior frontal cortex, especially on the right side over F4. No significant findings are present for power asymmetry. Coherence findings show some excessive coherence over central derivations, but these are difficult to interpret as NxLink makes comparisons only between homologous sites. Coherence estimates are more accurate when comparisons are made between all sites. Recent evidence further suggests that multivariate estimates of coherence may be more accurate than pairwise estimates (Kus, Kaminski, & Blinowska, 2004). Figure 4 shows topographical mapping of connectivity measurements derived from the NeuroRep QEEG analysis system (Hudspeth 2006, 2007), which uses multivariate estimates of coherence based on principal component analysis.
Figure 2. Connectivity changes as a result of assessment-guided neurofeedback in a sample of autistic children. From Coben et al. (2006). Figure 3. NxLink database (eyes closed) analysis for case example.
134
Connectivity-Guided Neurofeedback for ASD
Win
ter
2007
Ô B
iofe
edb
ack
Based on these data, excessive coherence appears evident between central and lateral frontal locations across theta, alpha, and beta bands. Considering this information, we chose the site between C4 and F8 and C3 and F7 as the most critical sites of training. According to the 10/10 system of electrode placement, these locations would be FC6 and FC5. These would roughly correspond to Brodmann (Brodmann, 1909) areas 8–6, the premotor–supplementary motor cortices (superior frontal gyrus). The neurofeedback protocol included an active electrode at FC6, reference electrode at FC5, and ground on the left ear (A1). Figure 5 shows the placement of these electrodes on a schematic of the 10/10 system.
The reward band included 7 to 12 Hz, and inhibits were set for 1- to 7-Hz and 20- to 30-Hz bands. This protocol was followed, without change or addition, for 15-minute sessions, twice per week for a total of 20 sessions. Following this period of 10 weeks, a reevaluation was conducted, including another QEEG.
The participant’s mother reported that he had improved and stated that
he is definitely more focused and his concentration
is better. His schoolwork has improved, he listens to
directions, and now follows two- and three-step direc-
tions. He does not get upset like he used to. His teachers also
report improvements in math and other work.
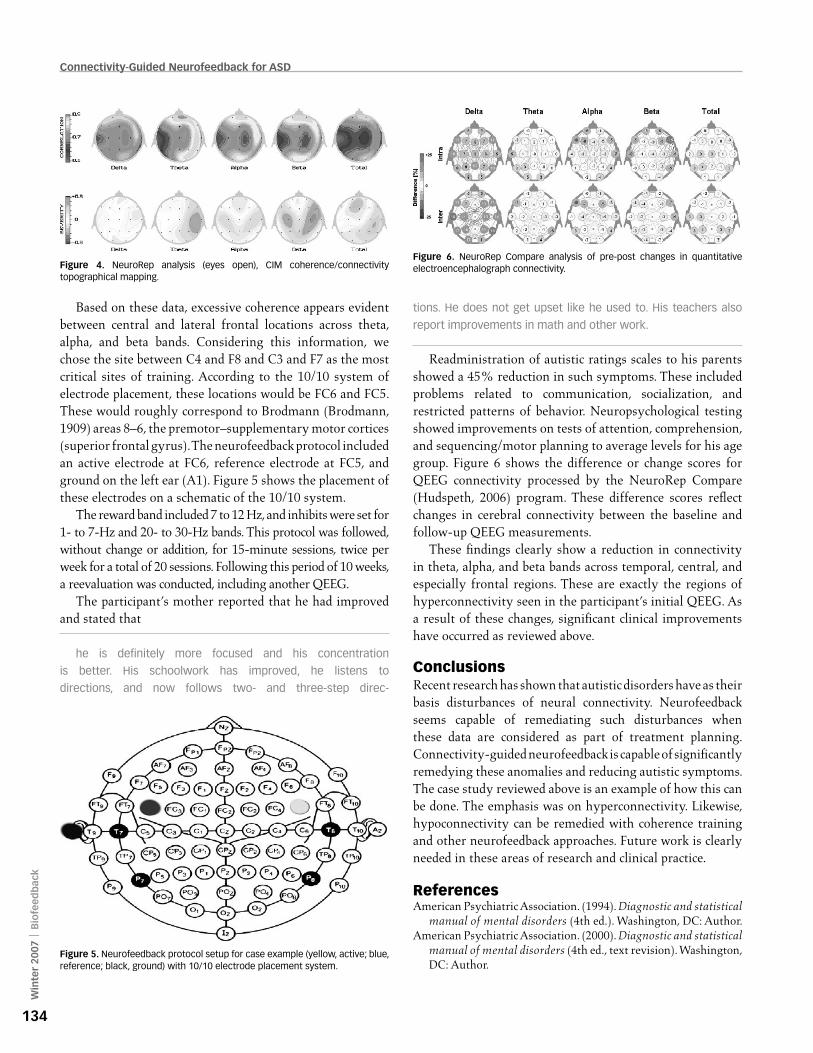
Readministration of autistic ratings scales to his parents showed a 45% reduction in such symptoms. These included problems related to communication, socialization, and restricted patterns of behavior. Neuropsychological testing showed improvements on tests of attention, comprehension, and sequencing/motor planning to average levels for his age group. Figure 6 shows the difference or change scores for QEEG connectivity processed by the NeuroRep Compare (Hudspeth, 2006) program. These difference scores reflect changes in cerebral connectivity between the baseline and follow-up QEEG measurements.
These findings clearly show a reduction in connectivity in theta, alpha, and beta bands across temporal, central, and especially frontal regions. These are exactly the regions of hyperconnectivity seen in the participant’s initial QEEG. As a result of these changes, significant clinical improvements have occurred as reviewed above.
ConclusionsRecent research has shown that autistic disorders have as their basis disturbances of neural connectivity. Neurofeedback seems capable of remediating such disturbances when these data are considered as part of treatment planning. Connectivity-guided neurofeedback is capable of significantly remedying these anomalies and reducing autistic symptoms. The case study reviewed above is an example of how this can be done. The emphasis was on hyperconnectivity. Likewise, hypoconnectivity can be remedied with coherence training and other neurofeedback approaches. Future work is clearly needed in these areas of research and clinical practice.
ReferencesAmerican Psychiatric Association. (1994). Diagnostic and statistical
manual of mental disorders (4th ed.). Washington, DC: Author.American Psychiatric Association. (2000). Diagnostic and statistical
manual of mental disorders (4th ed., text revision). Washington, DC: Author.
Figure 6. NeuroRep Compare analysis of pre-post changes in quantitative electroencephalograph connectivity.Figure 4. NeuroRep analysis (eyes open), CIM coherence/connectivity
topographical mapping.
Figure 5. Neurofeedback protocol setup for case example (yellow, active; blue, reference; black, ground) with 10/10 electrode placement system.
135
Coben
Bio
feedb
ack Ô Win
ter 2007
Baron-Cohen, S. (2004). The cognitive neuroscience of autism. Journal of Neurology, Neurosurgery, and Psychiatry, 75, 945–948.
Boddaert, N., Chabane, N., Barthelemy, C., Bourgeois, M., Poline, J. B., Brunelle, F., et al. (2002). Bitemporal lobe dysfunction in infantile autism: Positron emission tomography study. Journal of Radiology, 83(12 Pt. 1), 1829–1833.
Brodmann, K. (1909). Vergleichende Lokalisationslehre der Grosshinrinde in ihren Prinzipien dargestellt auf Grund des Zellenbaues [Comparative localization studies in the brain cortex, its fundamentals represented on the basis of its cellular architecture]. Leipzig, Germany: Barth.
Buxhoeveden, D., Semendeferi, K., Schenker, N., & Courchesne, E. (2004). Decreased cell column spacing in autism. Social Neuroscience, 582, 6.
Cantor, D. S., Thatcher, R. W., Hrybyk, M., & Kaye, H. (1986). Computerized EEG analyses of autistic children. Journal of Autism and Developmental Disorders, 16, 169–187.
Center for Disease Control and Prevention (2007a). Prevalence of the Autism Spectrum Disorders—Autism and Developmental Disabilities Monitoring Network, six sites, United States, 2000. Morbidity and Mortality Weekly Report, 56(SS 1–2), 1–11.
Center for Disease Control and Prevention (2007b). Prevalence of the Autism Spectrum Disorders—Autism and Developmental Disabilities Monitoring Network, 14 sites, United States, 2002. Morbidity and Mortality Weekly Report, 56(SS 1–2), 12–28.
Centers for Disease Control and Prevention. (2006). How common are autistic spectrum disorders (ASD)? Retrieved December 1, 2006, from http://www.cdc.gov/ncbddd/autism/asd_common,htm
Chatrian, G. E., Lettich, E., & Nelson, P. L. (1985). Ten percent electrode system for topographic studies of spontaneous and evoked EEG activity. American Journal of EEG Technology, 25, 83–92.
Cherkassky, V. L., Kana, R. K., Keller, T. A., & Just, M. A. (2006). Functional connectivity in a baseline resting-state network in autism. NeuroReport, 17, 1687–1690.
Coben, R. (2006, September). Assessment guided neurofeedback for autistic spectrum disorders: Part II: Evidence of QEEG changes. Paper presented at the 14th Annual Conference of the International Society for Neuronal Regulation, Atlanta, GA.
Coben, R., & Hudspeth, W. J. (2007). Mu oscillations in autistic spectrum disorder and their underlying mechanisms. Unpublished manuscript.
Coben, R., Hudspeth, W. J., Clarke, A., & Barry, R. (2006, September). QEEG in autistic disorders: Power and connectivity analyses. Paper presented at the 14th Annual Conference of the International Society for Neuronal Regulation, Atlanta, GA.
Coben, R., & Padolsky, I. (2007). Assessment-guided neurofeedback for autistic spectrum disorder. Journal of Neurotherapy, 11, 5–23.
Courchesne, E., & Pierce, K. (2005). Why the frontal cortex in autism might be talking only to itself: Local over-connectivity but long-distance disconnection. Current Opinion in Neurobiology, 15, 225–230.
Dawson, G., Warrenburg, S., & Fuller, P. (1982). Cerebral lateralization in individuals diagnosed as autistic in early childhood. Brain and Language, 15, 353–368.
Hudspeth, W. J. (2006). NeuroRep: The QEEG analysis and report system: User’s guide. Los Osos, CA: Neuropsychometrx.
Hudspeth, W. J. (2007). Empirical coherence: Anatomy and physiology of connectivity. Unpublished manuscript.
Kus, R., Kaminski, M., & Blinowska, K. (2004). Determination of EEG activity propagation: Pair-wise verses multichannel estimate. IEEE Transactions on Biomedical Engineering, 51, 1501–1510.
McAlonan, G. M., Cheung, V., Cheung, C., Suckling, J., Lam, G. Y., Tai, K. S, et al. (2004). Mapping the brain in autism: A voxel-based MRI study of volumetric differences and intercorrelations in autism. Brain, 128, 268–276.
Mizuno, A., Villalobos, M. E., Davies, M. M., Dahl, B. C., & Muller, R. A. (2006). Partially enhanced thalamocortical functional connectivity in autism. Brain Research, 1104, 160–174.
Murias, M., Webb, S. J., Greenson, J., & Dawson, G. (2007). Resting state cortical connectivity reflected in EEG coherence in individuals with autism. Biological Psychiatry, 62, 270–273.
Murphy, D. G. M, Critchley, H. D., Schmitz, N., McAlonan, G., Van Amelsvoort, T., Robertson, D., et al. (2002). A proton magnetic resonance spectroscopy study of the brain. Archives of General Psychiatry, 59, 885–891.
Ogawa, T., Sugiyama, A., Ishiwa, S., Suzuki, M., Ishihara, T., & Sato, K. (1982). Ontogenic development of EEG-asymmetry in early infantile autism. Brain and Development, 4, 439–449.
Page, L. A., Daly, E., Schmitz, N., Simmons, A., Toal, F., Deeley, Q., et al. (2006). In vivo H-magnetic resonance spectroscopy study of amygdala-hippocampal and parietal regions in autism. American Journal of Psychiatry, 163, 2189–2192.
Pelphrey, K., Adolphs, R., & Morris, J. P. (2004). Neuroanatomical substrates of social cognition dysfunction in autism. Mental Retardation Developmental Disabilities Research Review, 10, 259–271.
Rippon, G., Brock, J., Brown, C., & Boucher, J. (2007). Disordered connectivity in the autistic brain: Challenges for the “new psychophysiology.” International Journal of Psychophysiology, 63, 164–172.
Santangelo, S. L., & Tsatsanis, K. (2005). What is known about autism: Genes, brain, and behavior. American Journal of Pharmacogenomics, 5(2), 71–92.
Schmitz, N., Rubia, K., Daly, E., Smith, A., Williams, S., & Murphy, D. G. (2006). Neural correlates of executive function in autistic spectrum disorders. Biological Psychiatry, 59, 7–16.
Tidmarsh, L., & Volkmar, F. R. (2003). Diagnosis and epidemiology of autism spectrum disorders. Canadian Journal of Psychiatry, 48, 517–525.
Turner, K. C., Frost, L., Linsenbardt, D., McIIroy, J. R., & Muller, R. A. (2006). Atypically diffuse functional connectivity between caudate nuclei and cerebral cortex in autism. Behavioral and Brain Functions, 2, 34. Retrieved December 1, 2006, from http://www.behavioralandbrainfunctions.com/content/2/1/34
Welchew, D. E., Ashwin, C., Berkouk, K., Salvador, R., Suckling, J., Baron-Cohen, S., et al. (2005). Functional disconnectivity of the medial temporal lobe in Asperger’s Syndrome. Biological Psychiatry, 57, 991–998.
Correspondence: Robert Coben, PhD, Neurorehabilitation & Neuropsychologi-cal Services, 1035 Park Blvd., Suite 2B, Massapequa Park, NY 11762, email: [email protected].
Robert Coben