biofilm formation and its induced biocorrosion of …
TRANSCRIPT

BIOFILM FORMATION AND ITS INDUCED
BIOCORROSION OF METALS IN SEAWATER
SHENG XIAOXIA
NATIONAL UNIVERSITY OF SINGAPORE
2007
BIOFILM FORMATION AND ITS INDUCED
BIOCORROSION OF METALS IN SEAWATER
SHENG XIAOXIA
(B.ENG. (Hons.), ZHEJIANG UNIVERSITY)
A THESIS SUBMITTED
FOR THE DEGREE OF DOCTOR OF PHILOSOPHY
DEPARTMENT OF CHEMICAL AND BIOMOLECULAR
ENGINEERING
NATIONAL UNIVERSITY OF SINGAPORE
2007

Acknowledgements
i
ACKNOWLEDGEMENTS
I first would like to express my deepest gratitude and appreciation to my
supervisor Prof. Ting Yen Peng, for his constant guidance and inspiration throughout
my graduate studies. It was his patience and support through the years which inspired
me to preserve in my quest. I also would like to thank my co-supervisor, Prof. Simo
Olavi Pehkonen, for providing extremely valuable discussions and suggestions
regarding my research. I am very grateful towards Dr. He Jianzhong for helping me
conduct the molecular biology experiments, and for her insightful discussions for
pointing out the directions to improve my research work.
This work has received a great deal of support and assistance from the lab
officers Ms. Li Fengmei, Ms. Li Xiang, Ms. Sylvia Wan, Mr. Qin Zhen, and Mr. Boey
Kok Hong for their assorted help around the lab. I would like to acknowledge Ms.
Samantha Fam for her guidance on the operation of AFM. I also thank Mr. Ng Kim
Poi for preparing the metal coupons and making the corrosion cell.
Special thanks to my friends Zhao Quangqiang, Zhu Zhen, Wang Yan, Xu
Tongjiang, and Xu Ran for their friendship. Their help in my life made my graduate
study an enjoyable and exciting experience.
I would like to show my greatest appreciation to my husband, Zhang Ning, and
my parents for their support and encouragement.
This work was supported from Tropical Marine Science Institute (Singapore)
National University of Singapore (Research Grant RP-279-000-173-112).

Table of Contents
ii
TABLE OF CONTENTS
ACKNOWLEDGEMENTS........................................................................................ i SUMMARY ...............................................................................................................v LIST OF FIGURES................................................................................................. vii LIST OF TABLES.....................................................................................................xi NOMENCLATURE ................................................................................................ xii
CHAPTER 1 INTRODUCTION ................................................................................1
1.1 Biofilm Formation on Metal Surfaces ..........................................................3 1.2 Mechanisms of Biocorrosion........................................................................6 1.3 Bacteria Related to Biofilm Formation and Biocorrosion .............................7
1.3.1 Sulphate-reducing Bacteria (SRB)....................................................... 7 1.3.2 Other Bacteria ................................................................................... 10
1.4 Methods for the Inhibition of Biofilm and Biocorrosion...............................14 1.4.1 Layer-by-layer (LBL) Polyelectrolyte Multilayer Coating ................. 14 1.4.2 Organic Inhibitors ............................................................................. 17
1.5 Objectives and Scope of This Work..............................................................21
CHAPTER 2 MATERIALS AND METHODS .........................................................24
2.1 Metal Coupons.............................................................................................24 2.2 Microorganisms ...........................................................................................24 2.3 Isolation and Identification of Strain SJI1 ....................................................25
2.3.1 Morphological Characterization ........................................................ 25 2.3.2 Physiological Studies ........................................................................ 26 2.3.3 16S rRNA Sequence Analysis............................................................ 28 2.3.4 Phylogenetic Analysis ....................................................................... 28 2.3.5 Nucleotide Sequence Accession Number ........................................... 29
2.4 Biofilm Formation .......................................................................................29 2.4.1 Cell Immobilization .......................................................................... 29 2.4.2 Zeta Potential (ζ) and Contact Angle Measurements .......................... 30 2.4.3 Confocal Laser Scanning Microscopy (CLSM) ................................. 31 2.4.4 AFM Operation of Force Measurement ............................................. 31
2.5 Biofilm and Biocorrosion of Stainless Steel AISI 316 and Its Prevention .....32 2.5.1 Biofilm and Biocorrosion Experiment Setup ..................................... 32 2.5.2 Scanning Electron Microscopy (SEM)............................................... 33 2.5.3 Atomic Force Microscopy (AFM) ..................................................... 34 2.5.4 Electrochemical Impedance Spectroscopy (EIS)................................ 34
2.6 Preparation of Layer-By-Layer (LBL) Coating ............................................35 2.6.1 Polyelectrolyte Solutions................................................................... 35 2.6.2 Layer-by-layer (LBL) Technique ....................................................... 36

Table of Contents
iii
2.6.3 Stability of the PEM on Functionalized SS316 .................................. 37
CHAPTER 3 ISOLATION, CHARACTERIZATION AND IDENTIFICATION OF A MARINE SULPHATE REDUCING BACTERIA ....................................................39
3.1 Cell Morphology..........................................................................................39 3.2 Growth of Desulfovibrio singaporenus Strain SJI1 on Lactate and Acetate...40 3.3 Physiological Properties...............................................................................44 3.4 16S rRNA Gene Sequence and Phylogenetic Analysis .................................47 3.5 Summary .....................................................................................................51
CHAPTER 4 BIOFILM FORMATION AND FORCE MEASUREMENT ...............52
4.1 Force Measurement in the Fluid...................................................................52 4.1.1 Typical Force Curves......................................................................... 52 4.1.2 Forces Between the Cell Tip and Different Metal Substrates.............. 55 4.1.3 Cell Tip-Cell Lawn Interactions......................................................... 60 4.1.4 Influence of Nutrient and Ionic Strength on the Cell-Metal Interaction.................................................................................................................. 64 4.1.5 Influence of Solution pH on the Cell-Metal Interaction...................... 68
4.2 Ex-situ Force Measurement .........................................................................73 4.3 Summary .....................................................................................................78
CHAPTER 5 SULPHATE REDUCING BACTERIA BIOFILM AND ITS INDUCED BIOCORROSION OF STAINLESS STEEL AISI 316..............................................80
5.1 AFM Image Analysis ...................................................................................80 5.1.1 Biofilm Investigation......................................................................... 80 5.1.2 Pits Investigation............................................................................... 84
5.2 EIS Results ..................................................................................................88 5.2.1 Control Coupons in EASW ............................................................... 88 5.2.2 Coupons in EASW with D. desulfuricans .......................................... 95 5.2.3 Coupons in EASW with D. singaporenus .......................................... 97 5.2.4 Comparison of the Coupons with and without SRB ........................... 98
5.3 Summary ...................................................................................................100
CHAPTER 6 BIOFILM AND BIOCORROSION INHIBITION USING LAYER-BY-LAYER COATING ............................................................................102
6.1 Surface Functionalization of SS316 and the Stability of the Multilayers.....102 6.2 XPS Analysis of the Functionalized Stainless Steel ....................................104 6.3 Biofilm Viability Study by CLSM..............................................................106 6.4 Biofilm and Biocorrosion Study Using AFM..............................................108 6.5 Biocorrosion Study Using Linear Polarization Analysis .............................110

Table of Contents
iv
CHAPTER 7 BIOFILM AND BIOCORROSION INHIBITION USING AN ORGANIC INHIBITOR.........................................................................................112
7.1 Evaluation of Organic Corrosion Inhibitor on Abiotic and Biotic Corrosion of Mild Steel........................................................................................................112
7.1.1 XPS Analysis ...................................................................................112 7.1.2 Bacteria Concentration .....................................................................114 7.1.3 EIS Analysis.....................................................................................115 7.1.4 Linear Polarization Analysis and Potentiodynamic Scanning Curves 118 7.1.5 SEM Analysis ..................................................................................122 7.1.6 AFM Analysis ..................................................................................126 7.1.7 Adsorption Isotherm.........................................................................128
7.2 Evaluation of Organic Corrosion Inhibitor on Abiotic and Biotic Corrosion of SS316..............................................................................................................130
7.2.1 EIS Analysis.....................................................................................130 7.2.2 Linear Polarization Analysis.............................................................133 7.2.3 CLSM Analysis ................................................................................134 7.2.4 AFM Analysis ..................................................................................136 7.2.5 Adsorption Isotherm.........................................................................138
7.3 Summary ...................................................................................................139
CHAPTER 8 CONCLUSIONS AND RECOMMENDATIONS..............................141
8.1 Conclusions ...............................................................................................141 8.2 Recommendations......................................................................................146
REFERENCES.......................................................................................................149
Summary
v
SUMMARY
Biocorrosion, also termed as microbiologically influenced corrosion (MIC),
refers to the electrochemical process where the participation of the microorganisms on
a metal surface accelerates the corrosion reaction on the metal surface. An important
step of biocorrosion process is the formation of a biofilm, a microbial community
which is enveloped by adhered extracellular biopolymer substances (EPS) these
microbial cells produce on the surface of a liquid and a surface. In this thesis, several
issues related to biofilm and biocorrosion on metals are addressed. These include: (i)
the isolation and characterization of a novel marine sulphate-reducing bacteria (SRB)
strain from local seawater, (ii) investigating bacteria-metal interactions, (iii)
investigating biofilm and its induced biocorrosion of two SRB strains on stainless
steel 316 (SS316), and (iv) biofilm and biocorrosion prevention using an organic
inhibitor and a layer-by-layer coating on the metal substrate.
A novel sulphate-reducing bacterium, designated Desulfovibrio singaporenus
strain SJI1, was isolated from seawater near St. John Island, Singapore. The isolate is
rod, curved-shaped and motile, and is a typical moderately halophilic and mesophilic
strain. Interestingly, D. singaporenus completely oxidizes lactate to acetate via
pyruvate as the intermediate during sulphate reduction. Acetate is further partially
oxidized to CO2 when it is used as an electron donor.
The adhesion of two anaerobic sulphate-reducing bacteria (D. desulfuricans and
D. singaporenus) and an aerobe (Pseudomonas sp.) to four polished metal surfaces
(i.e. stainless steel AISI 316, mild steel, aluminum, and copper) was examined using a
force spectroscopy technique with an atomic force microscopy (AFM). Using a
modified bacterial tip, the attraction and repulsion forces (in the nano-Newton range)
between the bacterial cell and the metal surface in aqueous media were quantified.
Results show that the bacterial adhesion force to aluminum and to copper is the
highest and the lowest respectively among the metals investigated. The bacterial
adhesion forces to metals are influenced by the surface charges and the
hydrophobicity of the metal and bacteria. The cell-cell interactions show that there are

Summary
vi
strong electrostatic repulsion forces between bacterial cells.
Biocorrosion of SS316 by D. desulfuricans and D. singaporenus was
investigated. The biofilm and pit morphology that developed with time were analyzed
using atomic force microscopy (AFM). Electrochemical impedance spectroscopy (EIS)
results were interpreted with an equivalent circuit to model the physicoelectric
characteristics of the electrode/biofilm/solution interface. D. desulfuricans formed one
biofilm layer on the metal surface, while D. singaporenus formed two layers: a biofilm
layer and a ferrous sulfide deposit layer. AFM images corroborated results from the EIS
modeling which showed biofilm attachment and subsequent detachment over time.
These results indicate that SRB could directly react with metal surface, and it plays
direct role in the biocorrosion.
A layer-by-layer coating on SS316 substrate alternately with quaternized
polyethylenimine (q-PEI) and poly(acrylic)acid (PAA) to form polyelectrolyte
multilayers (PEM) was investigated. The PEM were stable in seawater. The
antibiocorrosion ability of PEM on stainless steel was assessed using Pseudomonas
sp., D. desulfuricans and D. singaporenus. Compared to the bare stainless steel, the
corrosion rates and the pit depths decreased for the PEM functionalized SS316.
Biofilm growth on the substrate was inhibited by the antibacterial effect of q-PEI as
shown by confocal laser scanning microscopy (CLSM). These results indicate that
PEM have potential applications in the inhibition of biocorrosion of metal substrates.
Corrosion inhibition of mild steel and SS316 by an organic inhibitor
2-Methylbenzimidazole (MBI) in seawater was also investigated using direct current
polarization, XPS, EIS, SEM, CLSM, and AFM. MBI was shown to be an effective
inhibitor in controlling abiotic corrosion as well as biocorrosion by D. desulfuricans
and D. singaporenus. Tafel plots revealed that MBI predominantly controls the
cathodic reaction. The corrosion inhibition effect of MBI on MIC is partially due to
the inhibition of the bacterial activity. The adsorption of MBI on the steel surface
follows a Langmuir adsorption isotherm model.

List of Figures
vii
LIST OF FIGURES
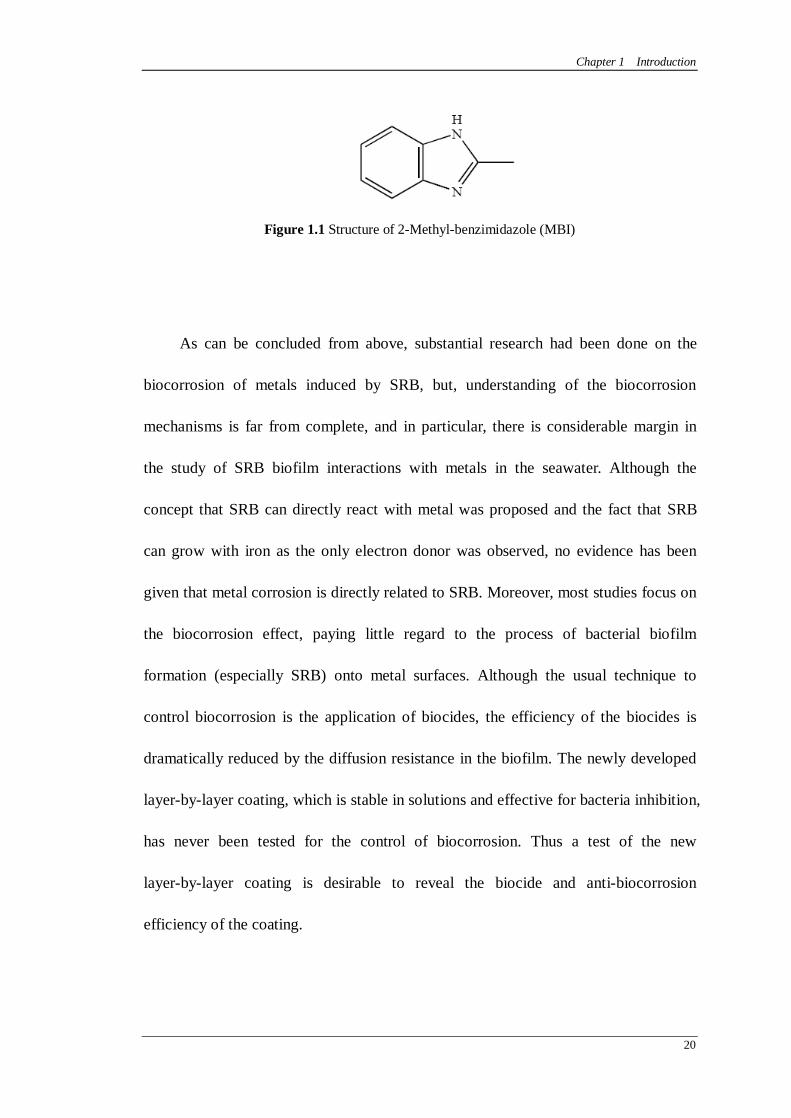
Figure 1.1 Structure of 2-Methyl-benzimidazole (MBI) ............................................20
Figure 2.1 Derivatization of q-PEI............................................................................36
Figure 2.2 Layer-by-layer (LBL) coating of q-PEI and PAA multilayer on polished SS316 .....................................................................................................37
Figure 3.1 Images of strain SJI1 on a SS316 coupon: (a) a single cell (x10,000); (b) cells growing on SS316 (x5,000); (c) an AFM phase image of an individual cell with a single polar flagellum (scale 4 μm × 4 μm).............................40
Figure 3.2 (a) Time course of the growth of strain SJI1 showing increase in cell density (♦) and decrease in sulphate concentration (); (b) The consumption of lactate () and the production of acetate () and pyruvate () accompanying bacterial growth. Error bars indicate standard deviation, which are not shown when they are smaller than the symbol. ..................42
Figure 3.3 Nucleotide sequence of the 16S rRNA gene of strain SJI1 (deposited in the Genbank database on 16th April 2007 under accession number EF178280)................................................................................................................48
Figure 3.4 A phylogenetic tree based on 16S rRNA gene sequences showing the position of strain SJI1 within the genus Desulfovibrio and in relation to other sulphate-reducing bacteria. The tree was calculated using the neighbor-joining method. Bar, 2% sequence divergence. .........................49
Figure 4.1 A scanning electron microscope image of a silicon nitride tip coated with Pseudomonas sp......................................................................................52
Figure 4.2 A typical force-distance curve between a Pseudomonas sp. coated tip and SS316. ....................................................................................................54
Figure 4.3 Force-distance curves when a Pseudomonas sp. cells coated tip was (a) extended to and (b) retracted from different metal substrates in artificial seawater. .................................................................................................58
Figure 4.4 Force-distance curves when a D. desulfuricans cells coated tip was (a) extended to and (b) retracted from different metal substrates in artificial seawater. .................................................................................................58
Figure 4.5 Force-distance curves when a D. singaporenus cells coated tip was (a) extended to and (b) retracted from different metal substrates in artificial seawater. .................................................................................................59
Figure 4.6 CLSM images of Pseudomonas sp. adhering onto (a) mild steel, (b) copper, (c) aluminum, and (d) on SS316 in artificial seawater. The scale bar is 500 μm for all images. ...................................................................................60
List of Figures
viii
Figure 4.7 Force-distance curves when bacteria coated tip was extended to the substrate in artificial seawater: (a) D. singaporenus, (b) Pseudomonas sp., and (c) D. desulfuricans...........................................................................................63
Figure 4.8 Force-distance curves when a cells-coated tip was retracted from SS316 in different solutions (a) Pseudomonas sp.; (b) D. desulfuricans; (c) D. singaporenus. ..........................................................................................66
Figure 4.9 CLSM images of Pseudomonas sp. adhering onto SS316 in (a) DIW; (b) ASW; (c) EASW. ....................................................................................68
Figure 4.10 The adhesion force between cell probe and SS316 in ASW with various pH: (a) Pseudomonas sp.; (b) D. desulfuricans; (c) D. singaporenus. .............71
Figure 4.11 XPS measurement of Fe 2p spectra in ASW at various pH: (a) pH 3, (b) pH 5, (c) pH 7, and (d) pH 9. ........................................................................72
Figure 4.12 A contact mode AFM image of a biofilm on SS316................................76
Figure 4.13 Force measurements on the biofilm surface with D. singaporenus: (A—on cell, B—at cell periphery, C—on biofilm substrate, D—on deposit and E—at deposit periphery) .........................................................................77
Figure 4.14 Force measurements on the biofilm surface with D. desulfuricans: (A—on cell, B—at cell periphery, C—on biofilm substrate, D—on deposit and E—at deposit periphery) .........................................................................77
Figure 5.1 Atomic Force Microscopy images of stainless steel AISI 316 coupons with D. desulfuricans biofilm; (a) 4-day-immersion; (b) 14-day-immersion; (c) 24-day-immersion; (d) 34-day-immersion; (e) 44-day-immersion. ..........82
Figure 5.2 Atomic Force microscopy images of SS316 coupons with D. singaporenus biofilm; (a) 4-day-immersion; (b) 14-day- immersion; (c) 24-day- immersion; (d) 34-day- immersion; (e) 44-day- immersion. ....................83
Figure 5.3 Two- and three-dimensional images of (a) a single pit, and (b) a D. desulfuricans cell on the SS316 coupons. ................................................85
Figure 5.4 Section analysis on the SS316 coupons: (a) height profile of D. desulfuricans cells; (b) depth profile of a small pit; (c) depth profile of a large pit.........86
Figure 5.5 Depth of pits on SS316 at different time of exposure. ..............................87
Figure 5.6 SEM images for biofilm on the SS316 in MASW with (a) D. desulfuricans and (b) D. singaporenus. .........................................................................87
Figure 5.7 EIS analysis for the samples at 35th day of immersion: (a) control coupon; (b) coupon with D. desulfuricans; (c) coupon with D. singaporenus. ............90
Figure 5.8 Equivalent Circuit models: (a) Model of R(Q[R(QR)]) for control coupons; (b) Model of R(Q[R(QR)(QR)]) for control coupons; (c) Model of R(Q[R(QR)(QR)]) for coupons in EASW with D. desulfuricans; (d) Model

List of Figures
ix
of R(Q[R(QR)(QR)(QR)]) for coupons in EASW with D. singaporenus. 92
Figure 5.9 Experimental EIS data (symbol) and their fitted data (line) for (a) a SS316 coupon; (b) coupon with D. desulfuricans; (c) coupon with D. singaporenus................................................................................................................93
Figure 5.10 Cyclic polarization curves of SS316 exposed to EASW for (a) 7 days; (b) 14 days; (c) 21 days. (d) Potentiodynamic scanning curve of SS316 coupon exposed to EASW with D. desulfuricans for 7 days.................................95
Figure 6.1 Contact angle measurements for the different layers of coating. .............103
Figure 6.2 The stability test of the functionalized SS316 in EASW. ........................104
Figure 6.3 XPS wide scan for (a) the pristine SS316 and (b) q-PEI/PAA multibilayers of the functionalized SS316.......................................................................105
Figure 6.4 N 1s spectra for (a) the pristine SS316 and (b) q-PEI/PAA multibilayers of the functionalized SS316.......................................................................106
Figure 6.5 CLSM images for the biofilm on (1) the pristine, and (2) the functionalized SS316 in EASW for 5 weeks with (a) Pseudomonas sp., (b) D. desulfuricans, and (c) D. singaporenus..................................................107
Figure 6.6 AFM surface roughness analysis for the biofilm on (a) the pristine SS316, and (b) the functionalized SS316 after immersing in EASW for 1, 3, and 5 weeks. ...................................................................................................108
Figure 6.7 AFM bearing analysis for pit volume formed on (a) the pristine SS316, and (b) the functionalized SS316 after immersing in EASW for 1, 3, and 5 weeks. ...................................................................................................109
Figure 7.1 N 1s spectra for (a) the pristine mild steel; (b) the mild steel deposited with MBI. .....................................................................................................113
Figure 7.2 Fe 2p spectra for (a) the pristine mild steel; (b) the mild steel deposited with MBI. .....................................................................................................114
Figure 7.3 Nyquist plots for mild steel in EASW for 24 hours (a) without bacteria; (b) with D. singaporenus; (c) with D. desulfuricans. ...................................117
Figure 7.4 Equivalent circuit for the metal/liquid interface. ....................................117
Figure 7.5 Tafel polarization curves of pristine mild steel and inhibited mild steel in EASW for 24 hours (a) without bacteria; (b) with D. desulfuricans; (c) with D. singaporenus. ...................................................................................119
Figure 7.6 Potentiodynamic scanning curves of mild steel exposed to EASW for 24 hours (a) without bacteria; (b) with D. desulfuricans; (c) with D. singaporenus. ........................................................................................122
Figure 7.7 SEM images of mild steel in EASW for 24 hours (a) without MBI; (b) with

List of Figures
x
MBI at 0.1 mM; (c) with MBI at 0.5 mM; (d) with MBI at 1 mM. (magnification x1,000) ..........................................................................123
Figure 7.8 SEM images of mild steel in EASW with D. desulfuricans for 24 hours (a) without MBI; (b) with MBI at 1 mM; (c) with MBI at 2.5 mM. (magnification x1,000) ..........................................................................124
Figure 7.9 SEM images of mild steel in EASW with D. singaporenus for 24 hours (a) without MBI; (b) with MBI at 1 mM; (c) with MBI at 2.5 mM. (magnification x1,000) ..........................................................................124
Figure 7.10 Biofilm on mild steel (a) D. singaporenus without MBI; (b) D. singaporenus with MBI at 1 mM; (c) D. desulfuricans without MBI; (d) D. desulfuricans with MBI at 1 mM...........................................................125
Figure 7.11 AFM images of mild steel in EASW with D. desulfuricans for 24 hours (a) without MBI; (b) with MBI at 1 mM; (c) with MBI at 2.5 mM..............127
Figure 7.12 AFM images of mild steel in EASW with D. singaporenus for 24 hours (a) without MBI; (b) with MBI at 1 mM; (c) with MBI at 2.5 mM..............127
Figure 7.13 The application of the Langmuir isotherm model to the corrosion protection behavior of MBI to mild steel................................................................130
Figure 7.14 Nyquist plots for SS316 in EASW for 1 week (a) without bacteria; (b) with D. desulfuricans; (c) with D. singaporenus............................................132
Figure 7.15 CLSM images of SS316 in EASW (a) with D. desulfuricans; (b) with D. desulfuricans + MBI (1 mM); (c) with D. desulfuricans + MBI (2.5 mM)..............................................................................................................135
Figure 7.16 CLSM images of SS316 in EASW (a) with D. singaporenus; (b) with D. singaporenus + MBI (1 mM); (c) with D. singaporenus + MBI (2.5 mM)..............................................................................................................136
Figure 7.17 AFM images of SS316 in EASW (a) with D. desulfuricans, (b) with D. desulfuricans + MBI 1 mM, (c) with D. singaporenus, (d) with D. singaporenus + MBI 1 mM for 1 week..................................................137
Figure 7.18 The application of the Langmuir isotherm model to the corrosion protection behavior of MBI to SS316.....................................................................139

List of Tables
xi
LIST OF TABLES
Table 3.1 Utilization of organic compounds in the presence of sulphate and fermentation of carbon source in the absence of electron acceptor for strain SJI1. ...........................................................................................46
Table 3.2 Comparison of strain SJI1 and other closely related Desulfovibrio species................................................................................................................50
Table 4.1 Force quantification of bacteria in artificial seawater on various metals...55
Table 4.2 Contact angle and surface charge of bacteria in artificial seawater...........58
Table 4.3 Force quantification of three bacteria on SS316 in various solutions .......66
Table 4.4 Force quantification of three bacteria on SS316 in ASW with different pH...............................................................................................................71
Table 4.5 Fitting parameters for XPS spectra Fe2p3/2 and relative quantity of compounds in the surface of SS316 immersed in ASW at different pH. ...73
Table 4.6 Tip-surface adhesion forces on coupons with a biofilm (mean ± S.D.).....78
Table 5.1 Parameters of EIS for the samples in EASW or EASW with SRB after 14 and 35 days of immersion. ....................................................................100
Table 6.1 Corrosion current analysis on the pristine SS316 and the functionalized SS316 after immersion in EASW for 5 weeks. ......................................110
Table 7.1 Charge transfer resistance and corrosion inhibition efficiency parameters for the corrosion of mild steel in EASW with or without MBI. ...................118
Table 7.2 Electrochemical polarization parameters for pristine mild steel and inhibited mild steel calculated from Tafel plots. ...................................................121
Table 7.3 AFM study of biofilm surface roughness and pit depth..........................128
Table 7.4 Charge transfer resistance and corrosion inhibition efficiency parameters for the corrosion of SS316 in EASW with or without MBI. ........................132
Table 7.5 Electrochemical polarization parameters calculated from Tafel plots for the pristine SS316 and the SS316 with MBI................................................134
Table 7.6 AFM study of biofilm surface roughness and pit depth..........................138

Nomenclature
xii
NOMENCLATURE
AFM Atomic force microscopy
ASW Artificial seawater
C Concentration of inhibitor
CPE Constant phase element
CLSM Confocal laser scanning microscope
DIW Deionized water
EASW Enriched artificial seawater
EIS Electrochemical impedance spectroscopy
EPS Extracellular polymeric substance
IE Inhibition efficiency
IOB/MOB Iron/manganese-oxidizing bacteria
MIC Microbiologically influenced corrosion
PCR Polymerase chain reaction
Qb Capacitance of the biofilm
Qdl Capacitance of the double layer
Qf Capacitance of the ferrous sulfide film
Qpit Capacitance of the pits in the passive film
Qpf Capacitance of the passive film
Rb Resistance of the biofilm
Rct Charge transfer resistance
Rf Resistance of the ferrous sulfide film

Nomenclature
xiii
Rs Solution resistance
SEM Scanning electron microscope
SOB Sulfur-oxidizing bacteria
SPB Slime-producing bacteria
SRB Sulphate-reducing bacteria
SS316 Stainless steel 316
XPS X-ray photoelectron spectroscopy
ZCPE Impedance of the constant phase elements
icorr Corrosion current density
i' Corrosion current density of the inhibitor-containing mild steel
i Corrosion current density of the pristine mild steel
ρ Specimen density
M Atomic mass of the metal
ΔGoads
Free energy of adsorption
Kad Adsorption equilibrium constant
f Molecular interaction constant
θ Surface coverage values
ω Angular frequency of alternating current voltage
d Cantilever deflection
ksp Cantilever spring constant

Chapter 1 Introduction
1
CHAPTER 1 INTRODUCTION
Although corrosion associated with microorganisms has been recognized for
over 50 years, research in biocorrosion (i.e. the role played by microorganisms in
corrosion) is considered relatively new and its mechanism is still not fully understood.
Biocorrosion, also termed microbiologically influenced corrosion (MIC), refers to the
influence of microorganisms on the kinetics of corrosion processes of metals, induced
by microorganisms adhering to the interfaces, i.e. on the biofilm.
Biocorrosion is not a new corrosion mechanism but it integrates the role of
microorganisms in the corrosion processes. It occurs directly and indirectly as a result
of the activities of living microorganisms. The corrosion reactions can be influenced
by microbial activities, especially when the microorganism attaches onto metal
surface to form biofilm. Kinetics of corrosion processes of metals can be influenced
by biofilms. Products of their metabolic activities including enzymes, exopolymers,
organic and inorganic acids, as well as volatile compounds such as ammonia or
hydrogen sulfide can affect cathodic and/or anodic reactions, thus altering the
electrochemistry at the biofilm/substrate interface. The involvement of biofilm on
metal surface may result in metal deterioration.
It is well-known that seawater is more corrosive than freshwater because of the
high concentration of chloride ion. Chloride can decrease the pH near the metal
surface and attack the passive film on the metals. Furthermore, seawater supports the
growth of diverse living microorganisms. When immersed in seawater, metal surfaces

Chapter 1 Introduction
2
are rapidly covered with a layer of primary bacterial film. The corrosion induced by
the microorganisms occurs after this bio-adhesion process.
Biofilm and biocorrosion have become a serious problem in the marine industry.
It reduces the lifetime of various industrial materials and equipment. It is estimated
that approximately 20% of all corrosion damage of metals is induced by biocorrosion
(Flemming, 1996). Financial cost associated with the repair and replacement of
equipment resulting from the damage of biofilm and biocorrosion problem run into
millions of dollars annually. Brennenstuhl et al. (1992) reported that biocorrosion
caused a damage of approximately US $ 55 million in stainless steel exchangers
within 8 years. The costs arise from lost energy, spare parts, repair efforts, monitoring
and changes in design.
Therefore, it is important to study the biocorrosion behavior of metals and its
corrosion mechanisms in the marine environment. There are usually several
mechanisms involved in biofilm induced corrosion. A biofilm not only entraps
deleterious metabolites secreted by bacteria, but also creates gradients of pH,
dissolved oxygen, nutrient, and chloride. Over time, this alters and influences the
immediate surroundings of the metal surface and leads to localized corrosion of the
metal.
The metabolic products of microorganisms in biofilm may be very harmful to
the metals. For example, the organic or inorganic acids produced by bacteria greatly
increase the corrosion of metals by speeding up the anodic reaction, while some
bacteria may be involved in the cathodic reaction by consumption of hydrogen or

Chapter 1 Introduction
3
oxygen (cathodic reactants) in the metal-biofilm interface. Therefore, it is important to
study the mechanism of the biofilm and biocorrosion. In this chapter, a review will be
given on biofilm formation, biocorrosion mechanisms, bacteria species associated
with the biofilm and biocorrosion of metals, as well as methods for the inhibition of
biofilm and biocorrosion.
1.1 Biofilm Formation on Metal Surfaces
Biofilm is composed of microorganisms (including bacteria, fungi, algae and
protozoa) adhering to the surfaces of solid in an aqueous environment. It is a slimy
substance which contains microorganisms, extracellular polymeric substances, metals,
plastics, and soil particles. Biofilm grows via a series of steps: First some trace
organics are first adsorbed to the surface to form a conditioning layer, after which
some pioneer bacteria may adsorb and subsequently desorb (Hamilton, 1987). The
initial bacteria attachment is formed through a reversible adsorption process, which is
governed by electrostatic attraction and physical forces, e.g. van der Waals forces and
hydrophobic interactions (Ong et al, 1999; Van Oss et al., 1986), but not
chemisorption. The adhesion forces are dependent on the physicochemical property of
the substrate and the surface property of bacteria, e.g. hydrophobicity and surface
charge. The initial bacterial attachment is a crucial step in the process of biofilm
development (Razatos et al., 1998).
Some researchers (Hamilton, 1987; Wolfaardt and Cloete, 1992) have taken an
empirical approach to observe initial microorganisms attachment microscopically, and
Chapter 1 Introduction
4
model the adhesion process. The attachment is usually studied by image analysis such
as confocal laser scanning microscopy (CLSM) developed by Caldwell and Lawrence
(1989). Some other researchers, including Absolom et al. (1983), and Rutter and
Vincent (1984), have expanded on the physicochemical thermodynamic approach.
Absolom et al. (1983) employed a concept of short-range interaction force to see the
direct bacteria contact with the substratum, and the Gibbs free energy is estimated
from the interfacial tension. In contrast, Rutter and Vincent (1984) used the
long-range interaction concept based on the DLVO (Derjaguin, Landau, Verway, and
Overbeek) theory. The interaction Gibbs free energy between particle and surface is a
function of the distance between the two. Recently, atomic force microscopy (AFM)
force measurements of cell-solid and cell-cell interactions using functionalized probes
have been shown to be a promising new approach to study the initial bacteria
attachment (Dufrêne, 2003). The bacteria are directly attached to the end of the
cantilever to form a modified tip (termed as a cell probe). Cell probes have been used
to quantify the interactions between the bacteria and various inanimate surfaces,
including mica, Teflon, some coated substrates (e.g. polystyrene), and hydrophilic as
well as hydrophobicly modified glass. It has been reported that cell adhesion to
surfaces is enhanced by the surface hydrophobicity of the substrate (Videla, 1996;
Ong et al., 1999). Lower et al. (2000; 20001a; 2001b) also used AFM force
measurements to quantify the interfacial and adhesion forces between bacteria and
mineral surfaces. Besides bacterial cells, cell probes that were modified with yeast
and spore have been employed for the analysis of fungal contamination in food, drug

Chapter 1 Introduction
5
and agricultural industries (Bowen et al., 2000a, 2000b, 2001, and 2002). Bowen et al.
(2000a, 2000b, 2001, and 2002) used different yeast cells and spores to study the
parameters that influence the cell adhesion, including the strength of cell-substrate
interactions, the time development of adhesive contact, the influence of pH and ionic
strength, the effect of substratum, and the effect of the culture age and growth
conditions. Interestingly, the cell probe can be used to “recognize” a mineral surface;
it has been reported that the affinity between the bacterium Shewanella oneidesis and
goethite rapidly increases as electrons transfer from the bacterium to the mineral
(Lower et al., 2001b). AFM force measurements using a cell probe have also been
applied in the area of membrane research (Li and Elimelech, 2004; Hilal and Bowen,
2002; Hilal et al., 2003) to investigate the contamination and fouling of the
nanofiltration membrane. However, the bacterial attachment to metal surfaces has
seldom been studied.
In general, some of the adsorbed cells colonize and form structures which may
permanently hold the cells to the surface to form a biofilm. The adsorbed cells
produce extracellular polymeric substance (EPS), whether capsule or a loose network,
as a glycocalyx. Soon thereafter, a thriving colony of bacteria is established. In a
mature biofilm, more of the volume is occupied by the loosely organized glycocalyx
matrix (75% - 95%) than the bacteria cells (5 - 25%).
The development of biofilm is affected by some parameters (Coetser and Cloete,
2005) such as the system temperature, water flow rate past the surface, environmental
nutrient, surface roughness, and pH conditions of water which influence the bacterial
Chapter 1 Introduction
6
growth and attachment.
1.2 Mechanisms of Biocorrosion
The formation of biofilm may have deleterious effects for the metal substrates.
Two distinct classes of microorganisms, the aerobe and anaerobe, cause biocorrosion
with distinctly different types of corrosion reactions. Under aerobic conditions, the
continuous supply of oxygen to the cathode and the removal of the insoluble iron
oxides and hydroxides at the anode speed up the corrosion process (Hamilton, 1985).
The role of the microorganisms is either to assist in the establishment of the
electrolytic cell (indirect) or to simulate the anodic or cathodic reactions (direct)
(Hamilton, 1985).
The microorganisms in the biofilm increase the metal corrosion in several ways:
(a) Consumption of oxygen (cathodic reactant in aerobic corrosion) by aerobic
microorganisms to form localized differences in concentration shift, which results in
the creation of localized corrosion of metals.
(b) Consumption of hydrogen (cathodic reactant in anaerobic corrosion) by
microorganisms to depolarize the cathode, which increases the rate of metal loss at the
anode.
(c) Biodegradation of protective coatings on metal surfaces by microorganisms.
(d) Biodegradation of corrosion inhibitors, which are added to protect metals in
industrial water systems.
(e) Production of microbial metabolites which are corrosive organic and inorganic

Chapter 1 Introduction
7
acids, and are often the end-products of the metabolism of microorganisms.
(f) Production of metabolic by-products, such as H2S, which precipitate metal ions,
such as iron to form corrosive FeS.
1.3 Bacteria Related to Biofilm Formation and Biocorrosion
Microorganisms associated with biocorrosion of metals such as iron, aluminum,
copper and their alloys are diverse in the natural environment. Their ability to
influence the corrosion of metals by changing the corrosion resistance in the
environment makes the microorganisms deleterious to the metals.
The main types of bacteria involved in biocorrosion of metal substrates are (i)
sulphate-reducing bacteria (SRB), (ii) sulfur-oxidizing bacteria (SOB), (iii)
iron/manganese-oxidizing bacteria (IOB/MOB), and (iv) slime-producing bacteria
(SPB). These microorganisms can coexist in natural biofilms, and affect the
electrochemical processes in either anaerobic or aerobic reaction by the excreted
metabolites.
1.3.1 Sulphate-reducing Bacteria (SRB)
The most common bacteria related to biocorrosion are sulphate reducing
bacteria (SRB), which include the genus Desulfovibrio, Desulfotomaculum, and
Desulforomonas. SRB are anaerobes that are sustained by organic nutrients. Generally
they require a complete absence of oxygen and a highly reducing environment to
function efficiently. SRB are usually not the first group of microorganisms to deposit
on metals in the aqueous environment. Initially, aerobic microorganisms are the

Chapter 1 Introduction
8
predominant populations present in water. As these grow, biofilms accumulate and a
strong reducing environment develops at the attachment point. SRB then begin to
grow. The metabolites of the aerobic microorganisms not only produce reducing
conditions, but also provide nutrients for the SRB, which permit them to grow at a
rapid rate. Corrosion develops in the areas where SRB have grown to a high
population. Thus anaerobic biocorrosion occurs in aqueous systems. Although water
contains free oxygen, the areas where SRB grow are anaerobic.
The mechanisms of metal corrosion in the presence of SRB are complex. In an
anaerobic environment, SRB use sulphate as the electron acceptor and reduce it to
sulfide. Von Wolzogen Kuhr and van der Vlugt (1934) in their pioneering work,
suggested the following reactions occurring:
4Fe → 4Fe2+ + 8e- (anodic reaction)
8H2O → 8H+ + 8OH- (water dissociation)
8H+ + 8e- → 8H(ads) (cathodic reaction)
SO42- + 8H(ads) → S2- + 4H2O (bacterial consumption)
Fe2+ + S2- → FeS (corrosion products)
4Fe + SO42-
+ 4H2O → 3Fe(OH)2 + FeS + 2OH- (overall reaction)
This overall process is described as cathodic depolarization. Based on this
theory, SRB consume the atomic or cathodic hydrogen which accumulates at the
cathode by a hydrogenase enzyme, thereby depolarizing the cathode (Hardy, 1983).
This is the first mechanism proposed for SRB induced corrosion.
Some researchers (Sanders and Hamilton, 1986; Little et al., 1992), however,

Chapter 1 Introduction
9
have suggested that the corrosion rates increase due to the cathodic reduction of H2S:
H2S + 2e- → H2 + S2- (cathodic reaction of H2S)
and the anodic reaction is accelerated by the formation of iron sulfide:
Fe + S2- → FeS + 2e- (anodic reaction)
It is, however, generally acknowledged that it is too simplistic to consider only
one mechanism, since many factors may be involved in SRB-influenced corrosion.
Besides the cathodic depolarization by hydrogenase and anodic depolarization
demonstrated above, the corrosion process or substances involved may also include
iron sulfide, Fe-binding exopolymers, volatile phosphorus compound, sulfide-induced
stress corrosion cracking and hydrogen-induced cracking or blistering (Beech, 1999).
The three SRB induced corrosion mechanisms mentioned above are based on
the indirect interaction of SRB with metals, i.e. by increasing the anodic or cathodic
reaction. Recently, Dinh et al. (2004) detected SRB with the potential for direct
corrosion by enriching the SRB cultures with iron specimens as the only electron
donor and marine sediment as the inoculum. The growth of living bacteria suggests
that the SRB strain IS4 has a direct interaction with iron. An electron flow from
metallic iron can directly participate in the sulphate reduction via a pathway:
Fe electron transport system sulphate reduction enzymes
Hydrogenase H2
Such direct interaction between SRB and metallic iron indicates that the iron
could become a growth substrate of SRB, which dramatically increases the metal

Chapter 1 Introduction
10
corrosion. This understanding greatly changes the conventional viewpoint toward
SRB induced corrosion, which is usually considered to be the result of the indirect
influence of SRB on the biocorrosion of metals.
These mechanisms mentioned above offer a possible explanation of
SRB-induced corrosion. However, several factors, such as the cathodic depolarization,
anodic depolarization, acidification caused by hydrogen sulfide, and the direct
electron flow between metal and bacteria, may influence biocorrosion of metals
simultaneously, thus rendering the biocorrosion behavior of SRB more complicated.
1.3.2 Other Bacteria
Besides SRB, numerous types of bacteria are able to carry out iron oxidizing
reactions and have been shown to influence corrosion reactions. Some bacteria
associated with the corrosion and their mechanisms are listed below:
(a) Iron/Manganese oxidizing bacteria (IOB/MOB)
IOB/MOB, for example, the genera Siderocapsa, Gallionella, Leptothrix,
Sphaerotilus, Crenothrix, and Clonothrix, are groups of bacteria related to MIC. They
can oxidize Fe2+, either dissolved in the bulk medium or precipitated on a surface, to
Fe3+. The dense accumulation of IOB/MOB on the metal surface may thus promote
the corrosion reactions by the deposition of cathodically reactive ferric and manganic
oxides and the local consumption of oxygen by bacterial respiration in the deposit
(Beech and Gaylarde, 1999). It has been shown that IOB/MOB can promote the
ennoblement of metals (i.e. a change to more positive values of pitting potential) and
pitting corrosion.
Chapter 1 Introduction
11
Comparisons in the chemistry of microbially and electrochemically induced
pitting of 316L stainless steel have been studied (Geiser, et al., 2002; Shi, et al., 2006).
Firstly, pits formed in the presence of bacteria (Leptothrix discophora) had
morphologies different from those initiated by anodic polarization of the material in
the same solution (Geiser, et al., 2002). Corrosion pits induced by manganese
oxidizing bacteria show the same morphology with the bacteria. Secondly, the pits
and their immediate vicinity associated with microbiologically influenced corrosion
had different chemical signature from those associated with electrochemically induced
pitting (Shi, et al., 2006). These findings suggest a possibility that the microorganisms
were directly involved in pit initiation. Chromium, manganese and iron are dissolved
in the passive layer and manganese-containing deposit was formed on the metal
surface during the pitting process of Leptothrix discophora, while only manganese
and iron are dissolved in the passive layer in the anodic polarization pitting process.
Leptothrix discophora is also implicated in manganese corrosion. Manganese
biomineralization occurs in two steps: firstly, the divalent manganese Mn2+ is
oxidized to manganese oxyhydroxide MnOOH; and secondly, MnOOH is further
oxidized to manganese dioxide MnO2 (Shi et al., 2002). After the manganese
oxidation, the biomineralized MnO2 becomes a cathodic reactant, which is reduced
through MnOOH to Mn2+. The reduction reaction increases the corrosion rates
(Olesen et al., 2000).
(b) Sulfur/Sulfide Oxidizing Bacteria (SOB)
Acidophilic SOB, such as Thiobacillus spp., are a group of aerobic and

Chapter 1 Introduction
12
chemolithotrophic autotrophs, and obtain energy for carbon dioxide by many
reactions involving the oxidization of sulphur, hydrogen sulfide, or other reduced
sulphur compounds to sulfuric acid (Prescott et al. 1990). The corrosion action of
SOB is generally accomplished by severe acidification of the local environment, as
well as the formation of aggressive microbial consortia with SRB, with which the
sulphur cycle takes place (Postgate, 1996).
(c) Acid producing bacteria (APB)
APB produce copious quantities of inorganic and organic acids as by-products
of cell metabolism, with acetic, formic, and lactic acids being the common
by-products. Little et al. (1992) reported that acids synthesized in the Krebs Cycle by
most aerobic microorganisms can contribute to biocorrosion. These ionized acidic
groups may be very important in corrosion when the pH of the biofilm is very low.
Pseudomonas sp. is a typical APB that causes biocorrosion. It can cause the
acidifications of the systems, provide nutrients for anaerobic organisms, and a
differential aeration environment. It was reported that Pseudomonas sp. produced
carboxylic acid groups of matrix polysaccharides such as alginic acid (Jang et al.
1989), which was highly concentrated at the metal-biofilm interface. The
concentration of the low molecular weigh acids to a high level would be very
aggressive to metal when the pH of biofilm is low.
(d) Slime-producing bacteria (SPB)
Microorganisms which produce extracellular polymeric substance (EPS) during
the growth of biofilm, were reported to associate with localized corrosion of stainless

Chapter 1 Introduction
13
steel (Pope et al. 1984). The SPB involved in biocorrosion include Clostridium spp.,
Flavobacterium spp., Bacillus spp., Desulfovibrio spp., Desulfotomaculum spp., and
Pseudomonas spp.
The mechanism of SPB in biocorrosion is still not clear. It has been reported that
the biofilm contain linear or cross-linked acidic or non-ionic polysaccharides,
oligopeptides, mannose, and galactose. Corrosion products of copper complexes are
found to be rich with pyruvate, acetate, and histidine (Paradies et al. 1992). Fischer et
al. (1988) suggested a mechanism of copper corrosion by SPB; chloride ion
sequestration into pits forms a complex ion of [Cu2Cl2]2- in the biofilm which
promotes the ionization of metallic copper.
Although the bacteria mentioned above causes corrosion of metals via different
mechanisms, biocorrosion may be more severe in mixed culture consortia. Bacteria in
natural systems seldom, if ever, occur as a pure culture. As a consortia, bacteria as
members of a biofilm benefit in various ways. They have enhanced access to nutrients,
and are close to cells with which they are in synergistic relationship and are protected
to a high degree from various antimicrobial mechanisms, including biocide,
antibiotics, and predators. Furthermore, the synergistic relationship between aerobic
and anaerobic bacteria also enhances the corrosion. The aerobic bacteria would not
only consume the oxygen and produce an ideal environment for the growth of
anaerobic bacteria, but also produce metabolic products which may become the
substrates or energy sources for the other bacteria. This mutualism relationship among
bacteria makes a perfect environment for the bacterial growth, and an active role in

Chapter 1 Introduction
14
the metal corrosion. Clearly, such a synergistic relationship renders the biocorrosion
mechanism more complex.
However, the role of SRB in biocorrosion is still poorly understood. Although
the mechanism that SRB directly react with metal has been proposed, and evidence of
SRB growth with metal as the only electron donor has been observed, no clear
evidence that implicates SRB in metal corrosion was given. Moreover, most
researchers concentrate on the biocorrosion effect, with few studies paying attention
to the biofilm formation of these bacteria to metals, especially for local SRB.
1.4 Methods for the Inhibition of Biofilm and Biocorrosion
Corrosion involves the movement of metal ions into the solution at an active
area (anode), the passage of electrons from the metal to an electron acceptor at a less
active area (cathode), and an ionic current in the solution and an electronic current in
the metal (Sanyal, 1981). Corrosion can be controlled by suitable modifications of the
environment which in turn retard or completely stop the anodic or cathodic reactions
or both. This can be achieved by the use of coatings or inhibitors.
1.4.1 Layer-by-layer (LBL) Polyelectrolyte Multilayer Coating
Developing multilayer coatings using molecule deposition is a simple and
powerful surface treating strategy that has been widely employed by researchers for
over 60 years. The earliest technique for consecutively deposited single molecule
layers, so-called Langmuir-Blodgett (Blodgett, 1934; Blodgett and Langmuir, 1937)
technique, was developed by forming monolayers on water surface and then
transferred onto a solid support. Later, Kuhn et al. (1971) used the Langmuir-Blodgett

Chapter 1 Introduction
15
technique to synthesis nanoscale heterostructure of organic molecule films. The
common interactions used to form the multilayer films include ligand-receptor,
covalent bonding, and coordination linkage. However, these approaches have critical
limitations because the multilayer films are restricted to the surface topology of the
substrate and the stability of the film. Moreover, another weakness is that high quality
multilayer films cannot be obtained reliably, and only limited classes of organics
could be applied. These techniques are restricted because the multilayers are highly
steric demanding due to long range forces between molecules. Subsequently in the
1980s, some researchers began to use alternatives to Langmuir-Blodgett technique in
multilayer systems. However, the major disadvantage of these processes was the
relatively low yield.
Recently, Decher (1997) developed a new, convenient, and versatile technique
for the LBL deposition by alternative adsorption of oppositely charged polyeletrolytes.
This simple methodology is based on two basic principles — electrostatic attraction
and adsorption, which are of prime importance to the successful building of
multilayer systems. During the assembly process, a polyelectrolyte with a large
number of charged or chargeable groups dissolved in polar solvents is firstly adsorbed
onto a suitable substrate. The anionic and cationic polymers are then alternately
supplied by adsorbing on the top of the previously adsorbed layer. Cyclic repetition of
the adsorption of anion and cation leads to the formation of the polyelectrolyte
multilayers. The electrostatic attraction between oppositely charged molecules is a
good driving force for building of the polyelectrolyte multilayers, because it has the

Chapter 1 Introduction
16
least steric demand of all chemical bonds. In addition, it has been shown that all kinds
of strongly charged molecules can be combined into multilayers, and that this
technique can be used to obtain well defined layers with specific properties, e.g.
optical or electric properties (Decher, 1997). This study is useful because the
development of polyelectrolyte multilayers with such strong electrostatic attraction
has promising potential applications. Despite the successful development of the
polyelectrolyte multilayers, much remains to be investigated, especially on the aspect
of the stability of the polyelectrolyte multilayers in solutions.
Hoogeveen et al. (1996) examined the stability of polyelectrolyte multilayers,
and showed that the main variables that determine the stability of the polyelectrolyte
multilayers are the polymer charge and the ionic strength. Very stable multilayers are
formed when both polymers are highly charged, and the ionic strength is low. The
stability of strong charged polyelectrolytes is not influenced by the substrate,
environment pH, and the ionic strength of the solution. The study also paved the way
for the further research on the polyelectrolyte multilayers.
In recent years, polyelectrolyte multilayers, with poly(acrylic acid)
(PAA)/quaternized polyethylenimine (q-PEI) - silver complex was used as a coating
to control biofilm growth on glass (Dai and Bruening, 2002). These silver
nanoparticles-containing films have been shown to have catalytic properties as well as
antibacterial effects. The PAA/q-PEI multilayers were also applied as a coating on
stainless steel (Shi, et al., 2006). X-ray photoelectron spectroscopy (XPS) and contact
angle measurement have shown that the PAA/q-PEI multilayers can be successfully

Chapter 1 Introduction
17
built-up on stainless steel surface. Moreover, the functionalized films on the stainless
steel inhibited the growth of Escherichia coli, a gram-negative bacterium, and
Staphylococcus aureus, a gram-positive bacterium, on the surface. It was suggested
that the PAA/q-PEI multilayer is an attractive coating for imparting antibacterial
properties to stainless steel and thus shows potential for biomedical and
environmental applications.
From the brief review given, it is evident that polyelectrolyte multilayer is a
promising coating and can be stably developed. However, this LBL technique is
usually limited to biomedical application. One potential area for application is the
control of marine biocorrosion of metal alloys. However, the application of
polyelectrolyte multilayers (i.e. PAA/q-PEI multilayers) is limited. Particularly when
they are exposed to the seawater, its stability in such high ionic strength environment
and its antibacterial property to the marine microbiological species remain unknown.
1.4.2 Organic Inhibitors
Corrosion inhibitors are substances which decrease or prevent the reactions of
the metals in the corrosive media when added at low concentrations to the aqueous
media. Organic corrosion inhibitors are generally more environmentally friendly than
inorganic ones. Heterocyclic compounds, a class of organic inhibitor, are widely used
for preventing corrosion of different metallic materials, such as mild steel, carbon
steel, and copper. The heterocyclic inhibitors adsorb on metal surfaces through
heteroatoms such as nitrogen, oxygen, sulfur, phosphorus, multiple bonds or through
aromatic rings, and block the active sites on the metal surface in order to decrease the
Chapter 1 Introduction
18
corrosion rate (Agrwal and Namboodhiri, 1992). The effectiveness of heterocyclic
molecules as corrosion inhibitor is based on their chelating action and the formation
of an insoluble physical diffusion barrier on the electrode surface, thus preventing
metal reaction and dissolution (Popova and Yates, 1997). The corrosion inhibiting
properties of these compounds are empirically attributed to their molecular structure.
Moreover, the planarity of the molecules (π-bonds) and the delocalized electron pair
present on the heteroatoms, are the salient structural features that determine the
adsorption of these molecules onto metal surfaces (Quraishi and Sharma, 2002).
Evans (1975) has discussed the influence of substitution on the protective effect
of heterocyclic compounds. Many inhibitors contain S or N atoms in the heterocyclic
ring. It is believed that the inhibiting molecules are attached to the metal through the S
or N atoms by changing the electron density in the metal at the point of attachment.
This results in the retardation of cathodic or anodic reaction since electrons are
consumed at the cathode and furnished at the anode.
Nitrogen-containing heterocyclic substances, such as azole-type compounds
have been reported to be effective corrosion inhibitors (Bentiss et al., 2004; Azhar et
al., 2001; Zhang et al., 2004; Tan et al., 2004; Morales-Gil et al., 2004). The diffusion
barrier is readily formed by nitrogen-containing heterocyclic molecules due to the
strong π–interaction between the aromatic rings. The effectiveness of numerous
organic azole-type compounds (e.g., 2-mercapto-benzimidazole (MBI), imidazole
(IMD), benzimidazole (BIA), and pyrazole) has been reported (Zhang et al., 2004;
Tan et al., 2004; Morales-Gil et al. 2004; Geler and Azambuja, 2000).

Chapter 1 Introduction
19
To control MIC, the traditional strategy is the application of biocides to kill the
microorganisms in the aqueous environment. However, it is now recognized that the
effectiveness of biocides is much lower when bacteria are incorporated into a biofilm
than when they are suspended. The exopolymeric matrix constitutes a diffusion
barrier that hinders biocide penetration into the biofilm (Boulangé and Petermann,
1996; O’Toole et al, 2000; Boyd and Chakrabarty, 1995; Allison, 2003). Indeed,
recent research has shown that MIC control is more successfully accomplished using
a corrosion inhibitor (Batista et al., 2000; Ramesh and Raheswari, 2005).
2-mercapto-benzimidazole (MBI) has to been shown to possess good inhibition
characteristics against steel and copper corrosion (Zhang et al., 2004; Morales-Gil et
al., 2004). Substituent groups which enhance the electron-donating or
electron-withdrawing properties of the active nitrogen atom on the heterocyclic ring,
would strengthen or weaken the interaction with the metal surface (Tan et al., 2006).
It has been shown that the presence of the mercapto group in
2-mercapto-benzimidazole enhanced corrosion inhibition, as compared to
benzimidazole. Thus the inhibition mechanism is likely to be related to the substituent
group in benzimidazole (Morales-Gil et al., 2004). In the present study, a new organic
compound, 2-Methyl-benzimidazole (MBI), which substitutes the mercapto group in
2-mercapto-benzimidazole with an electron-donating methyl group (Figure 1.1), was
investigated for its inhibitive effect on both abiotic corrosion and MIC induced by two
strains of SRB.
Chapter 1 Introduction
20
Figure 1.1 Structure of 2-Methyl-benzimidazole (MBI)
As can be concluded from above, substantial research had been done on the
biocorrosion of metals induced by SRB, but, understanding of the biocorrosion
mechanisms is far from complete, and in particular, there is considerable margin in
the study of SRB biofilm interactions with metals in the seawater. Although the
concept that SRB can directly react with metal was proposed and the fact that SRB
can grow with iron as the only electron donor was observed, no evidence has been
given that metal corrosion is directly related to SRB. Moreover, most studies focus on
the biocorrosion effect, paying little regard to the process of bacterial biofilm
formation (especially SRB) onto metal surfaces. Although the usual technique to
control biocorrosion is the application of biocides, the efficiency of the biocides is
dramatically reduced by the diffusion resistance in the biofilm. The newly developed
layer-by-layer coating, which is stable in solutions and effective for bacteria inhibition,
has never been tested for the control of biocorrosion. Thus a test of the new
layer-by-layer coating is desirable to reveal the biocide and anti-biocorrosion
efficiency of the coating.
Chapter 1 Introduction
21
1.5 Objectives and Scope of This Work
The aims of this thesis are to examine the role of microorganisms in biofilm
formation and its induced corrosion of metals, and to investigate in depth the impact
of biofilm formation and the mechanisms of biocorrosion (in particular modeling the
metal/biofilm/bulk fluid interface. The specific objectives of are:
i. To isolate and identify a strain of SRB from local seawater, and
characterize the morphological, physiological, and phylogenetic
properties.
ii. To investigate the driving force of the initial biofilm formation on metals
in seawater. The interactions of different metal-bacterial cells are to be
examined. The influence of environmental parameters, i.e. ion strength, pH,
and the presence of nutrient, on the metal-bacteria interaction will be
investigated. The cell-cell interaction is also studied to shed light on the
biofilm maturation.
iii. To investigate the corrosion behavior of SRB on SS316 using atomic force
microscopy (AFM) to observe the biofilm and pits formation on the metal
surface, and coupled with electrochemical impedance spectroscopy (EIS)
to measure the corrosion resistance of SS316.
iv. To build equivalent circuit models to simulate the metal/biofilm/bulk fluid
interface for better understanding of the corrosion mechanisms.
v. To apply a layer-by-layer coating on the SS316. The effect of the coating
on the decrease in biofilm roughness and biocorrosion current will be

Chapter 1 Introduction
22
examined. The biocidal effect of the coating on the bacteria will also be
evaluated.
vi. To apply an organic corrosion inhibitor to control the biocorrosion induced
by SRB. The effect of inhibitor on the biocorrosion control will be
investigated by examining both the reduction of biofilm formation and
corrosion current.
Since SRB are key microorganisms in anaerobic corrosion of iron and steel, two
strains of SRB (i.e. Desulfovibrio desulfuricans and D. singaporenus, a local marine
strain) are selected in this research. Besides these two SRB, an aerobic bacterium
(Pseudomonas sp.) is also used in the biofilm study. The biocorrosion experiments
will be focused on SS316, which is widely used in the industrial equipment, such as
heat exchangers, reactors, distillation columns, storage tanks, pipes, valves etc.
This work would provide further insight into the metal-cell interaction during
the biofilm formation process. The influence of the environmental conditions such as
pH, ionic strength of solution, the presence of nutrients, as well as the bacteria and
metal surface properties (i.e. the surface charges and wettability) will be examined,
and it would be helpful to understand the initial bacteria-metal interaction forces in
Nano-Newton range which are crucial for the biofilm formation. Furthermore, the
possible corrosion mechanisms of local SRB will be proposed. The modeling of the
metal/biofilm/solution interface using the electrochemical impedance spectroscopy
would provide a better understanding of the relationship between SRB and the metal
corrosion. In addition, the use of layer-by-layer coating and organic inhibitors for

Chapter 1 Introduction
23
controlling biofilm and biocorrosion would be evaluated for potential application in
biocorrosion prevention techniques.
In the next chapter, detailed information on the culture of microorganisms and
experimental procedure on the biofilm study and biocorrosion quantification test will
be presented.

Chapter 2 Materials and Methods
24
CHAPTER 2 MATERIALS AND METHODS
2.1 Metal Coupons
Four types of metal coupons widely used in industry are selected: stainless steel
AISI 316, mild steel, aluminum 1100, and copper (purity > 99.9%). Metal coupons of
diameter 12 mm were polished using a Kemet 320 manual polishing machine, and
liquid diamond of the size 6 µm, 3 µm and 0.5 µm successively on a polishing cloth
purchased from Kemet International Ltd. The polished coupons were subsequently
cleaned with a 70% ethanol solution and dried under N2 flow before use. The stainless
steel AISI 316 (SS316) is composed of C (0.08% max), Mn (2% max), Si (1% max),
P (0.045% max), S (0.03% max), Ni (10-14%), Cr (16-18%), and Mo (2-3%). Mild
steel is composed of C (0.16%), Si (0.37%), Mn (1.24%), P (0.027%), S (0.026%), Cu
(0.19%), N (0.007%), Al (0.02%), and Fe (97.96%).
2.2 Microorganisms
The sulphate–reducing bacterium (SRB) used in this study, Desulfovibrio
desulfuricans ATCC 27774 (Desulfovibrio desulfuricans subsp. desulfuricans), was
obtained from the American Type Culture Collection (ATCC), USA. The bacterium
was cultured at 37 oC under anaerobic conditions in an anaerobic chamber (model
MASC MG500 from Chokim Scientific Pte Ltd, containing 10% H2, 10% CO2, and
80% N2) in Modified Baar’s medium (g/L): MgSO4 2.0; Sodium citrate 5.0; CaSO4
1.0; NH4Cl 1.0; K2HPO4 0.5; Sodium lactate 3.5; Yeast extract 1.0; Fe(NH4)2(SO4)2

Chapter 2 Materials and Methods
25
1.0.
In order to investigate microbiologically influenced corrosion (MIC) of SS316
in a marine environment, an SRB strain was picked up from the biofilm which has
developed on a SS316 coupon immersed in seawater near St. John’s Island, Singapore
for 25 days. The microbes were cultured anaerobically (10% hydrogen, 10% carbon
dioxide and 80% nitrogen) at 37 oC. The isolation was first carried out in marine
Postgate medium B, and then purified on solid marine Postgate medium E (Postgate,
1984). The purity of the isolate was examined for both aerobic and anaerobic
contaminants on spread plates with solid nutrient agar following the procedure of
Postgate (1984). Cells were regularly transferred to a fresh medium to maintain
viability.
Pseudomonas sp. NCIMB 2021 (from NCIMB UK), a marine Gram-negative
bacterium, was cultured aerobically at 27 oC in Marine Broth 2216 (g/l): peptone 5.0;
yeast extract 1.0; ferric citrate 0.1; sodium chloride 19.45; magnesium chloride 5.9;
sodium sulphate 3.24; calcium chloride 1.8; potassium chloride 0.55; sodium
bicarbonate 0.16; potassium bromide 0.08; strontium chloride 0.034; boric acid 0.022;
sodium silicate 0.004; sodium fluoride 0.0024; ammonium nitrate 0.0016; and
di-sodium phosphate 0.008.
2.3 Isolation and Identification of Strain SJI1
2.3.1 Morphological Characterization
An Olympus light microscope (Model CX40RF200, Olympus optical Co LTD,

Chapter 2 Materials and Methods
26
Japan) was employed to visualize the cell shape and motility, and to determine the cell
membrane nature after the Gram reaction.
A 14-day-old biofilm attached to SS316 in EASW was visualized by utilizing a
scanning electron microscopy (SEM) (Jeol JSM-5600 with the beam voltage at 15kV)
to study the cell morphology. The samples were prepared using the following
procedure: cells were fixed with 3% glutaraldehyde in a phosphate buffer solution
(PBS, pH 7.3-7.4) for more than 4 hours, then washed with PBS for two changes (5
minutes each), rinsed with distilled water for two changes (5 minutes each),
dehydrated with 20%, 50%, 75%, 95% and 100% ethanol for 10 minutes, respectively,
and finally stored in a desiccator.
In order to study the presence of cell surface appendages, atomic force
microscopy (AFM) was employed. A stainless steel coupon attached with the biofilm
was washed with sterile distilled water, and dried in a desiccator over night. A
Nanoscope III AFM (Digital Instruments) in the tapping mode was used to image the
biofilm. Nanoprobe silicon nitride (Si3N4) cantilevers with a spring constant of k=0.06
N/m were obtained from Digital Instruments (Veeco Instruments Inc.).
2.3.2 Physiological Studies
The isolate was cultivated in marine Postgate medium B, except that the sodium
lactate was replaced with acetate, pyruvate, propionate, hydrogen, methanol, ethanol,
butanol, propanol, glycerol, succinate, malate, formate, fructose, glucose, arginine, or
cysteine as an electron donor at a concentration of 20 mM, respectively. Blackening
of the media in three successive subcultures was considered a positive indication of an

Chapter 2 Materials and Methods
27
electron donor (Feio et al., 1998). The occurrence of fermentation was tested using the
above chemicals without adding electron acceptors (Tardy-Jacquenod et al., 1996;
Ouattara et al., 1999). Sulphate (10 mM), sulfite (10 mM), thiosulfate (10 mM),
elemental sulfur (2% w/v), and nitrate (10 mM) were tested as terminal electron
acceptors. The concentration of electron donors after incubation for two weeks were
measured by an Agilent 1100 high performance liquid chromatography (HPLC) with
HPLC organic acid analysis column (Aminex HPX-87H ion exclusion column) and a
UV detector (at the wavelength of 210 nm). The sulphate concentration is determined
by adding Sulfa Ver 4 reagent Powder in the liquid sample and measuring UV
absorbance at 450 nm.
The disproportionation of thiosulfate, sulfite, and elemental sulfur was tested by
using a basal synthetic medium that lacked sulphate and organic energy sources. The
basal medium was supplemented with either thiosulfate, sulfite, or elemental sulfur as
the energy source. After incubation, the disproportionation was tested by detecting the
production of sulfide and sulphate using a UV spectrophotometer (Model UV-1601,
UV-Visible spectrophotometer, Shimadzu) to measure the optical density (OD)
(Magot et al., 1992).
The growth conditions relating to the temperature, pH, and salinity that
facilitated the growth of the isolate were determined using marine Postgate medium C
(Postgate, 1984). The concentration of bacteria was measured by optical density at
600 nm using a UV spectrophotometer.
For desulfoviridin determination, cells were cultivated in the medium

Chapter 2 Materials and Methods
28
containing sulphate as the electron acceptor. During the late exponential growth, cells
were harvested, washed, and suspended in PBS. One drop of 2 M NaOH was added
and the suspension was immediately inspected under ultraviolet light at 365 nm
(Postgate, 1959). A red fluorescence due to the release of the chromophore of the
pigment desulfoviridin was evidence for its presence in Desulfovibrio (Postgate,
1959). Desulfovibrio desulfuricans ATCC 27774 was used as a positive control in the
desulfoviridin test.
2.3.3 16S rRNA Sequence Analysis
Genomic DNA was extracted and purified by using DNeasy Tissue kit (Qiagen).
16S rRNA genes were amplified by using universal primers: 8F
(5’-AGAGTTTGATCCTGGCTCAG-3’) (He et al., 2003) and 1525R
(5’-AAGGAGGTGATCCAGCCGCA-3’) (Beller et al., 1996), following the
polymerase chain reaction (PCR) conditions: 70 s at 94 oC, 30 cycles of 30 s at 94 oC,
45 s at 55 oC and 70 s at 72 oC, and a final extension step of 6 min at 72 oC. The PCR
products were purified by using a QIAqucik PCR purification kit (Qiagen). The
purified PCR fragments were checked by performing electrophoresis using an Agilent
2100 Bioanalyzer, and were amplified with primers 8F, 533F, 1114F and 1392R for
sequence analysis by using a CEQTM 8000 Genetic Analysis System. Sequence was
aligned using the sequence alignment editor BioEdit. Sequence alignment was
verified manually with reference sequences of various members of the genus
Desulfovibrio from a Genbank database (Alazard et al., 2003).
2.3.4 Phylogenetic Analysis

Chapter 2 Materials and Methods
29
The aligned sequence was used to perform phylogenetic analysis using the
PHYLIP 3.6 package. The phylogenetic tree was generated using DNADIST and a
neighbor-joining option of NEIGHBOR formed from a part of the PHYLIP package
(Felsenstein, 2006) based on the 16S rRNA gene sequence of the marine isolate and
reference sequences. Bootstrap samples (100) were generated using SEQBOOT. The
program CONSENSE from the PHYLIP program package was used to determine the
number of times of each group in the final tree, which was monophyletic in the
bootstrap analysis.
2.3.5 Nucleotide Sequence Accession Number
The nucleotide sequence of the 16S rRNA gene of strain SJI1 has been
deposited in the Genbank database on 16th April, 2007 under accession number
EF178280.
2.4 Biofilm Formation
2.4.1 Cell Immobilization
A silicon nitride tip (purchased from Veeco Asia Pte Ltd) was immersed in a
drop of 1% poly(ethyleneimine) (PEI) solution for 2.5 hours. Excess solution was
decanted and the tips were rinsed in deionized water and stored at 4 oC, following the
procedure of Razatos et al. (1998).
The bacterial cells were harvested in the mid-exponential phase (108 cells/ml) by
centrifugation at 8,000 xg for 15 minutes. They were washed in a phosphate buffer
solution (PBS, pH 7.2) and then resuspended in a 3% vol/vol glutaraldehyde solution

Chapter 2 Materials and Methods
30
for 2 hours at 4 oC. After fixing with glutaraldehyde, the cells were rinsed and
resuspended in PBS. The cell suspension was incubated at 4 oC overnight.
To immobilize the bacteria onto the cantilevers, a pellet of cells was manually
transferred onto PEI-coated tips under a Leica micromanipulator. The pellet was
further treated with an additional drop of 3% glutaraldehyde and the tips were
incubated at 4 oC for 1-2 hours. The cantilevers were then rinsed in deionized water
and air dried (Razatos et al., 2000). Scanning electron microscope (SEM) analyses
were performed on all tips coated with the bacteria after the AFM measurement.
2.4.2 Zeta Potential (ζ) and Contact Angle Measurements
Zeta potential was measured for cells that were harvested in the mid-exponential
phase. Cells were washed and resuspended in artificial seawater. The Zeta potential of
the cells was measured using a Zeta plus Zeta Potential Analyzer (Brookhaven
Instruments Corporation, USA). Zeta potential of the metals was measured using an
Electro Kinetic Analyzer with the software Anton Paar Visiolab for EKA version
1.03.
Contact angles of the metals were measured using distilled deionized water with
a telescopic goniometer (Model 100-00-(230), Rame-Hart, Inc., USA).
The bacterial cell lawn was prepared by filtering cells onto porous membranes
(PTFE, Sartorius) with a pore size of 0.45 μm. The bacterial cells were compacted to
a homogeneous lawn by a vacuum pump. The contact angles of the bacterial cell lawn
were measured after exposing the cell lawn in air at room temperature for about 10
minutes to evaporate excess water from the lawn.

Chapter 2 Materials and Methods
31
2.4.3 Confocal Laser Scanning Microscopy (CLSM)
The distribution and viability of bacteria adsorbed on the metal surface was
investigated by staining with a combination dye (LIVE/DEAD Baclight bacteria
viability kits, Molecular Probes, L13152). After immersion in the 108 cells/ml
bacterial suspension at 27 oC for 1 day, the metal coupons were rinsed with sterile
deionized water and stained using 50 µl of the combination dye and subsequently
analyzed with an Olympus FluoView FV500 Confocal Laser Scanning Microscope
(CLSM), using the software Olympus Fluoview Ver.1.3 viewer. The dye consists of
propidium iodide (PI) and SYTO 9, which diffuse into the cells and fluoresce upon
binding to the nucleic acids. SYTO 9 is membrane-permeable and therefore stains
both viable and non-viable bacteria (i.e. green fluorescence), while PI has a higher
affinity for nucleic acids (i.e. red fluorescence), but is excluded from viable cells by
membrane pumps. Thus, viable cells appear green under the light microscope, while
nonviable or membrane-compromised cells appear red.
2.4.4 AFM Operation of Force Measurement
A Nanoscope III AFM (Digital Instruments) in contact mode was used to
measure the interaction forces. Nanoprobe silicon nitride (Si3N4) cantilevers (model
NP-S20) for fluid AFM were purchased from Digital Instruments (Veeco Instruments
Inc.). Experiments were conducted in a fluid cell filled with artificial seawater (with
the components (g/l): NaCl 23.476; Na2SO4 3.917; NaHCO3 0.192; KCl 0.664;
H3BO3 0.026; MgCl2·6H2O 10.610; SrCl2·6H2O 0.04; CaCl2 1.109). Force
measurements were carried out by engaging AFM with the scan rate of 0.996 Hz and
Chapter 2 Materials and Methods
32
scan size of 0 nm (i.e. a point measurement) to avoid the lateral force and to minimize
any damage to the cell probe, and only vertical displacement is performed. For the
force measurement, two parallel cell probes were used for each measurement. Force
measurements were taken after each cell probe was immersed in a solution for at least
5 minutes. Ten force measurements were made at each location, three locations were
selected for the force measurement on each metal, and an average value was taken.
Force curves (tip deflection (nm) versus piezo position (nm)) were obtained after the
force measurement. The zero force was chosen where the deflection was independent
of the piezo position. Tip deflection data were converted to force (in nano-Newtons)
by multiplying by the spring constant of the cantilevers according to Hooke’s
Law: spF k d= , where d is the cantilever deflection and spk is the cantilever spring
constant. The manufacturer’s value for the spring constant of the cantilever is 0.12
nN/nm. The spring constant of the cell probe is calibrated using the method of
Burnham et al. (2003). The calibrated spring constant is 0.12 ± 0.02 nN/nm for all the
cell tips. Each force curve is calculated from the calibrated spring constant of the
coated tip that is used for the force measurement. The representative force curves
were plotted together by aligning the zero deflection and constant compliance
portions of the curves (Razatos et al., 1998).
2.5 Biofilm and Biocorrosion of Stainless Steel AISI 316 and Its Prevention
2.5.1 Biofilm and Biocorrosion Experiment Setup
For the biofilm and biocorrosion study, D. desulfuricans were first cultured in

Chapter 2 Materials and Methods
33
the modified Baar’s medium and the marine isolate D. singaporenus was incubated in
the marine Postgate medium B in a batch culture under an N2 atmosphere at 37 oC for
two days. 10 ml of each of the culture were subsequently transferred into individual
500 ml of sterilized EASW (EASW) medium (g/L): NaCl 23.476; Na2SO4 3.917;
NaHCO3 0.192; KCl 0.664; KBr 0.096; H3BO3 0.026; MgCl2.6H2O 10.610;
SrCl2.6H2O 0.040; CaCl2.2H2O 1.469; Sodium lactate 3.5; Yeast extract 1; Tri-sodium
citrate 0.5; MgSO4.H2O 0.4; CaSO4 0.1; NH4Cl 0.1; K2HPO4 0.05; Fe(NH4)2 (SO4)2
0.1. After two days incubation, polished stainless steel AISI 316 coupons were hung
in the medium with the bacteria in a Duran bottle (500 ml) for the biocorrosion
experiments. This operation was carried out in the anaerobic chamber, and maintained
with an atmosphere containing 10% H2, 10% CO2, and 80% N2.
To test the inhibitor efficiency, MBI at a concentration of 0.1 to 2.5 mM was
added to the EASW with active SRB.
2.5.2 Scanning Electron Microscopy (SEM)
In the SEM study, the biofilm attached on SS316 in EASW was visualized after
preparation using the following procedure. Samples were fixed with 3%
glutaraldehyde in a phosphate buffer solution (PBS, pH 7.3-7.4) for more than four
hours, and then washed with PBS for two changes (5 minutes each), rinsed with
distilled water for another two changes (again, 5 minutes each), and dehydrated with
using an ethanol gradient (at 50%, 75%, 95% and 99% for 10 minutes) before being
finally stored in a desiccator. A scanning electron microscope (Jeol JSM-5600) with
the beam voltage at 15 kV was used to visualize the morphology of biofilm.

Chapter 2 Materials and Methods
34
2.5.3 Atomic Force Microscopy (AFM)
The stainless steel AISI 316 coupons on the 4th, 14th, 24th, 34th, and 44th days of
immersion were collected from the medium for AFM analysis. In order to obtain
biofilm images, the coupons were lightly rinsed in sterile distilled water, and then
dried in the air. To reveal the extent of biocorrosion, the biofilm on the coupons was
removed by immersing the coupons in an ultrasonic bath for 5 minutes followed by
HNO3 solution (1 volume of 67% HNO3 + 3 volume of distilled water) for 2-5
minutes. The surfaces of the exposed coupons were finally rinsed with distilled water,
cleaned in 100% ethanol, and dried under an N2 flow (Xu et al., 2002).
A Nanoscope III AFM (Digital Instruments, Santa Barbara, CA, USA) in contact
mode was used to image the biofilm. Nanoprobe silicon nitride (Si3N4) cantilevers
with a spring constant of k=0.06 N/m were obtained from Digital Instruments.
2.5.4 Electrochemical Impedance Spectroscopy (EIS)
EIS was used to investigate the electrochemical properties of the corroded
surface after immersion in an EASW with D. desulfuricans and D. singaporenus over
time. All experiments were performed in a three-electrode electrochemical cell, with a
platinum electrode used as the counter electrode, and an Ag/AgCl electrode as the
reference electrode. The EIS measurements (using duplicates coupons) were made
ex-situ; the coupons collected from the EASW were served as the working electrode
by embedding it in a sample holder of the corrosion cell, which was purchased from
Metrohm Pte Ltd. The working electrode had a working surface area of 0.785 cm2.
An aliquot of 500 ml of the media was transferred into the magnetically stirred

Chapter 2 Materials and Methods
35
electrochemical cell to serve as the electrolyte for EIS analysis. The test and analysis
were operated using the Autolab Version 4.9 (Metrohm) software. The frequency
range was 5 mHz – 100 kHz and the amplitude of the sinusoidal voltage signal was 10
mV for the EIS measurement. The EIS results obtained were modeled and simulated
using the EQUVRT software (Boukamp, 1986).
2.5.5 X-ray Photoelectron Spectroscopy (XPS)
The nature of the surface film was examined using a commercial X-ray
photoelectron spectroscopy (XPS) system (Kratos Axis 165). The excitation source
was Al Kα radiation (photoelectron energy=1486.71 eV). Binding energies for
components of interest were referenced to the binding energy of C 1s at 284.6 eV.
2.6 Preparation of Layer-By-Layer (LBL) Coating
2.6.1 Polyelectrolyte Solutions
Polyethylenimine (PEI) (Mw 750,000), poly(acrylic acid) (PAA) (Mw 250,000)
and hexylbromide were obtained from Aldrich Chemical Company. Quaternized
polyethylenimine (q-PEI) was derived in accordance with the method reported in
literature (Thomas and Klibanov, 2002) (Figure 2.1). The PEI (50% aqueous
solution) was firstly lyophilized. Then 1 g of PEI was mixed with hexylbromide (in
excess, 10 ml) in 20 ml of dry isopropanol and was heated at 70o for 4 hours. After the
mixture was cooled, 928 g of NaOH was added and was heated again at 70o for 72
hours. The solvent (dry isopropanol) and unreacted hexylbromide was removed via
evaporation under reduced pressure. The residue was dissolved in ultra pure water and

Chapter 2 Materials and Methods
36
was dialyzed using a dialysis membrane (Spectra/Por, Spectrum, Molecular Weight
Cut Off (MWCO) at 10,000) for 4 days. The ultra pure water was replaced daily.
Finally, the product was diluted to 500ml using ultra pure water. The final product
concentration was approximately 2 mg/ml.
The PAA obtained from the supplier was diluted to 2 mg/ ml.
Figure 2.1 Derivatization of q-PEI
2.6.2 Layer-by-layer (LBL) Technique
The polyelectrolyte multilayers (PEM) were built up by sequentially dipping the
metal substrate in q-PEI and PAA solutions, and allowing alternate layers to form due
to attraction by electrostatic forces.
Polyelectrolyte multi-layers (PEM) were built on the bare substrates via a dip
technique at room temperature. The pH of the q-PEI was first adjusted to 7.0 with 0.1
M HNO3. The substrates were first dipped into an aqueous solution of PEI for 15
minutes, rinsed with ultra pure water for 1 minute and blown dry with nitrogen gas.
After the deposition of the first PEI layer, cyclic repetition of the following 2 steps
would build the PEM (Figure 2.2):
(1) Dip the substrates into the aqueous solution of PAA for 15 minutes, rinse with
ultra pure water for 1 minute before drying with nitrogen.
(2) Dip the substrates into the aqueous solution of q-PEI for 15 minutes, rinse with

Chapter 2 Materials and Methods
37
ultra pure water for 1 minute before drying with nitrogen.
Hence, 5 bilayers of PAA/ q-PEI were built up. To ensure that the layers were
successfully deposited, contact angle measurements of several samples were taken for
every layer. The functionalized coupons underwent vacuum heating for 3 hours to
promote amide formation between PAA and q-PEI layers, i.e. cross linking.
Figure 2.2 Layer-by-layer (LBL) coating of q-PEI and PAA multilayer on polished SS316
2.6.3 Stability of the PEM on Functionalized SS316
Stability of PEM on functionalized SS316 substrates was conducted by
immersing the functionalized substrates in EASW for 6 hours. The characterization of
the functionalized surfaces after different periods of immersion was examined using
contact angle measurements. Contact angles of the multilayers were measured
using a telescopic goniometer (Rame-Hart, model 100-00 (230)) and a Gilmont
syringe with a flat-tipped needle. The goniometer had a magnification of x23 and was

Chapter 2 Materials and Methods
38
equipped with a protractor of 1o graduation. The measurements were taken at room
temperature (25 oC) and 60% humidity via the sessile drop method and 3 μL
deionized water droplets were used.

Chapter 3 Isolation, Characterization and Identification of A Marine Sulphate Reducing Bacteria
39
CHAPTER 3 ISOLATION, CHARACTERIZATION AND
IDENTIFICATION OF A MARINE SULPHATE REDUCING
BACTERIA
In this chapter, a sulphate reducing bacteria was isolated from local seawater,
characterized and identified. The cell morphology of the isolate was visualized using
AFM and SEM. Physiological properties of the isolate, such as the utilization of
electron donors and electron acceptors, its fermentation and disproportion ability, as
well as the pH, salinity and temperature ranges for the culture growth, were studied.
Finally, phylogenetic analysis of the isolate was investigated using 16S rRNA gene
sequence.
3.1 Cell Morphology
Strain SJI1, designated Desulfovibrio singaporenus, isolated from the seawater,
is an obligate anaerobe. Light microscope observations showed uniform cell
morphology of strain SJI1, which is a rod, is curved-shaped, and motile. The pink
color after Gram staining discloses that strain SJI1 is Gram-negative. SEM images
also reconfirmed that the bacterium is curved-shape, 1-2 µm long and with an average
width of 0.5 µm (Figure 3.1 a and b). A single polar flagellum (indicated by an arrow)
was observed using SEM and AFM phase images (Figure 3.1 a and c), revealing the
motility of the organism. Colonies cultured on the solid medium (i.e., marine Postgate

Chapter 3 Isolation, Characterization and Identification of A Marine Sulphate Reducing Bacteria
40
medium E on a Petri dish) were black and grew inwards the gel. Sporulation was not
observed.
Figure 3.1 Images of strain SJI1 on a SS316 coupon: (a) a single cell (x10,000); (b) cells growing on SS316 (x5,000); (c) an AFM phase image of an individual cell with a single polar flagellum (scale 4 μm × 4 μm).
3.2 Growth of Desulfovibrio singaporenus Strain SJI1 on Lactate and Acetate
The growth curve of strain SJI1 (Figure 3.2 a) in the marine Postgate medium B
was obtained using the most probable number (MPN) method (with lactate as the
electron donor and sulphate as the electron acceptor). The cell density (cells/ml) of
strain SJI1 in the medium reached seven orders of magnitude after culturing for 48
hours, and attained the highest value (100 times more compared to the initial
inoculum) at the 72nd hour. Sulphate was consumed rapidly and decreased from
(a) (b)
(c)

Chapter 3 Isolation, Characterization and Identification of A Marine Sulphate Reducing Bacteria
41
15.35 mM to 0.2 mM during the cultivation (Figure 3.2 a).
HPLC analysis of the lactate and acetate concentrations (Figure 3.2 b) during
the cultivation revealed that lactate was completely oxidized to acetate and CO2
(detected by gas chromatography) with pyruvate as the intermediate product. Lactate
was consumed quickly during the 18 and 39 hours of cultivation which indicates the
exponential growth of the isolate, and was completely converted to acetate after 88
hours cultivation. After 156 hours, sulphate was completely reduced, and 15 mM
Na2SO4 was added in the medium. It is noteworthy that acetate continued to be
oxidized as the electron donor with the consumption of sulphate as the electron
acceptor. Acetate was oxidized to carbon dioxide, and no hydrogen gas and methane
were detected. Continuous cultivation showed that the concentration of acetate
decreased slowly. Between 156 and 207 hours, acetate concentration decreased from
33.6 mM to 30.5 mM, and was accompanied by a slight decrease in sulphate and the
production of a small quantity of pyruvate. These results indicate that strain SJI1 was
able to couple the incomplete oxidation of acetate with the reduction of sulphate.
0 50 100 150 200 250 300 350
0
5
10
15
20
cell
dens
ity (c
ell/m
l)
sulp
hate
con
cent
ratio
n (m
M)
sulphate
time (hr)
cell density
15mM Na2SO
4 added
108
107
106
105
(a)

Chapter 3 Isolation, Characterization and Identification of A Marine Sulphate Reducing Bacteria
42
0 50 100 150 200 250 300 3500
5
10
15
20
25
30
35
40
15mM Na2SO4 added
Con
cent
ratio
n (m
M)
Time (hr)
lactate acetate pyruvate
Figure 3.2 (a) Time course of the growth of strain SJI1 showing increase in cell density (♦) and decrease in sulphate concentration (); (b) The consumption of lactate () and the production of acetate () and pyruvate () accompanying bacterial growth. Error bars indicate standard deviation, which are not shown when they are smaller than the symbol.
Lactate is oxidized by strain SJI1 to acetate via pyruvate during sulphate
reduction. Such intermediate production of pyruvate was also reported by Postgate
(Postgate, 1984). It is important to note that the oxidization of lactate to acetate by
strain SJI1 is complete. Most isolates belonging to the Desulfovibrio genus, such as
Desulfovibrio gabonesis (Tardy-Jacquenod et al., 1996), Desulfovibrio indonesis
(Feio et al., 1998), Desulfovibrio dechloracetivorans (Sun et al, 2000), Desulfovibrio
mexicanus (Hernandez-Eugenio et al., 2000), Desulfovibrio magneticus (Sakaguchi et
al., 2002), Desulfovibrio hydrothermalis (Alazard et al., 2003), Desulfovibrio
oxamicus (López-Cortés et al., 2006), and Desulfovibrio bizertensis (Haouari et al.,
2006), have been reported to show incomplete oxidization of lactate. To the best of
our knowledge, no SRB species with the ability to completely oxidize lactate to
acetate has been reported.
(b)
Chapter 3 Isolation, Characterization and Identification of A Marine Sulphate Reducing Bacteria
43
Interestingly, strain SJI1 is able to use acetate as the electron donor. Few
sulphate-reducing bacteria, such as Desulfotomaculum acetoxidans (Postgate, 1984),
Desulfuromonas acetoxidans (Postgate, 1984), Desulfuromonas sp. strain BB1
(Löffler et al., 2000), Desulfurmonas chloroethenica (Löffler et al., 2000), and
Desulfovibrio dechloracetivorans (Sun et al., 2000), have been reported to be able to
use acetate as an electron donor. However, Desulfotomaculum acetoxidans does not
use lactate and pyruvate, and cannot use the Postgate medium, while Desulfuromonas
acetoxidans only reduces elemental sulfur, but not sulphate or sulfite to sulfide with
the oxidization of acetate (Postgate, 1984). Desulfuromonas sp. strain BB1 and
Desulfurmonas chloroethenica can use acetate as the electron donor, but not hydrogen
(Löffler et al., 2000). Desulfovibrio dechloracetivorans is the only member of the
Desulfovibrio group that is capable of oxidizing acetate (Sun et al., 2000), however, it
oxidizes acetate with 2-chlorophenol as the sole electron acceptor. Acetate cannot be
oxidized by Desulfovibrio dechloracetivorans with any inorganic compounds (such as
sulphate) as electron acceptors (Sun et al., 2000). To our knowledge, strain SJI1 is the
first member of the Desulfovibrio group that is capable of oxidizing acetate with
sulphate as the electron acceptor.
Acetate supported the growth of strain SJI1 with sulphate as the respiratory
electron acceptor, producing CO2. The acetate consumed was proportional to the
amount of sulphate removed (with a ratio of 1:1). Based on the data an equation of
acetate oxidation for strain SJI1 is proposed as follow:
CH3COO- + SO42- H2O + CO2 + HCO3
- + S2-

Chapter 3 Isolation, Characterization and Identification of A Marine Sulphate Reducing Bacteria
44
It is noticed that a small quantity of pyruvate was detected during the acetate
oxidation, from which it is speculated that the acetate oxidation with sulphate may
proceed via the citric acid cycle with the synthesis of pyruvate from acetyl CoA and
CO2 as an anaplerotic reaction (Thauer, 1982).
Obviously, the ability of strain SJI1 to utilize acetate (which is an
environmentally common compound) and reduce sulphate makes it easy to survive in
the natural environment. The consumption of the atomic or cathodic hydrogen
accumulated at the cathode by a hydrogenase enzyme and the production of sulfide by
strain SJI1 lead to the depolarization of the cathode and the corrosion of stainless steel
facilities in seawater, suggesting the important roles this isolate plays in marine
biocorrosion. Understanding the mechanism of this isolate would be helpful to reduce
the adverse effects of biocorrosion and develop strategies to mitigate the corrosion
problem.
3.3 Physiological Properties
The ranges of temperature, pH, and salinity that facilitated the growth of strain
SJI1 were also determined. The cells density was determined by measuring the optical
density at 600 nm using a UV spectrophotometer. Strain SJI1 attained a concentration
of 107 cells/ml at a pH between 5 and 10. The growth was inhibited below pH 5, or
higher than pH 10, and the optimum pH at 7. Strain SJI1 grew well at a salinity
between 1% and 7.5%, with an optimum salinity of 2.5%, while both low and high
salinity (>7.5% or <1%) inhibited its growth. The temperature range for the bacterial

Chapter 3 Isolation, Characterization and Identification of A Marine Sulphate Reducing Bacteria
45
growth was narrow (i.e., 15 oC to 40 oC), and the highest culture density was achieved
at 37 oC. NaCl was required for its growth, indicating that strain SJI1 is a halophile,
resembling some other halophilic Desulfovibrio strains, such as Desulfovibrio
salexigens (Postgate and Campbell, 1966), Desulfovibrio halophilus (Caumette et al.,
1991), Desulfovibrio gabonesis (Tardy-Jacquenod et al., 1996), Desulfovibrio
profundus (Bale et al., 1997), Desulfovibrio oxyclinae (Krekeler et al., 1997),
Desulfovibrio senezii (Tsu et al., 1998), Desulfovibrio dechloracetivorans (Sun et al.,
2000), and Desulfovibrio bizertensis (Haouari et al., 2006). The salinity, temperature,
and pH ranges facilitating bacterial growth showed that strain SJI1 is typical of a
moderately halophilic, mesophilic sulphate-reducing bacterium.
Strain SJI1 is able to use a wide range of organic compounds as electron donors.
It can reduce sulphate to sulfide using acetate, lactate, propionate, hydrogen, methanol,
ethanol, butanol, propanol, glycerol, succinate, malate, formate, formate, fructose, and
cysteine as the electron donor source (Table 3.1). In addition to lactate, other electron
donors such as pyruvate, succinate, malate, or cysteine were completely oxidized to
acetate and carbon dioxide by strain SJI1 (Table 3.1), while acetate, propionate,
formate, methanol, ethanol, propanol, glycerol, fructose, or glucose was partially used
and sulphate was not fully reduced.

Chapter 3 Isolation, Characterization and Identification of A Marine Sulphate Reducing Bacteria
46
Table 3.1 Utilization of organic compounds in the presence of sulphate and fermentation of carbon source in the absence of electron acceptor for strain SJI1.
electron donor fermentation Chemical as electron donor metabolic product(s) ferment ability ferment product(s)
lactate complete acetate, CO2 - - acetate partial CO2 - - pyruvate complete acetate, CO2 partial acetate succinate complete acetate, CO2 - - malate complete acetate, CO2 - - propionate partial CO2 partial CO2 formate partial CO2 - - methanol partial CO2 - - ethanol partial acetate, CO2 - - propanol partial CO2 - - glycerol partial acetate, CO2 - - fructose partial CO2 - - glucose partial fructose, CO2 - - cysteine complete acetate, CO2 partial pyruvate
Strain SJI1 was further characterized with respect to its ability to grow with
different electron acceptors. Sulphate, sulfite, or thiosulfate can serve as the electron
acceptor in the presence of lactate. However, elemental sulfur can only be used
marginally. This isolate cannot reduce nitrate. Strain SJI1 grows solely with pyruvate,
cysteine, or propionate. It was able to partially ferment pyruvate to acetate, cysteine to
pyruvate, and propionate to carbon dioxide. In the absence of the electron donor,
strain SJI1 disproportionated sulfite and elemental sulfur to sulphate and sulfide.
The appearance of an absorbance peak at 365 nm after adding sodium
hydroxide in the washed cells indicates the presence of desulfoviridin - the
dissimilatory sulfite reductase. The presence of desulfoviridin and the ability to use
lactate and ethanol strongly suggest that strain SJI1 is affiliated with the genus
Desulfovibrio (Tardy-Jacquenod et al., 1996). Vitamins were not required for the

Chapter 3 Isolation, Characterization and Identification of A Marine Sulphate Reducing Bacteria
47
growth of strain SJI1.
3.4 16S rRNA Gene Sequence and Phylogenetic Analysis
A total of 1502 bases of the 16S rRNA gene sequence of strain SJI1 (accession
number EF178280) (Figure 3.3) were determined. According to the sequence data,
strain SJI1 belongs to the genus Desulfovibrio. The closest relative is Desulfovibrio
bizertensis strain MB3 (accession number DQ422859) (a level of similarity, 99%).
The 16S rRNA sequence of strain SJI1 also exhibited a similarity of 94% and 92% to
Desulfovibrio senezii (accession number AF050100) and Desulfovibrio ferrophilus
(accession number AY274449), respectively (Figure 3.4). A dendrogram generated by
the neighbor-joining method describing these relationships is shown in Figure 3.4.
Based on the 16S rRNA gene sequence, strain SJI1 is clearly a member of the
genus Desulfovibrio, as it has a close similarity to Desulfovibrio bizertensis and
Desulfovibrio senezii. Besides the high phylogenic similarity based on 16S rRNA
gene sequence, strain SJI1 and Desulfovibrio bizertensis strain MB3 also share certain
physiological characteristics, e.g., both reduce sulfite and thiosulfate to sulfide, and
use common classical energy substrates, such as lactate, pyruvate, ethanol, butanol,
propanol, succinate, and malate (Table 3.2). Moreover, both strains ferment pyruvate
to acetate. Nevertheless, significant differences exist between both strains. Strain SJI1
differs from Desulfovibrio bizertensis with its smaller size (0.5 x 1-2 µm versus 0.5 x
2-3 µm), and its ability to oxide acetate and cysteine. Strain SJI1 is also able to
completely oxidize lactate to acetate, while lactate oxidization by Desulfovibrio
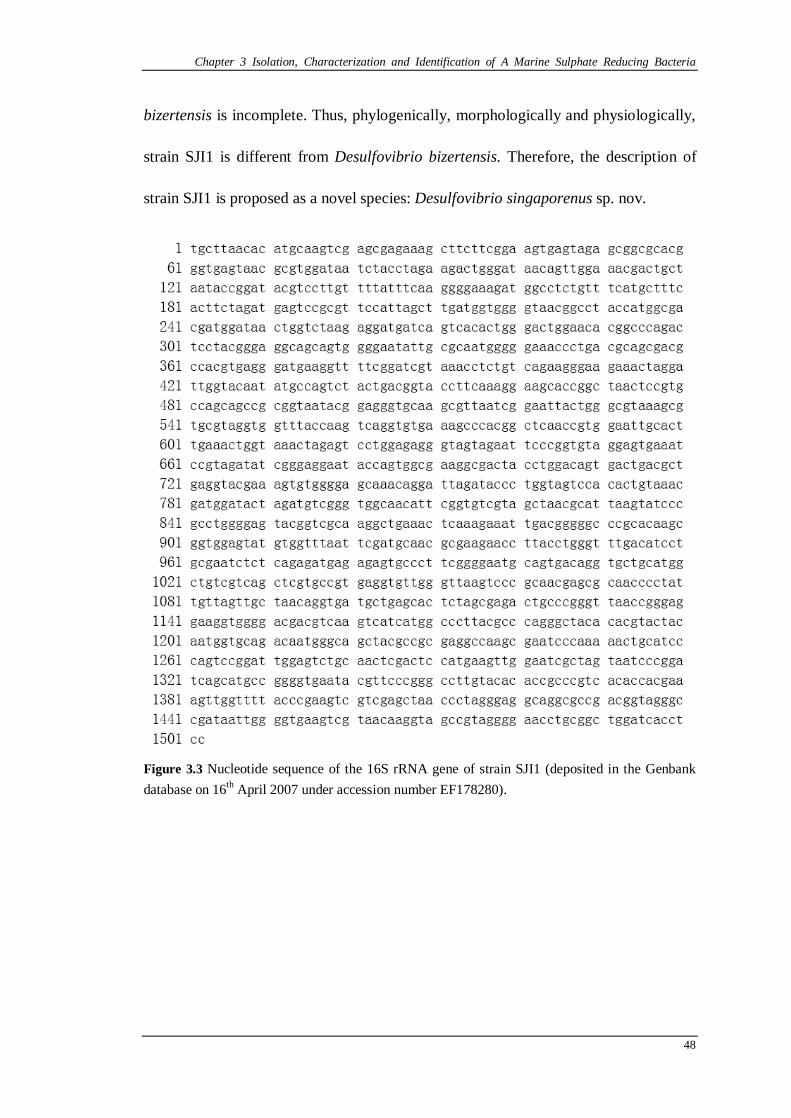
Chapter 3 Isolation, Characterization and Identification of A Marine Sulphate Reducing Bacteria
48
bizertensis is incomplete. Thus, phylogenically, morphologically and physiologically,
strain SJI1 is different from Desulfovibrio bizertensis. Therefore, the description of
strain SJI1 is proposed as a novel species: Desulfovibrio singaporenus sp. nov.
Figure 3.3 Nucleotide sequence of the 16S rRNA gene of strain SJI1 (deposited in the Genbank database on 16th April 2007 under accession number EF178280).

Chapter 3 Isolation, Characterization and Identification of A Marine Sulphate Reducing Bacteria
49
Figure 3.4 A phylogenetic tree based on 16S rRNA gene sequences showing the position of strain SJI1 within the genus Desulfovibrio and in relation to other sulphate-reducing bacteria. The tree was calculated using the neighbor-joining method. Bar, 2% sequence divergence.

Chapter 3 Isolation, Characterization and Identification of A Marine Sulphate Reducing Bacteria
50
Table 3.2 Comparison of strain SJI1 and other closely related Desulfovibrio species.
Characteristic Strain SJI1 (EF178280)
Desulfovibrio bizertensis
(DQ422859)
Desulfovibrio senezii
(AF050100) Morphology Rod, curved vibrio Rods, curved,
spiral-shaped Cell size (μm) 0.5 x 1-2 0.5 x 2-3 0.3 x 1-1.3 flagellum Single polar ND Single polar Salinity range (g/l) 10-75 5-50 0-125 Salinity optimum (g/l) 25 20 25 Temperature range (oC) 15-45 15-45 25-45 Temperature optimum (oC) 37 40 37 pH range 5-10 6-8.1 6.4-8.3 pH optimum 7 7 7.6 Electron donors:
lactate + + + acetate + – – pyruvate + + + propionate + – – methanol + – – ethanol + + – butanol + + ND propanol + + – glycerol + ND – Succinate + + – malate + + – formate + ND – fructose + – – glucose + – – cysteine + – +
Fermentation of: pyruvate + + –
Electron acceptors: sulfite + + + thiosulfate + + + elemental sulfur (+) + – nitrate – – –
Notes: +, utilized; (+), slightly used; -, not utilized; ND, not determined.

Chapter 3 Isolation, Characterization and Identification of A Marine Sulphate Reducing Bacteria
51
3.5 Summary
Description of Desulfovibrio singaporenus sp. nov.
The marine isolate, designated Desulfovibrio singaporenus strain SJI1, was
isolated from seawater near St. John’s Island, Singapore. Cells were rod,
curved-shaped, 0.5 x 1-2 μm in size, motile with a single polar flagellum, and
Gram-negative. No vitamins were required for their growth. Acetate, lactate, pyruvate,
propionate, hydrogen, methanol, ethanol, butanol, propanol, glycerol, succinate,
malate, formate, fructose, glucose, or cysteine can be used as an electron donor with
sulphate reduction. Sulphate, sulfite, thiosulfate, or elemental sulfur served as the
electron acceptor, but not nitrate. Pyruvate, cysteine and propionate were fermented,
and sulfite and elemental sulfur were disproportioned. Lactate was completely
oxidized to acetate and CO2, while acetate was partially oxidized. The optimal NaCl
concentration for growth was 25 g/l, and the salinity range for growth was 10-75 g/l.
The optimal growth temperature was 37 oC, and the temperature range for growth was
15-45 oC. The optimal pH was 7, and the pH growth range was 5-10.
Desulfoviridin-type reductase was present.

Chapter 4 Biofilm Formation and Force Measurement
52
CHAPTER 4 BIOFILM FORMATION AND FORCE
MEASUREMENT
This chapter was divided into two parts. Part one investigated the adhesion of
three bacteria to several metal surfaces which was directly quantified using AFM
force spectroscopy in the fluid. Factors which influence the bacterial-metal
interactions (i.e. surface charge and wettability, ionic strength and pH of the solutions)
were discussed. Finally, the adhesion forces between bacterial cells were measured in
order to investigate the cell-cell interaction. In part two, AFM force spectroscopy in
the air was used for an ex-situ study of a naturally developed biofilm by two SRB.
The interactions between tip and various components of biofilm were examined and
compared.
4.1 Force Measurement in the Fluid
4.1.1 Typical Force Curves
Figure 4.1 A scanning electron microscope image of a silicon nitride tip coated with Pseudomonas sp.

Chapter 4 Biofilm Formation and Force Measurement
53
Figure 4.1 shows a SEM image of a Pseudomonas sp. cell coated tip. Figure 4.2
shows a typical AFM force-distance curve (Force (nN) versus piezo position (nm)) of
the Pseudomonas sp. cell coated tip approaching the SS316. As expected, at large
distances from the surface, no interaction between the cell and the metal was detected.
As the tip approaches the metal surface, the surface biopolymers on the bacterial cell
surface are retracted, which results in a steric repulsive force. Once contacted, some
of the surface polymers on the cell surface attach to the SS316 surface. This gives
rise to the adhesion peaks in the retraction curve, followed by some other small peaks
due to the multiple unbinding events, which indicate the formation of strong specific
interactions after initial contact. This is likely due to the stretching and fibrillation of
biomolecules, such as lipopolysaccharides or flagella on the cell surface (Burnham et
al., 2003). D. desulfuricans has a single polar flagellum (Postgate, 1984) and the
genus Pseudomonas is a polarly-flagellated bacterium (Palleroni, 1978). AFM phase
image (shown earlier in Figure 3.1 c) also shows the presence of flagella in the marine
SRB isolate, D. singaporenus. Protein structures, such as flagella, are expected to
interact through electrostatic or hydrogen bonding forces between charged amino acid
residues and mineral surface charges, particularly in a high ionic strength solution
(Lower et al., 2000). More than one single surface biopolymer is likely attached to the
metal substrate simultaneously, which results in multiple bond breakages, as the cell
moves away from the substrate. In fact, in many cases, the retraction curves of cell
probes represent complex dynamics of adhesion, including bond breaking,
intermolecular forces and extension of outer membrane biomolecules that form a

Chapter 4 Biofilm Formation and Force Measurement
54
bridge between the bacterium and the substrate (Lower et al., 2001a). Finally, when
the tip is detached from the steel surface, the interaction force returns to zero. Such a
force curve profile is similar to the interaction curve between a bare tip and a cell
lawn surface as reported by Abu-Lail and Camesano (Abu-Lail and Camesano, 2002).
Similar force curve profiles were also observed with other metal substrates (e.g., mild
steel, aluminum and copper) and other cell probes (e.g., D. desulfuricans and D.
singaporenus) in our system.
0 20 40 60 80 100-2
-1
0
1
2
3
Adhesion peak
Extending Retracting
Forc
e (n
N)
piezo position (nm)
Figure 4.2 A typical force-distance curve between a Pseudomonas sp. coated tip and SS316.
The influence of the treatment of glutaraldehyde was examined by contact
angle, zeta potential, and AFM force measurements. The contact angles for
Pseudomonas sp. on a cell lawn with and without glutaraldehyde treatment are 93 ±
1o and 91 ± 2o, respectively. Zeta potential measurements show that the surface
charge density of the cells is not affected by the glutaraldehyde treatment, as the zeta
potential of cells before and after glutaraldehyde treatment are -34.07 ± 2.5 mV and
-36.21 ± 3.9 mV, respectively. The AFM force measurements also showed that the
treating of glutaraldehyde did not affect the adhesion forces (data not shown here).

Chapter 4 Biofilm Formation and Force Measurement
55
Tests performed on D. desulfuricans and D. singaporenus, gave similar results. The
above information confirms the integrity of using glutaraldehyde for AFM force
measurements.
4.1.2 Forces Between the Cell Tip and Different Metal Substrates
Force measurements between the cell probe and four metal substrates (i.e.
aluminum, mild steel, copper, and SS316) were performed at three different locations
of each metal surface. The force curves for Pseudomonas sp., D. desulfuricans and D.
singaporenus interacting with metal substrates are shown in Figure 4.3 to Figure 4.5,
respectively. Upon approaching the metal surface, the attraction forces measured
between all the three bacteria and the aluminum are significantly larger than that
obtained from the other three metals (Figure 4.3 a, Figure 4.4 a, and Figure 4.5 a).
This is caused by the electrostatic forces as the metal surfaces are positively charged
in the artificial seawater (Table 4.1), whilst the bacterial cells under the physiological
condition are negatively charged due to the presence of anionic surface groups, such
as carboxyl and phosphate (Ahimou et al., 2002; James, 1991). Aluminum exhibits
the highest zeta-potential, thus the highest attraction forces to bacterial cells.
Table 4.1 Force quantification of bacteria in artificial seawater on various metals.
Aluminum SS316 Mild steel Copper Adhesion forces of Pseudomonas sp. (nN) 5.6 ± 0.8 2.2 ± 0.5 2.0 ± 0.4 0.5 ± 0.2 Adhesion forces of D. desulfuricans (nN) 5.4 ± 0.6 3.5 ± 0.5 2.0 ± 0.4 1.5 ± 0.3 Adhesion forces of D. singaporenus (nN) 4.8 ± 0.4 0.9 ± 0.4 0.8 ± 0.2 0.6 ± 0.2 Contact angle of metals 87 ± 2 o 85 ± 1 o 62 ± 2 o 85 ± 1 o Zeta potential of metals (in artificial seawater) (mV)
1754.0 ± 29.4 1364.4 ± 28.6 1320.0 ± 20.6 449.4 ± 19.3

Chapter 4 Biofilm Formation and Force Measurement
56
For the bacteria-aluminum interaction, it is interesting to note that there is a
sudden increase in the attraction forces as the cell approaches the substrate (Figure 4.3
a, Figure 4.4 a, and Figure 4.5 a). This “snap-in” phenomenon occurs when the
bacterial cells are at certain distance to the aluminum (with the piezo displacement of
72 nm, 60 nm and 80 nm for Pseudomonas sp., D. desulfuricans and D. singaporenus,
respectively). The distances at which the bacteria started interacting with aluminum
(due to electrostatic forces) are generally larger than the other three metals. Similar
observation of “snap-in” phenomenon has been reported for the interaction between a
Bacillus mycoides spore and a hydrophobic-coated glass specimen (Bowen et al.,
2002).
The adhesive forces that occur when the cell tip retracts from the different
substrates are distinctly different (Figure 4.3 b, Figure 4.4 b, and Figure 4.5 b). The
aluminum substrate exhibits the largest adhesion force amongst all the three bacteria
(5.6 ± 0.8 nN, 5.4 ± 0.6 nN, and 4.8 ± 0.4 nN for Pseudomonas sp., D. desulfuricans
and D. singaporenus, respectively), whereas the copper exhibits the lowest (0.5 ± 0.2
nN, 1.5 ± 0.3 nN, and 0.6 ± 0.2 nN for Pseudomonas sp., D. desulfuricans and D.
singaporenus, respectively). This is because aluminum has the highest zeta-potential
while copper has the lowest. The bacterial cells in artificial seawater are negatively
charged, and show the strongest electrostatic force with aluminum and the lowest
adhesion force with copper. A thick and compact passive film is present on the
aluminum substrate, resulting in less active free electrons and more positive charges
under the experimental condition, which favors bacterial adhesion. As the surface of

Chapter 4 Biofilm Formation and Force Measurement
57
bacterial cells is negatively charged, the repulsion force is reduced and the adhesion
increased when the cell tip interacts with the aluminum surface.
D. desulfuricans has much lower zeta-potential than Pseudomonas sp. and D.
singaporenus (Table 4.2). Hence it is speculated that the adhesion forces between
metals and D. desulfuricans should be much larger than that between the metal and
other bacteria. However, the experimental results show that adhesion forces between
metals (i.e. aluminum and mild steel) and D. desulfuricans are similar to that for
Pseudomonas sp. Thus it may be argued that the electrostatic force is not the only
governing factor that influences adhesion force. The bacterial surface wettability was
examined. It is shown that the Pseudomonas sp. is much more hydrophobic (contact
angle 91± 2o) than the D. desulfuricans and D. singaporenus (contact angle 29 ± 2o
and 22 ± 1o, respectively) (Table 4.2). It is therefore concluded that the bacteria
surface with higher wettability exhibits lower bacterial adhesion.
Although the surface charge of SS316 and mild steel are similar in value, the
former shows larger adhesion force than the latter to D. desulfuricans (Figure 4.4 b).
This may be explained by the hydrophobic interactions, as the surface of the stainless
steel (contact angle 85 ± 1o) are more hydrophobic than the mild steel (contact angle
62 ± 2o) (Table 4.1). It appears that increasing the substrate hydrophobicity would
result in a stronger cell adhesion. However, the most hydrophilic surface (mild steel,
Table 4.1) does not exhibit the lowest adhesion force, which suggests that the
bacterial adhesion is not only influenced by the metal surface wettability. Therefore, a

Chapter 4 Biofilm Formation and Force Measurement
58
conclusion may be drawn that the adhesion force is governed by both the electrostatic
and hydrophobic forces between cell and metal.
Table 4.2 Contact angle and surface charge of bacteria in artificial seawater
Pseudomonas sp. D. singaporenus D. desulfuricans Contact angle of bacteria 91 ± 2o 29 ± 2o 22 ± 1o Zeta potential of bacteria (mV) -2.6 ± 1.4 -5.6 ± 1.7 -25.0 ± 1.6
0 20 40 60 80 100 120
-2
0
2
4
Pseudomonas sp.
Forc
e (n
N)
Extending distance (nm)
on aluminum on mild steel on stainless steel 316 on copper
0 20 40 60 80 100 120
-6
-4
-2
0
2
4
Pseudomonas sp.
Forc
e (n
N)
Retracting distance (nm)
on aluminum on mild steel on stainless steel 316 on copper
Figure 4.3 Force-distance curves when a Pseudomonas sp. cells coated tip was (a) extended to and (b) retracted from different metal substrates in artificial seawater.
0 20 40 60 80 100 120
-2
0
2
4
D. desulfuricans
Forc
e (n
N)
Extending distance (nm)
on aluminum on mild steel on stainless steel 316 on copper
0 20 40 60 80 100 120-6
-4
-2
0
2
4D. desulfuricans
Forc
e (n
N)
Retracting distance (nm)
on aluminum on mild steel on stainless steel 316 on copper
Figure 4.4 Force-distance curves when a D. desulfuricans cells coated tip was (a) extended to and (b) retracted from different metal substrates in artificial seawater.
(a) (b)
(a) (b)

Chapter 4 Biofilm Formation and Force Measurement
59
0 20 40 60 80 100 120 140 160 180 200-2
0
2
4D. singaporenus
Forc
e (n
N)
Extending distance (nm)
on aluminum on mild steel on stainless steel 316 on copper
0 20 40 60 80 100 120 140 160 180 200
-4
-2
0
2
4
D. singaporenus
Forc
e (n
N)
Retracting distance (nm)
on aluminum on mild steel on stainless steel 316 on copper
Figure 4.5 Force-distance curves when a D. singaporenus cells coated tip was (a) extended to and (b) retracted from different metal substrates in artificial seawater.
To investigate the effects of bacterial adhesion to the various metal substrates in
a way that can be visualized, CLSM images (Figure 4.6) were used to verify the AFM
force measurement results. The propensity of bacteria to adhere onto the metal surface
has been estimated by comparing the number of bacteria that were attached to the
surfaces after one-day incubation in the artificial seawater (Figure 4.6). It is
evident that Pseudomonas sp. did not adhere to a great extent on the copper substrate,
whereas there is a considerable layer of biofilm on the aluminum. It is shown that the
biofilm distribution on mild steel is similar to that on the SS316. These images are
consistent with the results of adhesion force analysis (Figure 4.3), where the adhesion
on the aluminum and the copper are the highest and the lowest respectively.
(a) (b)

Chapter 4 Biofilm Formation and Force Measurement
60
Figure 4.6 CLSM images of Pseudomonas sp. adhering onto (a) mild steel, (b) copper, (c) aluminum, and (d) on SS316 in artificial seawater. The scale bar is 500 μm for all images.
4.1.3 Cell Tip-Cell Lawn Interactions
After the initial adhesion of some bacteria to the metal surface, other bacteria
subsequently contribute to the development of a mature biofilm. Therefore, the
interaction between bacteria plays an important role in biofilm formation. The
cell-cell interactions for D. singaporenus, D. desulfuricans and Pseudomonas sp. were
measured and are shown in Figure 4.7. Compared with the adhesion forces to the
metals, the force curves between the cell and the cell lawn are less smooth, and dither
(a) (b)
(c) (d)

Chapter 4 Biofilm Formation and Force Measurement
61
with the approaching distance. When the cell-coated tip of all these organisms
approaches the cell lawn, the repulsive forces appear much earlier on the cell lawn
surface than that on the metal surfaces, and no attraction was observed. The extending
force curves indicate the long range of repulsive force for the cell-cell interaction.
When the cell tip retracts from the cell lawn, the adhesion force is not observed for all
these bacteria. The retracting force curves are similar to the extending curves. This is
because the cell lawn is more negatively charged than the metal surfaces in the
artificial seawater (Table 4.1), and the electrostatic repulsion between cell and cell is
relatively stronger. The CLSM image (Figure 4.6 d) shows that Pseudomonas sp. is a
nonflocculent strain. Cell aggregation for negatively charged bacteria is more likely to
occur at a slightly acidic pH when the surface potential is reduced to zero (Davies,
1995). Therefore, under a neutral pH environment, electrostatic repulsive interaction
plays an important role for all the three bacteria: Pseudomonas sp., D. desulfuricans
and D. singaporenus. The tip-sample contacting points during approaching process
were determined following the method of Camesano and Logan (2000), and the
repulsive forces at the contacting point for Pseudomonas sp., D. desulfuricans and D.
singaporenus were 1.26 nN, 1.35 nN, and 1.037 nN, respectively. The most
negatively charged bacterium (i.e. D. desulfuricans) has the largest repulsive force.
Meanwhile the bacterial surface wettability also influences the cell-cell repulsion
interaction which results in the larger repulsive force for Pseudomonas sp. than D.
singaporenus. The cell-cell force curves indicate that once a layer of bacteria is

Chapter 4 Biofilm Formation and Force Measurement
62
adsorbed to the metal surfaces, it becomes difficult to adsorb other bacteria to the
bacterial layer.
0 100 200 300
0
2
4Fo
rce
(nN
)
Distance (nm)
D. singaporenus-D. singaporenus interaction (extending) D. singaporenus-D. singaporenus interaction (retracting) D. singaporenus-stainless steel 316 interaction (extending)
0 100 200 300
0
2
4 Pseudomonas sp. - Pseudomonas sp. interaction (extending) Pseudomonas sp. - Pseudomonas sp. interaction (retracting) Pseudomonas sp. - stainless steel 316 interaction (extending)
Forc
e (n
N)
Distance (nm)
(a)
(b)

Chapter 4 Biofilm Formation and Force Measurement
63
0 100 200 300-2
0
2
4 D. desulfuricans - D. desulfuricans interaction (extending) D. desulfuricans - D. desulfuricans interaction (retracting) D. desulfuricans - stainless steel 316 interaction (extending)
Forc
e (n
N)
Distance (nm)
Figure 4.7 Force-distance curves when bacteria coated tip was extended to the substrate in artificial seawater: (a) D. singaporenus, (b) Pseudomonas sp., and (c) D. desulfuricans.
However, bacterial cells may still aggregate to form a thicker biofilm. This
suggests that the role of flagella and cell surface biopolymers, which are important for
the initial attachment to a substratum, become less important in the maturation of a
biofilm (Jefferson, 2004). The accumulation of bacterial cells in a biofilm may be due
to the cellular production of extracellular polymeric substances (EPS), which include
exopolysaccharides, nucleic acids, proteins, glycoproteins and phospholipids (Davis,
1995; Allision, 2003). Research on cell-cell communication in bacteria has
demonstrated that chemical signaling plays an important role in the formation of
bacterial biofilm. It has shown that a class of diffusible molecules N-acylated
homoserine lactones (AHLs) which are released by the bacteria into the local
environment can interact with the neighbouring cells (Davies, 2003). Therefore, EPS
(c)
Chapter 4 Biofilm Formation and Force Measurement
64
is generally considered to be important in cementing bacterial cells together in the
biofilm structure (Davies et al., 1998; Stoodley et al., 2002).
4.1.4 Influence of Nutrient and Ionic Strength on the Cell-Metal Interaction
The typical force-distance measurements between bacteria (i.e. Pseudomonas
sp., D. desulfuricans, and D. singaporenus) and SS316, in deionized water (DIW),
artificial seawater (ASW), and EASW (EASW) are shown in Figure 4.8. Results show
that the adhesion force for the interaction of Pseudomonas sp. and SS316 in DIW is
lower than that in ASW (Figure 4.8 a). The similar observation was also found for D.
singaporenus and D. desulfuricans (Figure 4.8 b and c). This is due to the electrostatic
attraction force between the bacterial cells and the metal substrate, as the metal
surface is positively charged and the bacteria are negatively charged (Table 4.3). The
high zeta potential of SS316 in ASW results in the strong electrostatic force.
Moreover, the sensitivity of the force measurements for a microbial strain in DIW and
ASW may be also due to the length of the lipopolysaccharide (LPS) on the cell
surface. The surface biopolymers in a low ionic strength solution are extended due to
electrostatic and steric repulsions, while the ones in high ionic strength are
compressed (Abu-Lail and Camesano, 2003c). The longer LPS chains result in the
stronger elasticity in DIW which indicates the stronger adhesion force between
bacteria and metal. Furthermore, ionic strength influences the electrostatic
double-layer. The decrease in the magnitude and the operative distance of electrostatic
force with increasing ionic strength is expected due to the compression of the
Chapter 4 Biofilm Formation and Force Measurement
65
electrostatic double layer around the bacteria and the substrate and the flattened
conformation of negatively-charged polymers on the bacterial surface, thereby
allowing attractive London-van der Waals forces to dominate (Lower et al., 2000).
The increasing London-van der Waals forces is one of possible reasons for the
increasing adhesion force in solution with high ionic strength (i.e. ASW).
Furthermore, the average adhesion force in the ASW (2.2 ± 0.6 nN, 3.5 ± 0.5
nN, and 0.9 ± 0.4 nN for Pseudomonas sp., D. desulfuricans and D. singaporenus,
respectively), was larger than that in the EASW (1.8 ± 0.4 nN, 1.2 ± 0.3 nN, and 0.6 ±
0.3 nN for Pseudomonas sp., D. desulfuricans and D. singaporenus, respectively) at P
< 0.05 (Figure 4.8 and Table 4.3). This may be due to the formation of a conditioning
film on stainless steel surface in the EASW. Once a material surface is exposed to an
aqueous medium with nutrients, its interfacial properties are often modified by the
surrounding fluid through the adsorption of organic compounds (Fletcher, 1996;
Marshall, 1996). The conditioning film adsorbed on the material surface often affects
the subsequent kinetics of bacteria attachment on the surface. Contact angle
measurements showed that the wettability of SS316 increased after the formation of a
conditioning film (i.e., 60 ± 2o with the conditioning film vs. 85 ± 3o without the
conditioning film). The decrease in the hydrophobicity of the metal surface induces a
weakening in bacterial adhesion. The zeta potentials of bacteria and stainless steel in
both ASW and EASW are also measured, and there is no significant difference
between them (Table 4.3).

Chapter 4 Biofilm Formation and Force Measurement
66
0 20 40 60 80
-2
0
2
4
Pseudomonas sp. in DIW Pseudomonas sp. in ASW Pseudomonas sp. in EASW
Forc
e (n
N)
Retracting distance (nm)0 20 40 60 80
-4
-2
0
2
4
Forc
e (n
N)
Retracting distance (nm)
D. desulfuricans in DIW D. desulfuricans in ASW D. desulfuricans in EASW
0 20 40 60 80-2
0
2
4
Forc
e (n
N)
Retracting distance (nm)
D. singaporenus in DIW D. singaporenus in ASW D. singaporenus in EASW
Figure 4.8 Force-distance curves when a cells-coated tip was retracted from SS316 in different solutions (a) Pseudomonas sp.; (b) D. desulfuricans; (c) D. singaporenus.
Table 4.3 Force quantification of three bacteria on SS316 in various solutions
The propensity of bacteria to adhere onto the metal surface has been estimated
by comparing the number of bacteria that remain attached to the surfaces following
DIW ASW EASW
Adhesion force of Pseudomonas sp. (nN) 1.5 ± 0.6 2.2 ± 0.6 1.8 ± 0.4 Adhesion force of D. desulfuricans (nN) 1.7 ± 0.3 3.5 ± 0.5 1.2 ± 0.3 Adhesion force of D. singaporenus (nN) 0.7 ± 0.4 0.9 ± 0.4 0.6 ± 0.3 Zeta potential of Pseudomonas sp. (mV) -34.1 ± 2.5 -2.6 ± 1.4 -2.7 ± 1.6 Zeta potential of D. desulfuricans (mV) -35.4 ± 4.7 -25.0 ± 1.6 -24.4 ±2.0 Zeta potential of D. singaporenus (mV) -55.6 ± 13.1 -5.6 ± 1.7 -5.3 ± 1.5 Zeta potential of SS316 (mV) 6.8 ± 1.3 1364.4 ± 28.6 1356.4 ± 21.6 Contact angle of SS316 85 ± 3o 85 ± 1o 60 ± 2 o
(c)
(a) (b)

Chapter 4 Biofilm Formation and Force Measurement
67
incubation in the aforementioned solutions for one day. The samples after staining
with LIVE/DEAD Baclight bacteria viability kits (Molecular Probe) were examined
by CLSM (Figure 4.9). Figure 4.9 shows the adhesion of fluorescent Pseudomonas sp.
to SS316 in DIW, ASW and EASW, respectively. It is evident that the stainless steel
in ASW was completely covered with the bacteria. However, when the substrate was
immersed in EASW, fewer viable (i.e., green) bacteria and fewer non-viable (i.e., red)
bacteria were found on the steel surface (Figure 4.9 b). There were much fewer viable
bacteria adhering onto the surface in DIW, compared to the case in ASW and EASW.
At the same time, more non-viable bacteria were attached to the metal surface in
DIW. This is because DIW lacks nutrients and is low in ionic strength. The average
thickness of the biofilm (quantified at four locations) measured using CLSM was 14.6
± 2.1 μm, 11.89 ± 1.2 μm, and 10.45 ± 0.8 μm, in ASW, EASW and DIW,
respectively. Evidently, bacterial adhesion to the metal surface in seawater is the
highest, which is consistent with the AFM force measurements discussed earlier. It
is also reported that bacteria are inclined to grow in an environment, where nutrients
are abundant (Fletcher, 1996; Marshall, 1996). In contrast, a “barren” liquid (in this
case, DIW) will result in the adhesion of bacteria onto the solid surface, which has a
greater propensity to adsorb some organic trace elements. It has been reported that
some bacteria, such as Burkholderia sp. (Lower et al., 2001a), showed a greater
affinity to mineral surfaces under oligotrophic rather eutrophic environments
(Fletcher, 1996; Marshall, 1996); under poor nutrient environment, bacteria increase

Chapter 4 Biofilm Formation and Force Measurement
68
the production of extracellular polysaccharides, which provide the hydrophobic
interactions and promote sorption onto the solid surface (Bengtsson, 1991).
Figure 4.9 CLSM images of Pseudomonas sp. adhering onto SS316 in (a) DIW; (b) ASW; (c) EASW.
4.1.5 Influence of Solution pH on the Cell-Metal Interaction
An important property of a solution which may influence bacterial adhesion is
the pH value. Force-distance curves were recorded between the cell probes and SS316
in ASW solutions of varying pH. Figure 4.10 shows the force measurement data for
Pseudomonas sp., D. desulfuricans, and D. singaporenus onto SS316 over a range of
pH (3-9) in ASW. The data are based on the measurements for four bacteria probes,
(a) (b)
(c)

Chapter 4 Biofilm Formation and Force Measurement
69
and each probe was used to make ten measurements at one single location at each pH.
As shown in Figure 4.10, the multiple adhesion forces are recorded for all the curves
over the pH range 3-9. Differences in the force curves were observed as pH was
varied. At pH 3, all the three microorganisms (i.e. Pseudomonas sp., D. desulfuricans,
and D. singaporenus) have the maximum adhesion force, which has an average value
of 2.8 ± 0.4 nN, 2.4 ± 0.2 nN, and 3.3 ± 0.4 nN for Pseudomonas sp., D. desulfuricans,
and D. singaporenus respectively, higher than those at pH of 5 and 7. When the pH
increases to 5 and 7, the adhesion forces decrease, and the smallest adhesion forces
are noted at pH 7. This phenomenon is consistent with previous AFM force study of
microbe adhesion properties (Ahimou et al. 2002; Dufrêne, 2003; Bowen et al.,
2000a). The change of adhesion forces measured as a function of pH is possibly due
to the change of the ionization state of bacterial cell surface functional groups. The
surface of bacteria cell is mainly composed of ionized groups: carboxyl and amino
groups. The different pH of the solutions influences the ionized state of carboxyl and
amino groups. For the bacteria (Pseudomonas sp., D. desulfuricans, and D.
singaporenus), the isoelectric point is 2.1, 3.5, and 3.7, respectively, and all are close
to pH 3. With the weak ionization of the carboxylate group in solution with pH 3, the
electrostatic forces between the bacteria and the metal surface are relatively low. At
higher pH (pH 5 and pH 7), the presence of negatively charged COO- increases the
electrostatic forces in opposition to the attractive forces between the metal and
bacteria. These results are in agreement with previous findings that the maximum
adhesion occurred at the isoelectric point (Bowen et al., 2000a; Ahimou et al., 2002;

Chapter 4 Biofilm Formation and Force Measurement
70
Camesano and Logan, 2000).
0 25 50 75 100 125 150
Pseudomonas sp.2nN
pH 9
pH 7
pH 5
pH 3
Forc
e (n
N)
Distance (nm)
0 25 50 75 100 125 150 175 200
D.desulfuricans
pH 3
pH 5
pH 7
pH 9
Distance (nm)
2nN
Forc
e (n
N)
(b)
(a)

Chapter 4 Biofilm Formation and Force Measurement
71
0 25 50 75 100 125 150
D. singaporenus
pH 3
pH 5
pH 7
pH 9
Distance (nm)
2nN
Forc
e (n
N)
Figure 4.10 The adhesion force between cell probe and SS316 in ASW with various pH: (a) Pseudomonas sp.; (b) D. desulfuricans; (c) D. singaporenus.
Table 4.4 Force quantification of three bacteria on SS316 in ASW with different pH
in ASW pH 3 pH 5 pH 7 pH 9 Adhesion force of Pseudomonas sp. (nN) 2.8 ± 0.4 2.1 ±0.6 1.9 ± 0.4 2.7 ± 0.5 Adhesion force of D. desulfuricans (nN) 2.4 ± 0.2 1.7 ± 0.2 0.5 ± 0.1 0.7 ± 0.1 Adhesion force of D. singaporenus (nN) 3.3 ± 0.4 3.0 ± 0.2 0.8 ± 0.3 2.3 ± 0.5
However, at pH 9, the adhesion forces increase, compared to that at pH 7
(Figure 4.10). This may be due to the much higher concentration of the negatively
charged COO- groups and the oxidized iron on steel surface at higher pH environment.
The presence of ferrous and ferric ions on the surface of stainless steel is confirmed
using X-ray photoelectron spectroscopy (XPS). Figure 4.11 shows the Fe 2p3/2 spectra.
Basically, iron spectra of Fe 2p3/2 contain three contributions: a metallic peak (Fe0) at
706.8 eV, a divalent oxide peak (Fe2+) at 709.4 eV, and a trivalent oxide peak (Fe3+) at
711.0 eV. Results from fitting the iron spectra in Figure 4.11, is given in Table 4.5,
where it can be seen that the ratio of metallic iron Fe0 decreases when the pH of the
(c)

Chapter 4 Biofilm Formation and Force Measurement
72
solution increases. That means the proportion of oxidized iron increases with pH. At
the basic environment (i.e. pH 9), an oxide passive film is formed by reacting with
hydroxyl ions. This protective layer can inhibit the metal corrosion process or lead to
passivity.
At the same time, the carboxylate groups are highly ionized at pH 9. The
negatively charged COO- groups bind with positive Fe2+ by electrostatic interaction on
the stainless steel surface, and induce the large adhesion force in the solution with
high pH (i.e. pH 9). The higher concentration of iron ion enhances the interaction with
COO- groups, and thus the adhesion forces increase when the cell tip retracts from the
metal surface.
716 714 712 710 708 706 704 702
2000
2500
3000
3500
4000
Fe3+Fe2+
Fe0
Inte
nsity
(a.u
.)
Binding energy (eV)
Fe2p3/2 in ASW pH3
718 716 714 712 710 708 706 7041000
1500
2000
2500
3000
3500
Fe3+
Fe2+
Fe0
Inte
nsity
(a.u
.)
Binding energy (eV)
Fe2p3/2 in ASW pH5
716 714 712 710 708 706 704800
1000
1200
1400
1600
1800
2000
2200
2400
2600
Fe3+
Fe2+
Fe0
Inte
nsity
(a.u
.)
Binding energy (eV)
Fe2p3/2 in ASW pH7
716 714 712 710 708 706 704 702
2000
2200
2400
2600
2800
3000
3200
Fe3+
Fe2+
Fe0
Inte
nsity
(a.u
.)
Fe 2p3/2 in ASW pH 9
Binding energy (eV)
Figure 4.11 XPS measurement of Fe 2p spectra in ASW at various pH: (a) pH 3, (b) pH 5, (c) pH 7, and (d) pH 9.
(a) (b)
(c) (d)

Chapter 4 Biofilm Formation and Force Measurement
73
Table 4.5 Fitting parameters for XPS spectra Fe2p3/2 and relative quantity of compounds in the surface of SS316 immersed in ASW at different pH.
in ASW Binding energy (eV)
Proposed compounds FWHM (eV)
Intensity Relative quantity
pH 3 706.4 Fe(0) 1.52 2412.7 0.55 708.6 Fe2+ 2.38 1154.1 0.26 710.0 FeO 2.38 284.4 0.065 711.6 FeOOH, Fe3+ 2.38 504.1 0.12 pH 5 706.4 Fe(0) 1.51 473.1 0.095 710.0 FeO 2.65 3356.8 0.67 711.6 FeOOH, Fe3+ 2.65 1151.3 0.23 pH 7 706.4 Fe(0) 1.85 281.3 0.072 710.0 FeO 2.62 2700.1 0.69 711.6 FeOOH, Fe3+ 2.62 913.2 0.23 pH 9 706.4 Fe(0) 1.85 280.3 0.096 710.0 FeO, Fe2+ 2.80 817.5 0.28 711.6 FeOOH, Fe3+ 2.80 1810.0 0.62
4.2 Ex-situ Force Measurement
In this study, a SS316 coupon was removed from the medium after immersion in
EASW with the SRB for 14 days. Figure 4.12 (a) and (b) illustrate typical 3-D
topographic images of the surface of a coupon with a naturally-developed biofilm. In
order to quantify the adhesion forces between different components of biofilm and an
AFM Si3N4 tip, five locations which represent the components of the biofilm (A—on
cell, B—at cell periphery, C—on biofilm substrate, D—on deposit and E—at deposit
periphery) were selected for the force measurement. Location F (not shown here) on
the pristine stainless steel AISI 316 without exposure to ESAW is obtained from
another coupon. The forces for each location were measured, and the statistical data
(mean value and standard deviation) are shown in Table 4.6. Figure 4.13 and Figure
4.14 show the typical forces for each location in the EASW with D. singaporenus and

Chapter 4 Biofilm Formation and Force Measurement
74
D. desulfuricans, respectively. The difference between the attraction force on the cell
(A) (4.37 ± 0.83 nN) and the one at the cell periphery (B) (4.70 ± 0.28 nN) for D.
singaporenus is found to be statistically insignificant (at the 0.05 confidence level)
(Figure 4.13). Similar results were obtained for the D. desulfuricans cell surface
where the forces measured at A and B were 2.57 ± 0.64 nN and 2.70 ± 0.80 nN,
respectively (Figure 4.14). It has been reasoned that the presence of
lipopolysaccharides (LPS) on the cell surface increases the adhesive force (Ong et al,
1999). About 45% of the surface on Gram-negative bacteria is covered by
lipopolysaccharides (LPS). The bacteria adhesion force is usually governed by
long-range forces, such as van der Waals and electrostatic interactions (Razatos et al,
1998). However, when lipopolysaccharides (LPS) are present, specific and/or
short-range interactions may become dominant, as compared with nonspecific,
long-range interactions, i.e. London-van der Waals, electrostatic, steric interactions
(Abu-Lail & Camesano, 2003a). At the cell periphery, EPS are excreted by the cells to
enhance the bacteria binding to the surface (Fang et al, 2000), and the polysaccharides
provide binding sites for trace elements (Abu-Lail and Camesano, 2003b). However,
the adhesion force on D. singaporenus is much larger than that on the D.
desulfuricans cell. It is possible that these two SRB have quite different length and
composition of lipopolysaccharides, which would greatly influence the adhesion (Ong
et al, 1999). It is also noted that the tip-cell adhesion force of 5.08 ± 0.40 nN reported
by Fang et al. (2000) for the SRB isolate from marine sediments of Victoria Harbour
(Hong Kong) is fairly similar with that measured for D. singaporenus (4.37 ± 0.83

Chapter 4 Biofilm Formation and Force Measurement
75
nN). Adhesion force measured in a fluid system is much smaller compared to that
measured in air, and is affected by factors such as the ionic strength of the solution
(Abu-Lail and Camesano, 2003c). The cell-tip adhesion forces are also enhanced with
increasing ionic strength. For example, the adhesion force between Pseudomonas
putida KT2442 and AFM Si3N4 tip was 0.46 ± 0.5 nN in 0.01M KCl solution, and
reached 1.85 ± 1.18 nN when the concentration of KCl increased to 1M.
For D. singaporenus, the attractive force on the deposit (D) (which is composed
mainly of ferrous sulfides according to EDX analysis, data not shown) is 2.59 ± 0.49
nN, a value much lower than that measured at the periphery of the deposit (E) (4.22 ±
0.62 nN). In contrast, for D. desulfuricans the force at the deposit periphery (at 2.45
± 0.40 nN) was not significantly different from that on the deposit (at 2.38 ± 0.24 nN;
at the 0.05 confidence level). At the periphery of the deposit, the slime excreted by
bacteria helps to attract the deposit onto the substrate. When a cell adheres to the
stainless steel AISI 316 surface, it excretes EPS to enhance its binding to the surface
(Vandevevere and Kirchman, 1993; Fletcher, 1996), and the EPS also facilitates the
adhesion of other suspending substances onto the solid surface. The biopolymer
interactions of EPS may control the adhesion to surfaces (Abu-Lail and Camesano,
2002). The forces at the periphery of the deposit and bacterial cell (i.e. E and A) for
both D. singaporenus and D. desulfuricans are not significantly different since it is
due to the same substances (i.e. EPS) that contribute to the adhesion force.
The forces on the substratum (4.84 ± 1.01 nN and 3.04 ± 0.36 nN for D.
singaporenus and D. desulfuricans, respectively) are found to be not significantly

Chapter 4 Biofilm Formation and Force Measurement
76
different (at 0.05 confidence level) from the forces at the cell periphery. This may be
due to the complexity of the composition of the substratum. Like the EPS, the
substratum is also composed of organic and inorganic nutrients, metabolic products,
enzymes and other biologically active molecules. All these compounds enhance the
adhesion forces. However, compared to the pristine SS316 (force of 2.09 ± 0.93 nN),
the forces on substratum after the development of the biofilm is larger for both D.
singaporenus and D. desulfuricans. These results indicate that the biofilm formation
enhances the viscosity of the substratum, which further enhances the development of
the biofilm by the adhesion of more substances onto the surface.
Figure 4.12 A contact mode AFM image of a biofilm on SS316.
A B
C
D E

Chapter 4 Biofilm Formation and Force Measurement
77
0 50 100 150 200 250 300
-80
-60
-40
-20
0
20
40
60 D. singaporenus
Def
lect
ion
(nm
)
Retracting Distance (nm)
A B C D E F
Figure 4.13 Force measurements on the biofilm surface with D. singaporenus: (A—on cell, B—at cell periphery, C—on biofilm substrate, D—on deposit and E—at deposit periphery)
0 50 100 150 200 250 300
-60
-40
-20
0
20
40
60
D. desulfuricans
Def
lect
ion
(nm
)
Retracting Distance (nm)
A B C D E F
Figure 4.14 Force measurements on the biofilm surface with D. desulfuricans: (A—on cell, B—at cell periphery, C—on biofilm substrate, D—on deposit and E—at deposit periphery)

Chapter 4 Biofilm Formation and Force Measurement
78
Table 4.6 Tip-surface adhesion forces on coupons with a biofilm (mean ± S.D.).
(More than twenty measurements at each location were taken)
Locations on the image Force (nN) for D. singaporenus
Force (nN) for D. desulfuricans
A (on the cell) 4.37 ± 0.83 2.57 ± 0.64 B (at the cell periphery) 4.70 ± 0.28 2.70 ± 0.80 C (on the substratum) 4.84 ± 1.01 3.04 ± 0.36 D (on the deposit) 2.59 ± 0.49 2.38 ± 0.24 E (at the deposit periphery) 4.22 ± 0.62 2.45 ± 0.40 F (on the bare stainless steel) 2.09 ± 0.93
4.3 Summary
Atomic force microscopy had been used to directly quantify the interactions
between the bacteria and metal substrates. This technique is successful in elucidating
the initial adhesion for biofilm formation on metals. A maximum adhesion force peak
followed by several small peaks was observed when the cell probe retracted from the
surface, indicating stretching and multiple bond breakage as the cell moves away
from the substrate. Moreover, the adhesion force was found to be very sensitive to the
physiological properties of the bacterium as well as the metal substrate. The
hydrophobicity and surface charges on the metal substrates and bacteria significantly
affected the cell-metal adhesion. The surface charge greatly influenced the adhesion
force by controlling the electrostatic interaction. The bacterial adhesion forces were
enhanced by increasing surface hydrophobicity. The electrostatic interaction resulted
in stronger repulsive forces in the cell – cell interaction as compared to the cell –
metal surface interaction.
Atomic force microscopy was also a powerful analytical tool in studying the
adhesion force on various components of a heterogeneous biofilm ex-situ. These
results are helpful in understanding the mechanism of biofilm formation. The force on

Chapter 4 Biofilm Formation and Force Measurement
79
the cell surface was found to be significantly higher than that on the deposit (P <0.05).
On the other hand, the force on the cell was similar to that at the cell periphery.
However, the force on the deposit was significantly lower than that at the periphery of
the deposit. The adhesion force on D. singaporenus was much higher than that on the
cell of D. desulfuricans. These results also show that the biofilm adhesion was clearly
dependent on the organism. Furthermore, the surface after the development of a
biofilm was significantly more adhesive compared to the bare metal.

Chapter 5 Sulphate Reducing Bacteria Biofilm and its Induced Biocorrosion of Stainless Steel AISI 316
80
CHAPTER 5 SULPHATE REDUCING BACTERIA BIOFILM
AND ITS INDUCED BIOCORROSION OF STAINLESS STEEL
AISI 316
The previous chapter demonstrated the adhesion forces between SRB and metal
substrates to form the biofilm. In this chapter, the influence of this anaerobic SRB
biofilm on the biocorrosion of SS316 in the marine environment was studied. The
biocorrosion of SS316 was investigated in artificial seawater by applying AFM and
EIS (a conventional electrochemical technique). The dynamic development of biofilm
and other surface film structures of SS316 under the influence of MIC were also
examined using these techniques.
5.1 AFM Image Analysis
5.1.1 Biofilm Investigation
In both bacterial cultures, a layer of biofilm was formed on the stainless steel
surface in the absence of dissolved oxygen in the EASW (EASW) medium. The
biofilm consisted of clusters of microbial cells and extracellular polymeric substance
(EPS). AFM images of the coupons with a biofilm of D. desulfuricans and D.
singaporenus over different periods of exposure are shown in Figure 5.1 and Figure
5.2, respectively. It is manifest that the bacteria and EPS accumulated with the
exposure time. After 14 days of immersion in the EASW, the D. desulfuricans
bacterial cells were observed on the metal surface. On the 34th day, the surface

Chapter 5 Sulphate Reducing Bacteria Biofilm and its Induced Biocorrosion of Stainless Steel AISI 316
81
concentration of the cells was significantly higher. In contrast, D. singaporenus
proliferated more rapidly over the same time period; the 14th day coupon showed a
biofilm with a higher concentration of cells than the corresponding D. desulfuricans
culture. Although a thick biofilm was observed for D. singaporenus on the 34th day,
detachment of the biofilm occurred before the 44th day. These AFM images confirm
that biofilms are dynamic structural entities in which cell attachment and growth, the
formation of micro-colonies, and subsequent detachment take place (Lewandowski,
2001). Nguyen et al. (2004) also observed a similar detachment phenomenon on the
stainless steel 304 after immersion for 42 days in the EASW with D. desulfuricans.

Chapter 5 Sulphate Reducing Bacteria Biofilm and its Induced Biocorrosion of Stainless Steel AISI 316
82
Figure 5.1 Atomic Force Microscopy images of stainless steel AISI 316 coupons with D. desulfuricans biofilm; (a) 4-day-immersion; (b) 14-day-immersion; (c) 24-day-immersion; (d) 34-day-immersion; (e) 44-day-immersion.
(e)
(c)
(a) (b)
(d)

Chapter 5 Sulphate Reducing Bacteria Biofilm and its Induced Biocorrosion of Stainless Steel AISI 316
83
Figure 5.2 Atomic Force microscopy images of SS316 coupons with D. singaporenus biofilm; (a) 4-day-immersion; (b) 14-day- immersion; (c) 24-day- immersion; (d) 34-day- immersion; (e) 44-day- immersion.
(a) (b)
(d) (c)
(e)

Chapter 5 Sulphate Reducing Bacteria Biofilm and its Induced Biocorrosion of Stainless Steel AISI 316
84
5.1.2 Pits Investigation
Some pits were evident when the biofilm was removed. A detailed image of the
pits and the D. desulfuricans cell are shown in Figure 5.3. The pits (Figure 5.3 (a))
appear curved and rod-shaped, and are very similar to the bacterial cell (Figure 5.3
(b)). This suggests that the SRB plays a direct role in the formation of pits on the
surface of SS316. Similar results have also been found on a stainless steel 304 surface
with D. desulfuricans (Nguyen, 2004). Apart from the sulphate-reducing bacteria,
Leptothrix discophora (a manganese oxidizing bacteria) has also been observed by
SEM to be involved in pit initiation on 316L stainless steel (Geiser et al., 2002). It has
been explained that the pits were formed by the significant depletion of Fe relative to
Ni in near-surface regions of the oxide film under the sulphate-reducing bacteria
(Geesey et al., 1996).
SEM can provide only two-dimensional images, while AFM is able to show
three-dimensional images. Figure 5.4 shows the height profiles of the D. desulfuricans
cells and the depth profiles of the pits. The heights of the larger cell on the SS316
surface is about 115 nm (Figure 5.4 a), and is lower than the smaller cell, which is 130
nm higher than the bulk surface. The depth profiles in Figure 5.4 (b and c) show the
pit depth of the larger and smaller pits at 265 nm and 210 nm, respectively. It is likely
that the SRB plays a direct role in the pit growth process, since a greater pit depth is
associated with a larger bacterium (and a smaller pit depth associated with a smaller
bacterium; see Figure 5.4 c and b, respectively). This is due to the production of
hydrogen sulfide and the metabolic products of SRB that directly influence the local

Chapter 5 Sulphate Reducing Bacteria Biofilm and its Induced Biocorrosion of Stainless Steel AISI 316
85
surface microenvironment. Hydrogen is removed from the cathodic area on the iron
surface by the hydrogenase enzyme. This enhances the anodic dissolution of iron.
Corrosion is also affected by microbially produced FeS, which can induce cathodic
depolarization (Lee et al., 1994).
Figure 5.3 Two- and three-dimensional images of (a) a single pit, and (b) a D. desulfuricans cell on the SS316 coupons.
(a)
(b)

Chapter 5 Sulphate Reducing Bacteria Biofilm and its Induced Biocorrosion of Stainless Steel AISI 316
86
Figure 5.4 Section analysis on the SS316 coupons: (a) height profile of D. desulfuricans cells; (b) depth profile of a small pit; (c) depth profile of a large pit.
Figure 5.5 shows that the depth of corrosion pits in the EASW caused by D.
desulfuricans is greater than that caused by D. singaporenus. The greatest difference
occurred on the 44th day, with average pit depths of 102 nm and 51 nm for D.
desulfuricans and D. singaporenus, respectively. It is tempting to speculate that this
difference in the pit depth may be due to the difference in biofilm morphology. The
(c)
(b)
(a)

Chapter 5 Sulphate Reducing Bacteria Biofilm and its Induced Biocorrosion of Stainless Steel AISI 316
87
biofilm formed by D. singaporenus is compact and crystal-like (Figure 5.6), while the
D. desulfuricans biofilm appears relatively porous with a net-like structure, which
would enhance the diffusion of chemical species including chloride and cellular
metabolites. For this reason, pits formed by D. desulfuricans are deeper than those by
D. singaporenus. The pit depths for the stainless steel coupons, however, are smaller
when compared to mild steel. It has been reported that the pit depth on mild steel
reached 1390 nm after 40 days corrosion by an SRB isolated from a marine sediment
(Xu et al., 1999).
0
20
40
60
80
100
120
140
Time (days)4434144
Pits
dep
th (n
m)
24
D. desulfuricans D. singaporenus
Figure 5.5 Depth of pits on SS316 at different time of exposure.
Figure 5.6 SEM images for biofilm on the SS316 in MASW with (a) D. desulfuricans and (b) D. singaporenus.
a b
Chapter 5 Sulphate Reducing Bacteria Biofilm and its Induced Biocorrosion of Stainless Steel AISI 316
88
5.2 EIS Results
EIS analysis was conducted with time under conditions favorable for bacterial
growth. The Nyquist and Bode plots were obtained weekly for SS316 after immersion
in the EASW with D. desulfuricans and D. singaporenus for six weeks. Control
samples (i.e., the medium without bacteria) were also prepared.
The analysis of the impedance spectra was performed by fitting the data using
the Boukamp program Equivcrt (Boukamp, 1986) (i.e., a non-linear least square
fitting procedure). The quality of the fit to the equivalent circuit was judged by the
Chi-square value, comparing experimental and simulated data.
5.2.1 Control Coupons in EASW
Both Nyquist and Bode plots were utilized to interpret the EIS spectra.
Considering the Nyquist plot, it appears that there are only one or two semicircles,
including one or two time constants. However, the associated magnitude and phase
plots in Figure 5.7 appear to have several possible time constants, as indicated by the
arrows. Clearly, it is very important to interpret the experimental data by examining
both types of EIS plots. For example, only one time constant is observed in the
Nyquist plot for the 35th day control coupon, and the associated magnitude plot in
Figure 5.7 a has one time constant where the slope approaches negative one, but the
associated phase plot has three inflection points, and thus three time constants.
Modeling using three-time constants fits the experimental data well. Thus, the number
of time constant is first observed from both Nyquist plot and Bode plot, and then

Chapter 5 Sulphate Reducing Bacteria Biofilm and its Induced Biocorrosion of Stainless Steel AISI 316
89
confirmed using the fitting technique. For the control coupons (i.e. from the 7th to the
42nd day in Figure 5.9 a), only the 7th day and 14th day coupons fit the two-time
constant model, R(Q[R(QR)]), as illustrated in Figure 5.8 a. In this equivalent
circuit, a constant phase element is used. Capacitors in EIS experiments often do not
behave ideally. Instead they act like a constant phase element (CPE, nCPE jYZ
)(1
0 ω= ,
where ZCPE is the impedance of the constant phase elements, ω is the angular
frequency of alternating current voltage, Y0 and n are the frequency independent
parameters). The presence of CPE can be explained by dispersion effects that are
caused by microscopic roughness of a surface. On the surface of these coupons there
is a layer of passive film and a double layer. The electric double layer exists on the
interface between an electrode and the surrounding electrolyte. This double layer is
formed as ions from the solution adhere on the electrode surface. At short immersion
times, the passive film is not fully developed and indeed contributions from the
double layer can be resolved as the capacitance values between the double layer and
the passive film are closer in magnitude. As the passive film grows in thickness at
longer immersion times, indeed it would be nearly impossible to resolve the
contribution from the double layer from the much larger impedance contribution by
the well developed passive film in a reliable way. Huang et al. (2004) also detected
the presence of an electric double layer and a surface film in a sterile medium on
70Cu-30Ni alloy. After a further 21 days (i.e. 35th day), another time constant
appeared on the surface (Figure 5.9 a). This is probably due to the formation of pits
(Figure 5.8 b) in the EASW. The presence of high concentration of aggressive
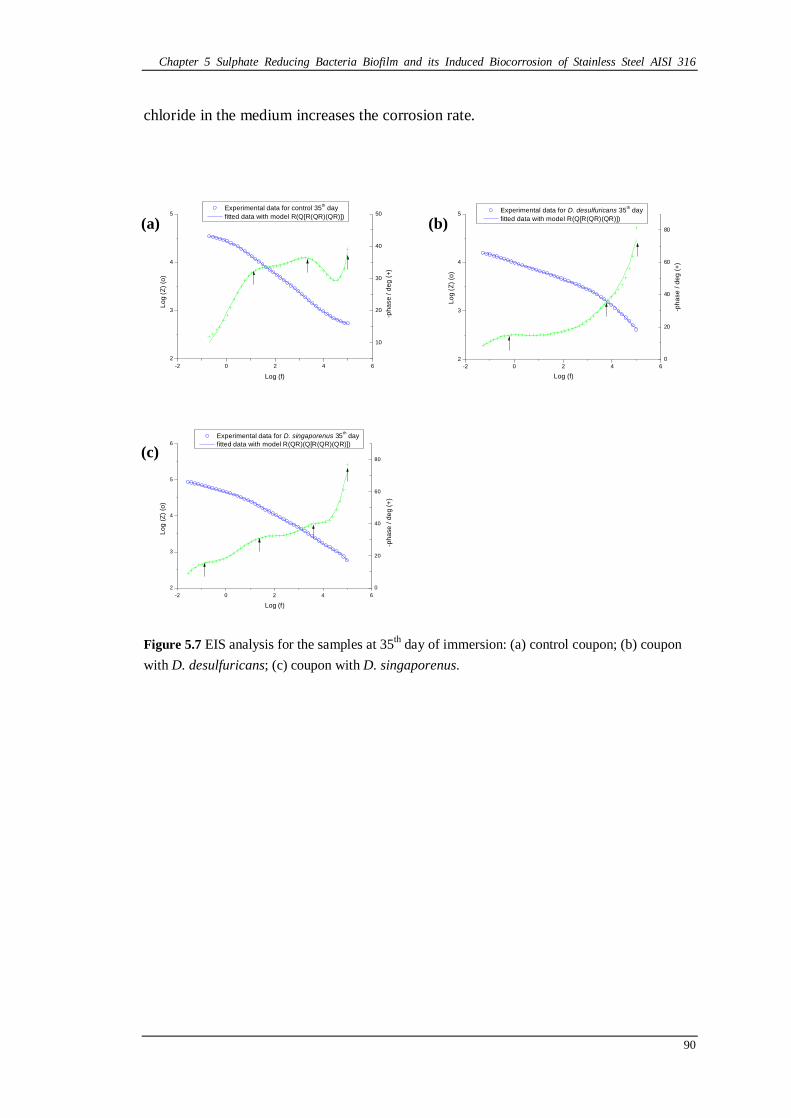
Chapter 5 Sulphate Reducing Bacteria Biofilm and its Induced Biocorrosion of Stainless Steel AISI 316
90
chloride in the medium increases the corrosion rate.
-2 0 2 4 62
3
4
5
10
20
30
40
50
-pha
se /
deg
(+)
Experimental data for control 35 th day fitted data with model R(Q[R(QR)(QR)])
Log
(Z) (
o)
Log (f)-2 0 2 4 6
2
3
4
5
0
20
40
60
80
-pha
se /
deg
(+)
Log
(Z) (
o)
Log (f)
Experimental data for D. desulfuricans 35th day fitted data with model R(Q[R(QR)(QR)])
-2 0 2 4 62
3
4
5
6
0
20
40
60
80
-pha
se /
deg
(+)
Log
(Z) (
o)
Log (f)
Experimental data for D. singaporenus 35th day fitted data with model R(QR)(Q[R(QR)(QR)])
Figure 5.7 EIS analysis for the samples at 35th day of immersion: (a) control coupon; (b) coupon with D. desulfuricans; (c) coupon with D. singaporenus.
(a) (b)
(c)
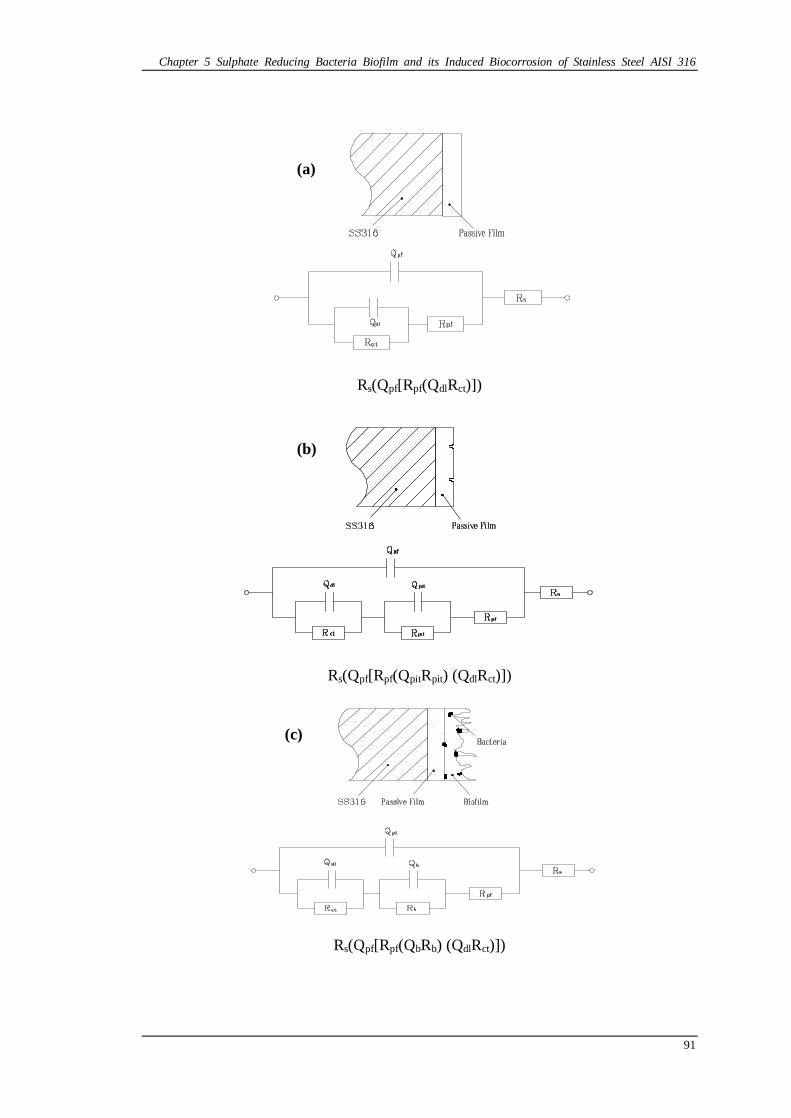
Chapter 5 Sulphate Reducing Bacteria Biofilm and its Induced Biocorrosion of Stainless Steel AISI 316
91
Rs(Qpf[Rpf(QdlRct)])
Rs(Qpf[Rpf(QpitRpit) (QdlRct)])
Rs(Qpf[Rpf(QbRb) (QdlRct)])
(a)
(b)
(c)

Chapter 5 Sulphate Reducing Bacteria Biofilm and its Induced Biocorrosion of Stainless Steel AISI 316
92
Rs(Qpf[Rpf(QbRb)(QfRf) (QdlRct)])
Figure 5.8 Equivalent Circuit models: (a) Model of R(Q[R(QR)]) for control coupons; (b) Model of R(Q[R(QR)(QR)]) for control coupons; (c) Model of R(Q[R(QR)(QR)]) for coupons in EASW with D. desulfuricans; (d) Model of R(Q[R(QR)(QR)(QR)]) for coupons in EASW with D. singaporenus.
Rs: Solution resistance Qpf: Capacitance of the passive film Rpf: Resistance of the passive film Qdl: Capacitance of the double layer Rct: Charge transfer resistance Qpit: Capacitance of the pits in the passive film Rpit: Resistance of the pits in the passive film Qb: Capacitance of the biofilm Rb : Resistance of the biofilm Qf : Capacitance of the ferrous sulfide film Rf : Resistance of the ferrous sulfide film
(d)

Chapter 5 Sulphate Reducing Bacteria Biofilm and its Induced Biocorrosion of Stainless Steel AISI 316
93
0 10000 20000 30000 40000 500000
10000
20000
30000
40000
50000
7th day fitted with R(Q[R(QR)]) 14th day fitted with R(Q[R(QR)]) 21st day fitted with R(Q[R(QR)(QR)]) 28th day fitted with R(Q[R(QR)(QR)]) 35th day fitted with R(Q[R(QR)(QR)]) 42nd day fitted with R(Q[R(QR)(QR)])
-Z''/o
hm
Z'/ohm
0 10000 20000 30000 40000 500000
10000
20000
30000
40000
50000
-Z''/o
hm
Z'/ohm
Experimental data for D.sulfuricans 7day fitted data with model R(Q[R(QR)(QR)]) Experimental data for D.sulfuricans 14day fitted data with model R(Q[R(QR)(QR)]) Experimental data for D.sulfuricans 21day fitted data with model R(Q[R(QR)(QR)])
0 10000 20000 30000 40000 500000
10000
20000
30000
40000
50000
-Z''/
ohm
Z'/ohm
Experimental data for D.sulfuricans 21day fitted data with model R(Q[R(QR)(QR)]) Experimental data for D.sulfuricans 28day fitted data with model R(Q[R(QR)(QR)]) Experimental data for D.sulfuricans 42day fitted data with model R(Q[R(QR)(QR)]) Experimental data for D.sulfuricans 35day fitted data with model R(Q[R(QR)(QR)])
0 10000 20000 30000 40000 500000
10000
20000
30000
40000
50000
-Z''/o
hm
Z'/ohm
Experimental data for D. singaporenus 7day fitted data with model R(Q[R(QR)(QR)]) Experimental data for D. singaporenus 14day fitted data with model R(Q[R(QR)(QR)]) Experimental data for D. singaporenus 21day fitted data with model R(Q[R(QR)(QR)]) Experimental data for D. singaporenus 28day fitted data with model R(Q[R(QR)(QR)(QR)]) Experimental data for D. singaporenus 35day fitted data with model R(Q[R(QR)(QR)(QR)]) Experimental data for D. singaporenus 49day fitted data with model R(Q[R(QR)(QR)(QR)])
0 10000 20000 30000 40000 500000
10000
20000
30000
40000
50000
-Z''/o
hm
Z'/ohm
Experimental data for D. singaporenus 49day fitted data with model R(Q[R(QR)(QR)]) Experimental data for D. singaporenus 56day fitted data with model R(Q[R(QR)(QR)]) Experimental data for D. singaporenus 70day fitted data with model R(Q[R(QR)(QR)(QR)])
Figure 5.9 Experimental EIS data (symbol) and their fitted data (line) for (a) a SS316 coupon; (b) coupon with D. desulfuricans; (c) coupon with D. singaporenus.
To confirm the presence of pitting, the cyclic polarization curve was measured
for the control coupons immersed in EASW for 7 days, 14 days, and 21 days.
For the 7th day coupon, the onset of anodic current occurred at a potential of
(a)
(b1) (b2)
(c1) (c2)

Chapter 5 Sulphate Reducing Bacteria Biofilm and its Induced Biocorrosion of Stainless Steel AISI 316
94
-0.27 V. A passivity zone was present when potential is between 0.20 V and 0.24 V
where the current is decreasing. When potential reached 0.75 V, no pitting potential
was observed. It was noticed that the cyclic potential curve exhibits a negative
hysteresis curve. The 14th day coupon shows a similar electrochemical behavior
with the 7th day coupon that it presents a negative hysteresis curve for the cyclic
polarization. But the current in the passivity zone is not reduced for the 14th day
coupon.
The 21st day coupon presents a passivity zone followed by a breakdown in
passivity and the start of pitting. The onset of anodic current occurred at a potential of
-0.21 V, which is slightly more positive than the 7th day coupon. The anodic curve
obtained through the positive scan revealed a narrow passive region with a positive
hysteresis. The loop of pitting hysteresis occurred between the positive and the
reverse scan portions of the cyclic polarization curve. Pitting corrosion is
characterized by an electrode potential value, above which corrosion pits can form.
This value is called the pitting potential (Epit) (Figure 5.10). The scan performed in the
rising direction shows a current density plateau (passivity) followed by a sudden
increase in anodic current characteristic of the pitting potential. Pitting was initiated at
approximately 0.49 V (positive scan), and repassivated at approximately -0.14 V
(reverse scan).

Chapter 5 Sulphate Reducing Bacteria Biofilm and its Induced Biocorrosion of Stainless Steel AISI 316
95
1E-7 1E-6 1E-5-1.0
-0.5
0.0
0.5
1.0
Pote
ntia
l (V)
Current (A/cm2)
SS316 in EASW for 7 days
1E-8 1E-7 1E-6 1E-5-1.0
-0.5
0.0
0.5
1.0
Pote
ntia
l (V)
Current (A/cm2)
SS316 in EASW for 14 days
1E-8 1E-7 1E-6 1E-5 1E-4 1E-3-1.0
-0.5
0.0
0.5
1.0
Epit
Current (A/cm2)
Pot
entia
l (V
)
SS316 in EASW for 21 days
1E-9 1E-8 1E-7 1E-6 1E-5 1E-4 1E-3-1.0
-0.5
0.0
0.5
1.0
Epit
Pot
entia
l (V
)
Current (A/cm2)
SS316 in EASW with D. desulfuricans for 7 days
Figure 5.10 Cyclic polarization curves of SS316 exposed to EASW for (a) 7 days; (b) 14 days; (c) 21 days. (d) Potentiodynamic scanning curve of SS316 coupon exposed to EASW with D. desulfuricans for 7 days.
5.2.2 Coupons in EASW with D. desulfuricans
Figure 5.9 b shows the Nyquist plots. A three-time constant model was used to
fit the experimental data in EASW with D. desulfuricans. Besides the passive film
and the double layer, there appears to be a layer of porous biofilm on the SS316
surface (Figure 5.6 a). The model, R(Q[R(QR)(QR)]) (which has a Chi-square value
of 10-3) fits the experimental data well. For the coupons of 7 to 42 days of immersion
in the EASW with D. desulfuricans, all the data fit this model well.
(a) (b)
(c) (d)

Chapter 5 Sulphate Reducing Bacteria Biofilm and its Induced Biocorrosion of Stainless Steel AISI 316
96
Figure 5.9 b shows all the experimental and fitted curves for the coupons from
the 7th to the 42nd day of immersion. The corrosion impedances of the coupons for
different exposure times show a trend in which the impedance first decreased (Figure
5.9 b1) and then increased (Figure 5.9 b2). The decrease in impedance lends support to
the corrosive effect of the sulphate reducing bacteria on SS 316. This was linked to a
decrease in pH in the medium in the presence of hydrogen sulfide (Beech and
Gaylarde, 1999). Another possible reason is that the non-homogeneous films of
sulfide products, such as FeS, serve as strong cathodes to accelerate the oxidation of
Fe(0) (Lee and Newman, 2003). The coupon at the 21st day shows the lowest
corrosion impedance. Subsequently, the iron sulfide protects the SS316 surface from
corrosion and the increase in impedance testifies to the protective effect of the iron
sulfide film (González et al., 1998). Figure 5.6 (a) shows the SEM images of the
surface of the coupon on the 21st day. The corresponding EDX analysis showed that
the surface is mainly composed of sulfur and iron. This evidence suggests that the
surface is very likely composed of a ferrous sulfide deposit. Considerable research has
focused on the influence of ferrous ion on SRB action on metals. Obuekwe et al.
(1981) reported that when only sulfide was produced, corrosion rates first increased
and then decreased due to the formation of a protective FeS film.
This three-time constant model, R(Q[R(QR)(QR)]), for the SS 316 in the
corrosion influenced by SRB has also been reported by González et al. (1998). It was
pointed out that pitting potential decreased due to the biofilm structure and that the
pores permit easy access of aggressive ions to the metal surface.

Chapter 5 Sulphate Reducing Bacteria Biofilm and its Induced Biocorrosion of Stainless Steel AISI 316
97
To compare the pitting corrosion with the control coupon, the potentiodynamic
scanning curve of SS316 coupon exposed to EASW with D. desulfuricans for 7 days
was studied (Figure 5.10 d). The pitting potential occurred at 0.35 V, much lower than
the control coupon. A breakdown of passive film occurred suddenly and appeared as
an eruption of anodic current. Such an instant increase in the anodic current from 2.5
x 10-5 to 1.5 x 10⁻³ A/cm2 may be likely associated with well-developed pits located
beneath the biofilm, and they are exposed to the bulk medium after the biofilm cover
disintegration. The observation of the pitting from the potentiodynamic scanning
curve is consistent with the AFM images, which showed that the pits are formed on
the stainless steel substrate.
5.2.3 Coupons in EASW with D. singaporenus
Nyquist and Bode plots are both analyzed for the coupons in EASW with D.
singaporenus as a function of time. The time constants were determined and the
fittings were carried out for the coupons. At the beginning, the surface consists of
three layers: a passive film layer, a double layer and a biofilm layer, which includes
bacteria, extracellular polymeric substance (EPS) and ferrous sulfide. With increasing
exposure time, biofilm and FeS deposits accumulated. Moreover, these gradually
formed two layers: a layer of ferrous sulfide and a layer of bacteria and EPS (Figure
5.6 b). It is confirmed by a four-time constant fit after 28 days of immersion (Figure
5.8 d).
On the 49th day, biofilm detachment occurred, a phenomenon consistent with the
AFM images (Figure 5.2 e). The EIS result is consistent with the AFM images in that

Chapter 5 Sulphate Reducing Bacteria Biofilm and its Induced Biocorrosion of Stainless Steel AISI 316
98
a three-time constants model fits quite well for the coupons after 49 and 56 days of
immersion. Thereafter, the biofilm grew again. On the 70th day of immersion, another
layer of biofilm was developed on the SS316 surface (Figure 5.9 c2).
Compared with the coupons in EASW with D. desulfuricans, the coupons in
EASW with D. singaporenus also experienced a process in which the corrosion
impedance first decreased (Figure 5.9 c1) and then increased (Figure 5.9 c2). This
increase is also due to the accumulation of a ferrous sulfide (Figure 5.6 b). This
however appeared only after immersion for 49 days, which was much later than for D.
desulfuricans.
5.2.4 Comparison of the Coupons with and without SRB
To compare the influence of SRB on SS316 in EASW, two typical sets of
parameters from the equivalent circuit models on the 14th day and the 35th day are
selected in Table 5.1. The solution resistance Rs is quite low. This is due to the good
conductivity in the presence of many salts in the artificial seawater. The electrolyte
resistance depends on the ionic concentration, the type of ions and temperature. The
resistance of the passive film, Rpf, decreases slightly with exposure time. At the same
time, the roughness parameter of the passive film, n1, decreases from 0.90 to 0.87 for
control samples. The sample with SRB decreases much more rapidly. On the 35th day,
it reaches 0.56 and 0.69 for the D. desulfuricans and D. singaporenus respectively.
The decrease in n1 indicates that the passive film is becoming increasingly porous.
The resistance of the double layer, Rct, for control samples is high, and decreases

Chapter 5 Sulphate Reducing Bacteria Biofilm and its Induced Biocorrosion of Stainless Steel AISI 316
99
slightly with exposure time. The very high value of Rct implies a high corrosion
resistance. The charge transfer resistance, Rct, is a parameter to characterize the
corrosion rate. For the sample with the D. desulfuricans and D. singaporenus, a
significant reduction in Rct with exposure time occurred. On the 35th day, Rct reaches
1.5 and 2.9 kΩ, respectively. Meanwhile, n2 of SRB also decreases more than the
control sample due to the increase in the heterogeneity in the double layer and a more
active charge transfer process has taken place. The increase in the electrical double
layer heterogeneity is due to the heterogeneous distribution of the biofilm and the
initiation of localized corrosion. The presence of SRB can generate a significant
amount of hydrogen sulfide, which increases the active charge transfer by reacting
with a ferrous ion to form a ferrous sulfide deposit. The reduced sulfur compounds
thus enhance localized corrosion of stainless steel by inducing pitting corrosion
(Ismail et al., 1999).
The resistance Rb of the biofilm increases during the exposure period, and
assumes a larger magnitude compared with Rct on the 35th day. This result
corroborates the work of González et al. (1998) Such an increase may stem from the
accumulation of FeS and Fe(OH)2 inside the biofilm pores. The increasing Rb lends
evidence to the protective nature of the biofilm with exposure time.

Chapter 5 Sulphate Reducing Bacteria Biofilm and its Induced Biocorrosion of Stainless Steel AISI 316
100
Table 5.1 Parameters of EIS for the samples in EASW or EASW with SRB after 14 and 35 days of immersion.
Control D. desulfuricans D. singaporenus Samples
14th day 35th day 14th day 35th day 14th day 35th day Rs (Ω) 32.5 40.8 45.3 47.6 46.9 47.8 Rpf (Ω) 936.7 873.2 815.4 800.8 873.6 798.1 Ypf (μΩ-1sn1) 6.9 8.3 4.9 9.3 7.5 8.8 n1 0.90 0.87 0.73 0.56 0.78 0.69 Rct (kΩ) 102.5 76.8 37.4 1.5 96.6 2.9 Ydl (μΩ-1sn2) 5.4 9.8 1.0 9.4 1.1 7.5 n2 0.76 0.75 0.68 0.41 0.66 0.59 Rpit or Rb (kΩ) - 1.6 19.0 45.5 13.6 20.1 Y3 (μΩ-1sn3) - 1.2 2.9 1.4 1.4 4.9 n2 - 0.87 0.62 0.69 0.41 0.35 Rf (kΩ) - - - - - 27.8 Yf(μΩ-1sn4) - - - - - 1.1 n4 - - - - - 0.68
5.3 Summary
The biofilm development and pit formation on the surface of SS316 was studied
by both AFM and EIS. AFM images and EIS modeling results show that the biofilm
formed by D. desulfuricans accumulated with exposure time, while the biofilm
formed by D. singaporenus underwent attachment, growth, subsequent detachment
and reattachment. Moreover, the biofilm induced by different SRB strains shows
different morphology and polarization resistance. The biofilm formed by D.
singaporenus was compact and crystal-like, while that by D. desulfuricans was porous
and net-like which induced a faster corrosion on the surface of SS316. Pits were
found on the steel surface. Pits with a curved-rod shape suggest a direct role of SRB
cells on the localized corrosion. Furthermore, equivalent circuit models from EIS
results bear out the presence of biofilm on the metal surface for both D. desulfuricans
Chapter 5 Sulphate Reducing Bacteria Biofilm and its Induced Biocorrosion of Stainless Steel AISI 316
101
and D. singaporenus. However, an additional layer of iron sulfide deposit on the steel
surface was formed in the presence of D. singaporenus.
Chapter 6 Biofilm and Biocorrosion Inhibition Using Layer-By-Layer Coating
102
CHAPTER 6 BIOFILM AND BIOCORROSION INHIBITION
USING LAYER-BY-LAYER COATING
The previous chapter has shown that in seawater, the presence of SRB
dramatically increased the corrosion of SS316. Hence, it is crucial to develop methods
to inhibit the MIC of SS316 induced by SRB. In the recent years, a newly developed
method for coating a substrate with antibacterial chemicals using a layer-by-layer
technique has been developed to effectively control biofilm formation in the medical
area. However, its potential application to control MIC has never been studied.
In this chapter, this layer-by-layer coating with alternative layers of quaternized
polyethylenimine (q-PEI) and poly(acrylic)acid (PAA) on a SS316 substrate was
investigated. The chemical nature and stability of the polyelectrolyte multilayers
(PEM) was monitored using XPS and static water contact angle measurements. The
antibiocorrosion ability of PEM on stainless steel was further assessed using CLSM,
AFM and linear polarization techniques.
6.1 Surface Functionalization of SS316 and the Stability of the Multilayers
Successful deposition of q-PEI and PAA layers on the metal substrates would
modify the hydrophilicity of water on the substrate, i.e. the contact angle of water
would be changed with each successful deposition of q-PEI or PAA layer. Figure 6.1
shows the contact angles of SS316 after the deposition of each layer.
The average contact angle for pristine stainless steel was 49.8o (Figure 6.1).

Chapter 6 Biofilm and Biocorrosion Inhibition Using Layer-By-Layer Coating
103
With the deposition of the first layer of PEI, the contact angle of the surface increased
to 68.5o, and then dropped to 32o with the subsequent deposition of PAA. Upon the
formation of a next layer of q-PEI, the contact angle was found to be 69o. These
values are consistent with that reported in literature (Shi et al., 2006). A trend of
alternating contact angles was found, following the deposition of q-PEI and PAA
multi-layers. This trend indicates the success of subsequent deposition of the q-PEI
and PAA layers on the SS316 substrates.
0 2 4 6 8 10 120
10
20
30
40
50
60
70
80
Con
tact
ang
le (o )
Number of layers
Figure 6.1 Contact angle measurements for the different layers of coating.
The stability of the q-PEI/PAA multilayers was examined in order to ascertain if
the layers would peel off from the substrates’ surface after immersion of the
functionalized SS316 coupons in filter-sterilized EASW. The average contact angle of
the functionalized SS316 before immersion in artificial seawater was 67.7o. The
coupons were retrieved from artificial seawater and rinsed with distilled water for 1
minute and dried with nitrogen gas for 5 minutes before any measurements were
taken. From Figure 6.2, it is evident that the contact angles of the functionalized

Chapter 6 Biofilm and Biocorrosion Inhibition Using Layer-By-Layer Coating
104
stainless steels remained between 60-70o over 14 days, thus indicating that the final
layer on the substrate was always q-PEI. This result suggests that the coating was
relatively stable, and that the q-PEI/PAA multi-layers did not peel off from the SS316
surface.
0 2 4 6 8 10 12 140
10
20
30
40
50
60
70
80
Con
tact
ang
le (o )
Duration (day)
Stability test for the mutilayer coating on SS316
Figure 6.2 The stability test of the functionalized SS316 in EASW.
6.2 XPS Analysis of the Functionalized Stainless Steel
The deposition of q-PEI/PAA multilayers on stainless steel was examined using
XPS spectra. From Figure 6.3, the emergence of nitrogen (N 1s) peak at about 400 eV
and the increase of the intensity of spectra C 1s indicate that the SS316 has been
functionalized with the coating (Figure 6.3 b). In comparison, there is no obvious
nitrogen peak for the pristine SS316 (Figure 6.3 a).

Chapter 6 Biofilm and Biocorrosion Inhibition Using Layer-By-Layer Coating
105
1200 1000 800 600 400 200 0-500
0
500
1000
1500
2000
2500
3000
3500
4000 Fe 2p
O 1s
C 1sInte
nsity
Binding energy (eV)
pristine stainless steel
1200 1000 800 600 400 200 0
0
200
400
600
800
1000
1200
1400
Fe 2p
O1s
N1s
C1s
Inte
nsity
Binding energy (eV)
coated stainless steel
Figure 6.3 XPS wide scan for (a) the pristine SS316 and (b) q-PEI/PAA multibilayers of the functionalized SS316.
Figure 6.4 shows the nitrogen (N 1s) spectra for both the pristine and the
functionalized SS316. The total peak area for N 1s of the pristine SS316 is only 520.9,
while that for the functionalized SS316 is 1490.6. The much larger peak area of N 1s
spectra on the functionalized SS316 suggests the successful deposition of the
multilayers. The functionalized SS316 has two peaks for N 1s spectra; the first peak
of N 1s at 398.94 eV is attributed to the amide group, R-NH-R, in the PEI chain, and
the second peak at 401.51 eV is attributed to the positively charged nitrogen (N+) in
q-PEI. The N+/N ratio was then calculated from the spectra to be 0.311, which implies
that only about 31.1% of nitrogen was quaternized. This is lower than the value of
42% reported by Shi et al. (2006).
(a) (b)
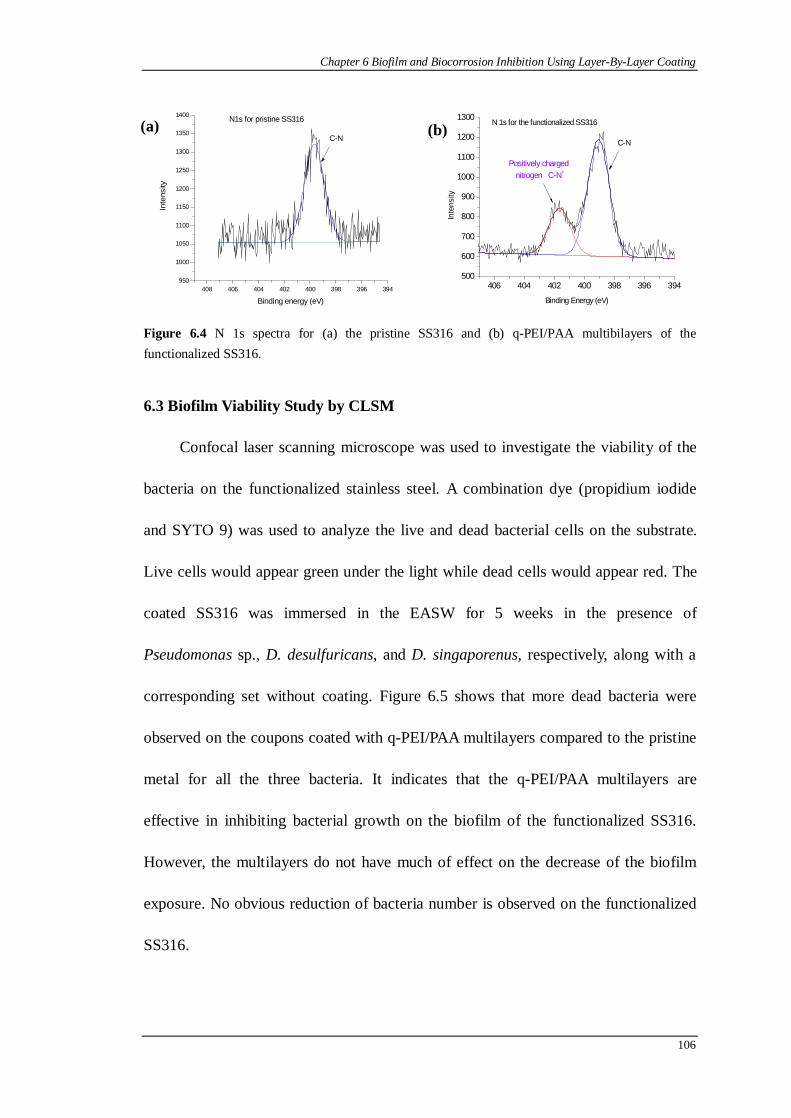
Chapter 6 Biofilm and Biocorrosion Inhibition Using Layer-By-Layer Coating
106
408 406 404 402 400 398 396 394950
1000
1050
1100
1150
1200
1250
1300
1350
1400
C-N
N1s for pristine SS316
Inte
nsity
Binding energy (eV)
406 404 402 400 398 396 394500
600
700
800
900
1000
1100
1200
1300 N 1s for the functionalized SS316
C-N
Positively charged nitrogen C-N+
Inte
nsity
Binding Energy (eV)
Figure 6.4 N 1s spectra for (a) the pristine SS316 and (b) q-PEI/PAA multibilayers of the functionalized SS316.
6.3 Biofilm Viability Study by CLSM
Confocal laser scanning microscope was used to investigate the viability of the
bacteria on the functionalized stainless steel. A combination dye (propidium iodide
and SYTO 9) was used to analyze the live and dead bacterial cells on the substrate.
Live cells would appear green under the light while dead cells would appear red. The
coated SS316 was immersed in the EASW for 5 weeks in the presence of
Pseudomonas sp., D. desulfuricans, and D. singaporenus, respectively, along with a
corresponding set without coating. Figure 6.5 shows that more dead bacteria were
observed on the coupons coated with q-PEI/PAA multilayers compared to the pristine
metal for all the three bacteria. It indicates that the q-PEI/PAA multilayers are
effective in inhibiting bacterial growth on the biofilm of the functionalized SS316.
However, the multilayers do not have much of effect on the decrease of the biofilm
exposure. No obvious reduction of bacteria number is observed on the functionalized
SS316.
(a) (b)

Chapter 6 Biofilm and Biocorrosion Inhibition Using Layer-By-Layer Coating
107
Figure 6.5 CLSM images for the biofilm on (1) the pristine, and (2) the functionalized SS316 in EASW for 5 weeks with (a) Pseudomonas sp., (b) D. desulfuricans, and (c) D. singaporenus.
(a2) (a1)
(b1) (b2)
(c1) (c2)

Chapter 6 Biofilm and Biocorrosion Inhibition Using Layer-By-Layer Coating
108
6.4 Biofilm and Biocorrosion Study Using AFM
The surface roughness of the biofilm was quantified using AFM analysis. Figure
6.6 shows that with time, the biofilm surface roughness increased for both the pristine
and the functionalized SS316. However, the surface roughness of the biofilm on the
functionalized stainless steel was generally lower compared to that on the pristine
SS316 (at 0.05 confidence level). This observation is consistent with the CLSM
images that the q-PEI/PAA multilayers have an effect on decreasing the biofilm
formation on the substrate surface. This is because of the antibacterial property of
q-PEI, and hence the decreases in the activity of bacteria. Therefore, the effectiveness
of the multilayers is reflected in the inhibition of bacterial growth.
0
50
100
150
200
250
Sur
face
roug
hnes
s (R
MS)
(µm
)
5 weeks3 weeks1 week
Pristine SS316 substrate
Pseudomonas sp. D. desulfuricans D. singaporenus
0
50
100
150
200
250
5 weeks3 weeks1 week
Sur
face
roug
hnes
s (R
MS
) (µm
)
Functionalized SS316 substrate
Pseudomonas sp. D. desulfuricans D. singaporenus
Figure 6.6 AFM surface roughness analysis for the biofilm on (a) the pristine SS316, and (b) the functionalized SS316 after immersing in EASW for 1, 3, and 5 weeks.
Pit volume was quantified using the AFM bearing analysis. Figure 6.7 shows
that the functionalized SS316 shows a reduced pit volume compared to the pristine
SS316. The functionalized SS316 coupon immersed in EASW with Pseudomonas sp.
for 1 week showed a much smaller pit volume (0.71 ± 0.11 μm3) than that on the
pristine one (0.02 ± 0.008 μm3). The q-PEI/PAA multilayers were also effective in
(a) (b)

Chapter 6 Biofilm and Biocorrosion Inhibition Using Layer-By-Layer Coating
109
reducing the biocorrosion induced by D. singaporenus; the pit volume of 0.048 ±
0.015 μm3 on the functionalized coupon was much smaller than that of the pristine
metal (0.72 ± 0.15 μm3) after 5 weeks of immersion. However, the anti-corrosion
effect for the coupons with D. desulfuricans was relatively weaker. With time, the pit
volume increased rapidly. After 5 weeks of immersion with D. desulfuricans, a pit
volume of 2.69 ± 0.08 μm3 was formed on the functionalized SS316 coupon, which is
only marginally smaller than the pit volume of 3.23 ± 0.30 μm3 in the pristine metal.
The reduction of pit volumes on the functionalized stainless steel coupons indicates
that the live bacteria plays a direct role on the localized corrosion (i.e. pitting), while
the dead bacteria has relatively lower corrosion effect on the stainless steel substrate.
This observation is consistent with the previous finding reported by Dinh et al. (2004)
that there is direct electron flow ways between live bacterial cells and iron substrate,
which thus induces the corrosion of iron.
0.0
0.5
1.0
1.5
2.0
2.5
3.0
3.5
4.0 Pristine stainless steel 316 substrate
Pseudomonas sp. D. desulfuricans D. singaporenus
5 weeks3 weeks1 week
Pit
volu
me
(µm
3 )
0.0
0.5
1.0
1.5
2.0
2.5
3.0
3.5
4.0
5 weeks3 weeks1 week
Pit
volu
me
(µm
3 )
Functionalized SS316 substrate
Pseudomonas sp. D. desulfuricans D. singaporenus
Figure 6.7 AFM bearing analysis for pit volume formed on (a) the pristine SS316, and (b) the functionalized SS316 after immersing in EASW for 1, 3, and 5 weeks.
(a) (b)

Chapter 6 Biofilm and Biocorrosion Inhibition Using Layer-By-Layer Coating
110
6.5 Biocorrosion Study Using Linear Polarization Analysis
The biocorrosion effect was further studied using a linear polarization analysis.
Table 6.1 shows the corrosion current of the pristine SS316 and the functionalized
SS316 in the presence of Pseudomonas sp., D. desulfuricans, and D. singaporenus,
respectively. It is evident that corrosion currents of the functionalized SS316
coupons were about ten times smaller than that without q-PEI/PAA multilayers in the
presence of each bacterium. It indicates that compared with the pristine metal, the
multilayers on the functionalized SS316 provide more effective corrosion protection
by reducing the corrosion current of the coupons, and thereby resulted in lower
biocorrosion of the functionalized metal.
Table 6.1 Corrosion current analysis on the pristine SS316 and the functionalized SS316 after immersion in EASW for 5 weeks.
Corrosion current (A) Pseudomonas sp. D. desulfuricans D. singaporenus Pristine SS316 1.0 x 10⁻⁵ 1.6 x 10⁻⁵ 1.7 x 10⁻⁵ Functionalized SS316 1.6 x 10⁻⁶ 1.8 x 10⁻⁶ 1.5 x 10⁻⁶
6.6 Summary
In this study, a newly developed method for coating a SS316 substrate with
antibacterial reagents using a layer-by-layer technique was investigated. The SS316
substrate was alternately coated with q-PEI and PAA to form multilayers on its
surface. XPS analysis showed the chemical nature of the PEM, and the contact
angle measurement revealed that the PEM remained stable after immersion in
seawater for 14 days. The antibiocorrosion ability of PEM on stainless steel was
assessed using an aerobic bacterium Pseudomonas sp. and two anaerobic SRB

Chapter 6 Biofilm and Biocorrosion Inhibition Using Layer-By-Layer Coating
111
bacteria, D. desulfuricans and D. singaporenus. Compared to the pristine SS316
substrate, the corrosion rates of the functionalized SS316 measured by linear
polarization were about ten times smaller in the PEM coated metals than the pristine
SS316. The volume of the pits, quantified by AFM, also decreased significantly.
Bacteria growth on the metal substrate was inhibited by the antibacterial effect of PEI
as shown by CLSM using LIVE/DEAD Baclight bacterial viability kits. These
results suggest that PEM shows potential application in the inhibition of biocorrosion
of metal substrates.

Chapter 7 Biofilm and Biocorrosion Inhibition Using an Organic Inhibitor
112
CHAPTER 7 BIOFILM AND BIOCORROSION INHIBITION
USING AN ORGANIC INHIBITOR
This chapter examined the use of an organic corrosion inhibitor,
2-Methyl-benzimidazole (MBI), to control both abiotic and biotic corrosion (induced
by SRB) of mild steel and SS316. The deposition of the inhibitor on the steel was
examined using XPS. Its corrosion inhibition effect was investigated using SEM,
CLSM, AFM, EIS and linear polarization techniques. Finally, the adsorption isotherm
of the inhibitor was also examined.
7.1 Evaluation of Organic Corrosion Inhibitor on Abiotic and Biotic Corrosion of
Mild Steel
7.1.1 XPS Analysis
The attachment of MBI on the mild steel was examined using XPS N 1s and Fe
2p spectra. XPS analysis was conducted in two stages of this investigation: (i) on the
mild steel immersed in the seawater without MBI; and (ii) on the mild steel in the
seawater with the addition of 1 mM MBI. Figure 7.1 and Figure 7.2 show the
respective spectra of N 1s and Fe 2p from these coupons.
N 1s spectra – XPS analysis revealed whether MBI has attached onto the steel
surface during exposure to the seawater in the presence of MBI. Figure 7.1 shows the
nitrogen (N 1s) spectra for both the pristine mild steel and the mild steel deposited
with MBI. The total peak area for N 1s spectra of the pristine mild steel is only 112.9,
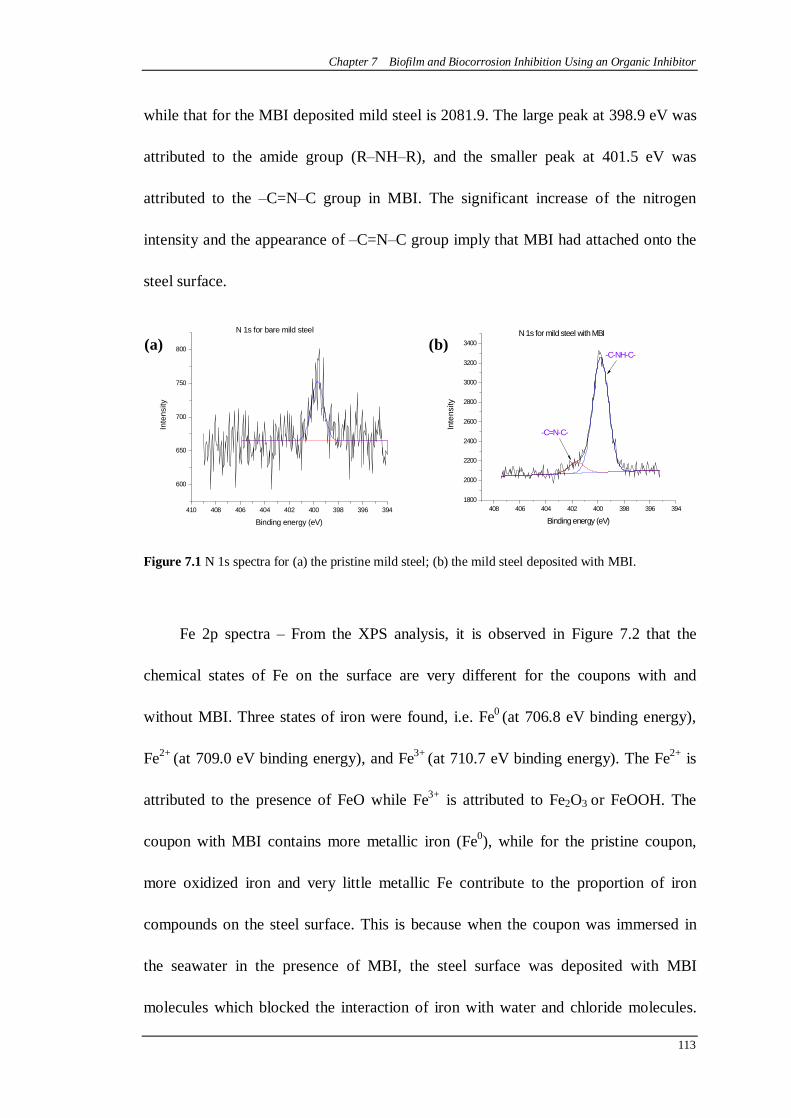
Chapter 7 Biofilm and Biocorrosion Inhibition Using an Organic Inhibitor
113
while that for the MBI deposited mild steel is 2081.9. The large peak at 398.9 eV was
attributed to the amide group (R–NH–R), and the smaller peak at 401.5 eV was
attributed to the –C=N–C group in MBI. The significant increase of the nitrogen
intensity and the appearance of –C=N–C group imply that MBI had attached onto the
steel surface.
410 408 406 404 402 400 398 396 394
600
650
700
750
800
N 1s for bare mild steel
Inte
nsity
Binding energy (eV)
408 406 404 402 400 398 396 3941800
2000
2200
2400
2600
2800
3000
3200
3400
-C-NH-C-
-C=N-C-
N 1s for mild steel with MBI
Inte
nsity
Binding energy (eV)
Figure 7.1 N 1s spectra for (a) the pristine mild steel; (b) the mild steel deposited with MBI.
Fe 2p spectra – From the XPS analysis, it is observed in Figure 7.2 that the
chemical states of Fe on the surface are very different for the coupons with and
without MBI. Three states of iron were found, i.e. Fe0 (at 706.8 eV binding energy),
Fe2+ (at 709.0 eV binding energy), and Fe3+ (at 710.7 eV binding energy). The Fe2+ is
attributed to the presence of FeO while Fe3+ is attributed to Fe2O3 or FeOOH. The
coupon with MBI contains more metallic iron (Fe0), while for the pristine coupon,
more oxidized iron and very little metallic Fe contribute to the proportion of iron
compounds on the steel surface. This is because when the coupon was immersed in
the seawater in the presence of MBI, the steel surface was deposited with MBI
molecules which blocked the interaction of iron with water and chloride molecules.
(b) (a)

Chapter 7 Biofilm and Biocorrosion Inhibition Using an Organic Inhibitor
114
On the other hand, in the absence of MBI the steel surface was easily oxidized. The
intensity of the metallic Fe peak increased for the coupon with MBI, and is therefore
indicative of the protection offered by the inhibitor.
745 740 735 730 725 720 715 710 705 700 695
2000
2200
2400
2600
2800
3000
3200
3400
Fe3+
Fe0
Inte
nsity
(a.u
.)
Binding Energy (eV)
Fe 2p for the pristine mild steel
745 740 735 730 725 720 715 710 705 700 6954000
4200
4400
4600
4800
5000
5200
5400
5600
5800
6000
Fe2+
Fe3+
Fe0
In
tens
ity (a
.u.)
Binding Energy (eV)
Fe 2p for the mild steel deposited with MBI
Figure 7.2 Fe 2p spectra for (a) the pristine mild steel; (b) the mild steel deposited with MBI.
7.1.2 Bacteria Concentration
In order to examine the influence of MBI on bacterial activity, the bacteria
concentration was counted using the most probable number (MPN) method. The
initial bacteria concentration was 108 cells/ml for both SRB strains. After culturing the
SRB for 7 days, the concentration in EASW was 9.3 x 10⁸ and 4.6 x 10⁸ cells/ml for
D. singaporenus and D. desulfuricans, respectively, while in EASW with the addition
of 1 mM MBI the concentration was 1.5 x 10⁸ and 4.3 x 10⁴ for D. singaporenus and
D. desulfuricans, respectively. It is evident that MBI was effective in inhibiting the
growth of the SRB. This effect is not unexpected, since it is known that
benzimidazole derivatives are highly inhibitory against certain microorganisms
(Bartlett et al., 1992), although it is noteworthy that 1 mM MBI was more effective in
(a) (b)

Chapter 7 Biofilm and Biocorrosion Inhibition Using an Organic Inhibitor
115
inhibiting the growth of D. desulfuricans compared with D. singaporenus.
7.1.3 EIS Analysis
The corrosion behavior of mild steel in EASW in the presence and absence of
MBI after an immersion for 24 hours was investigated using EIS at 37 oC. Nyquist
plots of mild steel in seawater are shown in Figure 7.3 a. It is evident that the addition
of MBI in EASW increases the polarization resistance of the metal (Figure 7.3 a). In
the presence of SRB, the MIC is reduced in the system with the organic inhibitor
(Figure 7.3 b and c). The EIS results can be interpreted in terms of the equivalent
circuit models of the electrical double layer as shown in Figure 7.4 (Tan et al., 2006).
As can be seen from Table 7.1, an increase in the concentration of MBI also increases
the charge transfer resistance. The inhibition efficiency (IE) is calculated using the
charge-transfer resistance:
ct
ctct
RRRIE '−
= (7.1)
where tcR is the charge transfer resistance of the mild steel in the presence of the
inhibitor, and 'ctR is the resistance of the mild steel in the absence of the inhibitor.
The inhibition efficiency increased with the MBI concentration, reaching a maximum
of 67.8% at 2.5 mM in EASW.
The corrosion of mild steel by the SRB (in the presence and absence of the
inhibitor) was also examined. The Nyquist plots are shown in Figure 7.3 (b) and (c)
and the parameters after fitting with the equivalent circuit model are presented in
Table 7.1. Results from the control experiments (i.e. without the inhibitor) show that
Chapter 7 Biofilm and Biocorrosion Inhibition Using an Organic Inhibitor
116
the corrosion resistance of the metal in the presence of D. desulfuricans and D.
singaporenus are not significantly dissimilar after immersion in the EASW for 24
hours, but are lower compared to the abiotic system. In the presence of MBI, the
inhibition efficiency was found to be greater in seawater with D. desulfuricans than
with D. singaporenus. The results showed that MBI inhibits MIC by D.
desulfuricans with an IE of 38.5% and 71.9% at 1 mM and 2.5 mM, respectively,
compared 18.7% and 45.6% for D. singaporenus. The difference in the inhibition
efficiency of MBI for these biotic systems may lie in the physical properties of the
bacteria. Significant slime was observed in the culture of D. singaporenus, indicating
that D. singaporenus excrete more extracellular polymeric substances (EPS). A lower
decrease in the bacterial number for D. singaporenus, which excrete more EPS, was
observed, compared to D. desulfuricans. It is therefore speculated that EPS may
confer protection against the MBI by combining with the inhibitor molecule. D.
desulfuricans on the other hand, excrete much less EPS, which thus confer less
protection. This observation is consistent with the above; D. singaporenus has a
higher cell density after the addition of MBI in EASW than D. desulfuricans.

Chapter 7 Biofilm and Biocorrosion Inhibition Using an Organic Inhibitor
117
0 500 1000 1500 2000 2500 3000
0
500
1000
1500
2000 Mild steel in EASW Mild steel in EASW with MBI 0.1mM Mild steel in EASW with MBI 0.5mM Mild steel in EASW with MBI 1mM Mild steel in EASW with MBI 2.5mM
-Z''
(ohm
)
Z' (ohm)0 100 200 300 400 500 600
0
100
200
300
400
500
600
-Z'' (
ohm
)
Z' (ohm)
Mild steel + D. singaporenus Mild steel + D. singaporenus + MBI 1mM Mild steel + D. singaporenus + MBI 2.5mM
0 100 200 300 400 500 6000
100
200
300
400
500
600
-Z'' (
ohm
)
Z' (ohm)
Mild steel + D.desulfuricans Mild steel + D.desulfuricans + MBI 1mM Mild steel + D.desulfuricans + MBI 2.5mM
Figure 7.3 Nyquist plots for mild steel in EASW for 24 hours (a) without bacteria; (b) with D. singaporenus; (c) with D. desulfuricans.
Figure 7.4 Equivalent circuit for the metal/liquid interface.
(Rs: solution resistance; Rct: charge transfer resistance; Qdl: capacitor of electrical double layer.)
(c)
(a) (b)

Chapter 7 Biofilm and Biocorrosion Inhibition Using an Organic Inhibitor
118
Table 7.1 Charge transfer resistance and corrosion inhibition efficiency parameters for the corrosion of mild steel in EASW with or without MBI.
Coupons Mild steel Mild steel + D. singaporenus Mild steel +D. desulfuricans MBI (mM) Rct (ohm) IE (%) Rct (ohm) IE (%) Rct (ohm) IE (%) 0 841 - 389 - 363 - 0.1 1075 21.7 - - - - 0.5 1904 55.8 - - - - 1 2071 59.4 479 18.7 590 38.5 2.5 2608 67.8 715 45.6 1291 71.9
7.1.4 Linear Polarization Analysis and Potentiodynamic Scanning Curves
Figure 7.5 shows Tafel polarization curves of the pristine mild steel electrode
and the MBI-treated mild steel in the sterile seawater and seawater in the presence of
the SRB. The deposition of the inhibitor MBI on the metal substrate marginally shifts
the corrosion potential of mild steel positively or negatively, while the inhibitor
strongly reduces the cathodic current density. In particular, for the sterile mild steel,
the cathodic reaction is inhibited to a larger extent than the anodic reaction. The
inhibitor is adsorbed on mild steel and acts as a cathodic inhibitor by retarding the
transfer of hydrogen and chloride from the bulk solution to the mild steel/solution
interface. Because amine inhibitors function as adsorbates, their inhibition
performance primarily relies on the adsorption bond between the atoms in the metal
and the inhibitor molecules (Sastri, 1998). The nitrogen atoms in the MBI molecule
have an affinity towards mild steel and anchor on the metal surface via the amine
bond. Nitrogen-containing organic heterocyclic compounds are considered to be
excellent chelate-forming substances with several transition metals (Ramesh, and
Rajeswari, 2005; Tan et al., 2006; Patel, 1972).

Chapter 7 Biofilm and Biocorrosion Inhibition Using an Organic Inhibitor
119
-0.9 -0.8 -0.7 -0.6 -0.5 -0.41E-8
1E-7
1E-6
1E-5
1E-4
1E-3
0.01
0.1
i (A
cm
-2)
E (V)
Mild steel in EASW Mild steel in EASW with MBI 0.1mM Mild steel in EASW with MBI 0.5mM Mild steel in EASW with MBI 1mM Mild steel in EASW with MBI 2.5mM
-0.9 -0.8 -0.7 -0.6 -0.5 -0.4 -0.3
1E-8
1E-7
1E-6
1E-5
1E-4
1E-3
0.01
0.1
i (A
cm
-2)
E (V)
mild steel + D. desulfuricans mild steel + D. desulfuricans + MBI 1mM mild steel + D. desulfuricans + MBI 2.5mM
-0.9 -0.8 -0.7 -0.6 -0.5 -0.4 -0.3
1E-7
1E-6
1E-5
1E-4
1E-3
0.01
0.1
i (A
cm
-2)
E (V)
mild steel + D. singaporenus mild steel + D. singaporenus + MBI 1mM mild steel + D. singaporenus + MBI 2.5mM
Figure 7.5 Tafel polarization curves of pristine mild steel and inhibited mild steel in EASW for 24 hours (a) without bacteria; (b) with D. desulfuricans; (c) with D. singaporenus.
Table 7.2 shows the corrosion current density, the corrosion potentials and the
corrosion rates, which are calculated from the Tafel plots in Figure 7.5. The corrosion
rate can be calculated from the corrosion current according to the following equation
(Tan et al., 2006):
)/()( 0.00328 (mm/year) rate Corrosion 3cmg
gMicorr ρ= (7.2)
Here, corri is the corrosion current density, ρ is the specimen density and M is
the atomic mass of the metal. The inhibition effect of MBI can be calculated from the
corrosion current density. It is obvious that the corrosion current densities of mild
steel coupons in the presence of MBI are lower than that without MBI for both the
(a) (b)
(c)

Chapter 7 Biofilm and Biocorrosion Inhibition Using an Organic Inhibitor
120
seawater with and without the SRB (Table 7.2). Accordingly, the inhibition efficiency
(IE) of MBI on mild steel can be calculated from the corrosion current density
(Ouyang et al., 2006):
100)'(×
−=
iiiIE (7.3)
In the above equation, 'i is the corrosion current density of the inhibitor-containing
mild steel, and i is that of the pristine mild steel. With an increasing MBI
concentration, the corrosion current density and the corrosion rate decrease, and the
inhibition efficiency increases. These results show a consistent trend with that
calculated from the charge transfer resistance (Table 7.1). MBI is more effective in
inhibiting biocorrosion caused by D. desulfuricans (with an inhibition efficiency of
85% in the presence of 2.5 mM of MBI). In general, a higher concentration of SRB
would lead to a more severe corrosion on the steel surface, since the bacteria produces
the deleterious hydrogen sulfide and directly accept electrons from metal substrate to
accelerate the anodic/cathodic reaction thereby enhancing corrosion. The higher
inhibition efficiency may be due to the higher bacteria inhibition effect of MBI on D.
desulfuricans; as mentioned earlier, the cell density of D. desulfuricans showed a
greater decrease than D. singaporenus after the addition of MBI.

Chapter 7 Biofilm and Biocorrosion Inhibition Using an Organic Inhibitor
121
Table 7.2 Electrochemical polarization parameters for pristine mild steel and inhibited mild steel calculated from Tafel plots.
Coupons MBI concentration (mM)
Ecorr (V) icorr (A/cm2) Corrosion rate (mm/year)
IE (%)
0 -0.677 2.06 x 10⁻⁵ 0.219 - 0.1 -0.684 1.22 x 10⁻⁵ 0.129 41.0 0.5 -0.697 1.13 x 10⁻⁵ 0.120 45.3 1 -0.691 7.56 x 10⁻⁶ 0.081 63.2
No bacteria
2.5 -0.682 5.16 x 10⁻⁶ 0.055 75.0 0 -0.605 2.83 x 10⁻⁴ 3.240 - 1 -0.598 2.37x 10⁻⁴ 2.720 16.1
D. singaporenus
2.5 -0.597 1.04 x 10⁻⁴ 1.190 52.6 0 -0.616 9.28 x 10⁻⁵ 1.070 - 1 -0.677 2.06 x 10⁻⁵ 0.219 77.8
D. desulfuricans
2.5 -0.687 1.39 x 10⁻⁵ 0.148 85.0
Potentiodynamic scanning (PDS) curves were plotted to investigate the metal
surface properties. Similar to Figure 7.5 a, the cathodic slopes of the PDS curves are
constant and the cathodic currents gradually decrease with the addition of MBI, which
indicates that MBI predominantly controls the cathodic reaction (Figure 7.6). For the
mild steel exposed to sterile EASW, the current density in the passivity region for the
coupon with 2.5 mM of MBI is clearly visible, indicating a slight decrease in the
anodic current. The passive film breakdown occurred at -0.2 V and was followed by a
gradual increase in the current. Its passive region is much larger than the region
without the addition of MBI, implying that it suffers less corrosion with the protection
of MBI.
The coupon in seawater with D. desulfuricans does not reveal an obvious
passivity region (Figure 7.6 b). The breakdown occurred suddenly and appeared as an
eruption in the anodic current. Such an instant increase (approximately ten-fold in the
anodic current from 3.6 x 10⁻⁵ A to 5.8 x 10⁻⁴ A at 0.15 V) may possibly be associated

Chapter 7 Biofilm and Biocorrosion Inhibition Using an Organic Inhibitor
122
with a situation in which the inner surface of well-developed pits located beneath the
corrosion products and the biofilm are exposed to the bulk solution after the biofilm
layer was disintegrated (Starosvetsky et al., 2001). However, the coupon with
protection from MBI has a much higher breakdown potential, and the anodic current
increases more slowly compared to that without MBI. The corrosion inhibition for the
coupon with D. singaporenus is not so obvious; the addition of MBI decreases the
anodic current only marginally.
1E-7 1E-6 1E-5 1E-4 1E-3 0.01-1.0
-0.8
-0.6
-0.4
-0.2
0.0
0.2
0.4
0.6
E (V
)
i (A cm-2)
mild steel mild steel + MBI 1mM mild steel + MBI 2.5mM
1E-9 1E-8 1E-7 1E-6 1E-5 1E-4 1E-3 0.01 0.1 1-1.0
-0.8
-0.6
-0.4
-0.2
0.0
0.2
0.4
0.6
E (V
)
i (A cm-2)
mild steel + D.desulfuricans mild steel + D.desulfuricans + MBI2.5 mM
1E-7 1E-6 1E-5 1E-4 1E-3 0.01 0.1-1.0
-0.8
-0.6
-0.4
-0.2
0.0
0.2
0.4
0.6
E (V
)
i (A cm-2)
mild steel +D. singaporenus mild steel +D. singaporenus + MBI 2.5 mM
Figure 7.6 Potentiodynamic scanning curves of mild steel exposed to EASW for 24 hours (a) without bacteria; (b) with D. desulfuricans; (c) with D. singaporenus.
7.1.5 SEM Analysis
The protection of mild steel afforded by MBI against corrosion caused by both
abiotic corrosion and MIC was corroborated by scanning electron microscopy (SEM).
(a) (b)
(c)

Chapter 7 Biofilm and Biocorrosion Inhibition Using an Organic Inhibitor
123
Figure 7.7 to Figure 7.9 show the appearance of polished mild steel at a magnification
of 1000 after 24 hours of immersion in EASW. Figure 7.7 shows that the surface of
the mild steel coupon was protected by MBI under sterile conditions; the coupon
without the addition of MBI is full of corrosion products, while the coupon with MBI
is smoother and contains fewer corrosion products. The surface of the coupons with D.
desulfuricans and D. singaporenus, which contains both corrosion products and the
biofilm, suffered more severe corrosion (Figure 7.7 a and Figure 7.9 a). The addition
of MBI in the bacterial solution successfully reduced the extent of corrosion (Figure
7.8 and Figure 7.9).
Figure 7.7 SEM images of mild steel in EASW for 24 hours (a) without MBI; (b) with MBI at 0.1 mM; (c) with MBI at 0.5 mM; (d) with MBI at 1 mM. (magnification x1,000)
d
ba
c
a

Chapter 7 Biofilm and Biocorrosion Inhibition Using an Organic Inhibitor
124
Figure 7.8 SEM images of mild steel in EASW with D. desulfuricans for 24 hours (a) without MBI; (b) with MBI at 1 mM; (c) with MBI at 2.5 mM. (magnification x1,000)
Figure 7.9 SEM images of mild steel in EASW with D. singaporenus for 24 hours (a) without MBI; (b) with MBI at 1 mM; (c) with MBI at 2.5 mM. (magnification x1,000)
ba
c
ba
c

Chapter 7 Biofilm and Biocorrosion Inhibition Using an Organic Inhibitor
125
The bacteria with and without the MBI was also observed using SEM at a
greater magnification (Figure 7.10). In the absence of MBI, the cell surface of D.
singaporenus was smooth (Figure 7.10 a), while in the presence of MBI in the
solution, the bacteria surface became much rougher and appeared to be flake-like
(Figure 7.10 b). This flake distribution is also observed on the steel in the presence of
600 ppm (4 mM) 2-mercaptobenzoimidazole (Morales-Gil et al., 2004). The possible
reason is that the extracellular polymeric substances (EPS), which were excreted by D.
singaporenus, combines with the inhibitor to protect the cells from the toxic inhibitor.
On the other hand, no flake-like structure was observed on the cell surface of D.
desulfuricans (Figure 7.10 c and d).
Figure 7.10 Biofilm on mild steel (a) D. singaporenus without MBI; (b) D. singaporenus with MBI at 1 mM; (c) D. desulfuricans without MBI; (d) D. desulfuricans with MBI at 1 mM.
ba
c d
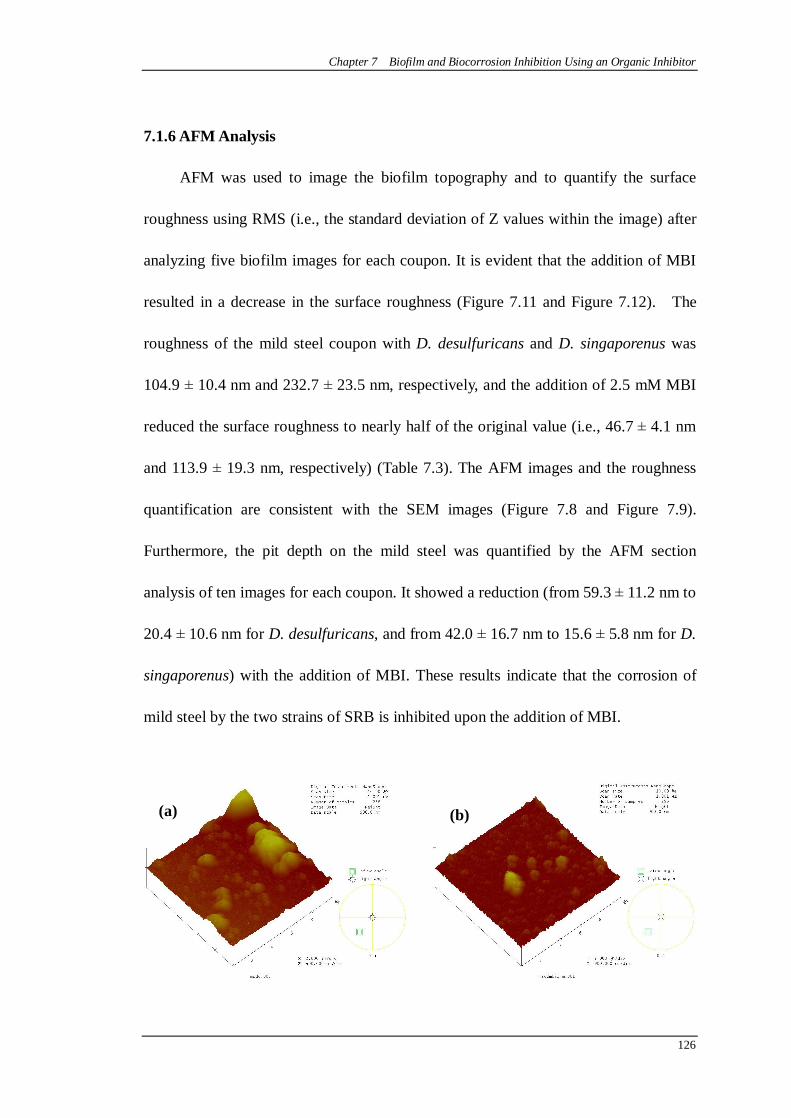
Chapter 7 Biofilm and Biocorrosion Inhibition Using an Organic Inhibitor
126
7.1.6 AFM Analysis
AFM was used to image the biofilm topography and to quantify the surface
roughness using RMS (i.e., the standard deviation of Z values within the image) after
analyzing five biofilm images for each coupon. It is evident that the addition of MBI
resulted in a decrease in the surface roughness (Figure 7.11 and Figure 7.12). The
roughness of the mild steel coupon with D. desulfuricans and D. singaporenus was
104.9 ± 10.4 nm and 232.7 ± 23.5 nm, respectively, and the addition of 2.5 mM MBI
reduced the surface roughness to nearly half of the original value (i.e., 46.7 ± 4.1 nm
and 113.9 ± 19.3 nm, respectively) (Table 7.3). The AFM images and the roughness
quantification are consistent with the SEM images (Figure 7.8 and Figure 7.9).
Furthermore, the pit depth on the mild steel was quantified by the AFM section
analysis of ten images for each coupon. It showed a reduction (from 59.3 ± 11.2 nm to
20.4 ± 10.6 nm for D. desulfuricans, and from 42.0 ± 16.7 nm to 15.6 ± 5.8 nm for D.
singaporenus) with the addition of MBI. These results indicate that the corrosion of
mild steel by the two strains of SRB is inhibited upon the addition of MBI.
(a) (b)

Chapter 7 Biofilm and Biocorrosion Inhibition Using an Organic Inhibitor
127
Figure 7.11 AFM images of mild steel in EASW with D. desulfuricans for 24 hours (a) without MBI; (b) with MBI at 1 mM; (c) with MBI at 2.5 mM.
Figure 7.12 AFM images of mild steel in EASW with D. singaporenus for 24 hours (a) without MBI; (b) with MBI at 1 mM; (c) with MBI at 2.5 mM.
(c)
(c)
(a) (b)

Chapter 7 Biofilm and Biocorrosion Inhibition Using an Organic Inhibitor
128
Table 7.3 AFM study of biofilm surface roughness and pit depth.
Coupons Roughness (nm) (RMS) Pit depth (nm) Mild steel + D. desulfuricans 104.9 ± 10.4 59.3 ± 11.2 Mild steel + D. desulfuricans + MBI (1 mM) 54.8 ± 8.6 40.3 ± 9.8 Mild steel + D. desulfuricans + MBI (2.5 mM) 46.7 ± 4.1 29.4 ± 10.6 Mild steel + D. singaporenus 232.7 ± 23.5 42.0 ± 16.7 Mild steel + D. singaporenus + MBI (1 mM) 172.2 ± 20.1 37.5 ± 12.4 Mild steel + D. singaporenus + MBI (2.5 mM) 113.9 ±19.3 15.6 ± 5.8
7.1.7 Adsorption Isotherm
In order to understand the mechanism of corrosion inhibition, it is necessary to
know the adsorption behavior of the organic adsorbate on the metal surface. The
degree of the surface coverage (θ ) for different concentrations of MBI has been
evaluated from electrochemical data. The fractional surface coverage ( θ ) is
represented by the following equation (Morales-Gil et al., 2004):
iii )'( −
=θ (7.4)
Here, 'i is the corrosion current density of the inhibited mild steel, and i is that of
the pristine mild steel. Different adsorption models were employed to determine
empirically the adsorption isotherm that best fits the surface coverage data. The
equations pertaining to the adsorption models are:
Temkin model: θfad eCK = (7.5)
Langmuir model: θ
θ−
=1
CK ad (7.6)
Freundlich model: θ=nadCK /1 (7.7)
Frumkin model: θ
θθ f
ad eCK )1
(−
= (7.8)
Here, Kad is the adsorption equilibrium constant, C is the concentration of inhibitor,
and f is the molecular interaction constant. The surface coverage values (θ ) were
Chapter 7 Biofilm and Biocorrosion Inhibition Using an Organic Inhibitor
129
determined graphically by fitting a suitable adsorption isotherm to explain the
behavior associated with the experimental results. Among these models, only the
Langmuir model (Figure 7.13) provides a good fit. The MBI molecule is adsorbed on
the mild steel surface due to the free electron pairs on the nitrogen atom. MBI was
adsorbed onto the metal surface via the amine group in the heterocyclic compound to
occupy the free surface sites on the metal. The smaller interference by chloride ions
may lead to a lower adsorption and inhibition of corrosion (Table 7.1 and Table 7.2).
The adsorption of some other inhibitors, such as 2-mercaptobenzoimidazole,
2,5-bis(3-pyridyl)-1,3,4-thiadiazole, 2,5- bis(3-pyridyl)-1,2,4-thiadiazole, and 3,5-
bis(2-thienyl)-4-amino-1,2,4-triazoles, has also been reported to follow the Langmuir
isotherm model when adsorbing onto mild steel (Bentiss et al., 2004; Tan et al., 2004;
Bentiss et al., 1999).
The standard free energy of adsorption ( adsoG∆ ) can be evaluated with the
following expression (Morales-Gil et al., 2004):
)ln( adadso KRTG −=∆ (7.9)
The MBI adsorption parameters were calculated from the fitting procedure of
the Langmuir adsorption equation to the experimental data. The free energy of
adsorption is calculated to be -17 kJ/mol for MBI, which indicates that the inhibitor
can easily adsorb onto the metal surface. Usually the adsorption free energy involved
in a chemisorption process is more negative than -25 kJ/mol (Geler and Azambuja,
2000). This means that MBI protects mild steel through physical adsorption to
compete with the aggressive species (i.e., chloride, hydrogen).

Chapter 7 Biofilm and Biocorrosion Inhibition Using an Organic Inhibitor
130
0.0 0.5 1.0 1.5 2.0 2.5 3.00
1
2
3
4
Experimental data Theoretical value by Langmuir model
C/ θ
C (mM)
Figure 7.13 The application of the Langmuir isotherm model to the corrosion protection behavior of MBI to mild steel.
7.2 Evaluation of Organic Corrosion Inhibitor on Abiotic and Biotic Corrosion of
SS316
7.2.1 EIS Analysis
The corrosion behavior of SS316 in EASW in the presence and in the absence of
MBI after an immersion for 1 week at 37 oC was investigated using EIS. Nyquist plots
of SS316 in seawater are shown in Figure 7.14. It is manifest that the addition of MBI
in EASW increases the polarization resistance of the SS316 (Figure 7.14 a). In the
presence of SRB, the MIC is reduced in the system with the organic inhibitor (Figure
7.14 b and c). The sterile SS316 without inhibitor exhibits Warburg impedance, which
can be attributed to the hydrogen transport from the bulk solution to the SS316
surface in the anaerobic environment. It indicates that the corrosion process is
controlled by the mass transport of hydrogen to the metal/solution interface.
The EIS results were interpreted in terms of the equivalent circuit model of the
electrical double layer Rs(QdlRct) (Tan et al., 2006). Table 7.4 lists the parameters of

Chapter 7 Biofilm and Biocorrosion Inhibition Using an Organic Inhibitor
131
charge transfer resistance (Rct) and corrosion inhibition efficiency (IE) after fitting
with the model. As can be seen from Table 7.4, an increase in the concentration of the
inhibitor MBI induces the increase the charge transfer resistance. The inhibition
efficiency is calculated using the charge transfer resistance from Equation 7.1. The
inhibition efficiency increased with the MBI concentration, reaching a maximum
(99.47 %) at 1 mM of MBI in EASW.
The corrosion of SS316 by the SRB (in the presence and in the absence of the
inhibitor) was also examined. The Nyquist plots are shown in Figure 7.14 b and c and
the parameters after fitting with the above equivalent circuit model are presented in
Table 7.4. Results from the control experiments (i.e. without the inhibitor) show that
the corrosion resistance of the metal in the presence of D. desulfuricans and D.
singaporenus are lower compared to the abiotic system. In the presence of MBI in
seawater with D. desulfuricans, the inhibition efficiency was found to be similar to
the system with D. singaporenus (IE of 93.96% and 95.55% for D. desulfuricans and
D. singaporenus, respectively, with 1 mM MBI). However, the coupon reached high
IE with 0.1 mM MBI for D. desulfuricans, while for D. singaporenus, the IE was still
low with 0.1 mM MBI. It reached high IE (91.02%) only when 0.5 mM of MBI was
added. The difference in the inhibition efficiency of MBI for these two biotic
systems may be dependent on the physical properties of the bacteria. D. singaporenus
excrete more extracellular polymeric substances (EPS) than D. desulfuricans, thus
combine more MBI with EPS which results in less protection efficiency.

Chapter 7 Biofilm and Biocorrosion Inhibition Using an Organic Inhibitor
132
0 50000 100000 150000 200000 2500000
50000
100000
150000
200000
250000
Warburg impendance
Z'' (
ohm
)
Z' (ohm)
SS316 SS316 + MBI 0.005mM SS316 + MBI 0.01mM SS316 + MBI 0.05mM SS316 + MBI 0.1mM SS316 + MBI 0.5mM SS316 + MBI 1mM
0 5000 10000 15000 20000 250000
10000
20000
30000
40000
50000
Z'' (
ohm
)
Z' (ohm)
SS316 + D. desulfuricans SS316 + D. desulfuricans + MBI 0.1mM SS316 + D. desulfuricans + MBI 0.5mM SS316 + D. desulfuricans + MBI 1mM
0 20000 40000 60000 80000 1000000
5000
10000
15000
20000
25000
30000
35000
40000
45000
50000
Z'' (
ohm
)
Z' (ohm)
SS316 + D. singaporenus SS316 + D. singaporenus + MBI 0.1mM SS316 + D. singaporenus + MBI 0.5mM SS316 + D. singaporenus + MBI 1mM
Figure 7.14 Nyquist plots for SS316 in EASW for 1 week (a) without bacteria; (b) with D. desulfuricans; (c) with D. singaporenus.
Table 7.4 Charge transfer resistance and corrosion inhibition efficiency parameters for the corrosion of SS316 in EASW with or without MBI.
Bacteria MBI concentration
(mM)
Rct (kohm)
Inhibition efficiency (%)
0 15.67 - 0.1 209 92.50 0.5 348 95.49
Sterile 1 2950 99.47
0 6.82 - 0.1 90.5 92.46 0.5 110.9 93.85
D. desulfuricans 1 112.9 93.96
0 4.49 - 0.1 6.93 35.21 0.5 50.04 91.02
D. singaporenus 1 100.93 95.55
(c)
(a) (b)
Chapter 7 Biofilm and Biocorrosion Inhibition Using an Organic Inhibitor
133
7.2.2 Linear Polarization Analysis
Table 7.5 shows the corrosion current density, the corrosion resistant and the
corrosion rates, which are calculated from the Tafel plots. It is obvious that the
corrosion current densities of SS316 coupons in the presence of MBI are lower than
those without MBI for both the seawater with and without the SRB (Table 7.5).
Accordingly, the inhibition efficiency of the inhibitor MBI on SS316 is calculated
from the corrosion current density (Equation 7.2). With the increasing of MBI
concentration, the corrosion current density and the corrosion rate decrease, and the
inhibition efficiency increases. These results show a consistent trend with those
calculated from the charge transfer resistance (Table 7.4). MBI is effective in
inhibiting biocorrosion of SS316 caused by both D. desulfuricans and D.
singaporenus with an IE larger than 90%. This indicates the inhibitor was adsorbed on
the steel surface and effectively retarded the transfer of hydrogen and chloride from
the bulk solution to the steel/solution interface. However, the high inhibition
efficiency for D. singaporenus appeared when 0.5 mM MBI was added, similar to the
EIS result.

Chapter 7 Biofilm and Biocorrosion Inhibition Using an Organic Inhibitor
134
Table 7.5 Electrochemical polarization parameters calculated from Tafel plots for the pristine SS316 and the SS316 with MBI.
Coupons MBI concentration (mM)
Rp (ohm) icorr (A/cm2) Corrosion rate (mm/year)
IE (%)
0 2.04 x 10⁴ 1.46 x 10⁻⁵ 3.41 x 10⁻⁴ - 0.005 2.47 x 10⁴ 5.86 x 10⁻⁶ 1.37 x 10⁻⁴ 59.9 0.01 3.19 x 10⁴ 1.54 x 10⁻⁶ 3.60 x 10⁻⁵ 89.5 0.05 1.03 x 10⁵ 9.24 x 10⁻⁷ 2.16 x 10⁻⁵ 93.7 0.1 2.09 x 10⁵ 7.87 x 10⁻⁷ 1.84 x 10⁻⁵ 94.6 0.5 3.92 x 10⁵ 3.25 x 10⁻⁷ 7.59 x 10⁻⁶ 97.8
No bacteria
1 4.31 x 10⁵ 2.22 x 10⁻⁷ 5.19 x 10⁻⁶ 98.5 0 5.86 x 10³ 5.17 x 10⁻⁴ 1.21 x 10⁻² - 0.1 9.59 x 10³ 3.17 x 10⁻⁴ 7.41 x 10⁻³ 38.7 0.5 3.44 x 10⁴ 3.27 x 10⁻⁵ 7.64 x 10⁻⁴ 93.7 1 1.16 x 10⁵ 1.94 x 10⁻⁶ 4.53 x 10⁻⁵ 99.6
D. singaporenus
2.5 1.55 x 10⁵ 1.13 x 10⁻⁷ 2.64 x 10⁻⁶ 99.9 0 4.69 x 10³ 8.51 x 10⁻⁴ 1.99 x 10⁻² - 0.1 3.26 x 10⁴ 6.54 x 10⁻⁵ 1.53 x 10⁻³ 92.3 0.5 9.09 x 10⁵ 4.54 x 10⁻⁶ 1.06 x 10⁻⁴ 99.5 1 1.13 x 10⁵ 1.18 x 10⁻⁶ 2.76 x 10⁻⁵ 99.9
D. desulfuricans
2.5 2.90 x 10⁵ 8.02 x 10⁻⁷ 1.87 x 10⁻⁵ 99.9
7.2.3 CLSM Analysis
The adhesion of SRB on the SS316 surface was visualized by CLSM. Figure
7.15 and Figure 7.16 show the appearance of bacteria on the SS316 coupons after 1
week of immersion in EASW. It is obvious that the bacterial number of both D.
desulfuricans and D. singaporenus attached onto the SS316 surface decreased with
the addition of MBI. SRB adhered to a greater extent on the SS316 without MBI,
while much fewer bacteria attached on the coupons in the presence of MBI in
seawater. These images are consistent with the electrochemical results that the fewer
bacteria adhered on the SS316 surface, the less corrosion. This is because the SRB
have direct interaction with steel surface (Dinh et al., 2004). The reduction of direct

Chapter 7 Biofilm and Biocorrosion Inhibition Using an Organic Inhibitor
135
interaction between SS316 and SRB alleviates the corrosion on the metal surface.
Figure 7.15 CLSM images of SS316 in EASW (a) with D. desulfuricans; (b) with D. desulfuricans + MBI (1 mM); (c) with D. desulfuricans + MBI (2.5 mM).
(c)
(a) (b)

Chapter 7 Biofilm and Biocorrosion Inhibition Using an Organic Inhibitor
136
Figure 7.16 CLSM images of SS316 in EASW (a) with D. singaporenus; (b) with D. singaporenus + MBI (1 mM); (c) with D. singaporenus + MBI (2.5 mM).
7.2.4 AFM Analysis
AFM was used to image the biofilm topography and to quantify the surface
roughness (RMS, i.e. the standard deviation of Z values within the image) under AFM
section analysis. It is evident that the addition of MBI resulted in a decrease in the
surface roughness (Figure 7.17 and Table 7.6). The roughness of the SS316 coupon
with D. desulfuricans and D. singaporenus was 32.69 ± 6.06 nm and 25.77 ± 5.40 nm,
respectively, and the addition of 1 mM MBI reduced the surface roughness to nearly
(a) (b)
(c)

Chapter 7 Biofilm and Biocorrosion Inhibition Using an Organic Inhibitor
137
half of the original value (i.e., 16.23 ± 2.77 nm and 20.94 ± 3.88 nm, respectively).
The AFM images and the roughness quantification are consistent with the CLSM
images (Figure 7.15 and Figure 7.16) that the addition of MBI decreased the number
of bacteria attached on the SS316 surface and reduced the steel corrosion.
Furthermore, the pit depth on the SS316, quantified by the AFM section analysis,
showed a reduction (from 31.07 ± 13.81 nm to 18.25 ± 6.93 nm for D. desulfuricans,
and from 15.50 ± 4.83 nm to 11.94 ± 4.74 nm for D. singaporenus, with the addition
of 1 mM MBI). These results indicate that the corrosion of SS316 by the two strains
of SRB is inhibited with the addition of MBI.
Figure 7.17 AFM images of SS316 in EASW (a) with D. desulfuricans, (b) with D. desulfuricans + MBI 1 mM, (c) with D. singaporenus, (d) with D. singaporenus + MBI 1 mM for 1 week.
(a)
(c) (d)
(b)

Chapter 7 Biofilm and Biocorrosion Inhibition Using an Organic Inhibitor
138
Table 7.6 AFM study of biofilm surface roughness and pit depth.
Coupons Roughness (nm) (RMS) Pit depth (nm) SS316 + D. desulfuricans 32.69 ± 6.06 31.07 ± 13.81 SS316 + D. desulfuricans + MBI (1 mM) 16.23 ± 2.77 18.25 ± 6.93 SS316 + D. desulfuricans + MBI (2.5 mM) 13.15 ± 5.11 15.82 ± 4.21 SS316 + D. singaporenus 25.77 ± 5.40 15.50 ± 4.83 SS316 + D. singaporenus + MBI (1 mM) 20.94 ± 3.88 11.94 ± 4.74 SS316 + D. singaporenus + MBI (2.5 mM) 17.80 ±1.79 8.32 ± 3.18
7.2.5 Adsorption Isotherm
The adsorption behavior of the organic inhibitor onto the metal surface was
investigated to better understand its mechanism of corrosion inhibition. The degree of
the surface coverage (θ ) for different concentrations of MBI has been evaluated from
electrochemical polarization data as before. Four different adsorption models (i.e.,
Temkin’s model, Langmuir’s model, Freundlich’s model, and Frumkin’s model) were
employed to empirically determine which adsorption isotherm fits the surface
coverage data the best. Fitting results showed that only the Langmuir model (Figure
7.18) provides a good fit among these models. This result shows that the adsorption of
MBI to the SS316l is similar to its adsorption to the mild steel. The heterocyclic MBI
may adsorb through the interactions between the nitrogen atoms in MBI and iron to
occupy the free surface sites on the metal to form a monolayer. Corrosion is inhibited
by blocking the interaction of the metal with chloride and hydrogen ions.

Chapter 7 Biofilm and Biocorrosion Inhibition Using an Organic Inhibitor
139
0.0 0.2 0.4 0.6 0.8 1.0
0.0
0.2
0.4
0.6
0.8
1.0
1.2 Experimental data Theoretical value by Langmuir model
C/θ
C (mM)
Figure 7.18 The application of the Langmuir isotherm model to the corrosion protection behavior of MBI to SS316.
The standard free energy of adsorption ( adsoG∆ ) can be evaluated from the
fitting value of Kad. The free energy of adsorption to SS316 is calculated to be -12.2
kJ/mol for MBI, which is similar to the adsorption energy of MBI to mild steel, i.e.
-17 kJ/mol. This means that like mild steel, MBI protects SS316 also through
physical adsorption to compete with the aggressive species (i.e. chloride, hydrogen).
7.3 Summary
The application of organic inhibitor MBI to control the abiotic corrosion and
biotic corrosion induced by SRB was investigated. From the corrosion point of view,
MBI was an effective inhibitor in the control of corrosion of both mild steel and
SS316 in the sterile seawater and in the seawater in the presence of SRB. MBI
predominantly inhibited the cathodic reaction. The corrosion inhibition by MBI was
more effective for corrosion caused by D. desulfuricans than that caused by D.

Chapter 7 Biofilm and Biocorrosion Inhibition Using an Organic Inhibitor
140
singaporenus. For the biocorrosion caused by SRB, the corrosion control was partly
due to the inhibition of bacterial activity and the reduction of bacterial attachment on
the steel surface. The adsorption of MBI on both mild steel and SS316 surface obeyed
the Langmuir adsorption isotherm.

Chapter 8 Conclusions and Recommendations
141
CHAPTER 8 CONCLUSIONS AND RECOMMENDATIONS
8.1 Conclusions
This research investigated the isolation of a new strain of sulphate-reducing
bacteria from local seawater and the characterization of its morphological,
physiological and phylogenetic properties. The biofilm formation and the induced
biocorrosion by this marine isolate were studied and compared with that of a common
SRB Desulfovibrio desulfuricans. The application of a new organic inhibitor and a
layer-by-layer coating technique was investigated to examine their effectiveness in the
inhibition of biofilm formation and the biocorrosion of metals.
The new strain of sulphate-reducing bacteria, designated Desulfovibrio
singaporenus strain SJI1, was isolated from local seawater near St. John’s Island in
Singapore. Cells were characterized and found to be rod, curved-shaped, 0.5 x 1-2 μm
in size, motile with a single polar flagellum, and Gram-negative. Results showed that
this SRB could utilize the following organic compounds: acetate, lactate, pyruvate,
propionate, hydrogen, methanol, ethanol, butanol, propanol, glycerol, succinate,
malate, formate, fructose, glucose, and cysteine as electron donors, with sulphate,
sulfite, thiosulfate, and elemental sulfur as the electron acceptors (but not nitrate).
Pyruvate, cysteine and propionate were fermented by the strain; sulfite and elemental
sulfur were disproportioned. Bacterial growth occurred under the following
environments: (i) NaCl concentration from 10 to 75 g/l; (ii) temperature from 15 to 45
oC; and (iii) the pH from 5 to 10. The optimum NaCl concentration, temperature, and
Chapter 8 Conclusions and Recommendations
142
the pH for the growth of the bacteria were found to be 25 g/l, 37 oC, and 7,
respectively. Desulfoviridin-type reductase was present. The 16S rRNA sequence
alignment showed that the strain shared 99% similarity to Desulfovibrio bizertensis.
The difference in physiological, morphological and phylogenical properties indicates
that the strain isolated is a new one and has never been reported.
D. singaporenus strain SJI1 can completely oxidize lactate to acetate and CO2
with sulphate as the electron acceptor, and to the best of our knowledge, is the only
Desulfovibrio with this novel property. This strain can also partially oxidize acetate
with sulphate as an electron acceptor through Kreb cycle (tricarboxylate cycle)
parthway. Being a member of Desulfovibrio, the new strain’s acetate-using property is
rare and it is seldom observed among the members of Desulfovibrio. To our
knowledge, D. singaporenus is the first member of Desulfovibrio that can use oxidize
acetate with inorganic compounds.
Atomic force microscopy was used to directly quantify the interactions between
the various bacteria (i.e. D. singaporenus, D. desulfuricans and Pseudomonas sp.) and
the metal substrates (i.e. aluminum, copper, mild steel, and stainless steel). This
technique was successful in elucidating the initial adhesion for biofilm formation on
metals. A maximum adhesion force peak followed by several small peaks was
observed when the cell probe retracted from the surface, indicating bond stretching
and multiple bond breakages when the cell was moved away from the substrate.
Moreover, the adhesion force was found to be sensitive to the physiological properties

Chapter 8 Conclusions and Recommendations
143
of the bacterium as well as the metal substrate. Results showed that aluminum had the
largest adhesion force with the bacteria, while copper had the smallest. Pseudomonas
sp. exhibited larger adhesion force with metals compared to D. singaporenus and D.
desulfuricans. The hydrophobicity and surface charges of the metal substrates and
bacteria had a significant effect on the cell-metal adhesion. The surface charge greatly
influenced the adhesion force by controlling the electrostatic interaction. The bacterial
adhesion forces were enhanced by the increasing of the surface hydrophobicity. The
difference in metal-bacteria adhesion forces is due to the influence of both the zeta
potential and surface wettability of the bacteria and metal surface. Moreover, the
electrostatic interaction between the negative bacterial cells resulted in stronger
repulsive forces in the cell–cell interactions as compared to the cell–metal
interactions.
The influence of nutrient, ionic strength and pH of the solution was further
investigated. Bacteria-metal interaction was reduced in the presence of the nutrients in
the solution because of the formation of a trace organic film which decreased the
metal surface wettability. An increase in the ionic strength in solution enhanced the
bacterial adhesion to metal surfaces due to the compression of the bacteria surface
biopolymers, thus decreasing the bacteria-metal repulsion. Bacteria-metal adhesion
force was the highest when the pH of the solution was near the isoelectric point of the
bacteria, i.e. at the zero point charge. The adhesion forces at pH 9 were higher than at
pH 7 due to the increase in the attraction between Fe ions and negative carboxylate
groups.

Chapter 8 Conclusions and Recommendations
144
The development of biofilm and the biocorrosion effects of SRB on SS316 were
studied. AFM images and EIS modeling results showed that the biofilm formed by D.
desulfuricans accumulated with exposure time, while the biofilm formed by D.
singaporenus underwent several phases of attachment, growth, subsequent
detachment and reattachment. The biofilm induced by different SRB strains showed
different morphology and polarization resistance. The biofilm formed by D.
singaporenus was compact and crystal-like, whereas the biofilm formed by D.
desulfuricans was porous and net-like and thus induced a faster corrosion on the
surface of SS316. Pits with a curved-rod shape which is similar to SRB cell
morphology suggest a direct role of SRB cells on the localized corrosion. Equivalent
circuit models from EIS results bore out the presence of biofilm on the metal surface
for both D. desulfuricans and D. singaporenus. However, an additional layer of iron
sulfide deposit on the steel surface was formed in the presence of D. singaporenus.
In addition, a new method for coating a SS316 substrate with antibacterial
chemicals using a layer-by-layer technique was investigated. The SS316 substrate was
alternately coated with quaternized polyethylenimine (q-PEI) and poly(acrylic)acid
(PAA) to form multilayers on its surface. XPS and contact angle measurements
showed the chemical nature of the polyelectrolyte multilayers (PEM). The PEM was
found to be stable in seawater. The antibiocorrosion ability of PEM on SS316 was
assessed using an aerobic bacterium Pseudomonas sp. and two anaerobic bacteria, D.
desulfuricans and D. singaporenus. Compared to the pristine SS316 substrate, the

Chapter 8 Conclusions and Recommendations
145
corrosion rates of the functionalized SS316 measured by EIS and linear polarization
decreased in the presence of PEM coating. The depths of the pits caused by the
biocorrosion also decreased significantly as quantified by AFM. Biofilm growth on
the metal substrate was inhibited by the antibacterial effect of PEI as evidenced by
CLSM using LIVE/DEAD Baclight bacterial viability kits. These results indicate
that PEM shows potential application in the inhibition of biocorrosion of metal
substrates.
Finally, an organic inhibitor, MBI, was examined for its effectiveness in
controlling abiotic corrosion and biotic corrosion induced by SRB. MBI was found to
be an effective inhibitor in the control of mild steel and SS316 corrosion in sterile
seawater, and in seawater in the presence of D. desulfuricans or D. singaporenus.
Tafel plots revealed that MBI predominantly inhibits the cathodic reaction. The
corrosion inhibition by MBI at 0.1-2.5 mM is more effective for the corrosion caused
by D. desulfuricans than that caused by D. singaporenus, with a corrosion inhibition
efficiency of 85% and 93.96% for mild steel and stainless steel, respectively, in the
presence of D. desulfuricans. The corrosion inhibition of MIC is partly due to the
inhibition of bacterial activity, as well as the reduction of bacterial attachment on the
steel surface. The adsorption of MBI on both mild steel and stainless steel surfaces
obeys the Langmuir adsorption isotherm.

Chapter 8 Conclusions and Recommendations
146
8.2 Recommendations
We have isolated a new marine SRB strain and tested its corrosion behavior to
metals, which is particularly helpful in understanding local biocorrosion problem of
marine facilities in Singapore. We have performed experiments with AFM force
spectroscopy using a cell probe, and have quantified the bacteria-metal forces in a
nano-level. Contribution has been made to the understanding of the initial biofilm
formation in the marine environment.
However, the work so far is relatively limited because the reasons why the strain
could use acetate and which gene and enzymes contribute to this property remain to
be investigated. Further work is necessary to identify the exact gene and enzymes that
are related to the acetate oxidation. Moreover, this work is limited to the initial
bacteria-metal interaction; as such it does not address the factors influencing the
biofilm accumulation. It is important to explore the biofilm development after the
initial formation of first bacterial layer on metal surfaces. The AFM images of the
pits which mirror the bacterial morphology suggest that the SRB directly interact with
SS316, but the questions on the mechanism of the direct reaction of SRB with the
metal surface, and the electron flow among the metal, bacteria and biofilm remain
unanswered.
Therefore, more work is required to shed light on these critical issues, and
further studies are needed to extend the contributions made in this thesis. Some
recommendations are proposed for future research:

Chapter 8 Conclusions and Recommendations
147
Study of the acetate metabolism pathway of D. singaporenus
As acetate oxidation with sulphate reduction by D. singaporenus is a unique
capability of this organism, it would be interesting and important to research in depth
the metabolic pathway of acetate oxidation. So far some researchers have proposed
the acetate metabolism pathway of several acetate utilizing SRB, such as the citric
acid cycle with the synthesis of pyruvate from acetyl CoA and carbon dioxide as an
anaplerotic reaction (Thauer, 1982), and the direct breakdown of C-C bond in
activated acetate (Schauder et al., 1986). Study on the enzymes and particular gene
participating in the acetate oxidation would be useful to explore the unique behavior
for bacteria survival in the natural environment.
Application of force spectroscopy technology in coating strategies
The development of cell probes and its use in force spectroscopy to study the
bacteria-metal interaction is useful, particularly in the application of anti-biofilm
strategies. A common technique to prevent the biofilm attachment is to deposit a layer
of coating on the surface. The usual way to detect the effectiveness of the coating is
the observation of biofilm formation over a period of time. A study on the application
of the force spectroscopy using cell probes would be useful to investigate the
effectiveness of the coatings for biofilm and biocorrosion inhibition.
Biofilm formation and biocorrosion in a flow-through system
In the present work, the experiments were operated in a static system in the
study of biofilm formation and biocorrosion on the metal surfaces. However, natural
systems are usually flowing systems, such as the piping lines and heat exchangers.

Chapter 8 Conclusions and Recommendations
148
The flow rate of the fluid has a significant effect on the microorganisms’ attachment
and accumulation on the metal substrates. Slow flow rate would facilitate the biofilm
growth and accumulation, while fast flow rate would result in the easy detachment of
biofilm from substrates. Hence, it is important to investigate the relationship
between the flow rate and the biofilm formation as well as the biocorrosion effect on
metals.
Biocorrosion of metals in a mixed culture
Numerous microorganisms are known to cause biocorrosion in the natural
environment. A mixed culture or a consortium of microorganisms may give rise to
more severe biocorrosion than in pure culture systems. In general, there is a
cooperative role between the aerobic and anaerobic bacteria, which would lead to
more intense corrosion. Anaerobic bacteria benefit from aerobic bacteria because the
aerobic bacteria would consume the oxygen and produce an ideal anaerobic
environment. Furthermore, some microorganisms produce metabolic products which
may become the substrates or energy sources for the other bacteria. This mutualistic
relationship among the bacteria thus renders the biocorrosion phenomena more
complex.
This work is limited to biocorrosion induced by pure cultures. To reflect
corrosion problem in the natural environment, more research is needed to study the
influence of bacteria consortia on metal corrosion.
References
149
REFERENCES
1. Absolom D.R., F.Y. Lamberti, Z. Policova, W. Zingg, C.J. van Oss, and A.W.
Neumann. Surface thermodynamics of bacterial adhesion. Appl. Environ. Microbiol. 46 (1983) 90-97.
2. Abu-Lail N.I., and T.A. Camesano. Elasticity of Pseudomonas putida KT2442 biopolymers probed with single-molecule force microscopy. Langmuir 18 (2002) 4071-4081.
3. Abu-Lail N.I., and T.A. Camesano. Role of Lipopolysaccharides in the adhesion, retention, and transport of Escherichia coli JM109. Environmental Science and Technology 37 (2003a) 2173-2183.
4. Abu-Lail N.I., and T.A. Camesano. Polysaccharide properties probed with atomic force microscopy. Journal of Microscopy 212 (2003b) 217-238.
5. Abu-Lail N.I., and T.A. Camesano. Role of ionic strength on the relationship of biopolymer conformation, DLVO contributions, and steric interactions to bioadhesion of Pseudomonas putida KT2442. Biomacromolecules 4 (2003c) 1000-1012.
6. Agrwal R., and T.K.G. Namboodhiri. The inhibition of corrosion and hydrogen embrittlement of AISI 410 stainless steel. J. Appl. Electrochem. 22 (1992) 383.
7. Ahimou F., F.A. Denis, A. Touhami, and Y.F. Dufrêne. Probing microbial cell surface charges by atomic force microscopy. Langmuir 18 (2002) 9937-9941.
8. Alazard, D., S. Dukan, A. Urios, F. Verhé, N. Bouabida, F. Morel, P. Thomas, J.L. Garcia, and B. Ollivier. Desulfovibrio hydrothermalis sp. Nov., a novel sulphate-reducing bacterium isolated from hydrothermal vents. Int. J. Syst. Evol. Microbiol. 53 (2003) 173-178.
9. Allison D.G. The biofilm matrix. Biofouling 19 (2003) 139-150.
10. Azhar M.E., B. Mernari, M. Traisnel, F. Bentiss, and M. Lagrenée. Corrosion inhibition of mild steel by the new class of inhibitors [2,5-bis(n-pyridyl)-1,3,4-thiadiazoles] in acidic media. Corrs. Sci. 43 (2001) 2229-2238.
11. Bale S.J., K. Goodman, P.A. Rochelle, J.R. Marchesi, J.C. Fry, A.J. Weightman, and R.J. Parkes. Desulfovibrio profundus sp. nov., a novel barophilic sulfate-reducing bacterium from deep-sediment layers in the Japan Sea. Int. J. Syst. Bacteriol. 47 (1997) 515-521.

References
150
12. Bartlett M.S., T.D. Edlind, M.M. Durkin, M.M. Shaw, S.F. Queener, and J.W. Smith. Antimicrotubule benzimidazole inhibitor in vitro growth of Pneumocystis carinii. Antimicrob. Agents Chemother. 36 (1992) 779-782.
13. Batista J.F., R.F.C. Pereira, J.M. Lopes, M.F.M. Carvalho, M.J. Feio, and M.A.M.Reis. In situ corrosion control in industrial water systems. Biodegradation 11 (2000) 441-448.
14. Beech I.B., and C.C. Gaylarde. Recent advances in the study of biocorrosion - An overview. Rev. Microbiol. 30 (1999) 177.
15. Beech I.B. The potential use of atomic force microscopy for studying corrosion of metals in the presence of bacterial biofilms - an overview. International Biodeterioration & Biodegradation 37 (1996) 141-149.
16. Beller H.R, A.M. Spormann, P.K. Sharma, J.R. Cole, and M. Reinhard. Isolation and characterization of novel toluene-degrading sulfate-reducing bacterium. Appl. Environ. Microbiol. 62 (1996) 1181-1196.
17. Bengtsson G., Bacterial exopolymer and PHB production in fluctuating ground-water habitats. FEMS Microbiol. Ecol. 86 (1991) 15-24.
18. Bentiss F., M. Lagrenee, M. Traisnel, and J.L. Hornez. The corrosion inhibition of mild steel in acidic media by a new triazole derivative. Corrosion Sci. 41 (1999) 789.
19. Bentiss F., M. Lebrini, H. Vezin, and M. Lagrenee. Experimental and theoretical study of 3-pyridyl-substituted 1,2,4-thiadiazole and 1,3,4-thiadiazole as corrosion inhibitors of mild steel in acidic media. Mater. Chem. Phys. 87 (2004) 18-23.
20. Blodgett K.B. Monomolecular films of fatty acids on glass. J. Am. Chem. Soc. 56 (1934) 495.
21. Blodgett K.B. and I. Langmuir. Built-up films of barium stearate and their optical properties. Phys. Rev. 51 (1937) 964.
22. Boukamp B.A. A non-linear least squares fit procedure for analysis of immittance data of electrochemical systems. Solid State Ionics 20 (1986) 31.
23. Boulangé I., and L. Petermann. Processes of bioadhesion on stainless steel surfaces and cleanability: a review with special reference to the food industry. Biofouling 10 (1996) 275-300.
24. Bowen W.R., R.W. Lovitt, and C.J. Wright. Direct quantification of Aspergillus niger spore adhesion in liquid using an atomic force microscope. J. Colloid Interface Sci. 228 (2000a) 428-433.

References
151
25. Bowen W.R., R.W. Lovitt, and C.J. Wright. Direct quantification of Aspergillus niger spore adhesion to mica in air using an atomic force microscope. Colloids Surf. A 173 (2000b) 205-210.
26. Bowen W.R., A.S. Fenton, R.W. Lovitt, and C.J. Wright. Characterization of the exosporium of Bacillus cereus. Biotechnol. Bioeng. 79 (2002) 170-179.
27. Bowen W.R., R.W. Lovitt, and C.J. Wright. Atomic Force Microscopy Study of the Adhesion of Saccharomyces cerevisiae. J. Colloid Interface Sci. 237 (2001) 54-61.
28. Boyd A., and A.M. Chakrabarty. Pseudomonas aeruginosa biofilms: Role of the alginate exopolysaccharide. J. Ind. Microbiol. 15 (1995) 162-168.
29. Brennenstuhl A.M., and T.S.Gendron. The use of field tests and electrochemical noise to define conditions for accelerated MIC testing. Paper presented at the symposium on Microbiologically Influenced Corrosion (MIC) Testing. Miami, FL, Nov, 1992.
30. Burnham N.A., X. Chen, C.S. Hodges, G.A. Matei, E.J. Thoreson, C.J. Roberts, M.C. Davies, and S.J.B. Thendler. Comparison of calibration methods for atomic-force microscopy cantilevers. Nanotechnology 14 (2003) 1-6.
31. Caldwell D.E., and J.R. Lawrence. Microbial growth and behavior within surface microenvironments. Recent Advances in Microbial Ecology: Proc. 5th Int. Symp. On Microbial Ecology. Kyoto, Japan, 1989.
32. Camesano T.A., and B.E. Logan. Probing electrostatic interactions using atomic force microscopy. Environ. Sci. Technol 34 (2000) 3354-3362.
33. Caumette P., Y. Cohen, and R. Matheron. Isolation and characterization of Desulfovibrio halophilus sp. nov., a halophilic sulfate-reducing bacterium isolated from Solar Lake (Sinai). Syst. Appl. Microbiol. 14 (1991) 33-38.
34. Coetser S.E., and T.E. Cloete. Biofouling and biocorrosion in industrial water systems. Critical Reviews in Microbiology 31 (2005) 213-232.
35. Dai J., and M.L Bruening. Catalytic nanoparticles formed by reduction of metal ions in multilayered polyelectrolyte films. Nano Letters 2 (2002) 497-501.
36. Davis R.H. In Cell adhesion: fundamentals and biotechnological applications, M.A. Hjortso, J.W. Roos, Eds; New York, p 140, 1995.
37. Davies D. Understanding biofilm resistance to antibacterial agents. Nat. Rev. Drug Discovery 2 (2003) 114-122.
38. Davies D.G., M.R. Parsek, J.P. Pearson, B.H. Iglewski, J.W. Costerton, and E.P. Greenberg. The Involvement of Cell-to-Cell Signals in the Development of a Bacterial Biofilm. Science 280 (1998) 295-298.

References
152
39. Decher G. Fuzzy Nanoassemblies: Towards Layered polymeric multicomposites. Science 277 (1997) 1232-1237.
40. Dinh H.T., J. Kuever, M. Muβmann, A.W. Hassel, M. Stratmann, and F. Widdel. Iron corrosion by novel anaerobic microorganisms. Nature 427 (2004) 829-832.
41. Dufrêne Y.F. Recent progress in the application of atomic force microscopy imaging and force spectroscopy to microbiology. Current Opinion in Microbiology 6 (2003) 317-323.
42. Dufrêne Y.F. Application of atomic force microscopy to microbial surfaces: from reconstituted cell surface layers to living cells. Micron 31 (2001) 153-165.
43. Evans U.R. The Corrosion and Oxidation of Metals, Second Supplement, Editor E. Arnold, London, 1975, p. 104.
44. Fang H.H.P., K.Y. Chan, and L.C. Xu. Quantification of bacterial adhesion forces using atomic force microscopy (AFM). Journal of Microbiological Methods 40 (2000) 89–97.
45. Feio M.J., I.B. Beech, M. Carepo, J.M. Lopes, C.W.S. Cheung, R. Franco, J. Guezennec, J.R. Smith, J.I. Mitchell, J.J.G. Moura, and A.R. Lino. 1998. Isolation and characterization of a novel sulphate-reducing bacterium of the Desulfovibrio genus. Anaerobe 4 (1998) 117-130.
46. Felsenstein J. PHYLIP (Phylogenetic inference package) version 3.66. Department of Genetics, University of Washington, Seattle, WA, USA, 2006.
47. Fischer A.E.M.J., T. Gustafsson, and J.F. van der Veen. Determination of the atomic structure of the epitaxial CoSi2: Si(111) interface using high-resolution Rutherford backscattering. Phys. Rev. B 37 (1988) 6305-6310.
48. Flemming H.C. Biofouling and microbiologically influenced corrosion (MIC) an economical and technical overview. In: E. Heitz, W. Sand and H.-C. Flemming (eds.) Microbial Deterioration of Materials, Springer, Heidelberg, pp. 514, 1996.
49. Fletcher M. In: Bacterial adhesion: molecular and ecological diversity; M. Fletcher, Eds.; Washington, DC; American Society for Microbiology, p 1-24, 1996.
50. Fletcher, M. Bacterial attachment in aquatic environments: a diversity of surfaces and adhesion strategies. Wiley-Liss, New York, pp. 1-24, 1996.
51. Geesey G.G., R.J. Gillis, R. Avci, D. Daly, M. Hamilton, P. Shope, and G. Harkin. Influence of Surface Features on Bacterial Colonization and Subsequent Substratum Chemical Changes of 316L Stainless Steel. Corros. Sci. 38 (1996) 73.

References
153
52. Geiser M., R. Avci, and Z. Lewandowski. Microbially initiated pitting on 316L stainless steel. Int. Biodeterio. Biodegrad. 49 (2002) 235.
53. Geler E., and D.S. Azambuja. Corrosion inhibition of copper in chloride solutions by pyrazole. Corrs. Sci. 42 (2000) 631-643.
54. González J.E.G., F.J.H. Santana, and J.C. Mirza-rosca. Effect of bacterial biofilm on 316 SS corrosion in natural seawater by eis. Corros. Sci. 40 (1998) 2141.
55. Hamilton W.A. Sulphate reducing bacteria and anaerobic corrosion. Ann. Rev. Microbiol. 39 (1985) 195-217.
56. Hamilton W.A. Biofilms: Microbial interactions and metabolic activities. In: Ecology of microbial communities. Eds: Fletcher M., Gray T.R.G. & Jones J.G., Oxford University Press, 1987.
57. Hardy J.A. Utilization of cathodic hydrogen by sulphate-reducing bacteria. British Corrosion J. 18 (1983) 190-193.
58. Haouari O., M.L. Fardeau, L. Casalot, J.L. Tholozan, M. Hamdi, and B. Ollivier. Isolation of sulfate-reducing bacteria from Tunisian marine sediments and description of Desulfovibrio bizertensis sp. nov. Int. J. Syst. Evol. Microbiol. 56 (2006) 2909-2913.
59. He J., K.M. Ritalahti, K.L. Yang, S.S. Koenigsberg, and F.E. Loffler. Detoxification of vinyl chloride to ethane coupled to growth of an anaerobic bacterium. Nature 424 (2003) 62-65.
60. Hernandez-Eugenio G., M.L. Fardeau, B.K.C. Patel, H. Macarie, J.L. Garcia, and B. Ollivier. Desulfovibrio mexicanus sp. nov., a sulfate-reducing bacterium isolated from an upflow anaerobic sludge blanket (UASB) reactor treating cheese wastewaters. Anaerobe 6 (2000) 305-312.
61. Hilal N., and W.R. Bowen. Atomic force microscope study of the rejection of colloids by membrane pores. Desalination 150 (2002) 289-295.
62. Hilal N., A.W. Mohammad, B. Atkin, and N.A. Darwish. Using atomic force microscopy towards improvement in nanofiltration membranes properties or desalination f pre-treatment: a review. Desalination 157 (2003) 137-144.
63. Hoogeveen N.G., M.A.C. Stuart, and G.J. Fleer. Formation and stability of multilayers of polyelectrolytes. Langmuir 12 (1996) 3675-3681.
64. Huang G., K. Chan, and H.H.P. Fang. Microbiologically Induced Corrosion of 70Cu-30Ni Alloy in Anaerobic Seawater. J. Electrochem. Soc. 151 (2004) B434.
References
154
65. Ismail K.M., A. Jayaraman, T.K. Wood, and J.C. Earthman. The Influence of Bacteria on the Passive Film Stability of 304 Stainless Steel. Electrochim. Acta 44 (1999) 4685.
66. James A.M. In Microbial Cell Surface Analysis: Structural and Physicochemical Methods; N. Mozes, P.S. Handley, H.J. Busscher, P.G. Rouxhet, Eds.; VCH Publishers: New York, p221, 1991.
67. Jang L.K., E. Quintero, G. Gordon, M. Rohricht, and G.G. Geesey. The osmotic coefficients f the sodium form of some polymers of biological orgin. Biopolymers 28 (1989) 1485-1489.
68. Jefferson K.K. What drives bacteria to produce a biofilm? FEMS Microbiol. Lett. 236 (2004) 163-173.
69. Krekeler D., P. Sigalevich, A. Teske, H. Cypionka, and Y. Cohen. A sulfate-reducing bacterium from the oxide layer of a microbial mat from Solar Lake (Sinai), Desulfovibrio oxyclinae sp. nov. Arch. Microbiol. 167 (1997) 369-375.
70. Kuhn P.M., M.S. Lojko, and E.V. Petersen. Water Vapor: Stratospheric injection by thurderstorms. Science 174 (1971) 1319-1321.
71. Lee W., Z. Lewandowski, W.G. Characklis, and P.H. Nielsen, in Biofouling and Biocorrosion in Industrial Water System, G. G. Geesey, Z. Lewandowski, H. Flemming, Editors, pp. 206, Lewis Publishers, 1994.
72. Lee A.K., and D.K. Newman, Appl. Microbiol. Biotechnol. 62 (2003) 134.
73. Lewandowski Z., in Biofilms: Recent Advances in Their Study and Control, P. Lens, A. P. Moran, T. Mahony, P. Stoodley, V. O’Flaherty, Editors, pp. 7, IWA Publishing, 2001.
74. Li Q., and M. Elimelech. Organic Fouling and Chemical Cleaning of Nanofiltration Membranes: Measurements and Mechanisms. Environ. Sci. Technol. 38 (2004) 4683-4693.
75. Little B., P. Wagner, and F. Mansfield. An overview of microbiologically influenced corrosion. Electrochim. Acta 37 (1992) 2185-2194.
76. Löffler F.E., Q. Sun, J. Li, and J.M. Tiedje. 16S rRNA Gene-Based detection of tetrachloroethene-dechlorinating Desulfuromonas and Dehalococcoides species. Appl. Environ. Microbiol. 66 (2000) 1369-1374.
77. López-Cortés A., M.L. Fardeau, G. Fauque, C. Joulian, and B. Ollivier. Reclassification of the sulphate- and nitrate-reducing bacterium Desulfovibrio vulgaris subsp. oxamicus as Desulfovibrio oxamicus sp. nov., comb. nov. Int. J. Syst. Bacteriol. 56 (2006) 1495-1499.

References
155
78. Lower S.K., C.J. Tadanier, and M.F. Hochella. Measuring interfacial and adhesion forces between bacteria and mineral surfaces with biological force microscopy. Geochim. Cosmochim. Acta 64 (2000) 3133-3139.
79. Lower S.K., C.J. Tadanier, and M.F. Hochella. Dynamics of the mineral-microbe interface: use of biological force microscopy in biogeochemistry and geomicrobiology. Geomicrobiol. J. 18 (2001a) 63-76.
80. Lower S.K., M.F. Hochella, and T.J. Beveridge. Bacterial recognition of mineral surfaces: nanoscale interactions between Shewanella and α-FeOOH. Science 292 (2001b) 1360-1363.
81. Magot M., P. Caumette, J.M. Desperrier, R. Matheron, C. Dauga, F. Grimont, and L. Carreau. Desulfovibrio longus sp. nov., a sulfate-reducing bacterium isolated from an oil-producing well. Int. J. Syst. Bacteriol. 42 (1992) 398-403.
82. Marshall K.C., In: Bacterial adhesion: molecular and ecological diversity, M. Fletcher Eds.; Washington, DC; American Society for Microbiology, p 59-87, 1996.
83. Morales-Gil P., G. Negrón-Silva, M. Romero-Romo, C. Ángeles-Chávez, and M. Palomar-Pardavé. Corrosion inhibition of pipeline steel grade API 5L X52 immersed in a 1 M H2SO4 aqueous solution using heterocyclic organic molecules. Electrochim. Acta 49 (2004) 4733-4741.
84. Nguyen T.M.P, Microbiologically Induced Corrosion of AISI 304 Stainless Steel by Desulfovibrio desulfuricans in Artificial Seawater, Master Thesis, National University of Singapore, 2004.
85. Obuekwe C.O., D.W.S. Westlake, J.A. Plambeck, and F.D. Cook. Corrosion of mild steel in cultures of ferric iron reducing bacterium isolated from crude oil. I. Polarization characteristics. Corrosion 37 (1981) 461.
86. Ong Y., A. Razatos, G. Georgious, and M.M. Sharma. Adhesion forces between E. coli bacteria and biomaterial surfaces. Langmuir 15 (1999) 2719-2725.
87. O’Toole G., H.B. Kaplan, and R. Kolter. Biofilm formation as microbial development. Annu. Rev. Microbiol. 54 (2000) 49-79.
88. Ouattara, A.S., B.K.C. Patel, L. Cayol, N. Cuzin, A.S. Traore, and J.L. Garcia. Isolation and characterization of Desulfovibrio burkinensis sp. nov. from an African ricefield, and phylogeny of Desulfovibrio alcoholivorans. Int. J. Syst. Bacteriol. 49 (1999) 639-643.
89. Ouyang X., X. Qiu, H. Lou, and D. Yang. Corrosion and Scale Inhibition Properties of Sodium Lignosulfonate and Its Potential Application in

References
156
Recirculating Cooling Water System. Ind. Eng. Chem. Res. 45 (2006) 5716-5721.
90. Palleroni N.J. The Pseudomonas group. Meadowfield Press, p1, 1978.
91. Paradies H.H., W.R. Fischer, I. Haenssel, and D. Wagner. Characterisation of metal biofilm interactions by extended absorption fine structure spectroscopy. In: Sequeria C.A.C. and Tiller A.K.(eds), Microbial Corrosion-2 European Federation of corrosion, Publication N08, The institute of materials, pp168-188, 1992.
92. Patel N.K. Corrosion inhibitors for 63/37 brass in trichloroacetic acid solution. J. Electrochem. Soc. 21 (1972) 136.
93. Pope D.H., D.J. Duquette, A.H. Johannes, and P.C. Wayner. Microbially influenced corrosion of industrial alloys. Mat. Perform 23 (1984) 14-18.
94. Popova I., and J.T. Yates. Adsorption and Thermal Behavior of Benzotriazole Chemisorbed on -Al2O3. Langmuir 13 (1997) 6169.
95. Postgate J.R. A diagnostic reaction of Desulfovibrio desulfuricans. Nature 183 (1959) 481-482.
96. Postgate J.R., and L.L. Campbell. Classification of Desulfovibrio species, the nonsporulating sulphate-reducing bacteria. Bacteriological Reviews 30 (1966) 732-738.
97. Postgate J.R. The Sulphate Reducing Bacteria, 2nd ed., Cambridge University Press, 1984.
98. Postgate J.R. Microbes and Man. 3rd, Cambridge University Press, New York, 1996.
99. Prescott L.M., J.P. Harley, and D.A. Klein. Microbiology. Brown Publishers, USA. 1990.
100. Quraishi M.A., and H.K. Sharma. 4-Amino-3-butyl-5-mercapto-1,2,4-triazole: a new corrosion inhibitor for mild steel in sulphuric acid. Mater. Chem. Phys. 78 (2002) 18.
101. Ramesh S., and S. Rajeswari. Evaluation of inhibitors and biocide on the corrosion control of copper in neutral aqueous environment. Corrs. Sci. 47 (2005) 151-169.
102. Razatos A., Y. Ong, M.M. Sharma, and G. Georgious. Molecular determinants of bacterial adhesion monitored by atomic force microscopy. Proc. Natl. Acad. Sci. 95 (1998) 11059-11064.

References
157
103. Razatos A., Y. Ong, F. Boulay, D.L. Elbert, J.A. Hubbell, M.M. Sharma, and G. Georgious. Force measurements between bacteria and poly(ethylene glycol)-coated surfaces. Langmuir 16 (2000) 9155-9158.
104. Rutter P.R., and B. Vincent. Physicochemical interactions of the substratum, microorganisms, and the fluid phase. In: Microbial adhesion and aggregation, ed. Marshall K.C. Berlin: Springer Verag, 1984.
105. Sakaguchi T., A. Arakaki, and T. Matsunaga. Desulfovibrio magneticus sp. nov., a novel sulfate-reducing bacterium that produces intracellular single-domain-sized magnetite particles. Int. J. Syst. Evol. Microbial. 52 (2002) 215-221.
106. Sanders P.F., and W.A. Hamilton. Biologically Induced Corrosion, NACE International, Houston, 1986, pp. 47.
107. Sanyal B. Organic-Compounds as Corrosion-Inhibitors in Different Environments - a Review. Progress in Organic Coatings 9 (1981) 165-236.
108. Sastri V.S. Corrosion inhibitors: Principles and Applications, John Wiley & Sons: New York, 1998.
109. Schauder R., B. Eiknanns, R.K. Thauer, F. Widdel, and G. Fuchs. Acetate oxidation to CO2 in anaerobic bacteria via a novel pathway not involving reactions of the citric acid cycle. Arch. Microbiol. 145 (1986) 162-172.
110. Shi Z., K.G. Neoh, S.P. Zhong, L.Y.L. Yung, E.T. Kang, and W. Wang. In vivo antibacterial and cytotoxicity assay of multilayered polyelectrolyte-functionalized stainless steel. Journal of Biomedical Materials Research 76A (2006) 826-834.
111. Starosvetsky D., R. Armon, J. Yahalom, and J. Starovetsky. Pitting corrosion of carbon steel caused by iron bacteria. International Biodeterioration & Biodegradation, 47 (2001) 79-87.
112. Stoodley P., K. Sauer, D.G. Davies, and J.W. Costerton. Biofilms as Complex Differentiated Communities. Annu. Rev. Microbiol. 56 (2002) 187-209.
113. Sun B., J.R. Cole, R.A. Sanford, and J.M. Tiedje. Isolation and characterization of Desulfovibrio dechloracetivorans sp. nov., a marine dechlorinating bacterium growing by coupling the oxidation of acetate to the reductive dechlorination of 2-chlorophenol. Appl. Environ. Microbiol. 66 (2000) 2408-2413.
114. Tan Y.S., M.P. Srinivasan, and S.O. Pehkonen. Self-assembled organic thin films on electroplated copper for prevention of corrosion. J. Vac. Sci. Technol. A 22 (2004) 1917-1925.

References
158
115. Tan Y.S., M.P. Srinivasan, S.O. Pehkonen, and S.Y.M. Chooi. Effects of ring substituents on the protective properties of self-assembled benzenethiols on copper. Corrs. Sci. 48 (2006) 840-862.
116. Tardy-Jacquenod C., M. Magot, F. Laigret, M. Kaghad, B.K.C. Patel, J. Guezennec, R. Matheron, and P. Caumette. Desulfovibrio gabonensis sp. nov., a new moderately halophilic sulfate-reducing bacterium isolated from an oil pipeline. Int. J. Syst. Bacteriol. 46 (1996) 710-715.
117. Thauer R.K. Dissimilatory sulphate reduction with acetate as electron donor. Phil. Teans. R. Soc. Lond. B 298 (1982) 467-471.
118. Tsu I.H., C.Y. Huang, J.L. Garcia, B.K.C. Patel, J.L. Cayol, L. Baresi, and R.A. Mah. Isolation and characterization of Desulfovibrio senezii sp. nov., a halotolerant sulfate reducer from a solar saltern and phylogenetic confirmation of Desulfovibrio fructosovorans as a new species. Arch. Microbiol. 170 (1998) 313-317.
119. Vandevevere P., and D.L. Kirchman. Attachment stimulates expolysacchride synthesis by a bacterium. Applied. Environmental Microbiology 59 (1993) 3280-3286.
120. van Oss C.J., R.J. Good, and M.K. Chaudhury. The role of Van der Waals forces and hydrogen bonds in hydrophobic interactions between biopolymers and low energy surfaces. J. Colloid Interface Sci. 111 (1986) 378-390.
121. Videla H.A. Manual of Biocorrosion. Boca Raton, CRC Press, 1996.
122. Von Wolzogen Kuhr C.A.H., and L.S. Van der Vlugt. The graphitization of cat iron as an electrochemical process in anaerobic solid. Water 18 (1934) 147.
123. Wolfaardt G.M., and T.E. Cloete. The effect of some environmental parameters on surface colonization by microorganisms. Water Research 26 (1992) 527-537.
124. Xu L.C., K.Y. Chan, and H.H.P. Fang. Application of Atomic Force Microscopy in the Study of Microbiologically Influenced Corrosion. Mater. Chart. 48 (2002) 195.
125. Xu L.C., H.H.P. Fang, and K.Y. Chan. Atomic Force Microscopy Study of Microbiologically Influenced Corrosion of Mild Steel. J. Electrochem. Soc. 146 (1999) 4455.
126. Zhang D., L. Gao, and G. Zhou. Inhibition of copper corrosion in aerated hydrochloric acid solution by heterocyclic compounds containing a mercapto group. Corrs. Sci. 46 (2004) 3031-3040.

Publications
159
PUBLICATIONS Journal Publications ♦ Sheng X., Ting Y.P., Pehkonen S.O., Direct Force Measurement of Bacteria
Adhesion on Metal in Aqueous Media, Water Science and Technology 54 (2006) 17-25.
♦ Sheng X., Ting Y.P., Pehkonen S.O., The influence of sulphate-reducing bacteria
biofilm on the corrosion of stainless steel AISI 316, Corrosion Science 49 (2007) 2159-2176.
♦ Sheng X., Ting Y.P., Pehkonen S.O., Force measurements of bacterial adhesion
on metals using a cell probe atomic force microscope, Journal of Colloid and Interface Science 310 (2007) 661-669.
♦ Sheng X., Ting Y.P., Pehkonen S.O., Evaluation of an organic corrosion inhibitor
on abiotic corrosion and microbiologically influenced corrosion of mild steel, Industrial & Engineering Chemistry Research 46 (2007) 7117-7125.
♦ Sheng X., He J.Z, Ting Y.P., Pehkonen S.O., Isolation and characterization of a
novel marine sulphate-reducing bacterium from seawater, Applied and Environmental Microbiology, 2007, submitted.
♦ Sheng X., Ting Y.P., Pehkonen S.O., The influence of ionic strength, nutrients
and pH on bacterial adhesion to metals, Journal of Colloid and Interface Science, 2008, submitted.
Conference Proceedings ♦ Sheng X., Ting Y.P., Pehkonen S.O., Direct measurements of interactive forces on
the components of biofilm using atomic force microscopy, 17th International Congress of Chemical & Process Engineering, Prague, Aug. 2006.
♦ Sheng X., Ting Y.P., Pehkonen S.O., Inhibition of microbiologically influenced
corrosion of mild steel and SS316 by an organic inhibitor, 17th International Biohydrometallurgy Symposium, Frankfurt, Sep. 2007.