biofuels market development roadmap - socalgas · company overview southern california gas company...
TRANSCRIPT

BioFuels Market Development Roadmap
June 14, 2011
© 2005 San Diego Gas and Electric and Southern California Gas Company. All copyright and trademark rights reserved
• •
•
•
•
•
•
•
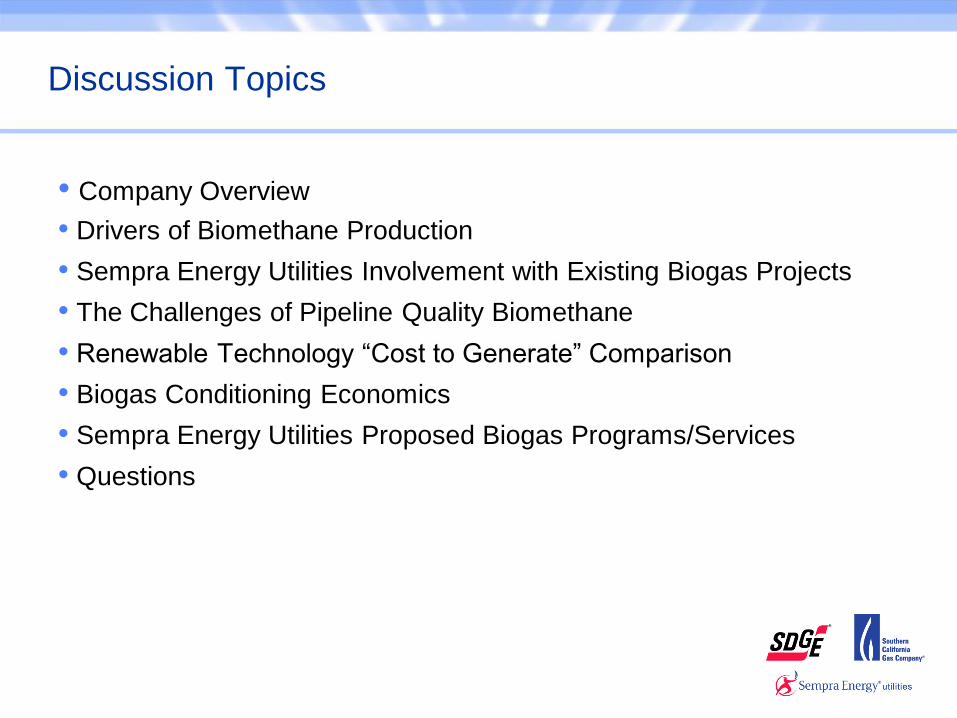
Discussion Topics
Company Overview
Drivers of Biomethane Production
Sempra Energy Utilities Involvement with Existing Biogas Projects
The Challenges of Pipeline Quality Biomethane
Renewable Technology “Cost to Generate” Comparison
Biogas Conditioning Economics
Sempra Energy Utilities Proposed Biogas Programs/Services
Questions

Company Overview
Southern California Gas Company (SoCalGas) has been delivering clean,
safe and reliable natural gas to its customers for more than 140 years
Nation‟s largest natural gas distribution utility
20.9 million consumers
5.8 million meters
Serving more than 500 communities
The company‟s service territory encompasses approximately 20,000 square
miles
•
•
•
–
–
–

The Lifecycle of Pipeline Quality Biomethane
DairyV ideo.avi
Biogas
Piping
RPS Certified Generation Plant
SoCalGas Pipeline Network
Biogas Conditioning
Facility
Biomethane Piping
Utility Interconnection
Organic Waste
Yes
Cogeneration
System
No
Eligible for
Investment Tax
Credit
Digester

Drivers of Biomethane Production
California Regulatory Environment
Renewable Portfolio Standard (RPS): 20% by 2010, and 33% by 2020
Assembly Bill 32: Reduce GHG‟s back to 1990 levels by 2020
Low Carbon Fuel Standard: reduce the carbon intensity of California‟s transportation fuels by at least 10 percent by 2020
Governor‟s Executive Order S-06-06: instate production of biofuels - 20% by 2010, 40% by 2020, 75% by 2050
Availability of feedstock and capturing methane for its full potential
Wastewater, food waste, dairy, biomass = potential 16% of CA daily natural gas consumption
–
–––
–
•
•

Biomethane
16%
The Resource Potential is Significant
6,500 MMcf/Day
(California Consumption)
Source: California Bioenergy Working Group
CA sources
12.7%
El Paso
25.7%
GTN
21.8%
Kern River
25.0%
Other
1.7%
Transwest. 12.7%
Mojave
0.4%

•
•
–
–
–
–
–
–
Sempra Energy Utilities Involvement with Existing Biogas Projects and Initiatives
Sempra Utilities have contributed to several different biogas projects Gills Onions: Onion waste to biogas for SGIP qualified fuel cells - Not interconnected
Enertech – Biosludge from wastewater plants is moved through a centrifuge to create biopellets for rotary kilns at a cement company - Not interconnected
Escondido – RD&D Project to validate SoCalGas testing methods and prove viability of conditioning technology - Interconnect under consideration
Point Loma WWTF - Plans to condition raw biogas for pipeline injection – SDG&E involved with the Interconnection process
Pipeline biomethane injection readiness Rule 30 Biogas Guidance Document released September 2009
http://www.socalgas.com/documents/business/Rule30_BiomethaneGuidance.pdf
Participating in Gas Technology Institute (GTI) studies - dairy biogas, landfill gas

•
•
–––
••
The Challenges of Pipeline Quality Biomethane
Current Situation in California
Biomethane is not currently being injected locally „yet‟
Permitting challenges
Perceived Technology Risk SoCalGas Rule 30 and PG&E Rule 21 gas quality specifications
Limited demonstration projects for the financial community
Economic range for biogas conditioning is approximately 1,000 standard cubic feet per minute (scfm) or greater of raw biogas
Small to medium scale biogas production facilities are not economical
Uneven biogas incentives
–
–

Renewable Technology “Cost to Generate” Comparison
$195
$138
$135
$91
$100
$65
$60
$0 $50 $100 $150 $200 $250
Levelized C ost o f Generat ion ( $/ M W h)
Solar Thermal
PV Thin Film
PV Track
Biomethane
Biomass
Geothermal
Wind
Ren
ew
ab
le
Tech
no
log
y
Cost to Generate Ranges
All Ranges, Except for Biomethane, Taken from RETI Phase 2B Report
$116
$140
$151
$214
$206
$226
$112
(a)
Conditioned Biogas*
($/MMBtu)
(b)
Transportation ($/MMBtu)
(c)
Total Fuel Cost
($/MMBtu)(a) + (b)
(d)
Total Fuel Cost ($/MWh)
[(c) x (g)]/1,000
(e)CCPP
Variable O&M
($/MWh)
(f)CCPP Fixed Costs
($/MWh)
Cost to Generate
RPS Energy($/MWh)
(d)+(e)+(f)Biomethane - High $ 12.0 $ 0.27 $ 12.27 $ 85.0 $ 6.54 $ 20.49 $ 112Biomethane - Low $ 9.0 $ 0.27 $ 9.27 $ 64.2 $ 6.54 $ 20.49 $ 91
*Conditioned Biogas ($/MMBtu): Estimated market price of biomethane at the point of injection
Combined Cycle Power Production (CCPP) AssumptionsHeat Rate (g) 6,924 Btu/kWh From 2009 MPR Model: Average CCPP Heat Rate over life of plant
Variable O&M 6.543 $/MWh From 2009 MPR Model: 2010 average of variable cost componentFixed Costs 20.49 $/MWh From 2009 MPR Model: 2010 average of fixed cost component
Transportation Cost 0.27 $/MMBtu ~ SCG transportation rate for electric generation

0 20,000 40,000 60,000
Pro
du
cti
on
Co
st
of
Bio
meth
an
e
Small /
Medium
80,000
Dairies
Large
Illustrative
Economic
Range
•
•
•
•
Biogas Conditioning Economics: Dairy Biogas Upgrading to Pipeline Quality
Only large cow herds reach the flat part of scale curve
Herd size (# of cows)
Scale economies: 850 dairies in SoCalGas/SDG&E territory, 5 dairies in
SoCalGas territory 8,000+ cows
Availability and cost of capital
Availability of monetized GHG credits
Clustering and rights-of-way

Flow rate (scfm)
Pro
du
cti
on
Co
st
of
Bio
me
tha
ne
Small /
Medium
Economic
Range
Illustrative
Large
Biogas Conditioning Economics: WWTF Biogas Upgrading to Pipeline Quality
Wastewater Treatment Facilities (WWTF)
Only large WWTFs reach the flat part of scale curve
Scale economies: 4 large WWTFs (1,100+ scfm), 3 (500-1,000 scfm), 9 (300-499 scfm), 5
WWTFs (200-299 scfm), 19 (100-199 scfm) in SoCalGas/SDG&E territory
Small WWTFs: more economic to flare than capture methane.
Availability and cost of capital
Availability of monetized GHG credits
•
•
•
•
0 2,000 4,000 6,000 8,000 10,000

Biogas Conditioning
PSA Example
Commercially proven equipment for oil field applications and a few biogas installations
Modular
Need reference installations in California
Feed Compression
Pressure Swing Adsorption (PSA) Unit
Tail Gas To Flare
Product Compression (if required)
•
•
•
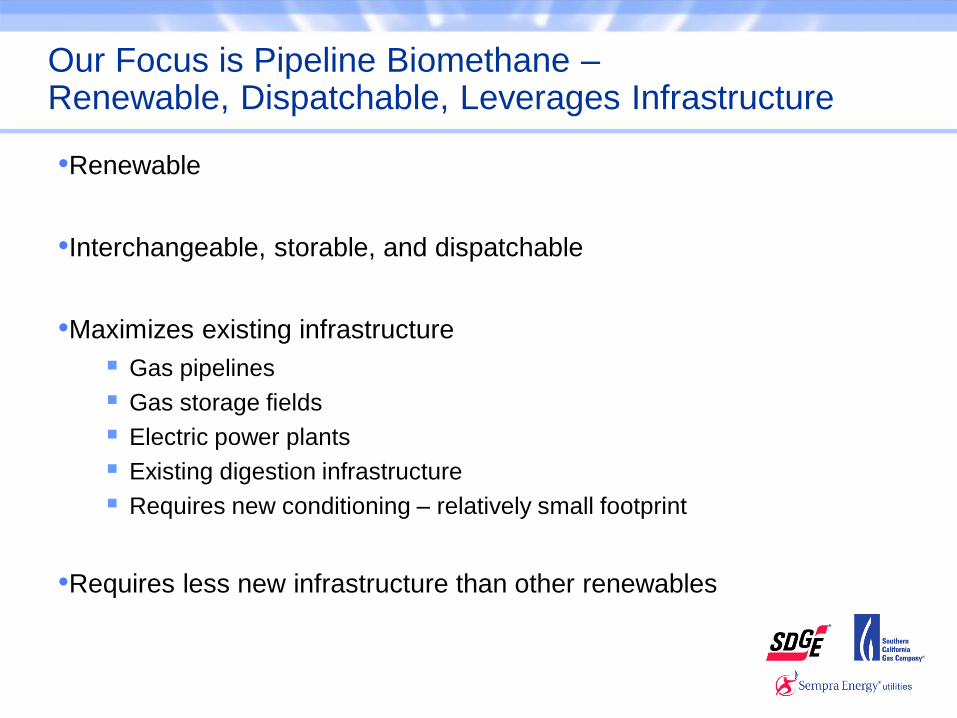
Our Focus is Pipeline Biomethane – Renewable, Dispatchable, Leverages Infrastructure
Renewable
Interchangeable, storable, and dispatchable
Maximizes existing infrastructure
Gas pipelines
Gas storage fields
Electric power plants
Existing digestion infrastructure
Requires new conditioning – relatively small footprint
Requires less new infrastructure than other renewables
•
•
•
•
•
•
•
•
–
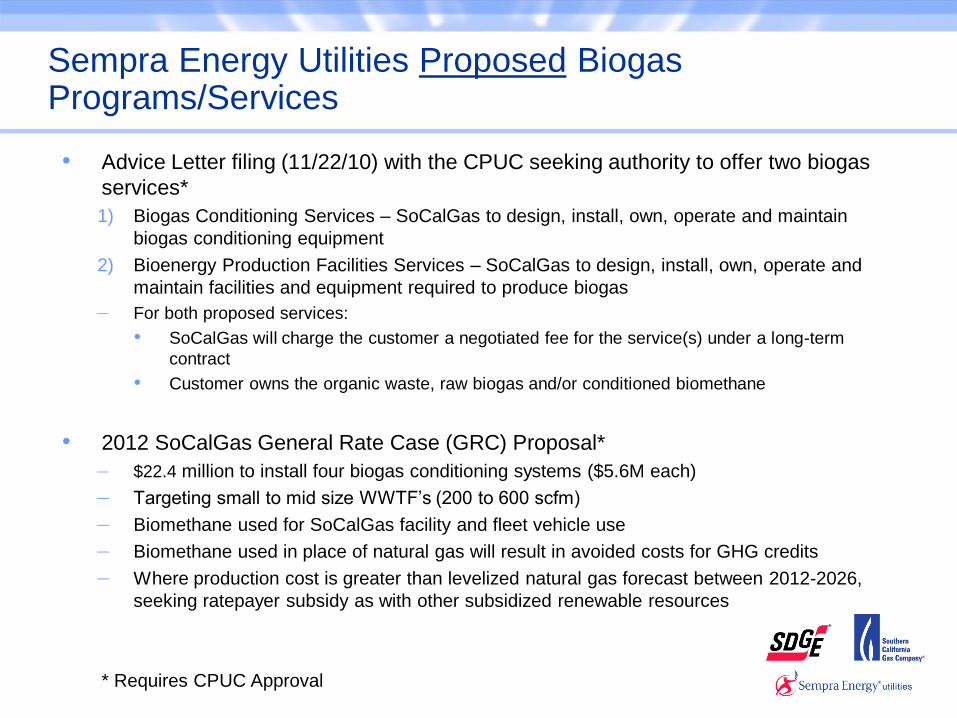
Sempra Energy Utilities Proposed Biogas Programs/Services
Advice Letter filing (11/22/10) with the CPUC seeking authority to offer two biogas
services*
1) Biogas Conditioning Services – SoCalGas to design, install, own, operate and maintain
biogas conditioning equipment
2) Bioenergy Production Facilities Services – SoCalGas to design, install, own, operate and
maintain facilities and equipment required to produce biogas
For both proposed services:
SoCalGas will charge the customer a negotiated fee for the service(s) under a long-term
contract
Customer owns the organic waste, raw biogas and/or conditioned biomethane
2012 SoCalGas General Rate Case (GRC) Proposal*
$22.4 million to install four biogas conditioning systems ($5.6M each)
Targeting small to mid size WWTF‟s (200 to 600 scfm)
Biomethane used for SoCalGas facility and fleet vehicle use
Biomethane used in place of natural gas will result in avoided costs for GHG credits
Where production cost is greater than levelized natural gas forecast between 2012-2026,
seeking ratepayer subsidy as with other subsidized renewable resources
* Requires CPUC Approval
–
–
–
–
–

Thank You
Ron Goodman
Manager of BioFuels Market Development
213.244.5814