biofuels raised in the greenhouse an economic perspective bruce a. mccarl regents professor of...
TRANSCRIPT

Biofuels raised in the GreenhouseAn Economic Perspective
Bruce A. McCarlRegents Professor of Agricultural Economics
Texas A&M University
Presented at
Intersection of Energy and Agriculture: Implications of Biofuels and the Search for a Fuel of the Future
University of California, Berkeley
October 5, 2007

CollaboratorsDarius Adams, Oregon State Ralph Alig, USDA Forest ServiceGerald Cornforth, TAMU Greg Latta, Oregon StateBrian Murray, Duke Dhazn Gillig, TAMU/AMEXChi-Chung Chen, TAMU, NTU
Mahmood El-Halwagi, TAMU Uwe Schneider, University of Hamburg
Ben DeAngelo, EPA Ken Andrasko, EPASteve Rose, EPA Francisco de la Chesnaye, EPA Ron Sands, PNNL, Maryland Heng-Chi Lee, TaiwanThien Muang, TAMU Kenneth Szulczyk, TAMU Michael Shelby, EPA Sharyn Lie, EPA
Sources of SupportUSDA DOE USEPACSiTE

Topics of the day
Biofuels and GHGs
Biofuel economics
Effects of energy price and GHG incentives
Sector effects

An Aside
From a GHG perspective
Biofuels ≠ Ethanol
Particularly corn or sugar ethanol
GHG offset = a1 * crop ethanol
+ a2 * cell ethanol
+ a3 * biodiesel
+ a4 * bio fueled electricity
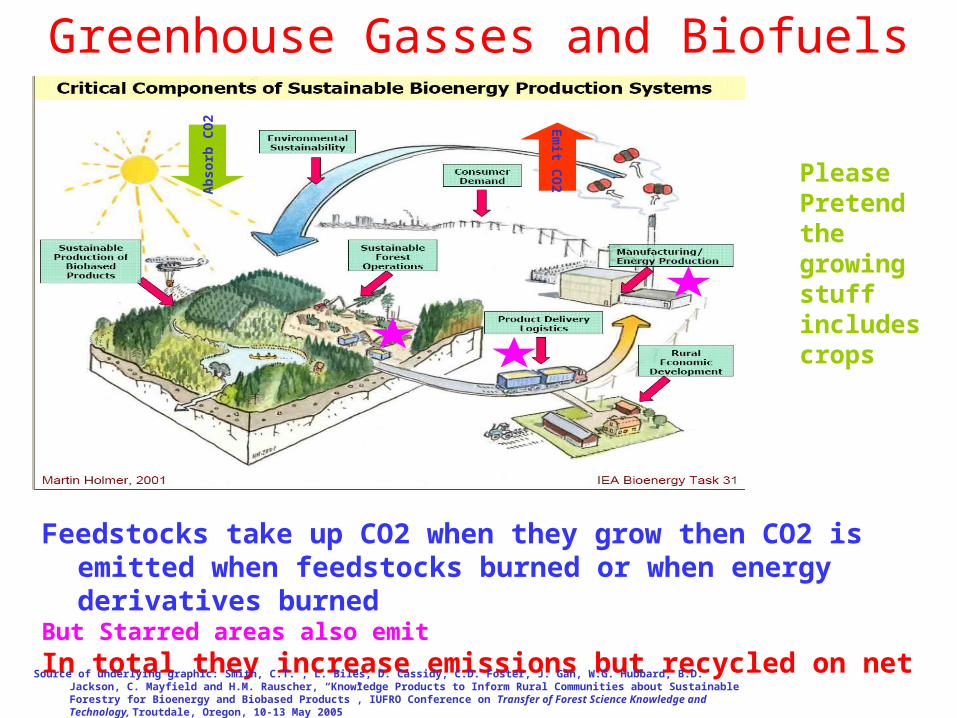
Greenhouse Gasses and Biofuels
Feedstocks take up CO2 when they grow then CO2 is emitted when feedstocks burned or when energy derivatives burned
But Starred areas also emitIn total they increase emissions but recycled on net
Em
it CO
2
Ab
sorb
CO
2
Source of underlying graphic: Smith, C.T. , L. Biles, D. Cassidy, C.D. Foster, J. Gan, W.G. Hubbard, B.D. Jackson, C. Mayfield and H.M. Rauscher, “Knowledge Products to Inform Rural Communities about Sustainable Forestry for Bioenergy and Biobased Products”, IUFRO Conference on Transfer of Forest Science Knowledge and Technology, Troutdale, Oregon, 10-13 May 2005
Please Pretend the growing stuff includes crops

Offset Rates Computed Through Lifecycle AnalysisOffset Rates Computed Through Lifecycle Analysis
Ethanol offsets are in comparison to gasoline
Power plants offsets are in comparison to coal.
Net Carbon Emission Reduction (%)
Electricity offsets higher when cofired due to Efficiency and less hauling
Ethanol BioDiesel Electricity
Corn 25% 50%
Soybeans 71%
Sugarcane 65%
Switchgrass 50% 80-90%
Bagasse 85% 95%
Corn Residue 70% 85-90%
Manure 95-99%
Lignin 85-95%
Opportunities have different potentials

Forces stimulating biofuels?
Modeling Approach

McCarl Project Goals
Examine the portfolio of land based biofuel possibilities
Bring in a full cost and GHG accounting
Look at motivations for their use in terms of energy prices,
and GHG mitigation strategies
Look comparatively across many possibilities including
Afforestation, Forest mgt, Biofuels, Ag soil, Animals,
Fertilization, Rice, Grassland expansion, Manure, Crop mix
Look at market, energy price, time and technology
conditions under which strategies dominate
Look at market effects and co benefits/ costs

FASOMGHG Mitigation OptionsStrategy Basic Nature CO2 CH4 N2O
Crop Mix Alteration Emis, Seq X XCrop Fertilization Alteration Emis, Seq X XCrop Input Alteration Emission X XCrop Tillage Alteration Emission X XGrassland Conversion Sequestration XIrrigated /Dry land Mix Emission X X
Ferment Ethanol Production Offset X X XCellulosic Ethanol Production Offset X X XBiodiesel Production Offset X X XBioelectric Production Offset X X X
Stocker/Feedlot mix Emission XEnteric fermentation Emission XLivestock Herd Size Emission X XLivestock System Change Emission X XManure Management Emission X XRice Acreage Emission X X X
Afforestation Sequestration XExisting timberland Manage Sequestration XDeforestation Emission XForest Product Choice Sequestration X

BiofuelBiofuel feedstocksfeedstocks andand productsproductsEthanol Cell Ethanol BioDiesel Electricity
Electricity• Agricultural and forestry products:
– Corn, Wheat, Sorghum, Rice X– Sugar Cane X– Timber X X
• Production residues:– Crop Residue X X– Logging Residue X X– Manure X
• Processing products and by products:– Bagasse X X– Soybean/Corn Oil X– Rendered Animal Fat X– Milling Residue X X– Yellow Grease X
• Energy crops:– Switchgrass X X– Willow X X– Hybrid Poplar X X
• Cell ethanol is prospective we don’t really have to know how to do at scale
Electricity may be cofired

Portfolio Composition
Energy prices increases with CO2 priceEnergy prices increases with CO2 price Ag soil goes up fast then plateaus and even comes downWhy – Congruence and partial low cost
Lower per acre rates than higher cost alternatives Biofuel takes higher price but takes offElectricity gives big numbers due to plant expansionOther small and slowly increasing

Biodiesel
Cell Ethanol
Grain/Sug Ethanol
Liquid Portfolio Composition

Portfolio Composition

Portfolio Composition

Liquid Biofuel Portfolio Composition
GHG offset and energy price send similar signalsCellulosic at higher prices, switchgrass and residue
Gas price 0.94 Gas price 2.00
Lower carbon dioxide price -1 10 30 50 -1 10 30 50
Upper carbon dioxide price 10 30 50 5000 10 30 50 5000
Corn into ethanol wet milling xx xx xx xx xx xx xx xx
Corn into ethanol dry milling xx xx xx xx xx xx xx
Make wheat into ethanol xx xx
Make sorghum into ethanol xx xx xx xx xx
Sugarcane Bagasse into ethanol xx xx xx xx
Make corn residues into ethanol xx xx xx xx
Make wheat residues into ethanol xx
Make sorghum residues into ethanol xx
Make rice residues into ethanol xx xx
Make soybean oil into biodiesel xx xx xx xx xx xx xx xx
Make corn oil into biodiesel xx xx xx xx xx xx

Electricity PortfolioElectricity Portfolio CompositionComposition
Cofiring ratio increases with priceResidues Show at higher pricesSugarcane bagasse at all prices
Coal price 24.68 Coal price 49.36
Lower carbon dioxide price -1 10 30 50 -1 10 30 50
Upper carbon dioxide price 10 30 50 5000 10 30 50 5000
Switchgrass to electricity 5% co firing Xx xx xx xx xx xx xx xx
Make switchgrass into electricity xx xx xx xx
Make willow into electricity xx xx xx xx xx xx
Make lignin into electricity xx xx
Manure into electricity 20% co firing xx xx xx xx xx
Sugarcane Bagasse into electricity xx xx xx xx xx xx xx xx
Corn residues to elec 20% co firing xx xx
Make corn residues into electricity xx xx xx xx xx
Wheat residues elec 20% co firing xx xx xx xx xx
Make wheat residues into electricity xx xx xx xx xx xx
Sorghum res, to elec. 20% co firing xx xx
Make sorghum residues into electricity xx xx
Make barley residues into electricity xx xx xx xx xx xx xx
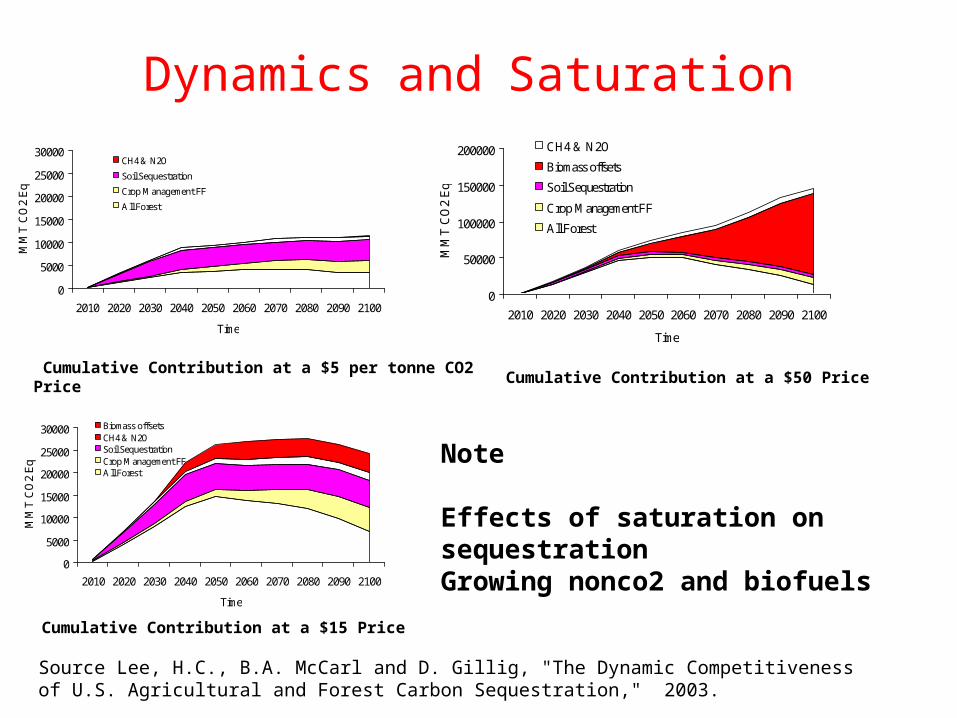
Dynamics and Saturation
Cumulative Contribution at a $5 per tonne CO2 Price
Cumulative Contribution at a $15 Price
Cumulative Contribution at a $50 Price
0
5000
10000
15000
20000
25000
30000
2010 2020 2030 2040 2050 2060 2070 2080 2090 2100
Time
MM
T C
O2
Eq
CH4 & N2O
Soil Sequestration
Crop Management FF
All Forest
0
5000
10000
15000
20000
25000
30000
2010 2020 2030 2040 2050 2060 2070 2080 2090 2100
Time
MM
T C
O2
Eq
Biomass offsetsCH4 & N2OSoil SequestrationCrop Management FFAll Forest
0
50000
100000
150000
200000
2010 2020 2030 2040 2050 2060 2070 2080 2090 2100
Time
MM
T C
O2
Eq
CH4 & N2O
Biomass offsets
Soil Sequestration
Crop Management FF
All Forest
Note
Effects of saturation on sequestrationGrowing nonco2 and biofuels
Source Lee, H.C., B.A. McCarl and D. Gillig, "The Dynamic Competitiveness of U.S. Agricultural and Forest Carbon Sequestration," 2003.

Effects on Ag sectorEffects on Ag sector
Conventional Production Lower by 1/6
Livestock Production Lower by 1/4
Exports lower by ½
Prices higher by ½
Farm incomes double
Consumers pay
Trading partners pay

Why else might the biofuels dominate Ag GHG response
Alleviates problems plaguing other agricultural ghg offsets with
Permanence - saturation
Additionality – already being done
Uncertainty – delivery at processing
Transactions cost – no agents needed
Engineering solution – large scale control
Problems with Leakage – CDM and palm oil

Why else might the biofuels dominate Ag response
Helps in some co benefits, causes other co costs
Much more elastic demand curve helps farm income
Negative emissions with Carbon Capture and Storage

GHGs and Money
Carbon markets may arise if we implement cap and
trade
Have under Kyoto in Europe
$25-35 per metric ton CO2
Limited markets in US
$2-4 per metric ton CO2

GHGs and Money
Coal 30-86% carbon so a ton of coal emits~ 50% carbon or 1.8 tons CO2
Emissions Cost in Europe $12.5 to $18 Cost in US $1.25 to $1.80
Coal current cost per ton $25 cost
Gasoline CO2 emissions 8.8 kg/gallon Emiss. cost in Europe $0.22 in US $0.022
Gasoline current pre tax cost ~$2.00 per gallon

GHGs and Money
Wood 50% carbon switchgrass 44%Offset carbon through photosynthesis and replacement of coal / gasoline
So emission offset earnings or gain advantage relative to fossil fuels

GHGs and MoneyBiofuels will likely not create items sold in carbon market
excepting sequestration if it ever sells
But•Fossil energy production or consumption will likely
require emission permits raising consumer price of fossil fuel use
•Biofuel combustion will likely not require such permits and price will rise on BTU or other basis to price
of fossil fuel
•Feedstock demand will rise same effect as selling offset in market
Money to be made

Findings
Biofuels could play important part in GHG mitigating world
At low fuel and carbon prices opportunity cost of resources
exceeds value of feedstocks generated.
Competitiveness in GHG arena arises because biofuels
continually offset fossil fuel emissions in comparison to
sequestration which saturates
Tradeoffs with food/fuel/exports if we produce biofuels
Strong degree of farm income support, Raises Consumer
Food Costs
Can yield large volumes

Big questions
Will society choose to reward biofuel carbon recycling?
Will energy prices remain high in short run?
Will ethanol and biodiesel subsidies persist?
When will cellulosic ethanol be producible at scale?
Can we increase biofuel feedstock yields?
Can we increase energy recovery efficiency from biofeedstocks?
Will we switch farm subsidies to energy or carbon subsidies?
Will food technical progress remain high?
Will we think about this as we plot future of energy?
Will the science community expand the definition of biofuels away from corn ethanol?

For more information
http://agecon2.tamu.edu/people/faculty/mccarl-bruce/biomass.html