biogas utilization handbook - build a biogas plant - home on biogas...safety precaution check list...
TRANSCRIPT
,
published by the Environment, ,Health, and Safety'Divjsion
Georgia Tech Research InstiNte Atlanta. Georgia
I* D * a I( s a I a s J . S li a B e P I a 9 r e ~2 2 .+ B
spomored by Southeastern Regional Biomas Energy Program
and the State of Georgia through the Georgia Pouhy Federation
TABLE OF CONTENTS
ChaDter Title 1 Introduction
2 Sources and Characteristics of Biogas
3
4
5
Introduction Anaerobic Digesters Landfills
Biogas Combustion Calculations Approximate Fuel Value
Properties of Gases
Flame Velocities
Flammability Limits
Flame Temperatures
Fuel Energy Value Fuel Mixtures
Water Vapor
Application of Data
Handling and Collection of Biogas
Introduction
Piping Systems Valves
Painting
Condensate Drains
Flame Arresters
Leak Checks
Collection from Digesters
Collection from Landfills
Clean-up of Biogas Treatment of Biogas
Medium BTU Gases
Hydrogen Sulfide Removal
' High BTU Gases
Economics of Biogas Treatment
me 1
3
3 4
5 13
13
13 14
15 16
17
19
21 21
23
23
23 21
21
21
31
32
33
33
35
35
35
36 40
45
1

-
TABLE OF CONTENTS (Con’t)
ChatJter m 6 Compression of Biogas
7
8
Applications for Compression
Special Requirements for Handling Biogas
Selecting a Blower or Compressor Power Needed for Compression
Energy Density and Storage Volume
Storage of Biogas Purpose of Storage
Types of Storage
High Pressure Biogas Storage
Absorption Storage Liquefaction
Considerations
Materials Biogas Utilization Technologies
Introduction Direct Combustion
Burner Conversion
Absorption Chillers
Gas Turbines
Engine Systems
Cogeneration
Power Units
Spark Ignition Engines Diesel Engines
Cogeneration Policies Vehicular Fuel
Pipeline Quality Gas
, Euvironmental Considerations
49 49 49 51
51 56 57 57 57 61
61
61 62
63 67 67 67 69 71 73 74 75 76 8a
94 96 98 103 103
ii

TABLE OF CONTENTS (Con’t) Chaoter m
9 Instrumentation and Controls for Biogas Equipment
Introduction
Gas Composition
Gas Caloric Value
Gas Density
Gas Flow Pressure
Ambient Exposure Potential Biogas Safety Considerations
Introduction
Toxicological Dangers
Flammability Dangers
Physical Dangers
Safety Equipment
Recommended Safety Practices References
IO
Appendix A - Alphabetical Listing of Equipment Suppliers
Appendix B - Listing of Companies by Product or Service
! w e i05
105
105
107
107
107
109
110
1 1 1
111
1 1 1
113
1 I4
115
115
117
125
131
... 111

LIST OF FIGURES
m Steps Involved in the Anaerobic Biological Production of Biogas Flame Velocity as a Function of Carbon Dioxide Concentration Flammability Limits as a Function of Carbon Dioxide and Water Vapor Concentration Theoretical Flame Temperatures as a Function of Methane and Water Vapor Contents
Lower Heating Values as a Function of Methane and Water Vapor Content
Air-Fuel Ratio Variation Recommended Pipe Sizing
Manual Condensate Drain
U-Pipe Condensate Drain
Siphon Condensate Drain
Water Outlet Device Flame Arrestor Installation A
Flame Arrestor Installation B
Leak Test Pressurization System
Vertical Pipe Landfill Extraction System Hydrogen Sulfide Removal Processes
Simple Biogas Purification Arrangement
Components of a Typical Biogas Compressor
Compressor Horsepower Variation with Discharge Pressure
Compressor Horsepower Variation with Capacity
Biogas Storage Options
Typical Biogas Storage System
Biogas Utilization Options
Double-Effect Absorption Chiller Efficiency Ranges of Prime Movers
. Industrial 'Cogeneration System
Typical Biogas Cogeneration System Typical Dairy Farm Load Variation
The Effect of Engine Load on Electrical Efficiency
iv
Number 2- I
3- I
3-2
3-3
3-4
3-5 4- 1
4-2
4-3
4-4
4-5 4-6
4-1
4-8
4-9 5- 1
5-2 6- 1
6-2
6-3 1-1
1-2
8-1 8-2
8-3 8-4
8-5
8-6 8-1
Paae 3
15
16
17
19
21
24 29
29
30
30
31
31
32
33 31
38
52
54
54
58
59
68 12
73 15 17
18
79

F
Number 8-8
8-9
8-10
8-1 1
8-12
8-13
8-14
8-15
8-16
8-17
8-18
8-19
8-20
8-21
LIST OF FIGURES (Con’!) m
Fuel Consumption of a 25 kW Cogeneration Unit Biogas Carburetion with Secondary Fuel Supply Effects of Equivalence Ratio on Engine Performance
Compression Ratio Versus Specific Power Output Recommended Spark Advance
Effect of Biogas Methane Content on Engine Derating
Thermal Energy Balance
Effect of Oil Change Interval on Wear Metal Content
Typical Filter Treatment System Installation
Cogeneration System Costs Diesel Engine Schematic 100 kW Interconnect System
Vehicular Fuel System
Vehicular Fuel Refueling System
Paae 81
82
83
84
84
85
87
92
93
94
95
99
100 101
V

Number 2-1 2-2
2-3
2-4 2-5
2-6
3- 1
3-2
3-3 3-4 4- I
4-2
4-3
4-4
4-5
5- 1
5-2
5-3 5-4
5-5
5-6
6- I
6-2
7- I 7-2 8-1
8-2
8-3
LIST OF TABLES Title Pacle
Digester Performance Characteristics 7
Landfil l Performance Characteristics 8 Trace Constituents Detected in Landfill Gas 9
Organic Compounds Identified in Landfil l Gas 10
Factors Affecting Landfill Gas Production 11
Fuel Equivalents of Biogas 13 Physical Constants of Methane and Carbon Dioxide 14
Comparative Fuel Values for Several Simple Fuels 18
Comparison Fuel Values for Commercial Fuels 18
Advantages and Disadvantages of Materials for Gas Piping 26
Factors Affecting Digester Biogas Production 6
National Standards Applicable to Biogas Piping Systems
Advantages and Disadvantages of Valves for Biogas Piping
Recommendations for Painting
Condensate Draining Systems
Aqueous Solutions Used to Remove Hydrogen Sulfide from Biogas
Design Example for a Small Scale Iron Sponge Process
Liquid Absorption Processes for CO, and H,S Removal Summary of Gas Treatment Methods Available for the Removal of Water, Hydrocarbons, and Carbon Dioxide Relative Economics of Several Gas Treatment Alternatives
Summary of Capital and Operating Costs for Some Commercial Gas Treatment Systems
Horsepower Requirements for Compressing Biogas
Effect of Pressure on Energy Density and Storage Volume
Examples of Biogas Storage Options
Materials of Construction for Biogas Storage Vessels 'Ofifice'Diameter Multiplier for Gas Appliances
Engine Generator Maintenance Costs Engine Oil Analysis
26
28
28
28
36 41
42
46
47
48
55
56
64
65 70
89
90
vi


Number 10-1
10-2
10-3
10-4 10-5
LIST OF TABLES (Con't)
m Paae Toxicity Characteristics of Biogas Constituents 112
Typical Symptoms of Overexposure to Biogas Constituents 112 Flammability Characteristics 114
Recommended Safety Equipment 115
Safety Precaution Check List for Biogas Systems I16
vii

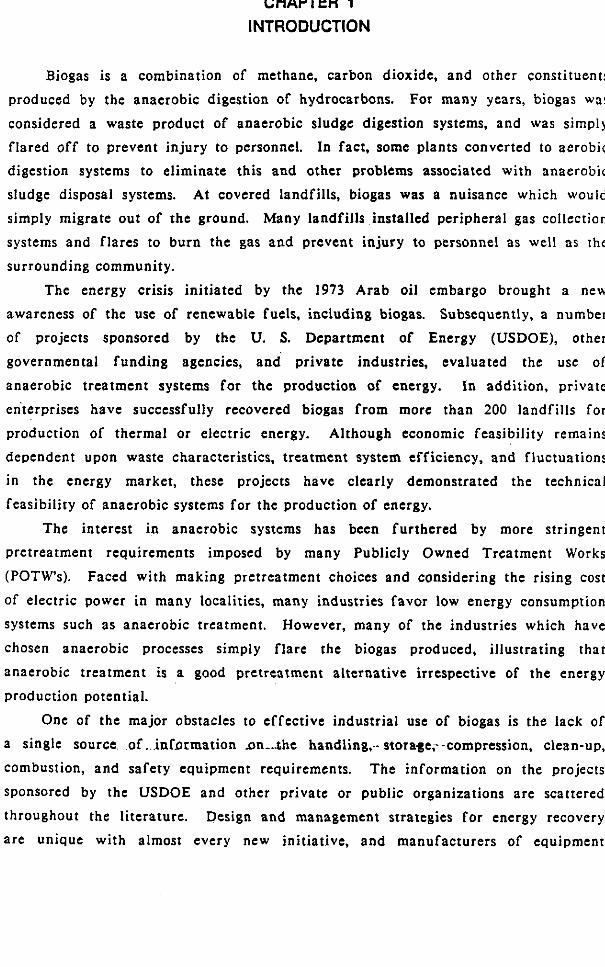
CHAPTER 1 INTRODUCTION
Biogas is a combination of methane, carbon dioxide. and other constituents produced by the anaerobic digestion of hydrocarbons. For many years, biogas was
considered a waste product of anaerobic sludge digestion systems, and was simply flared off to prevent injury to personnel. In fact, some plants converted to aerobic digestion systems to eliminate this and other problems associated with anaerobic
sludge disposal systems. At covered landfills, biogas was a nuisance which would
simply migrate out of the ground. Many landfills installed peripheral gas collection
systems and flares to burn the gas and prevent injury to personnel as well as the
surrounding community.
The energy crisis initiated by the 1973 Arab oil embargo brought a new
awareness of the use of renewable fuels, including biogas. Subsequently, a number
of projects sponsored by the U. S. Department of Energy (USDOE), other
governmental funding agencies, and private industries, evaluated the use of
anaerobic treatment systems for the production of energy. In addition, private
enterprises have successfully recovered biogas from more than 200 landfills for production of thermal or electric energy. Although economic feasibility remains
dependent upon waste characteristics. treatment system efficiency, and fluctuations
i n the energy market, these projects have clearly demonstrated the technical
feasibility of anaerobic systems for the production of energy.
The interest in anaerobic systems has been furthered by more stringent
pretreatment requirements imposed by many Publicly Owned Treatment Works (POTW’s). Faced with making pretreatment choices and considering the rising cost
of electric power in many localities, many industries favor low energy consumption
systems such as anaerobic treatment. However, many of the industries which have
chosen anaerobic processes simply flare the biogas produced, illustrating that
anaerobic treatment is a good pretreatment alternative irrespective of the energy production potential.
One of the major obstacles to effective industrial use of biogas is the lack of
a Single source o f . information on-.-the handling,-- stora~e,-.compression. clean-up,
combustion, and safety equipment requirements. The information on the projects sponsored by the USDOE and other private or public organizations are scattered
throughout the literature. Design and management strategies for energy recovery are unique with almost every new initiative, and manufacturers of equipment
specifically designed for biogas are sometimes diff icul t to locate. A unified
approach and information clearinghouse are clearly needed to guide development
efforts into the 1990's. This handbook is designed to provide a single source of information to help guide industries in their choice of technologies for cost-
effective utilization of biogas. This handbook evolved from li terature searches of available publications on
landfills, wastewater pretreatment systems, and biogas utilization systems, and contains information on laboratory-, pilot-, and full-scale anaerobic treatment systems and landfills. This information has been analyzed, condensed, and combined
where appropriate to provide guidelines generic to most anaerobic treatment
systems. The handbook contains a n extensive list of references, and the reader is
encouraged to use these to obtain more specific information on particular designs or operating strategies.
A list of suppliers for the equipment needed to recover and utilize the biogas from a n anaerobic treatment system is contained in the appendix. These
manufacturers were identified through a mail survey and the Thomas Register.
However, the listing does not include suppliers of common items such as pipe,
fittings, valves, gauges, etc. The authors do not wish to imply that the firms listed
are the only manufactures of this equipment, and i t is recommended that any f i rms
considering the installation of a system consult publications such as the Thomas
Register for other potential equipment suppliers. The Thomas Register can be found
in many libraries.
The handbook does not extract design information from national standards such as those published by the American Society for Testing and Materials (ASTM), the
American Society of Mechanical Engineers (ASME), and the American National
Standards Insti tute (ANSI). In places where information from these standards is appropriate, the standard is referenced. The purpose of referencing these standards
is to avoid any conflict between the handbook and these standards. These
standards are updated and revised on a periodic basis, and the potential exists for fu ture revision to conflict with recommendations sct forth in this handbook. Before
finalizing a design, i t is recommended that the most current ASTM, ASME. or other
applicable national and-local codes-be consulted.
2
CHAPTER 2 SOURCES AND CHARACTERISTICS OF BIOGAS
introduction Biogas is a product of microbiological degradation processes. The primary
sources of biogas in the United States are currently waste treatment systems
utilizing anaerobic digesters, or solid waste landfills. Both of these waste treatment
systems rely upon anaerobic bacteria to convert organic matter to methane (CH,) and carbon dioxide (C02). The major differences between these processes is that landfills are more analogous to batch digesters rather than continuous treatment systems. Moreover, optimum conditions for methane production in landfills are
established over a period of years rather than days, thus control requirements for
landfills and continuous treatment systems vary greatly.
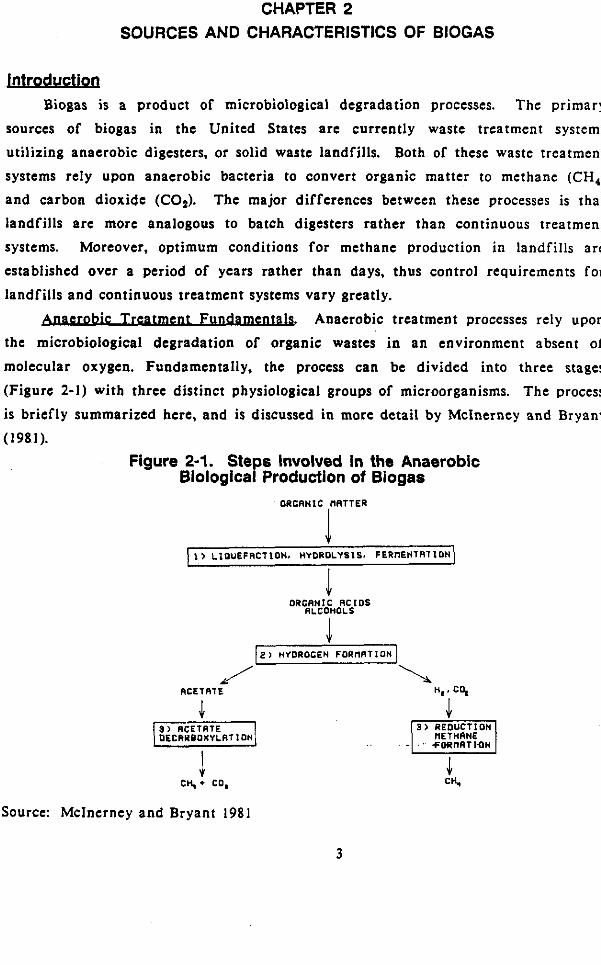
bic Tr-. Anaerobic treatment processes rely upon
the microbiological degradation of organic wastes in an environment absent of
molecular oxygen. Fundamentally, the process can be divided into three stages
(Figure 2-1) with three distinct physiological groups of microorganisms. The process is briefly summarized here, and is discussed in more detail by McInerney and Bryant (1981).
Figure 2-1. Steps Involved In the Anaerobic Biological Production of Biogas
ORCRNIC I lRTTER I 1 > LlDUEFRCTtDN, HYDROLYSIS, FERnENlRlION
.1 ORCRNIC RCIOS
RLCOHOLS
DECRYBOXYLRTION
c y * EO,
Source: Mclnerney and Bryant 1981
3 ) REDUCTION nETHRNE
I
3
The first stage involves the fermentative bacteria (and fungi in landfills), including both anaerobic and facultative (acrobic/anaerobic) microorganisms. Complex organic materials. carbohydrates, proteins, and lipids a re hydrolyzed and fermented into fat ty acids, alcohols, carbon dioxide, hydrogen, ammonia, and
sulfides. In the second stage, acetogenic bacteria consume the primary organic products
and produce hydrogen, carbon dioxide and acetic acid. The th i rd stage utilizes two
distinct types of methanogenic bacteria. The f i rs t reduces carbon dioxide to
methane, and the second decarboxylates acetate to methane and carbon dioxide.
The objective of the biogas process is to completely degrade all organic material to methane. Therefore, it is important to optimize biochemical conditions for all reactions leading to the formation of methanogenic precursors and, most
importantly, for those reactions responsible for the formation of methane itself. At
the same time, production of carbon dioxide, nitrogen, and other gases which dilute
the energy content of the gas should be minimized to the greatest extent possible.
Anaerobic Diaesters Anaerobic digesters are typically used for treating biological sludges, manures,
and other high solids wastes. These a re most often intermittently fed a slurry of
municipal or agricultural wastes a t prescribed time intervals. In the reactor, the wastes are held a t a certain temperature range for a specified retention time. The nature and composition of the wastes determines the optimum loading rate,
temperature, and retention time required for successful operation of the system.
Most systems are site-specific, and these variables are best determined
experimentally fo r each individual operation. The type of digester used can vary
from simple plug-flow trench type to more complex multi-tank batch systems, or
continuously fed and well-mixed continuously stirred tank reactors (CSTR’s). Due to their low cost and relative ease of operation, most farm digesters are
the plug-flow type. Process descriptions and discussions of the advantages and
disadvantages of various digester types and their applications can be found in
publications by the USEPA (1979~). Stafford (1980). Berdoll (1985), Walker u. (1985). Pratt (.1986),Sasser (-1986). Walsh -;(1986); andSplinter (1987).
Biogas from various sources varies in quality and is dependent upon certain
factors. The composition of the biogas depends on the kinds of wastes being
digested, and the length of the retention time in which the waste undergoes
4
digestion. The biogas produced from anaerobic digesters is a mixture of gases. This mixture typically consists of 60-70% CH,, 30-40% CO,, and less than 1%
hydrogen sulfide (H2S). The H,S levels are generally f rom about 100 to 2000 ppm.
but levels as low as 2 ppm and as high as 8000 ppm have been reported. Trace
amounts of nitrogen (up to 10%). hydrogen (up to 5%). oxygen, and various other constituents may also be present. However, a s a result of their very small quantities, they are often very difficult to detect and most often inconsequential.
The production of biogas in digesters is influenced by a number of factors
which are presented together with a general commentary in Table 2-1. In general,
potential gas production can usually be estimated from the volatile-solids (VS) loading of the digester and the percentage of VS reduction. Gas production rates can vary over a wide range, depending on the VS content of the sludge feed and
the level of biological activity in the digester. Typical methane yields for various
wastes, loading rates, temperatures and retention times are presented in Table 2-2.
Landfil lg Biogas from landfills typically has a lower methane content (approximately 40-
55%) than that of gas produced from digesters. The remaining volume is comprised primarily of carbon dioxide and a total of I to 2% of hydrogen sulfide and
miscellaneous inorganic gases and organic vapors. Gas composition data from a number of full-scale landfill sites are listed in Table 2-3. The H,S levels are
usually less than 100 ppm, due in part to the low sulfur content of f i l l material and
the complexation of H2S with metal ions produced by landfill degradation. Unlike
digester gas, landfil l gas can contain a larger variety of trace constituents. A
representative list of these constituents is compiled in Tables 2-4 and 2-5. The low
concentrations of these constituents make them very diff icul t to detect, and their potential impact remains to be fully evaluated and documented.
Optimum conditions for methane production are rarely, if ever, observed in
landfills. The rate of gas production may be limited by any of the contributing
factors in Table 2-6. Methane production may be increased by monitoring and
controlling (to a varying extent) these factors, as outlined by Harper and Pohland (1988).
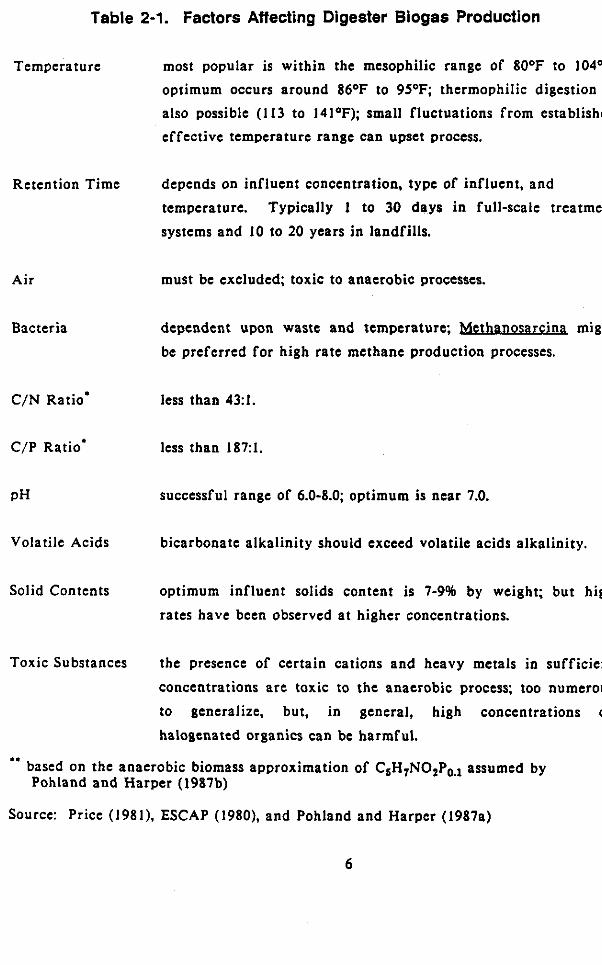
Table 2-1. Factors Affecting Digester Biogas Production
Temperature
Retention Time
Air
Bacteria
C/N Ratio'
C/P Ratio'
PH
Volatile Acids
Solid Contents
Toxic Substances
most popular is within the mesophilic range of 80°F to 104OF;
optimum occurs around 86OF to 95OF; thermophilic digestion is also possible ( 1 13 to 141OF); small fluctuations from established effective temperature range can upset process.
depends on influent concentration. type of influent, and
temperature. Typically I to 30 days in full-scale treatment
systems and 10 to 20 years in landfills.
must be excluded; toxic to anaerobic processes.
dependent upon waste and temperature; Methanosarclna ' might
be preferred for high rate methane production processes.
less than 43:l.
less than 1821.
successful range of 6.0-8.0; optimum is near 7.0.
bicarbonate alkalinity should exceed volatile acids alkalinity.
optimum influent solids content is 7-9% by weight; but high
rates have been observed a t higher concentrations.
the presence of certain cations and heavy metals in sufficient
concentrations a re toxic to the anaerobic process; too numerous
to generalize, but. in general, high concentrations of
halogenated organics can be harmful. .*
based on the anaerobic biomass approximation of C,H,NO,P,., assumed by Pohland and Harper (1987b)
Source: Price (1981). ESCAP (1980), and Pohland and Harper (1987a)
6
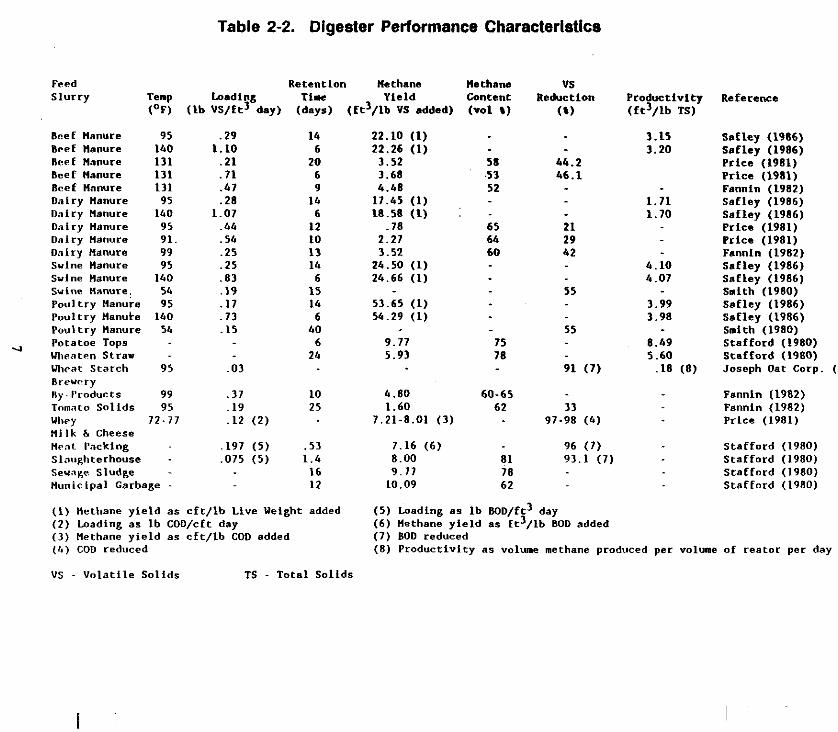
Table 2-2. Digester Performance Characteristics
Feed S l u r r y
8cef Uanure Beef nanure Reef nnnure Beet Hanure Beef uanure Dairy Manure Dairy Uanure Dairy Uanure Dairy Uanure Dairy Manure Swine Uanure swine Hanure swine nalwre
Temp (OF)
95 140 131 131 131 95 140 95 91 99 95 140
54 Poultry Uanure 95 Poultry Manuke 140 Poultry Hanure 54
Whenten Straw Vhcat S ta rch 95 Rrewrry
Tomato Sol ids 95 whey 72-11 f l i l k 6, Cheese
Slaughterhouse - Sewny,e Sludge - Municipal Garbage -
~ Potatoe Tops
Ily I'roducts 99
t Packing
Retentlon Uethans Methane b a d l n g T h e Yleld Content
( i b VS/ft3 day) (days) ( f t3 / ib VS added) (vol t)
.29 1.10 .21 .71 .47 .28
1.07 .44 .54 .25 .25 .83 .I9 .I7 .73 .I5
.03
.37
.I9
.I2 (2)
,197 (5) .075 (5)
14 6 20 6 9 14 6
12 ID 13 14 6 15 14 6 40 6 24
10 25
.53 1.4 16 12
( I ) Hethane y i e ld as c f t / l b Live Weight added (2) Loading as I b COD/cft day (3) Uethane y i e ld as e f t / l b COD added ( 4 ) COD reduced
VS - Vola t i le Sol ids TS - Tota l Sol ids
22.10 (1) 22.26 (1) 3.52 3.68 4.48 17.45 (1) 18.58 (1) :
.78 2.27 3.52 24.50 ( I ) 24.66 (1)
53.65 (1) 54.29 (1)
9.17 5.93
4.80 1.60
7.21-8.01 (3)
7.16 ( 6 ) 8.00 9.17 10.09
58 .53 52
65 64 60
75 78
60-65 62
81 78 62
vs Reduc t Ion
W)
44.2 16.1
21 29 42
55
55
91 (7)
Productivlty ( f t 3 / l b TS)
3.15 3.20
1.71 1.70
4.10 4.07
3.99 3.98
8.49 5.60
. I8 ( 8 )
31 97-98 (4)
96 (7) 93.1 (7)
Reference
SaE1ey (1986) Saf ley (1986) Price (1981) Pr ice (1981) Fannln (1982) Safley (1986) Saf ley (1986) Price (1981) Pr ice (1981) Fannln (1982) Safley (1986) Saf ley (1986) Smith (1980) Safley (1986) SaEley (1986) Smith (1980) Sts f fo rd (1980) Sts f fo rd (1980) Joseph Oat Gorp. (1982)
Fannin (1982) Fannin (1982) Price (1981)
Staf ford (1980) Staf ford (1980) Srafford (1980) Staf ford (1980)
(5) Loading as I b BOD/ft3 day (6) Methane y i e l d as f r3 / lb BOD added (7) BOD reduced ( 8 ) Productlvlty as volume methane produced per volume of rea tor per day
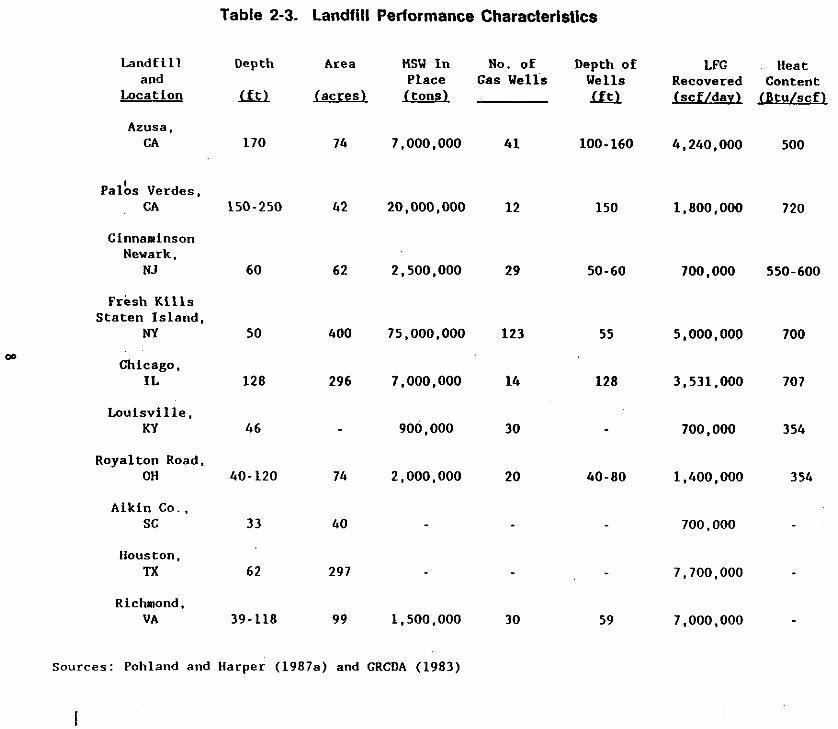
Table 2-3. Landfill Performance Characteristics
W
Landfill and
Location
Azusa, CA
Palbs Verdes, CA
Cinnaninson Newark,
NJ
Fresh Kills Staten Island,
NY
Chicago, IL
Louisville. KY
Royalton Road, OH
Aikin G o . , sc
Houston, TX
Richmond, VA
Depth
0
170
150-250
60
50
128
46
40-120
33
62
39-118
Area
(acres1
74
42
62
400
296
74
40
297
99
HSW In No. of
(tons) Place Gas Wells
7,000,000
20,000,000
2,500,000
75,000,000
7,000,000
900,000
2,000,000
-
1,500.000
41
12
29
123
14
30
20
30
Depth of Wells 0
100-160
150
50-60
55
128
40-80
59
LFG Recovered Jscf/davl
4,240,000
1,800,000
700,000
5,000,000
3,531,000
700,000
1,400,000
700,000
7,700,000
7,000,000
Heat Content JBtuIscfr
500
720
550-600
700
707
354
3 54
Sources: Pohland and Harper (1987a) and GRCOA (1983)
I
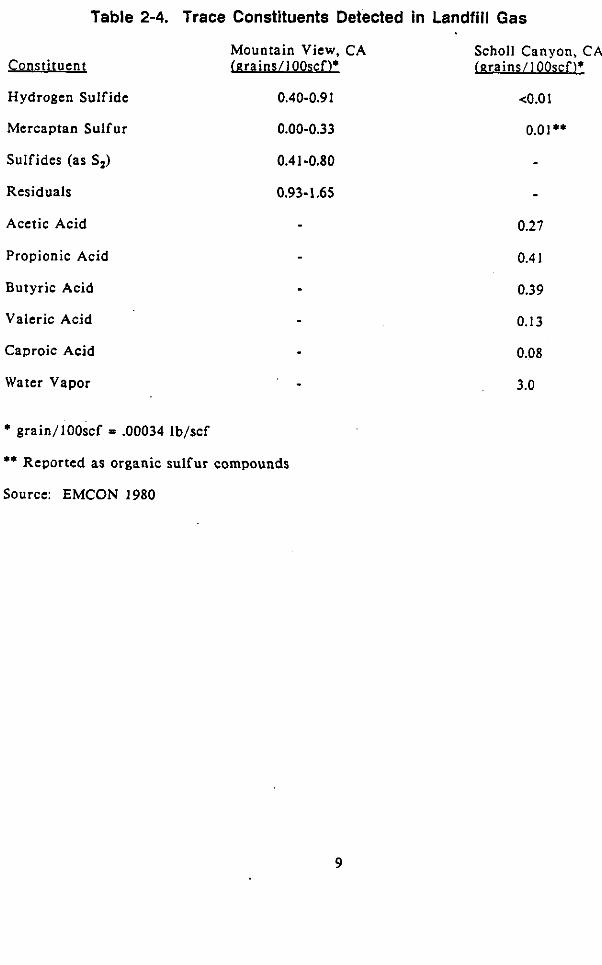
Constituent
Table 2-4. Trace Constituents Detected in Landfill Gas
Mountain View, CA krains/IOOscf)*
Hydrogen Sulfide 0.40-0.91
Mercaptan Sulfur 0.00-0.33
Sulfides (as S,) 0.41-0.80
Residuals 0.93-1.65
Acetic Acid
Propionic Acid
Butyric Acid
Valeric Acid
Caproic Acid
Water Vapor
Scholl Canyon, CA Larains/ 1 OOscf )*
<0.01
0.01 **
- 0.27
0.4 1
0.39
0.13
0.08
3.0
* grain/IOOscf = .00034 Ib/scf
** Reported as organic sulfur compounds
Source: EMCON 1980
9
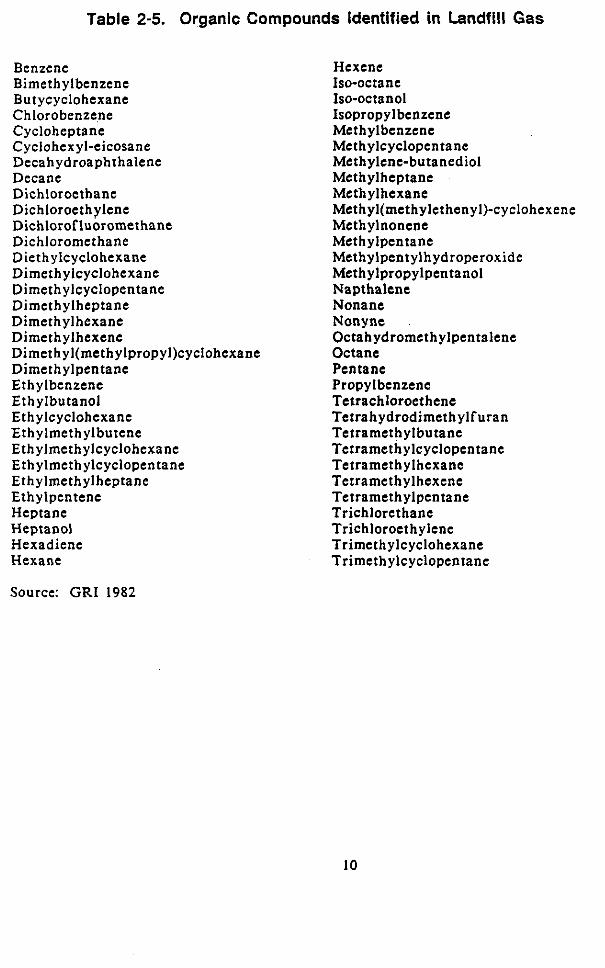
Table 2-5. Organic Compounds Identified in Landfill Gas
Benzene Bimethylbenzenc Butycyclohexane Chlorobenzene Cycloheptanc Cyclohex yl-eicosane Decahydroaphthalcne Decane Dichloroethane Dichloroethylene Dichlorof luoromethane Dichloromethane Diethylcyclohexane Dimethylcyclohexane Dimeth ylcyclopentane Dimethylhcptane Dimethylhexane Dimethylhexene Dimethyl(mcthylpropy1)cyclohcxanc Dimcthylpcntanc Ethylbenzcnc Ethylbutanol Ethylcyclohexanc Ethylmethylbutene Ethylmethylcyclohexane Ethylmethylcyclopentane Ethylmcthylheptane Ethylpentenc Heptane Heptanol Hexadiene Hexane
Source: GRI 1982
Hcxcnc Iso-octane Iso-octanol Isopropylbcnzcne Mcthylbcnzcnc Methylcyclopcntane Methylene-butanediol Meth ylhcptane Mcth ylhcxane Mcth yl(mcthyletheny1)-cyclohexene Mcth ylnoncne Meth ylpentane Methylpentylh ydroperoxide Meth ylpropylpentanol Napthalcnc Nonane Nonyne Octah ydrometh ylpentalene Octane Pentane Propylbcnzene Tctrachlorocthenc Tetrahydrodimcthylfuran Tctramcthylbutanc Tetramcthylcyclopcntane Tcrramcthylhexane Tetrameth ylhexenc Tetramcthylpcntanc Trichlorethanc Trichloroct h ylene Trimcthylcyclohexane Trimethylcyclopentane
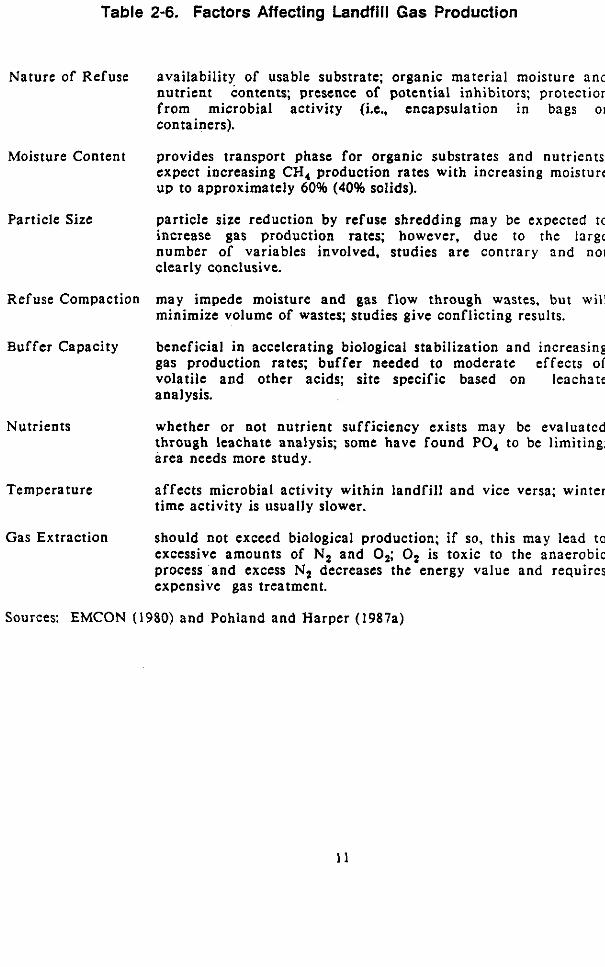
Table 2-6. Factors Affecting Landfill Gas Production
Nature of Refuse availability of usable substrate; organic material moisture and nutrient contents; presence of potential inhibitors; protection from microbial activity (Le., encapsulation i n bags or containers).
Moisture Content provides transport phase fo r organic substrates and nutrients; expect increasing CH, production rates with increasing moisture up to approximately 60% (40% solids).
particle size reduction by refuse shredding may be expected to increase gas production rates; however, due to the largc number of variables involved, studies are contrary and not clearly conclusive.
Particle Size
Refuse Compaction may impede moisture and gas flow through wastes, but will minimize volume of wastes; studies give conflicting results.
beneficial in accelerating biological stabilization and increasing gas production rates; buffer needed to moderate effects of volatile and other acids; site specific based on leachate analysis.
Buffer Capacity
Nutrients whether or not nutrient sufficiency exists may be evaluated through leachate analysis; some have found PO, to be limiting; area needs more study.
affects microbial activity within landfill and vice versa; winter time activity is usually slower.
should not exceed biological production; if so, this may lead to excessive amounts of N, and 0,; 0, is toxic to the anaerobic process and excess N, decreases the energy value and requircs expensive gas treatment.
Sources: EMCON (1980) and Pohland and Harper (1987a)
Temperature
Gas Extraction
There are several methods available for formulating projections of gas yield from landfills. Theoretical and empirical approaches a re reviewed in detail by EMCON (1980) and Pohland and Harper (1987a). These are not useful in sizing
recovery equipment, but can be used to predict gas yields. The theoretical models
make use of stoichiometric and kinetic methods. Because they fail to include numerous factors and assume 100% recovery of gases produced, a t best these a re
rough estimates of potential gas production. Field and laboratory observations are
the best indicator of actual gas yields in landfills. Gas yield production rate
predictions are generally obtained by comparing the overall gas yields from laboratory studies to stabilization time, by installing observation wells, or by literature comparison.
CHAPTER 3 BIOGAS COMBUSTION CALCULATIONS
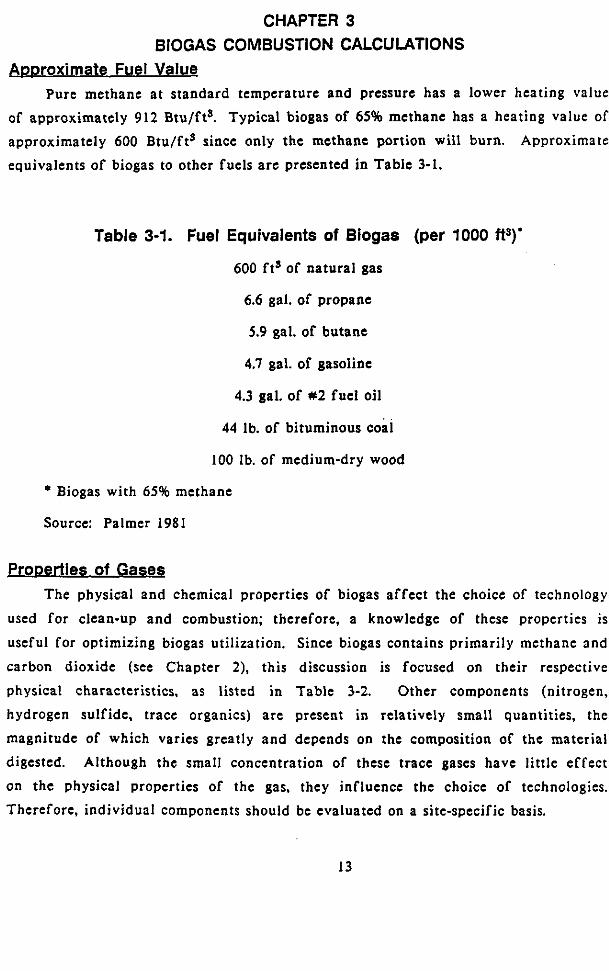
ADDroximate Fuel Value Pure methane a t standard temperature and pressure has a lower heating value
of approximately 912 Btu/ft3. Typical biogas of 65% methane has a heating value of approximately 600 Btu/ft3 since only the methane portion will burn. Approximate
equivalents of biogas to other fuels arc presented in Table 3-1.
Table 3-1. Fuel Equivalents of Biogas (per 1000 ft3)'
600 f t s of natural gas
6.6 gal. of propane
5.9 gal. of butane
4.7 gal. of gasoline
4.3 gal. of #2 fuel oil
44 Ib. of bituminous coal
100 Ib. of medium-dry wood
* Biogas with 65% methane
Source: Palmer 1981
Properties of Gases The physical and chemical properties of biogas affect the choice of technology
used for clean-up and combustion; therefore, a knowledge of these properties is
useful for optimizing biogas utilization. Since biogas contains primarily methane and
carbon dioxide (see Chapter 2), this discussion is focused on their respective
physical characteristics, as listed in Table 3-2. Other components (nitrogen,
hydrogen sulfide, trace organics) a r e present in relatively small quantities, the
magnitude of which varies greatly and depends on the composition of the material
digested. Although the small concentration of these trace gases have little effect
on the physical properties of the gas, they influence the choice of technologies. Therefore, individual components should be evaluated on a site-specific basis.
13
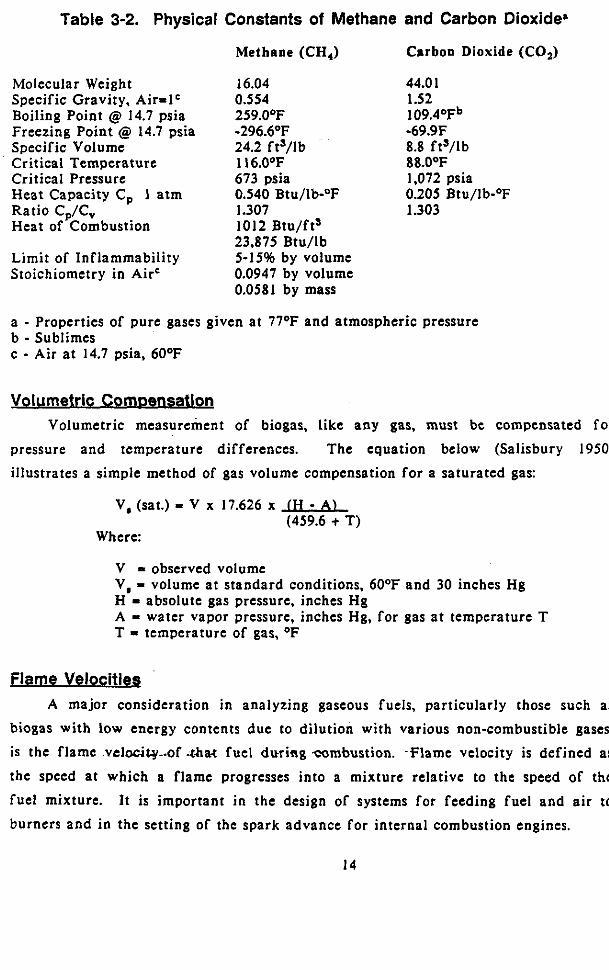
Table 3-2. Physical Constants of Methane and Carbon Dioxide"
Methane (CH,) Carbon Dioxide (CO,)
Molecular Weight Specific Gravity, Air=lc Boiling Point @J 14.7 psia Freezing Point @ 14.7 psia Specific Volume Critical Temperature Critical Pressure Heat Capacity C, 1 atm Ratio C,/C, Heat of Combustion
Limit of Inflammability Stoichiometry in AirC
16.04 44.01 0.554 1.52 259.0'F 109A0Fb -296.6'F -69.9F 24.2 fts/lb 8.8 f t v b I 16.0°F 88.OoF 673 psia 1,072 psia
1.307 1.303 1012 Btu/fts 23,875 Btu/lb 5-15% by volume 0.0947 by volume 0.0581 by mass
0.540 Btu/lb-OF 0.205 Btu/lb-OF
a - Properties of pure gases given a t 77OF and atmospheric pressure b - Sublimes c - Air a t 14.7 psia, 6OoF
Volumetric Co mDensatlo n Volumetric measurement of biogas, like any gas, must be compensated for
pressure and temperature differences. The equation below (Salisbury 1950)
illustrates a simple method of gas volume compensation for a saturated gas:
V, (sat.) = V x 17.626 x IH - A) (459.6 + T)
Where:
V = observed volume V, = volume a t standard conditions, 60°F and 30 inches Hg H = absolute gas pressure, inches Hg A = water vapor pressure, inches Hg, for gas a t temperature T T = temperature of gas, O F
Flame Velocitiea A major consideration in analyzing gaseous fuels, particularly those such as
biogas with low energy contents due to dilution with various non-combustible gases,
is the flame .vclociy..of -that fuel during com4ustion. -Flame velocity is defined as
the speed a t which a flame progresses into a mixture relative to the speed of the
fue l mixture. It is important in the design of systems for feeding fuel and air to
burners and i n the setting of the spark advance for internal combustion engines.
14
The impact of carbon dioxide concentrations on flame velocities over the limits
of inflammability of a methane/carbon dioxide mixture are illustrated in Figure 3-1. The information can be used to compare the performance of a combustion system
designed for natural gas that will be modified for operation on biogas. The data
were computed using techniques outlined in Salisbury (1950).
t - 0 .8 - u 0 -I 0.6- UI w UI ZE
0 . P .
5 0.2 U
0.0
Figure 3-1. Flame Velocity as a Function of Carbon Dioxide Concentration
.,....,.... \ ......... ..... . ,,.. ..... 2 o r c o 2 ''.... ....
..__ ..__ ..__ ... .._. ... ... .._ ...__. I_.-. .______, ,~~~______......
___..-- , . _..- 40 I C02 __.".
:.- .''
-._ -.- .-._._, -.-. - -, 60 2 Cot
BTOGAS FLAHE VELOCITY
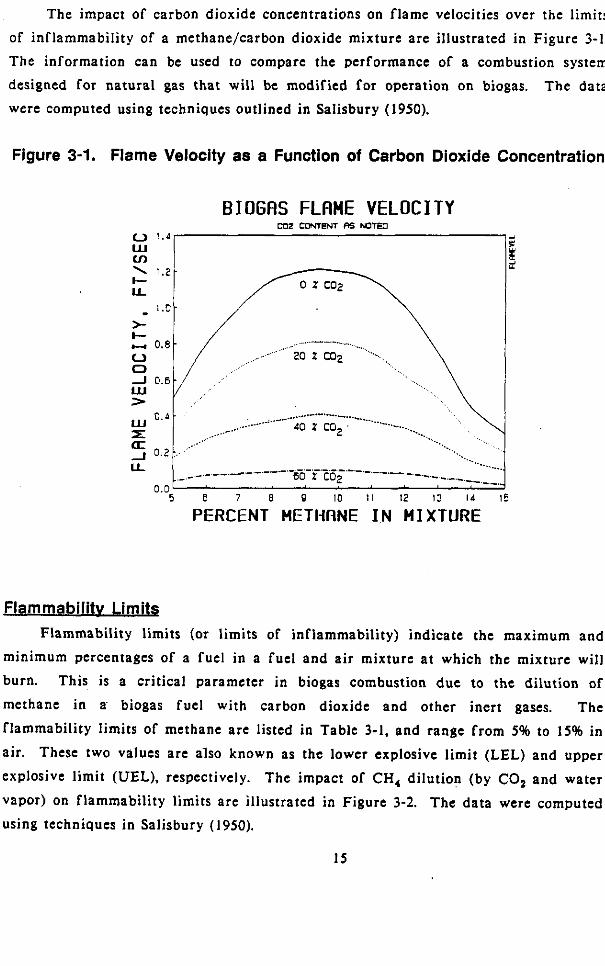
Flammabilitv Limits Flammability limits (or limits of inflammability) indicate the maximum and
minimum percentages of a fuel in a fuel and a i r mixture a t which the mixture will
burn. This is a critical parameter in biogas combustion due to the dilution of
methane in a biogas fuel with carbon dioxide and other inert gases. The
flammability limits of methane are listed in Table 3-1, and range from 5% to 15% in air. These two values arc also known as the lower explosive limit (LEL) and upper
explosive limit (UEL), respectively. The impact of CH, dilution (by CO, and water
vapor) on flammability limits are illustrated in Figure 3-2. The data were computed using techniques in Salisbury (1950).
I5
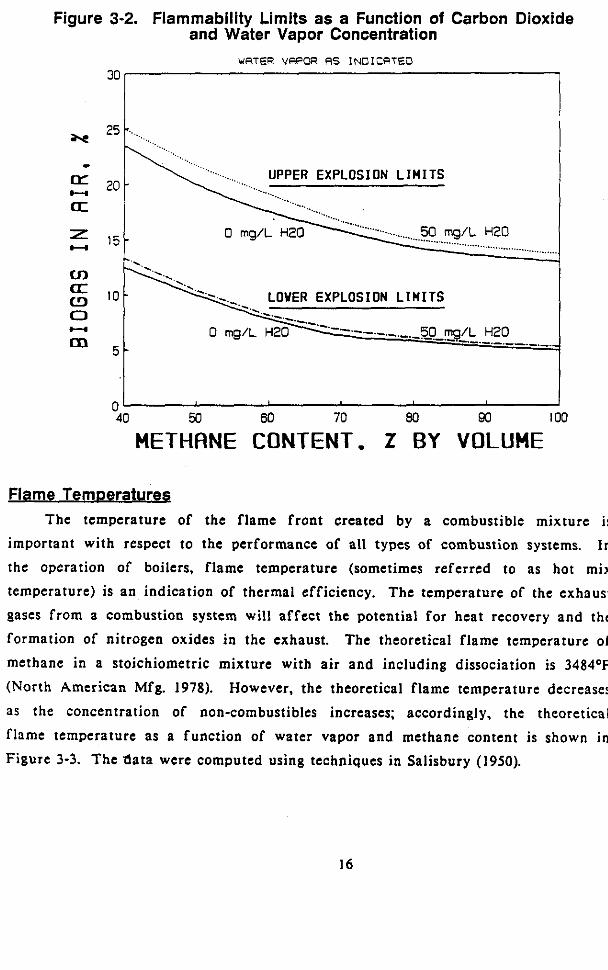
Figure 3-2. Flammability Limits as a Function of Carbon Dioxide and Water Vapor Concentration
WRTER VRPOR RS INDICRTED 30
25 1.. .... UPPER EXPLOSION LIMITS
....
LOVER EXPLOSION LIMITS 0 c-.l
I
0 40 50 60 70 80 SI) I
METHANE CONTENT. Z BY VOLUME 0
Flame Termeraturea The temperature of the flame front created by a combustible mixture is
important with respect to the performance of all types of combustion systems. I n
the operation of boilers, flame temperature (sometimes referred to as hot mix
temperature) is an indication of thermal efficiency. The temperature of the exhaust
gases f rom a combustion system will affect the potential for heat recovery and the
formation of nitrogen oxides in the exhaust. The theoretical flame temperature of methane in a stoichiometric mixture with a i r and including dissociation is 3484OF
(North American Mfg. 1978). However, the theoretical flame temperature decreases
as the concentration of non-combustibles increases; accordingly, the theoretical
f lame temperature as a function of water vapor and methane content is shown i n Figure 3-3. The da ta were computed using techniques in Salisbury (1950).
16
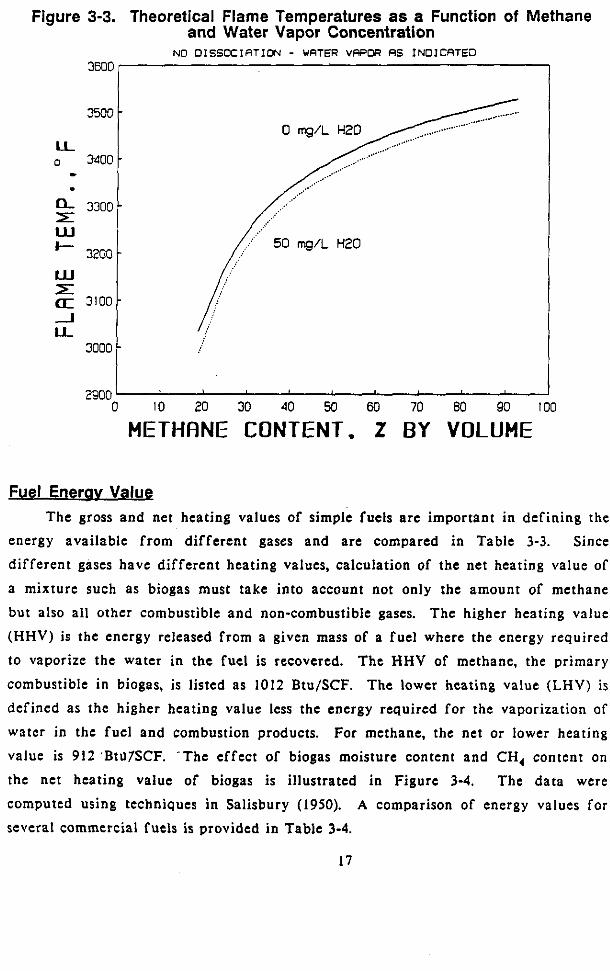
Figure 3-3. Theoretical Flame Temperatures as a Function of Methane and Water Vapor Concentration
NO DISSOCIflTION - WATER V R P W RS INDlCATEO
3500 -
LL 0 3000- - . 11 3300 r: UI
-
3200 - UI E (r 3100 - -I U
3000 -
2900 ' 0 I O 20 30 40 50 60 70 80 90 100
METHANE CONTENT. Z BY VOLUME
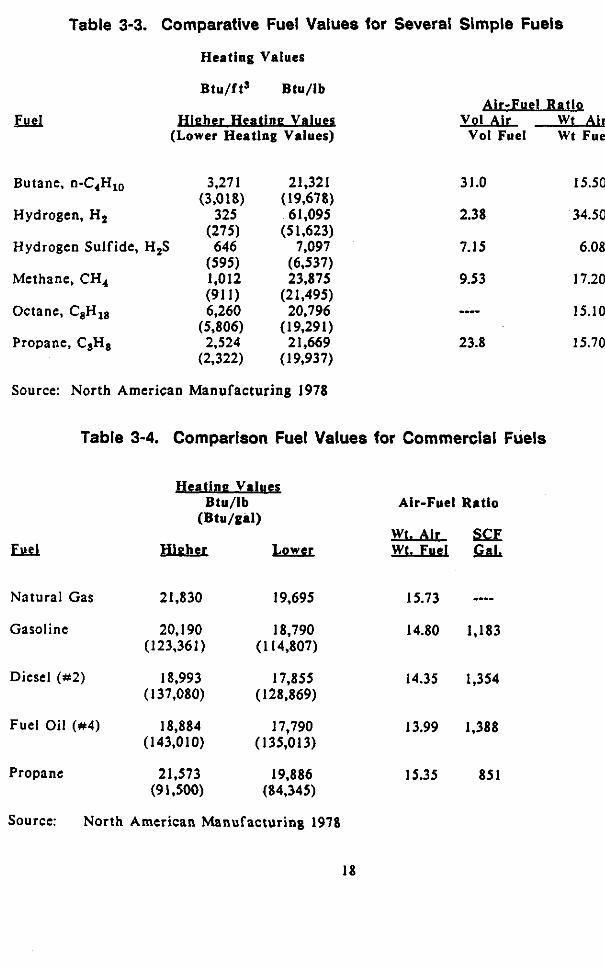
Fuel Enerav Value The gross and net heating values of simple fuels are important in defining the
energy available from different gases and are compared in Table 3-3. Since
different gases have different heating values, calculation of the net heating value of a mixture such as biogas must take into account not only the amount of methane
but also all other combustible and non-combustible gases. The higher heating value
(HHV) is the energy released from a given mass of a fuel where the energy required
to vaporize the water in the fuel is recovered. The HHV of methane, the primary
combustible in biogas, is listed as 1012 Btu/SCF. The lower heating value (LHV) is
defined as the higher heating value less the energy required for the vaporization of water in the fuel and combustion products. For methane, the net or lower heating
value is 912 'BtU7SCF. -The effect of biogas moisture content and CH, content on
the net heating value of biogas is illustrated in Figure 3-4. The data were
computed using techniques in Salisbury (1950). A comparison of energy values for several commercial fuels is provided in Table 3-4.
17
J
Table 3-3. Comparative Fuel Values for Several Simple Fuels
Heating Values
Btu/ftS Btu/lb
p ieher Heatine Value3 (Lower Heatlng Values)
Butane, n-C,H,, 3.271 21,321 (3,018) (19,678)
Hydrogen, H, 325 6 I ,095 (275) (51,623)
Hydrogen Sulfide, H,S 646 7,097
Methane, CH, 1,012 23,875 (91 I 1 (21.4951
(595) (6,537)
Octane, C8H18 6,260 .20,796 (5,806) (19,291)
Propane, CSH8 2,524 2 1.669 (2,322) (1 9,937)
Octane, C8H18 6,260 .20,796 (5,806) (19,291)
Propane, CSH8 2,524 2 1.669 (2,322) (1 9,937)
Air-Fuel RatiQ Vol Air Wt Air
Vol Fuel Wt Fuel
31.0
2.38
7.15
9.53
--.- 23.8
Source: North American Manufacturing 1978
Table 3-4. Comparison Fuel Values for Commercial Fuels
w
Natural Gas
Gasoline
Diesel (#2)
Fuel Oil (#4)
Propane
21.830 19,695
20,190 18,790 (1 23.36 1) ( I 14,807)
18,993 17,855 (137,080) (128,869)
18,884 17,790 (143,010) (135,013)
21.573 19,886 (9 1.500) (84,345)
15.50
34.50
6.08
17.20
15.10
15.70
Air-Fuel Ratio
~~
~~
15.73 ---- 14.80 1,183
14.35 1.354
13.99 1.388
15.35 85 I
Source: North American Manufacturing 1978
18
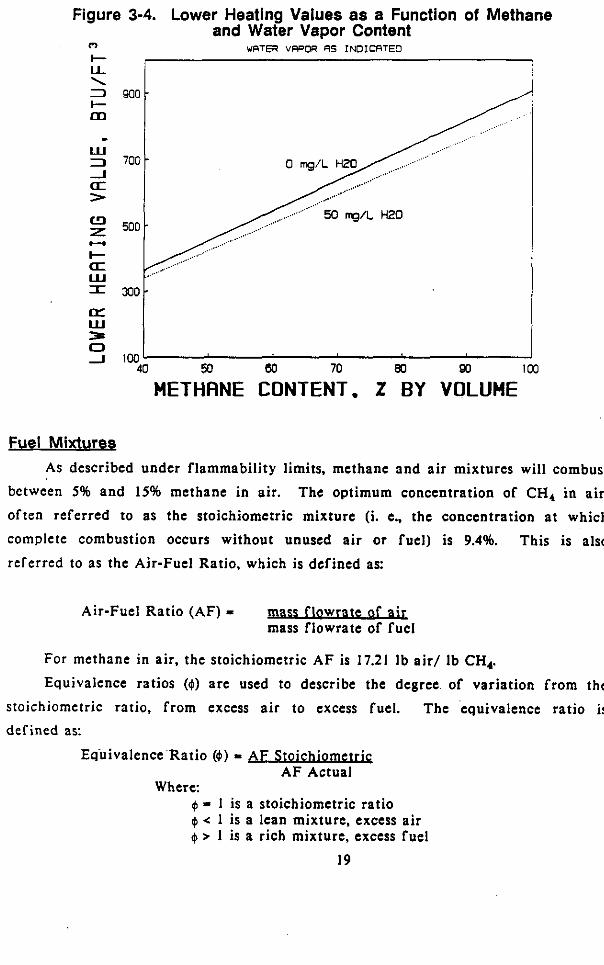
Figure 3-4. Lower Heating Values as a Function of Methane and Water Vapor Content
WRTER VRPOR RS INDICRTED
3
E l , , , , , 0
J 100 40 50 80 70 80 90 100
HETHRNE CONTENT. Z BY VOLUME
Fuel Mixtures As described under flammability limits, methane and air mixtures will combust
between 5% and 15% methane in air. The optimum concentration of CH, in air,
often referred to as the stoichiometric mixture (i. e.. the concentration a t which complete combustion occurs without unused a i r or fuel) is 9.4%. This is also
referred to as the Air-Fuel Ratio, which is defined as:
Air-Fuel Ratio (AF) = mas flowrate of u mass flowrate of fucl
For methane in air, the stoichiometric A F is 17.21 Ib ai r / Ib CH,. Equivalence ratios ($1 are used to describe the degree of variation from the
stoichiometric ratio, from excess a i r to excess fuel. The equivalence ratio is defined as:
. . Equivalence Ra t io (4) = ,4F S t o m A F Actual
Where: $ = I is a stoichiometric ratio $ < 1 is a lean mixture, excess air 0 > 1 is a rich mixture, excess fuel
19
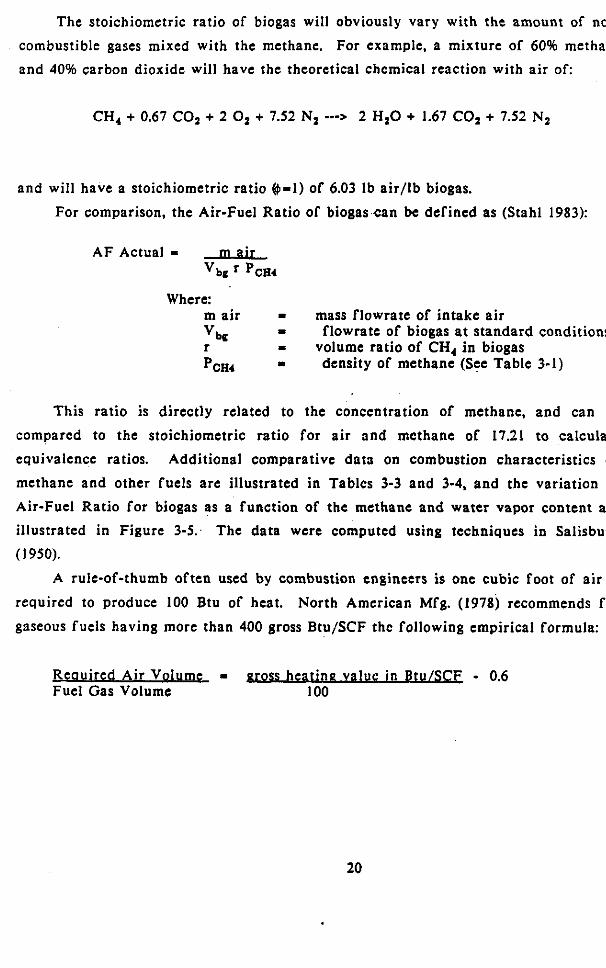
The stoichiometric ratio of biogas will obviously vary with the amount of non- combustible gases mixed with the methane. For example, a mixture of 60% methane
and 40% carbon dioxide will have the theoretical chemical reaction with a i r o f
CH4 + 0.67 COZ + 2 0, + 7.52 Nz -+ 2 HzO + 1.67 COz + 7.52 Nz
and will have a stoichiometric ratio @ = l ) of 6.03 Ib air / lb biogas.
For comparison, the Air-Fuel Ratio of biogas can be defined as (Stahl 1983):
A F Actual = m air 'bg PCR4
Where: m a i r = mass flowrate of intake air 'bc r pcx4 I: density of methane (See Table 3-1)
= =
flowrate of biogas a t standard conditions volume ratio of CH4 in biogas
This ratio is directly related to the concentration of methane, and can be
compared to the stoichiometric ratio for air and methane of 17.21 to calculate
equivalence ratios. Additional comparative data on combustion characteristics of methane and other fuels are illustratcd in Tablcs 3-3 and 3-4. and the variation in
Air-Fuel Ratio for biogas as a function of the methane and water vapor content a re
illustrated in Figure 3-5. The data were computed using techniques in Salisbury (1950).
A rule-of-thumb often used by combustion engineers is one cubic foot of a i r is
North Amcrican Mfg. (1978) recommends for required to produce 100 Btu of heat.
gaseous fuels having more than 400 gross Btu/SCF thc following empirical formula:
Reauired Air Volume I oss he value i n B t u / S m - 0.6 Fuel Gas Volume 100
20
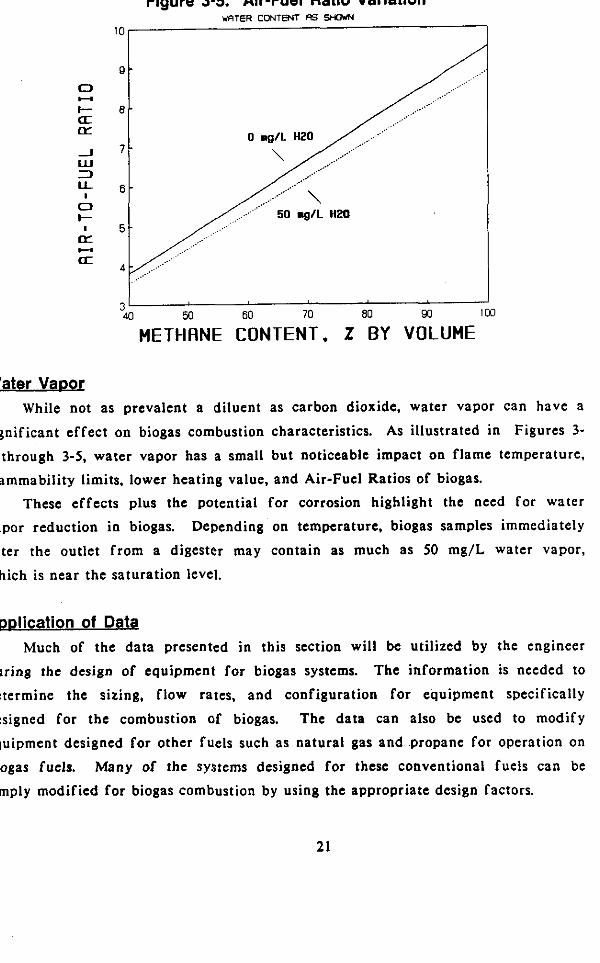
Figure 3-5. Air-Fuel Ratio Variation WRTER CONTRlT FS SHOWN
I O ,
40 50 60 70 80 90 3 ’
METHANE CONTENT. Z BY VOLUME 3
Water Vaoor While not as prevalent a diluent as carbon dioxide, water vapor can have a
significant effect on biogas combustion characteristics. As illustrated in Figures 3-
2 through 3-5, water vapor has a small but noticeable impact on flame temperature, flammability limits, lower heating value, and Air-Fuel Ratios of biogas.
These effects plus the potential for corrosion highlight the need for water vapor reduction in biogas. DeDending on temperature, biogas samples immediately
after the outlet from a digester may contain as much a s 50 mg/L water vapor,
which is near the saturation level.
Amlication of Data Much of the data presented in this section will be utilized by the engineer
during the design of equipment for biogas systems. The information is needed to
determine the sizing. flow rates, and configuration for equipment specifically
designed for the combustion of biogas. The data can also be used to modify equipment designed for other fuels such as natural gas and propane for operation on biogas fuels. Many of the systems designed for these conventional fuels can be simply modified for biogas combustion by using the appropriate design factors.
21

However, as discussed in Chapter 2, the biogas produced from a digester and landfill can change in composition depending on a number of factors. Changes in feed, loading rates, temperature and other factors can significantly a f fec t the composition of the biogas produced. Therefore, a knowledge of the data discussed
in this chapter is important to the operator of a biogas utilization system when
analyzing problems in the performance of a biogas combustion system.
22
CHAPTER 4
HANDLING AND COLLECTION OF BlOGAS
Introduction The systems and equipment required for collection of biogas f r erobic
system or landfill, and for biogas transport to the combustion equipment, and/or to
other pieces of equipment such as compressors, clean-up systems, and storage tanks are discussed in this chapter. Most of this equipment consists of piping and valves,
but special designs and materials are required for the removal of condensed water and the prevention of corrosion.
PiDina Svs temg Design and Ooerat ine Press- . The operating pressure
handling systems will generally be less than 1 psig (30 inches wa
m an
of most biogas
:r olum , w.c.).
However, if the system contains a compressor, some piping in the system could havc
an operating pressure as high as 500 psig. Most systems will need a relief valve;
therefore, the maximum operating pressure will be the set pressure of the relief
valve. If a system with a compressor does not have a relief valve, the maximum operating pressure will be the shut-off pressure of the compressor which occurs when the gas flow through the compressor is zero and the output pressure is a
maximum.
The design pressure used for determination of pipe and valve wall thickness
schedules should be computed as follows:
Design Pressure = 1.5 x Maximum Operating Pressure
High pressure systems should be hydrostatically tested to assure that there are
no safety problems with the system. The pressure at which the system should be
hydrostatically tested is computed as follows:
Hydrostatic Test Pressure = 1.5 x Design Pressure
Pesinn and Ooeratinn Temoeratures. The temperature of the biogas will be
approximately the same as the temperature of the source from which the gas is
produced, i. e., digester or landfill. The maximum operating temperature of a biogas
handling system will be approximately lSO°F since the highest temperature biogas generators known are thermophilic digesters which operate best at a temperature of
23
131°F. If the gas is compressed without cooling to remove the heat of compression,
the gas temperature will be significantly increased. The gas temperature can be
computed as follows:
Tcompreiior out Teomprasor in x (Podpin)
where:
TeompnlSor Out = Compressor Outlet Gas Temperature (OR). Tcompreilor in = Compressor Inlet Gas Temperature (OR),
Pout - Compressor Outlet Pressure (psig), Pin - Compressor Inlet Pressure (psig). and
TOR = TOF + 460
The design temperature is computed as follows:
Design Temperature = 1.5 x Maximum Operating Temperature
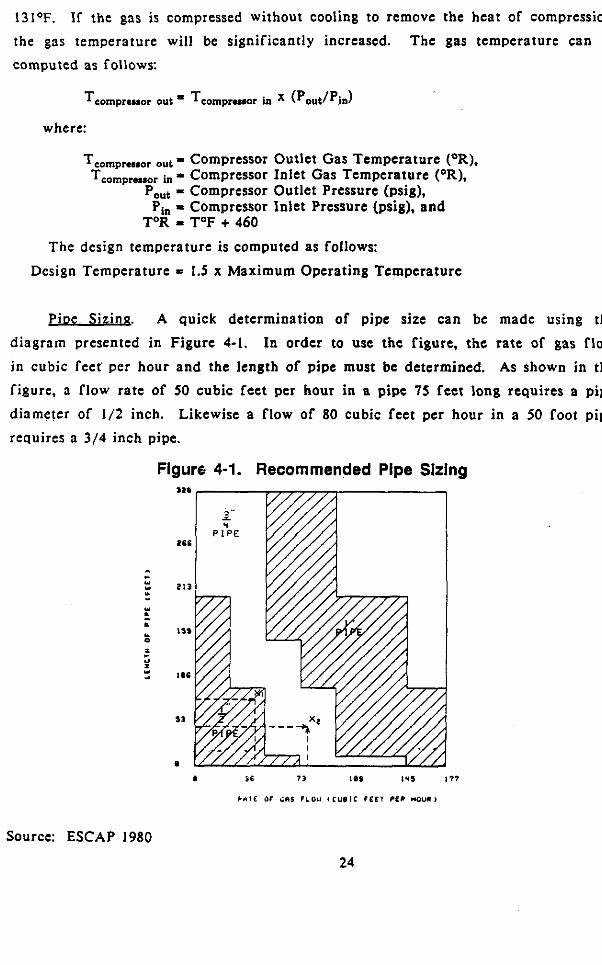
PiDe S izirlg. A quick determination of pipe sire can be made using the
diagram presented in Figure 4-1. In order to use the figure, the rate of gas flow
in cubic fee t per hour and the length of pipe must be determined. As shown in the figure. a flow rate of 50 cubic feet per hour in a pipe 75 feet long requires a pipe
diameter of 1/2 inch. Likewise a flow of 80 cubic feet per hour in a 50 foot pipe
requires a 3/4 inch pipe.
Figure 4-1. Recommended Pipe Sizing
Source: ESCAP 1980
24
Pioe Th ' ickness Se lectipn . The design pressure and temperature computed in
the preceding sections are used to select the pipe thickness. In general, most low
pressure systems can use standard weight pipe (Schedule 40). but high pressure systems usually require heavier walls. Carbon steel should be adequate for all low
pressure systems but other materials may not. The temperature and pressure rating
of any material other than carbon steel, stainless steel, or galvanized iron should be checked, and the pipe should not be used if this information cannot be obtained.
Some materials may be marked with an indication such as ASTM D-124. This
indicates that information on the material can be obtained from the American
Society for Testing and Materials (ASTM). The wall thickness needed for high pressure piping depends on several factors
such as the design pressure, material, corrosion allowances, and allowances for
threaded ends (if used). ANSI B31.1, Code for Pressure Piping, should be used for
the determination of the wall thickness of all high pressure piping systems. Materiab. Once the design temperature and pressure of the handling and
collection system have been established, the materials for the system can be selected. T h e advantages and disadvantages of the more common materials used i n
biogas handling and collection systems are compared in Table 4-2. High pressure
systems will require steel or iron pipe, but plastic piping may be preferred for ease of installation with low pressure systems.
Pioine Codex . State and local building codes and/or insurance carriers may require that the biogas piping systems be designed in accordance with national
codes or standards. Table 4-3 lists the principal codes that may apply to biogas
piping systems as published by the American Society for Testing and Materials
(ASTM) and the American National Standards Institute (ANSI).
SDecial Cons iderations for Pioe I n s t a l m . There are other additional considerations which should be incorporated in the design of a piping system.
Accidental B rea k w - One of the major dangers with piping systems
transporting a combustible gas (particularly plastics) is the
susceptibility of the these systems to accidental breakage by plant
personnel, vehicles, or animals. Methods of pipe protection include burying pipes in soil and placing heavy steel pipes near plastic
piping that could be accidentally broken.
25
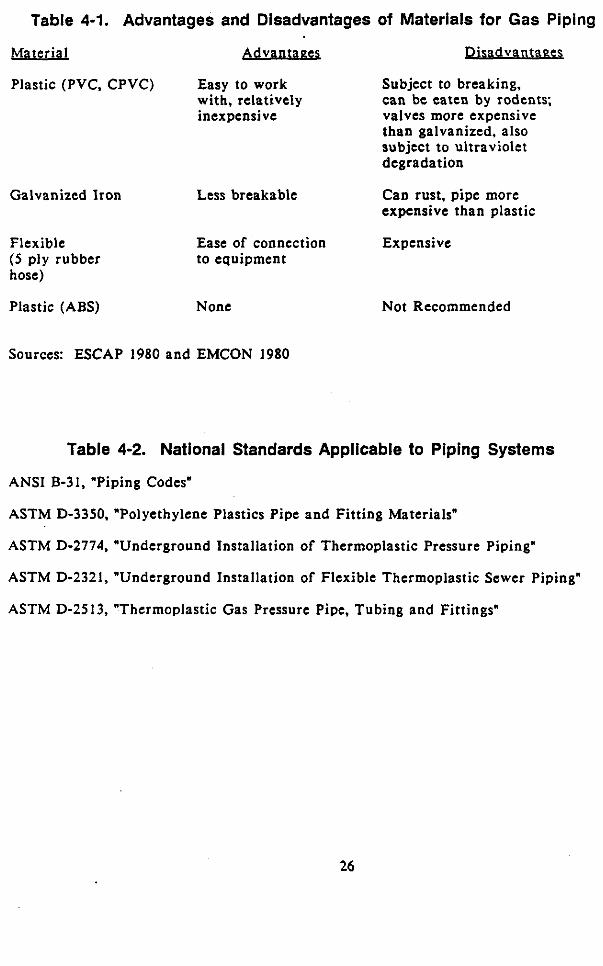
Table 4-1. Advantages and Disadvantages of Materials for Gas Piping
Material Adv- P i s a d v a n t w
Plastic (PVC, CPVC) Easy to work Subject to breaking, with, relatively inexpensive valves more expensive
can be eaten by rodents;
than galvanized, also subject to ultraviolet degradation
Galvanized Iron Less breakable Can rust, pipe more expensive than plastic
Flexible ( 5 ply rubber hose)
Ease of connection Expensive to equipment
Plastic (ABS) None Not Recommended
Sources: ESCAP 1980 and EMCON 1980
Table 4-2. National Standards Applicable to Piping Systems
ANSI B-31, "Piping Codes"
ASTM D-3350, "Polyethylene Plastics Pipe and Fitting Materials"
ASTM D-2774, "Underground Installation of Thermoplastic Pressure Piping"
ASTM D-2321, "Underground Installation of Flexible Thermoplastic Sewer Piping"
ASTM D-2513, "Thermoplastic Gas Pressure Pipe, Tubing and Fittings"
26
Vibration Isolation - Compressors can potentially transmit vibration
loads to plastic pipe or plastic storage vessels, which could eventually damage these components. Vibration dampers may be
required to preclude transmission of vibration loads. Thermal E xDans ion - Thermal loads could be placed on plastic pipe
or storage vessels by steel pipe heated by combustion or compression equipment. Thermal expansion loops or joints may be required to reduce these loads and prevent damage to equipment.
Valves A summary of the advantages and disadvantages of the different types of
valves that can be used in biogas systems is presented in Table 4-3. Valve material
selection is subject to the same restrictions as piping systems. Brass ball valves
(brass taps) can be used; but, these must not contain any lead as hydrogen sulfide
tends to attack the lead and destroy the tap.
Painting All metallic piping should be painted to prevent rust or corrosion. Painting
should be accomplished regardless of whether or not the pipe is indoors, outdoors,
or buried. Table 4-4 contains some recommendations on paint f o r biogas handling
and collection equipment.
Condensate Drains
quantity of water vapor contained in the gas.
pipe, all horizontal runs of pipe should be installed with a pipe slope of 1:lOO.
condensate drain must be located a t all low points in the piping.
One of the major problems associated with handling biogas is the large
In order to remove water from the
A
There are a number of different systems which can be used for draining
condensate from a pipe. Figures 4-2 through 4-5 illustrate a manual system (tee), a
U-pipe drain, a siphon system, and a water outlet device. The main advantages and
disadvantages of each system are listed in Table 4-6.
21
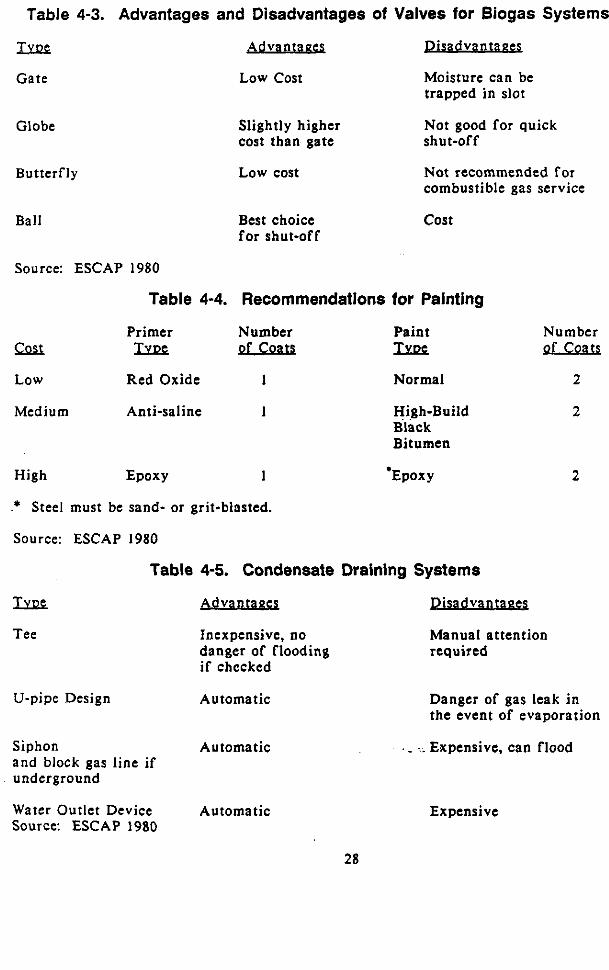
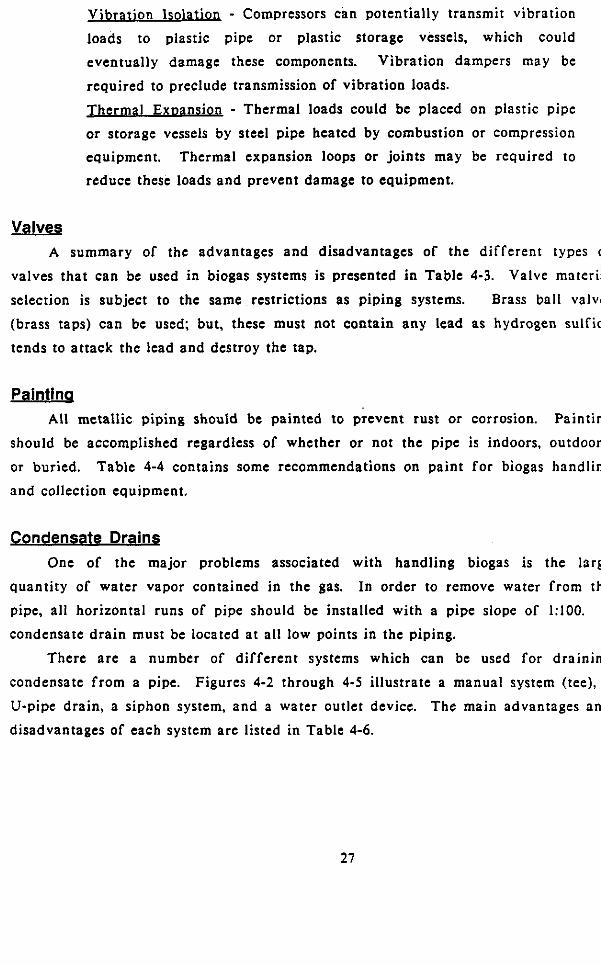
Table 4-3. Advantages and Disadvantages of Valves for Biogas Systems
IYRC Advant- P i s a d v a n t a m
Gate
Globe
Butterfly
Ball
Low cost Moisture can be trapped in slot
Not good for quick Slightly higher cost than gate shut-off
Low cost Not recommended for combustible gas service
Best choice cos t for shut-off
Source: ESCAP 1980
Table 4-4. Recommendations for Painting
Primer Number Paint Number ! a L IYQG Quhass Tmr; QxQm Low Red Oxide 1 Normal 2
Medium Anti-saline 1
High Epoxy 1
*
Source: ESCAP 1980
Steel must be sand- or grit-blasted.
High-Build 2 Black Bitumen
Table 4-5. Condensate Draining Systems
Advan- p i s a d v m
Tee Inexpensive, no danger of flooding if chccked
U-pipe Design Automatic
Manual attention required
2
Danger of gas leak i n the event of evaporation
Siphon Automatic - ._ Expensive, can flood and block gas line if underground
Water Outlet Device Automatic Source: ESCAP 1980
Expensive
28
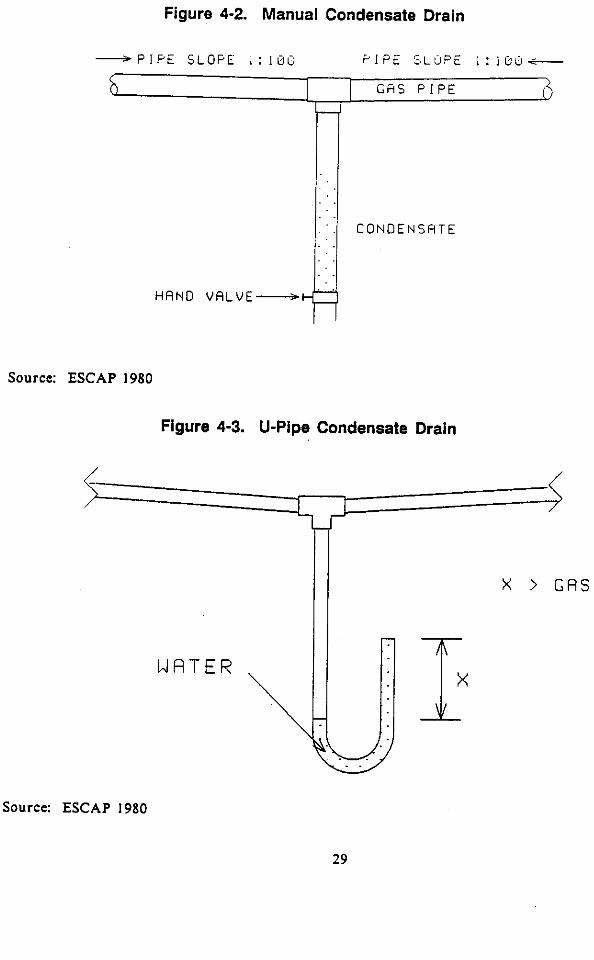
Figure 4-2. Manual Condensate Drain
. .
. .
. . :. . .
C O N O E N S H T E
Source: ESCAP 1980
Figure 4-3. U-Pipe Condensate Drain
Source: ESCAP 1980
X > G A S P R E S S U R
29
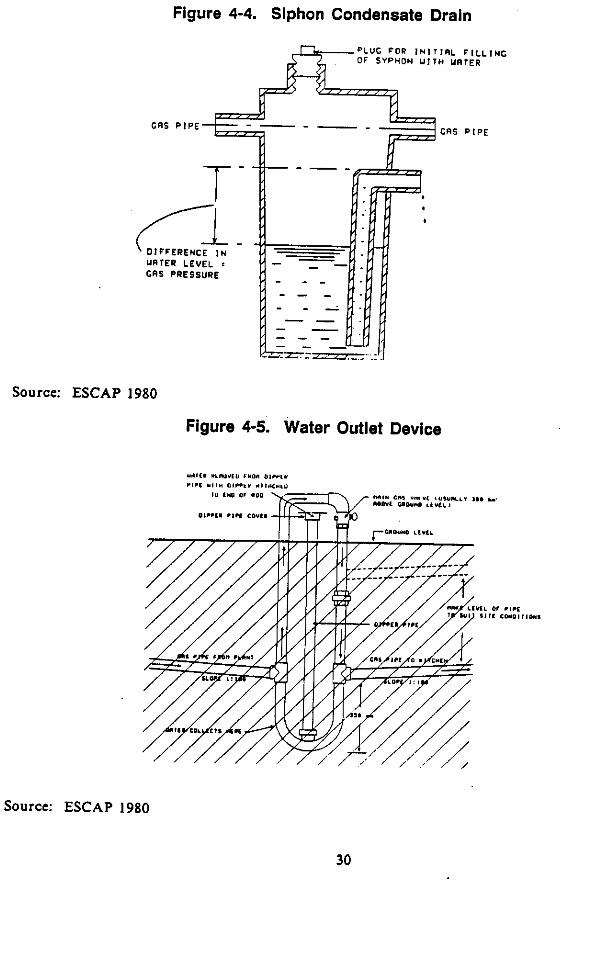
Figure 4-4. Siphon Condensate Drain
PLUG F O R I N l l l l L F I L L I N G OF SYPHON UllH URrER
CRS P I P E +---- GRS P I P E
T -
<i DIFFERENCE I N - unmu LEVEL I
CRS PRESSURE
Source: ESCAP 1980
Figure 4-5. Water Outlet Device
Source: ESCAP 1980
30
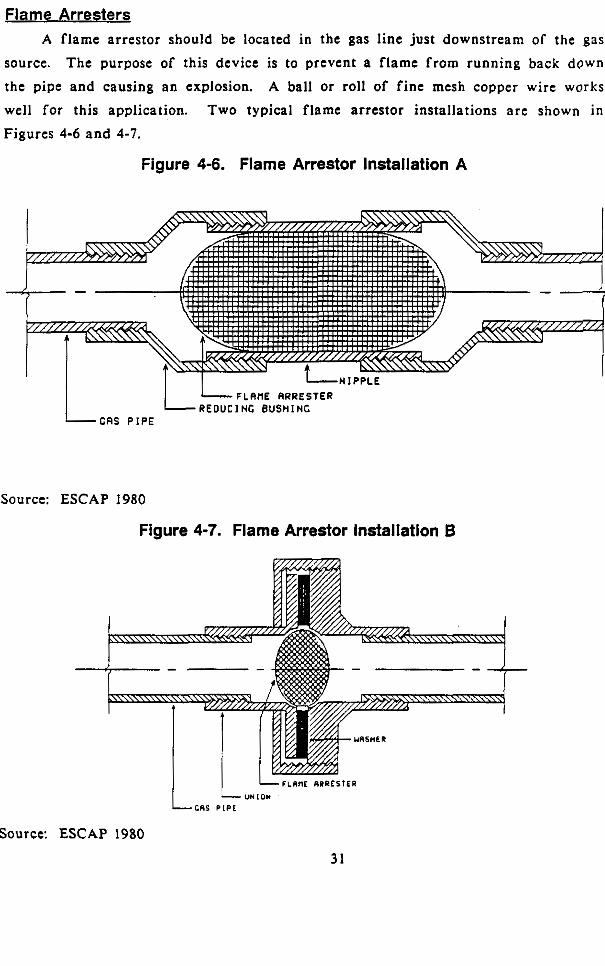
Flame Arresters A f lame arrestor should be located in the gas line just downstream of the gas
source. The purpose of this device is to prevent a flame from running back down the pipe and causing an explosion. A ball or roll of f ine mesh copper wire works well for this application. Two typical flame arrestor installations are shown i n Figures 4-6 and 4-7.
Figure 4-6. Flame Arrestor Installation A
I I LFLR~E RRRESTER -REDUCING BUSHI NC
I C R S P I P E
Source: ESCAP 1980
Figure 4-7. Flame Arrestor Installation B
Source: ESCAP 1980
31
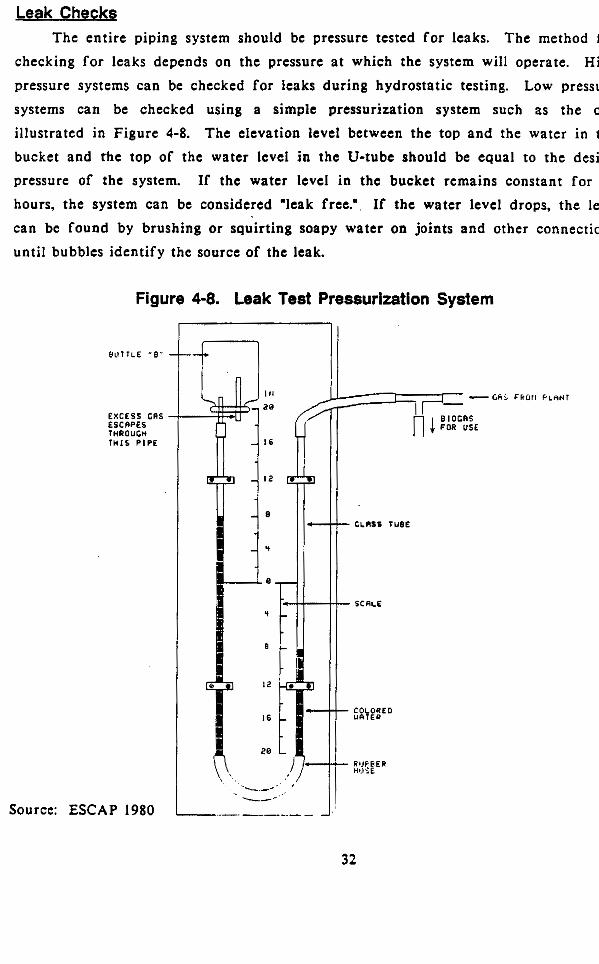
Leak Checks The entire piping system should be pressure tested fo r leaks. The method for
checking f o r leaks depends on the pressure a t which the system will operate. High
pressure systems can be checked for leaks during hydrostatic testing. Low pressure
systems can be checked using a simple pressurization system such as the one illustrated in Figure 4-8. The elevation level between the top and the water in the bucket and the top of the water level in the U-tube should be equal to the design pressure of the system. If the water level in the bucket remains constant for 12
hours, the system can be considered "leak free." If the water level drops, the leak can be found by brushing or squirting soapy water on joints and other connections
until bubbles identify the source of the leak.
Figure 4-8. Leak Test Pressurization System
Source: ESCAP 1980
32
Collection from Diaesters Biogas is typically extracted from digesters with a pipe inserted in the gas
space. The pipe may be vertically or horizontally aligned. Care must be taken to
insure that the pipe is not blocked by the material being digested, by any scum or
foam layers a t the top, or by the collapse of a flexible cover.
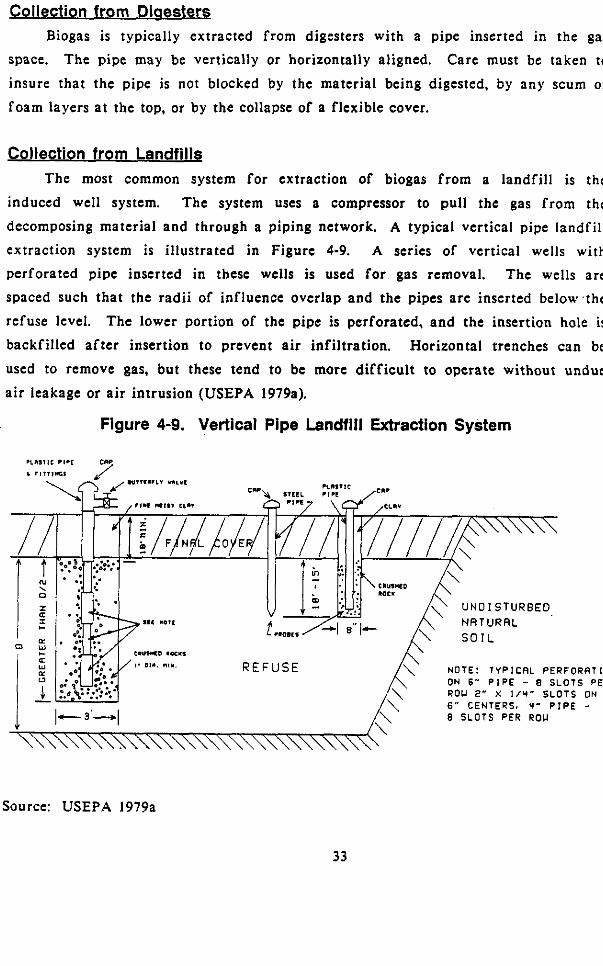
Collection from Landfills The most common system for extraction of biogas from a landfill is the
induced well system. The system uses a compressor to pull the gas f rom the
decomposing material and through a piping network. A typical vertical pipe landfill
extraction system is illustrated in Figure 4-9. A series of vertical wells with perforated pipe inserted in these wells is used for gas removal. The wells are
spaced such that the radii of influence overlap and the pipes are inserted below the refuse level. The lower portion of the pipe is perforated, and the insertion hole is
backfilled a f te r insertion to prevent a i r infiltration. Horizontal trenches can be
used to remove gas, but these tend to be more diff icul t to operate without undue
a i r leakage or a i r intrusion (USEPA 1979a).
Flgure 4-9. Vertical Pipe Landfill Extraction System
U N D I S T U R B E D
ON 6" PIPE - 8 S L O T S PER ROU 2" X 1 / Y " SLOTS ON 6" CENTERS, '4- PIPE - 8 S L O T S PER ROU
\\\\\\\\\\\\\\\\\\\\\\\\\\\\\\
Source: USEPA 1979a
33

CHAPTER 5 BIOGAS CLEAN-UP
Treatment o f Bioaas The equipment selected for the treatment of biogas will depend upon the
intended use of the gas. Product gases may be withdrawn from treatment systems
and landfills and simply flared to prevent migration and environmental impact. Alternatively, the gas can be withdrawn and sold to a consumer directly, used on-
site with or without prior treatment, or treated and sold to a consumer as pipeline
gas. The type and extent of treatment needed depends on the composition of the
gas. As seen in previous chapters, raw biogas typically has a relatively low heating value due to dilution of methane with CO,, N,, and possibly 0,. Biogas also often
contains water and hydrogen sulfide, which can be corrosive. In some cases, trace
levels of hydrocarbons are also present (particularly in landfill gases) and may be of some concern with respect to migration and environmental impact, but these
compounds may be expected to oxidize rapidly and be of minimal concern if the gas
is burned (except in internal combustion engines). Therefore, the primary objectives
of gas treatment are either the removal of corrosive constituents (hydrogen sulfide
and water), or those which dilute methane and affect the volumetric heating value
(carbon dioxide and nitrogen), or both.
Accordingly, there are a number of treatment processes available for removing water, hydrogen sulfide, carbon dioxide, and nitrogen either singularly or in
combination. These have been carefully reviewed by Jones and Perry (1976), USEPA
(1979a). Ashare (1981). Love (1983). and EMCON (1983). These are summarized and
reviewed in the remainder of this section. The gases produced by such treatment
systems may be classified on the basis of heating value as either medium BTU (500-
600 Btu/SCF) or high BTU (600-1000 Btu/SCF) gases.
Medium BTU Ga ses Medium BTU gases are useful for process heating and for driving internal
combustion engines. They are generally produced from raw biogas by removing water
vapor and/or hydrogen sulfide, with nitrogen and carbon dioxide remaining un- treated.
35
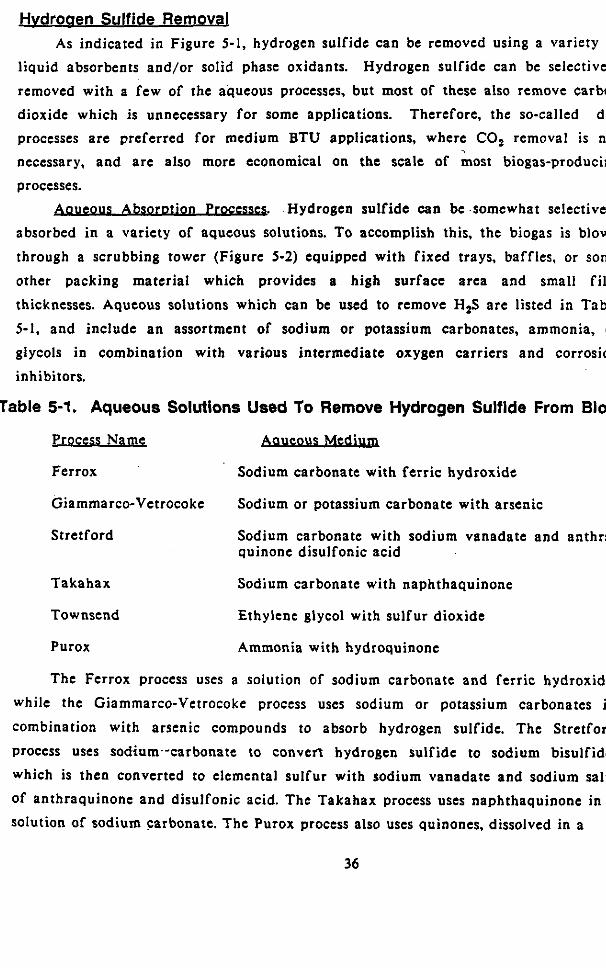
Hvdroaen S ulfide Removal As indicated in Figure 5-1, hydrogen sulfide can be removed using a variety of
liquid absorbents and/or solid phase oxidants. Hydrogen sulfide can be selectively
removed with a few of the aqueous processes, but most of these also remove carbon dioxide which is unnecessary for some applications. dry processes a re preferred for medium BTU applications, where CO, removal is not necessary, and a re also more economical on the scale of most biogas-producing
processes.
Therefore, the so-called
apueous Absoration P r o c a . Hydrogen sulfide can be somewhat selectively
absorbed in a variety of aqueous solutions. To accomplish this, the biogas is blown
through a scrubbing tower (Figure 5-2) equipped with fixed trays, baffles, or some other packing material which provides a high surface area and small f i lm
thicknesses. Aqueous solutions which can be used to remove H,S are listed in Table
5-1, and include an assortment of sodium or potassium carbonates, ammonia, or glycols in combination with various intermediate oxygen carriers and corrosion inhibitors.
Table 5-1. Aqueous Solutions Used To Remove Hydrogen Sulfide From Biogas
Process Namc
Ferrox
Giammarco-Vetrocoke
Sodium carbonate with fe r r ic hydroxide
Sodium or potassium carbonate with arsenic
Stretford Sodium carbonate with sodium vanadate and anthra- quinone disulfonic acid
Takahax Sodium carbonate with naphthaquinone
Townsend
Purox Ammonia with hydroquinone
The Ferrox process uses a solution of sodium carbonate and ferr ic hydroxide,
while the Giammarco-Vetrocoke process uses sodium or potassium carbonates in
combination with arsenic compounds to absorb hydrogen sulfide. The Stretford
process uses sodium-carbonate to convert hydrogen sulfide to sodium bisulfide,
which is then converted to elemental sulfur with sodium vanadate and sodium salts of anthraquinone and disulfonic acid. The Takahax process uses naphthaquinone in a
solution of sodium carbonate. The Purox process also uses quinones, dissolved in a
Ethylene glycol with sulfur dioxide
36
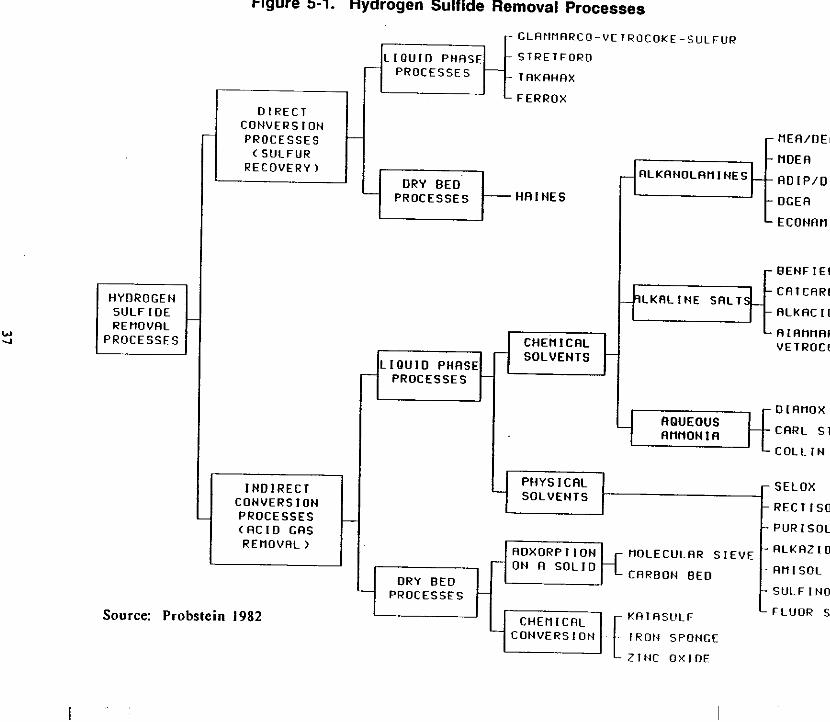
Figure 5-1. Hydrogen Sulfide Removal Processes
w 4
HYDROGEN
REt lOVAL PROCESSES
SULF I O E
D I R E C T C O N V E R S I O N PROCESSES
< S U L F U R RECOVERY)
t I N D I R E C T C O N V E R S I O N PROCESSES < A C I D C A S R E I I O V A L )
Source: Probstein 1982
C L R t l t l R R C O - V E I R a C O K E - S U L F U R
L I Q U I O PHASE STRETFORO
TRKAHRX
FERROX
PROCESSES
{-E DRY BE0 HA I NES PROCESSES
S O L V E N T S L I O U l D PHASE
PROCESSES
r B E N F I E L O
CRTCARB
R L K R C I O - t l / O l K L K R L I N E S A L T
LAIAIINRRCO- VETROCOKE
O I A t l O X tF C A R L S T I L L
LCOLLIN
SELOX
R E C T I S O L
PUR I S O L I
R L K R Z I O
A m I SOL
S U L F I NOL
t lOLECULRR S I E V E ON A
CRRBON B E 0 DRY B E 0
PROCESSES K R T R SLIL F FLUOR SOLVENT
I R O N SPONGE
Z I N C O X I D E
CHEI I I CRL
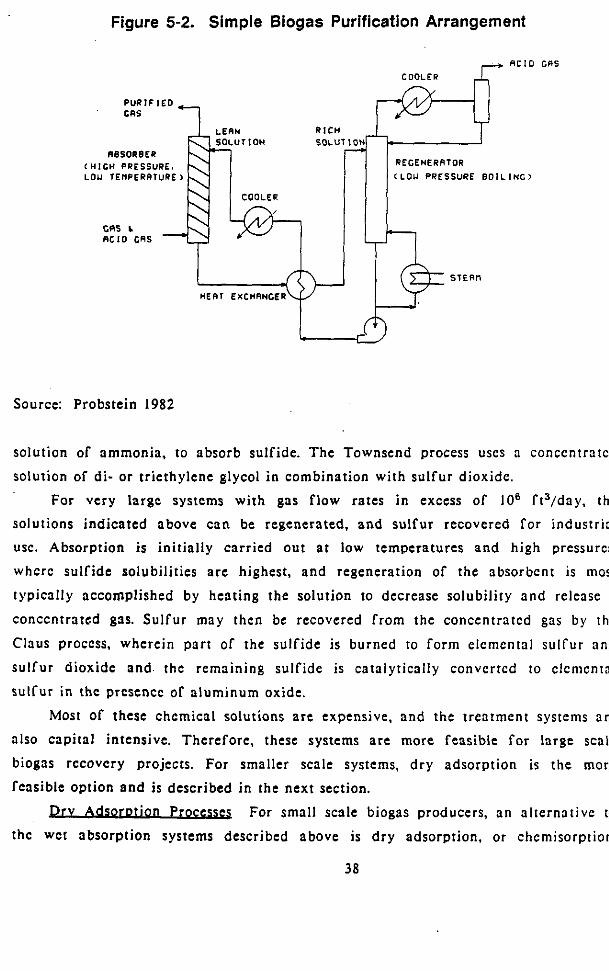
Figure 5-2. Simple Biogas Purification Arrangement
COOLER "ID
CRS
IBSORBER ( H I G H PRESSURE. LOU 1 E M P E R R f U R E l ( L O U PRESSURE BOILING)
REGENERRTOR
H E R 1 EXCHRNCE
Source: Probstein 1982
COS
solution of ammonia, to absorb sulfide. The Townsend process uscs a conccntratcd
solution of di- or triethylene glycol in combination with sulfur dioxide.
For very large systems with gas flow rates i n excess of IO6 fts/day. thc
solutions indicated above can be regenerated. and sulfur recovered fo r industrial use. Absorption is initially carried out a t low temperaturcs and high pressures,
whcrc sulfide solubilities are highest, and regeneration of the absorbcnt is most
typically accomplished by heating the solution to decrease solubility and release o
conccntrated gas. S u l f u r may then be recovered from the concentratcd gas by thc
Claus proccss. wherein part of the sulfide is burned to form elemental s u l f u r and
sulfur dioxide and the remaining sulfide is catalytically convcrtcd to clcnicntal
sulfur in thc prcsencc or aluminum oxide.
Most of these chemical solutions are expensive, and the treatment systems arc
also capital intensive. Therefore, these systems a re more feasible for large scale
biogas rccovcry projects. For smaller scale systems, dry adsorption is the morc feasible option and is described in the next section.
p r v AdsorDtion P r o c w For small scale biogas producers, an alternative to
thc Wet absorption systems described above is dry adsorption, or chemisorption.
38
Several dry processes are available, using particles Of either activated carbon, molecular sieve, or iron sponge to remove sulfide from the gas phase to the solid phase. These are sometimes referred to as d ry oxidation processes because
elemental sulfur or oxides of sulfur are produced (and can be recovered) during oxidative regeneration of the catalyst.
Activated carbo n adsorbs and oxidizes sulfide to elemental sulfur. Activated carbon has a very high surface area (4,400 to 5,300 in2 per ounce), a wide variety
of pore sizes, and a slightly charged nature which attracts both inorganic and
organic compounds. The carbon is loaded into two or more sequential pressure
vessels and the gas pumped through the packed beds. As the surface area of the
carbon becomes saturated with sulfur, the acid gas begins to appear in the gaseous effluent, and indicates that one of the vessels needs to be recharged or regener- ated. Activated carbon is typically regenerated with steam, a t temperatures up to 750 OF. Activated carbon is widely available from a large assortment of commercial
manufacturers.
Molecular sieves can be used to remove hydrogen sulfide, mercaptans, water, and a number of other impurities. Molecular sieves consist of activated alumina or
silica compounds which have a high aff ini ty for polar molecules. They provide
surface areas up to 1,300 in2 per ounce and have well-defined pore sizes which
allow Cor selective removal of different compounds. Regeneration of the surface area on saturated materials is accomplished by passing a heated gas (400 to 6OO0F)
through the reactor bed. Molecular sieves are best suited to selective water and sulfur removal on a small to medium scale.
The iron soon= process uses coated pellets or wood shavings impregnated with ferric oxide to chemically bind sulfur to iron. The amount of sulfur which can be
removed is stoichiometrically linked to the amount of iron provided. System design
is based on the concentration of sulfide in the gas and the bulk density of the sponge material.
In the removal (scrubbing) process, hydrogen sulfide reacts with ferric oxide impregnated in wood shavings to form ferric sulfide and water. The gas is pumped
through a sponge bed similar in construction to an activated carbon or molecular sieve reactor, where the iron sponge is supported on screens or trays in a cylindrical or rectangular tower. The linear gas velocity is kept below 10 f t /min to assure adequate reaction time and contact opportunity. The process may be operated
a t pressures ranging from ambient to several hundred psig. Efficient operation can
39
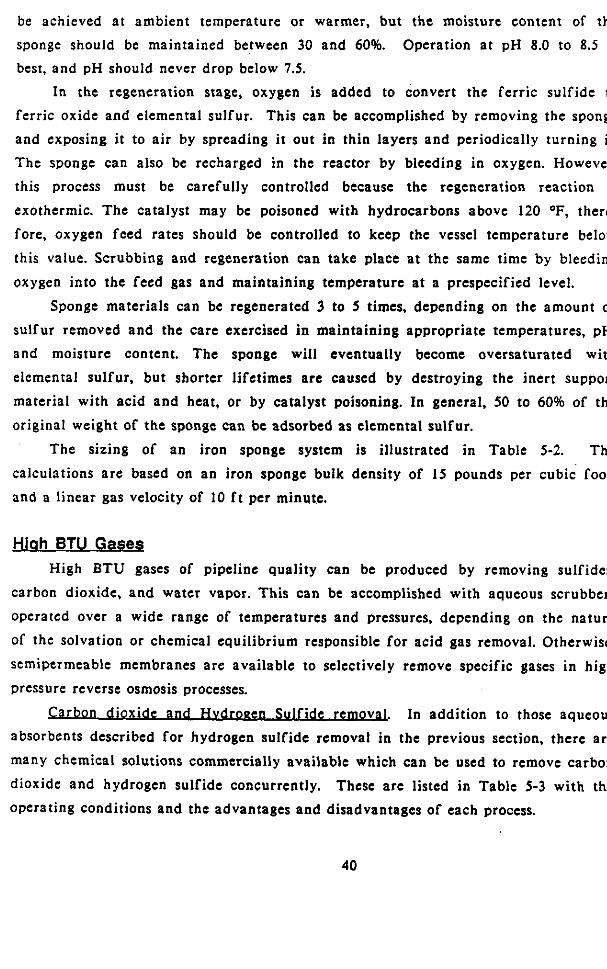
be achieved a t ambient temperature or warmer, but the moisture content of the sponge should be maintained between 30 and 60%. Operation a t pH 8.0 to 8.5 is best, and pH should never drop below 7.5.
In the regeneration stage, oxygen is added to convert the ferric sulfide to ferric oxide and elemental sulfur. This can be accomplished by removing the sponge and exposing it to air by spreading it out in thin layers and periodically turning it.
The sponge can also be recharged in the reactor by bleeding in oxygen. However,
this process must be carefully controlled because the regeneration reaction is exothermic. The catalyst may be poisoned with hydrocarbons above 120 OF, there-
fore, oxygen feed rates should be controlled to keep the vessel temperature below
this value. Scrubbing and regeneration can take place a t the same time by bleeding
oxygen into the feed gas and maintaining temperature a t a prespecified level.
Sponge materials can be regenerated 3 to 5 times, depending on the amount of sulfur removed and the care exercised in maintaining appropriate temperatures, pH,
and moisture content. The sponge will eventually become oversaturated with elemental sulfur, but shorter lifetimes are caused by destroying the inert support material with acid and heat, or by catalyst poisoning. In general, 50 to 60% of the
original weight of the sponge can be adsorbed as elemental sulfur.
The sizing of a n iron sponge system is illustrated in Table 5-2. The
calculations a re based on an iron sponge bulk density of I5 pounds per cubic foot, and a linear gas velocity of 10 f t per minute.
Hiah BTU Gas eg High BTU gases of pipeline quality can be produced by removing sulfides,
carbon dioxide, a n d water vapor. This can be accomplished with aqueous scrubbers
operated over a wide range of temperatures and pressures, depending on the nature
of the solvation or chemical equilibrium responsible for acid gas removal. Otherwise,
semipermeable membranes are available to selectively remove specific gases in high
pressure reverse osmosis processes.
Carbon dioxide and H v d r o w Sulfide rem0 v a . . .
In addition to those aqueous absorbents described for hydrogen sulfide removal in the previous section, there are many chemical solutions commercially available which can be used to remove carbon
dioxide and hydrogen sulfide concurrently. These are listed in Table 5-3 with the operating conditions and the advantages and disadvantages of each process.
40
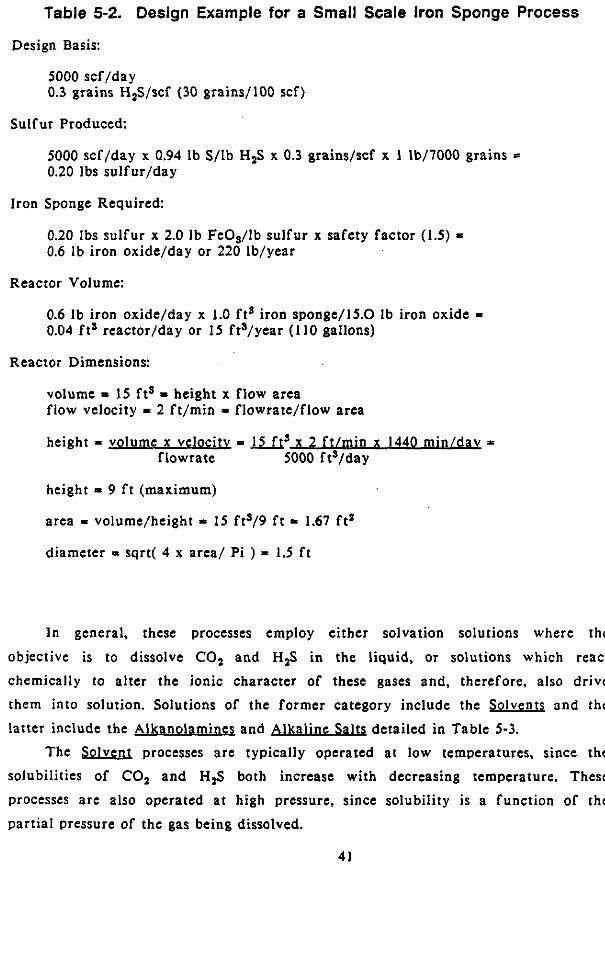
Table 5-2. Design Example for a Small Scale Iron Sponge Process
Design Basis:
5000 scf/day 0.3 grains H,S/scf (30 grains/100 scf)
Sulfur Produced
5000 scf/day x 0.94 lb S/lb H,S x 0.3 grains/scf x 1 lb/7000 grains 0.20 Ibs sulfur/day
Iron Sponge Required:
0.20 Ibs sulfur x 2.0 Ib FeO,/lb sulfur x safety factor (1.5) = 0.6 Ib iron oxide/day or 220 Ib/year
Reactor Volume:
0.6 Ib iron oxide/day x 1.0 f t5 iron sponge/l5.0 Ib iron oxide = 0.04 f t s reactor/day or I5 ft3/year (110 gallons)
Reactor Dimensions:
volume = 15 f t s = height x flow area flow velocity = 2 f t /min = flowrate/flow area
f lowrate 5000 ft3/day height = volume x veloc i t r = LLfrs x 2 f t /m in x 1440 min/day r
height = 9 f t (maximum)
area = volume/height - 15 fts/9 f t - 1.67 f t z
diameter I sqrt( 4 x area/ Pi ) = 1.5 f t
In general, these processes employ either solvation solutions where the objective is to dissolve CO, and H,S in the liquid, or solutions which react
chemically to alter the ionic character of these gases and, therefore, also drive
them into solution. Solutions of the former category include the Solvenu and the
latter include the Alkanolamlncs ' and detailed in Table 5-3. The Solvent processes are typically operated at low temperatures, since the
solubilities of CO, and H,S both increase with decreasing temperature. These
processes are also operated a t high pressure, since solubility is a function of the
partial pressure of the gas being dissolved.
41
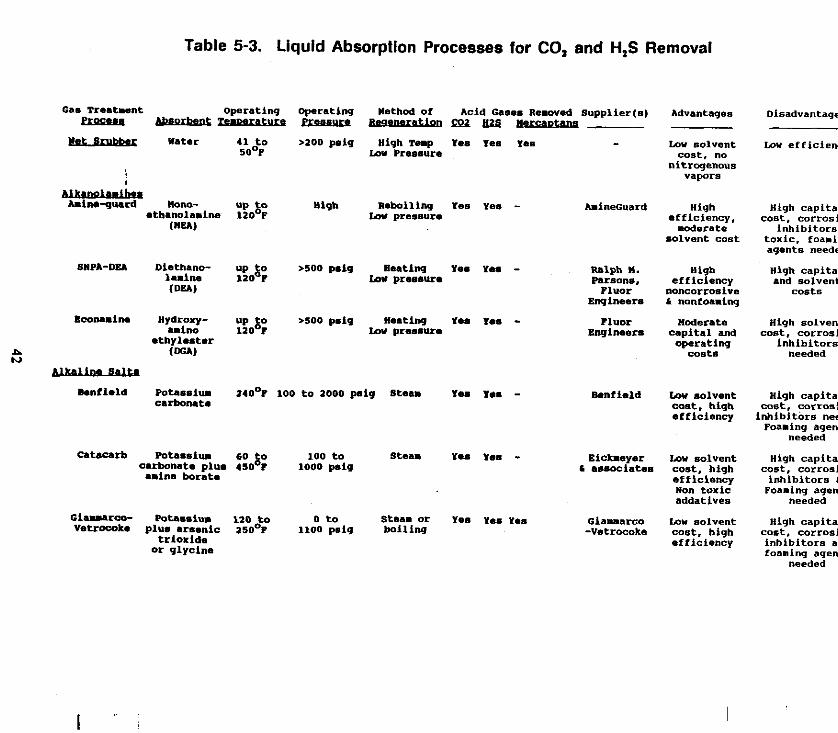
Table 5-3. Liquid Absorption Processes for CO, and H,S Removal
Can Treatment Oprating Operating Nethod of Acid Gases Removed Supplier(s) Advantages
"lkkc water 41 to >200 p i g High Temp Yee Yes Ye. L a w solvent
nitrogenous
- Ak"S-PUUUYllR.4.ncrotlonrPZBZPIl.rca.ran. -
50% M Pressure cost, "0
\ vapors
R & l l i n g Yell Ye* - Amineouard High M pressure efficiency,
AmlM-gtUld HOM- UP 80 H i * mthanolsmine 120 P
(-1 loderate solvent cost
BonClmld Potassium a40°r too to aooo poi9 stem em YO. - carbonate
Ralph N. High Parsons, efficiency
noncorrosive Engineers L nonfoaming
Fluor
nuor Noderate Englneen capital and
ooeratlna costs
amfield Lw solvent Cost. high et f iciency
m t a a S b PotsSSittm 60 $0 100 to steam Y.. 1.8 - Eicheyer law solvent carbonate plum 450 I moo p i g L mssoclates cost, high amine borate efficiency
Non toxii addatives
G i s v a r c o - potausiu 120 to 0 to stoa. or Yes Yes Yes Giauarco L a w solvent Vetro-wk* plu8 arsenic a50°1 1100 psiq boiling -Vatrocoke cost, high
triorlde efficiency or glycine
Disadvantages
L a w efficiency
High capital
toxic. inhibitors foaming
agents needed
High capital and solvent
costs
cost, corrosive
High solvent cost. corrosion
inhibitors needed
High capital met, corrosion lnhlbitbrs needed Foaming agents
needed
High capital cost, corrosion inhibitors L Foaming agents
needed
High capital cost, corrosion inhibitors and foaming agents
needed
I
P W
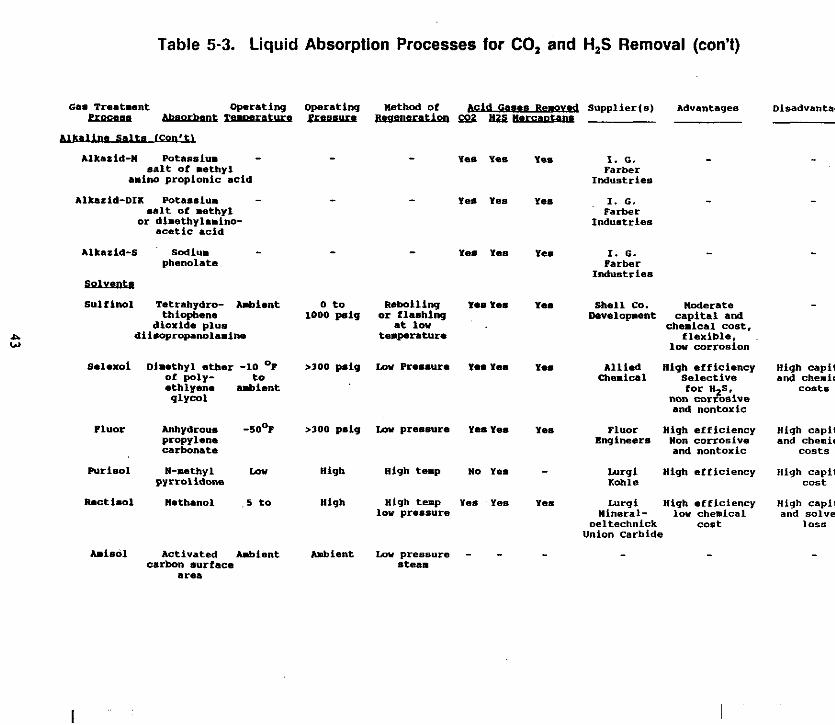
Table 5-3. Liquid Absorption Processes for CO, and H,S Removal (con’t)
Gas Treatment -rating em!ans -- Alkarld-n Potassium -
salt of methyl amino propionic acid
Alkarld-DIK Potassium - salt of methyl
or dlmethylamlno- acetic acid
Alkarid-S sodium - - phenolate Sulfinol Tetrahydro- Ambient
thiophene dioxide plus
diieopropanolamlne
Salexoi Dimethyl ether -10 OF Of ply- to ethlyen. anbient glycol
Fluor Anhydroue -5O0P propylene carhnate
Furlsol H-methyl Lon
n*ctiaol nethanol 5 to
pyrrolidone
Amis01 Activated Ambient carbon surface
area
Oprating nethod Of Suppllerls) Advantages e u r u v u ~ y p Z W l ” s M U
- Yeu Y e s Yes 1. 0. - Farber
Industries
Ye. Yes Yes 1. G. - - Fak-ber
Indumtries
YES res re. I. GI - - Farber
Industries
. . at lo”
tuprature che;ical cost,
flexible, In, corrosion
>3oo puiq M wesaure res YE. res Allied High Selective efficiency chemical
for H.S. non corconive and nontoxic
Engineers non corrosive and nontoxic
>loo p i g lov prsmsure Yesre. YES Fluor High efficiency
High High temp No Yes - Lurgi High efficiency Kohle
High High temp Yes Yes Yes lurgi High efficiency low pr**sure Mineral- low chemical
oeltechnick cost Union Carbide
Ambient l i ~ w pressure - - - - - steam
Disadvantages
High capital and chemical
coeta
High capital and chemical
costs
High capital cost
High capital and solvent
lose
I
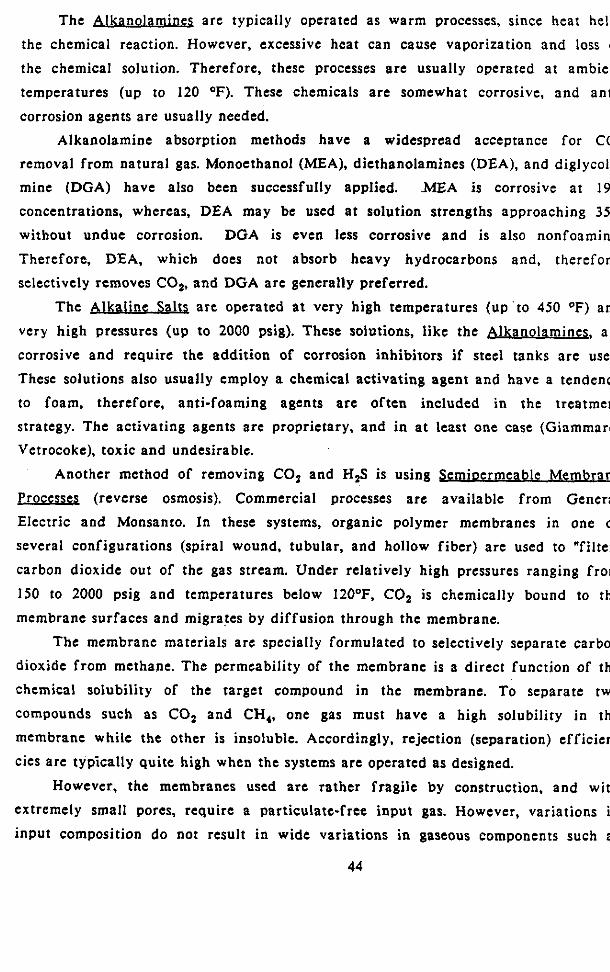
The Alkanolamines are typically operated as warm processes, since heat helps
the chemical reaction. However, excessive heat can cause vaporization and loss of
the chemical solution. Therefore, these processes a re usually operated a t ambient
temperatures (up to 120 OF). These chemicals are somewhat corrosive, and anti-
corrosion agents are usually needed. Alkanolamine absorption methods have a widespread acceptance for CO,
removal from natural gas. Monoethanol (MEA), diethanolamines (DEA), and diglycola- mine (DGA) have also been successfully applied. MEA is corrosive a t 19%
concentrations, whereas, DEA may be used a t solution strengths approaching 35% without undue corrosion. DGA is even less corrosive and is also nonfoaming.
Therefore, DEA, which does not absorb heavy hydrocarbons and, therefore,
selectively removes CO,, and DGA are generally preferred.
The Alkali ne Salt$. are operated at very high temperatures (up to 450 OF) and
very high pressures (up to 2000 psig). These solutions, like the b lkano lamines, are corrosive and require the addition of corrosion inhibitors if steel tanks a re used. These solutions also usually employ a chemical activating agent and have a tendency
to foam, therefore, anti-foaming agents a re often included in the treatment
strategy. The activating agents are proprietary, and in a t least one case (Giammarc- Vetrocoke), toxic and undesirable.
Another method of removing CO, and H2S is using Semioermeable Membranc
Processes (reverse osmosis). Commercial processes are available from General
Electric and Monsanto. In these systems, organic polymer membranes in one of several configurations (spiral wound, tubular, and hollow fiber) are used to "filter"
carbon dioxide out of the gas stream. Under relatively high pressures ranging from
150 to 2000 psig and temperatures below 12OoF, C 0 2 is chemically bound to the membrane surfaces and migrates by diffusion through the membrane.
The membrane materials are specially formulated to selectively separate carbon
dioxide from methane. The permeability of the membrane is a direct function of the
chemical solubility of the target compound in the membrane. To separate two
compounds such as CO, and CH,, one gas must have a high solubility in the
membrane while the other is insoluble. Accordingly, rejection (separation) efficien-
cies are typically quite high when the systems are operated as designed.
However, the membranes used a re rather fragile by construction, and with
extremely small pores, require a particulate-free input gas. However, variations in input composition do not result in wide variations in gaseous components such as
44
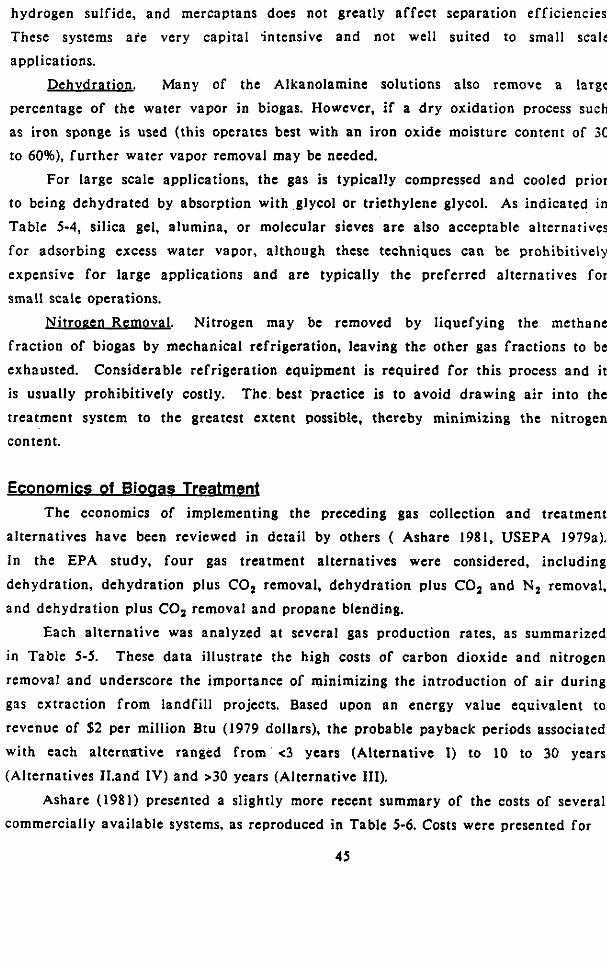
hydrogen sulfide, and mercaptans does not greatly affect separation efficiencies.
These systems a i e very capital .intensive and not well suited to small scale
applications. Dehvdration. Many of the Alkanolamine solutions also remove a large
percentage of the water vapor in biogas. However, i f a d ry oxidation process such as iron sponge is used (this operates best with an iron oxide moisture content of 30
to 60%). fur ther water vapor removal may be needed. For large scale applications, the gas is typically compressed and cooled prior
to being dehydrated by absorption with glycol or triethylene glycol. As indicated in
Table 5-4, silica gel, alumina, or molecular sieves are also acceptable alternatives
for adsorbing excess water vapor, although these techniques can be prohibitively expensive for large applications and are typically the preferred alternatives for
small scale operations.
Nitrogen Remo V a l . Nitrogen may be removed by liquefying the methane
fraction of biogas by mechanical refrigeration, leaving the other gas fractions to be
exhausted. Considerable refrigeration equipment is required for this process and i t
is usually prohibitively costly. The best practice is to avoid drawing air into the
treatment system to the greatest extent possible, thereby minimizing the nitrogen
content.
Economics of Biocras Treatme nt The economics of implementing the preceding gas collection and treatment
alternatives have been reviewed in detail by others ( Ashare 1981, USEPA 1979a).
In the EPA study, four gas treatment alternatives were considered, including
dehydration, dehydration plus CO, removal. dehydration plus CO, and N, removal, and dehydration plus CO, removal and propane blending.
Each alternative was analyzed a t several gas production rates, as summarized
in Table 5-5. These data illustrate the high costs of carbon dioxide and nitrogen
removal and underscore the importance of minimizing the introduction of a i r during
gas extraction from landfill projects. Based upon a n energy value equivalent to
revenue of $2 per million Btu (1979 dollars). the probable payback periods associated
with each alternative ranged f r o m - <3 years (Alternative I) to IO to 30 years
(Alternatives II.and IV) and >30 years (Alternative 111).
Ashare (1981) presented a slightly more recent summary of the costs of several
commercially available systems, as reproduced in Table 5-6. Costs were presented for
45
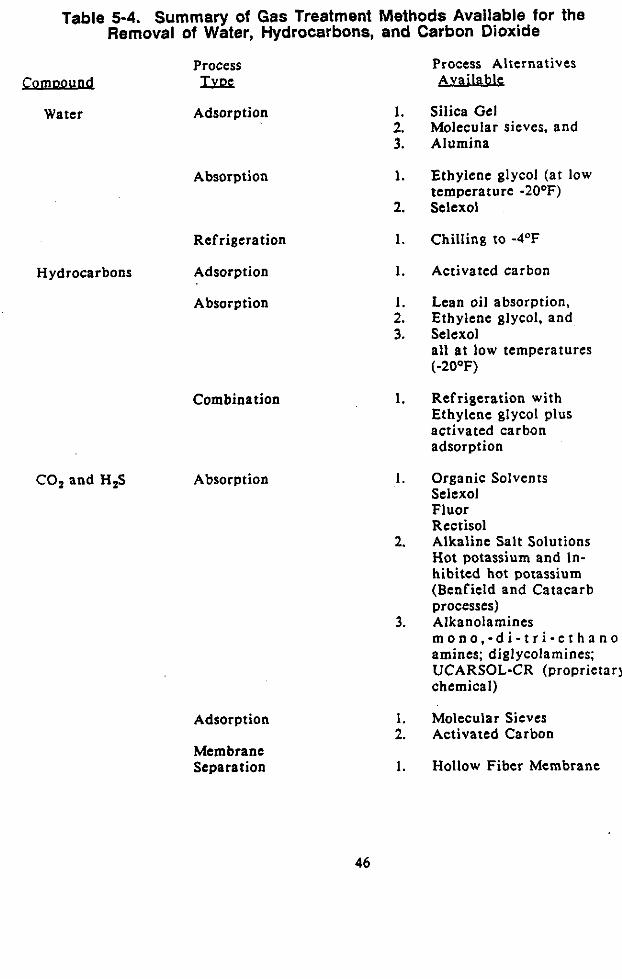
Table 5-4. Summary of Gas Treatment Methods Available for the Removal of Water, Hydrocarbons, and Carbon Dioxide
Process Comoound m2€
Water Adsorption
Absorption
Hydrocarbons
CO, and H,S
Refrigeration
Adsorption
Absorption
Combination
Absorption
Adsorption
Membrane Separation
1. 2. 3.
1.
2.
1.
1. 1.
2. 3.
1.
1.
2.
3.
1. 2.
1.
Process Alternatives ,%vailabl!:
Silica Gel Molecular sieves, and Alumina
Ethylene glycol (at low temperature -20°F) Selexol
Chilling to -4'F
Activated carbon
Lean oil absorption, Ethylene glycol, and Selexol all a t low temperatures (-20'F)
Refrigeration with Ethylene glycol plus activated carbon adsorption
Organic Solvents Sclexol Fluor Rectisol Alkaline Salt Solutions Hot potassium and ln- hibited hot potassium (Benfield and Catacarb processes) Alkanolamines m o n o . - d i - t r i - e t h r n o l amines; diglycolamines; UCARSOL-CR (proprietary chemical)
Molecular Sieves Activated Carbon
Hollow Fiber Membrane
46
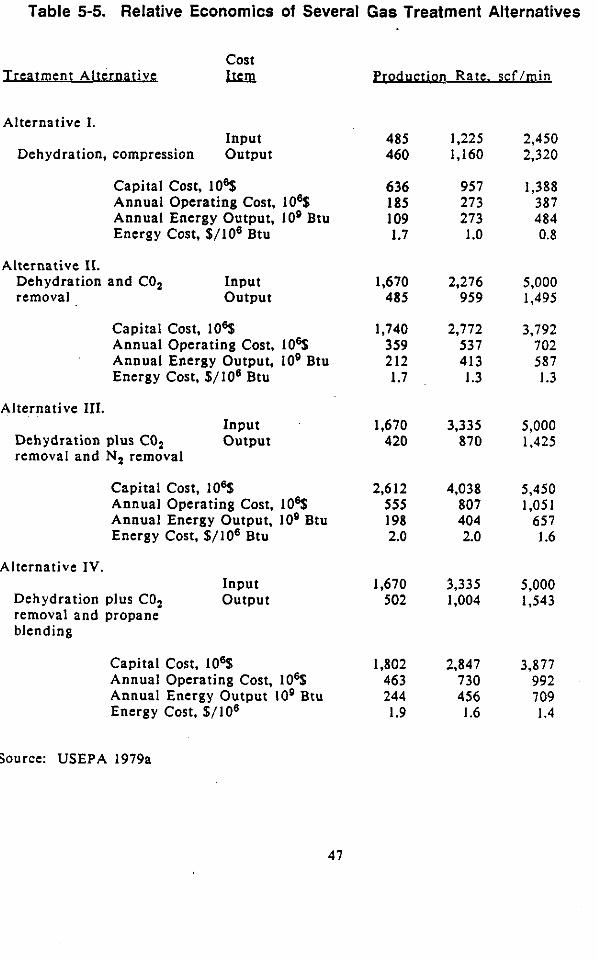
Table 5-5. Relative Economics of Several Gas Treatment Alternatives
cost Treatme nt Alternative mQ Product ion Rate. s cf/min
Alternative I. Input 485 1,225 2,450
Dehydration, compression Output 460 1,160 2,320
Capital Cost, 10% 636 957 1,388 Annual Operating Cost, 10% I85 273 387 Annual Energy Output, IO9 Btu 109 273 484 Energy Cost, $ / I O 6 Btu 1.7 1 .O 0.8
Alternative 11. Dehydration and CO, Input 1,670 2,276 5,000 removal o u t p u t 485 959 1,495
Capital Cost, lo6$ 1,740 2,772 3,792 Annual Operating Cost, 10% 359 537 702 Annual Energy Output, IO0 Btu 212 413 587 Energy Cost, $/IO6 Btu 1.7 1.3 I .3
Alternative 111. Input 1.670 3,335 5,000
Dehydration plus CO, o u t p u t 420 870 1,425 removal and N, removal
Capital Cost, 10% 2,612 4,038 5,450 Annual Operating Cost, 10% 555 807 1,05 1 Annual Energy Output, IO0 Btu 198 404 657 Energy Cost, $ / I O 6 Btu 2.0 2.0 1.6
Alternative IV. Input 1,670 3,335 5,000
Dehydration plus CO, o u t p u t 502 1,004 1,543 removal and propane blending
Capital Cost, 10% Annual Operating Cost, IO6$ Annual Energy Output IO9 Btu Energy Cost, $ / I O 6
1,802 2,847 3,877 463 730 992 244 456 709
I .9 1.6 1.4
Source: USEPA 1979a
47
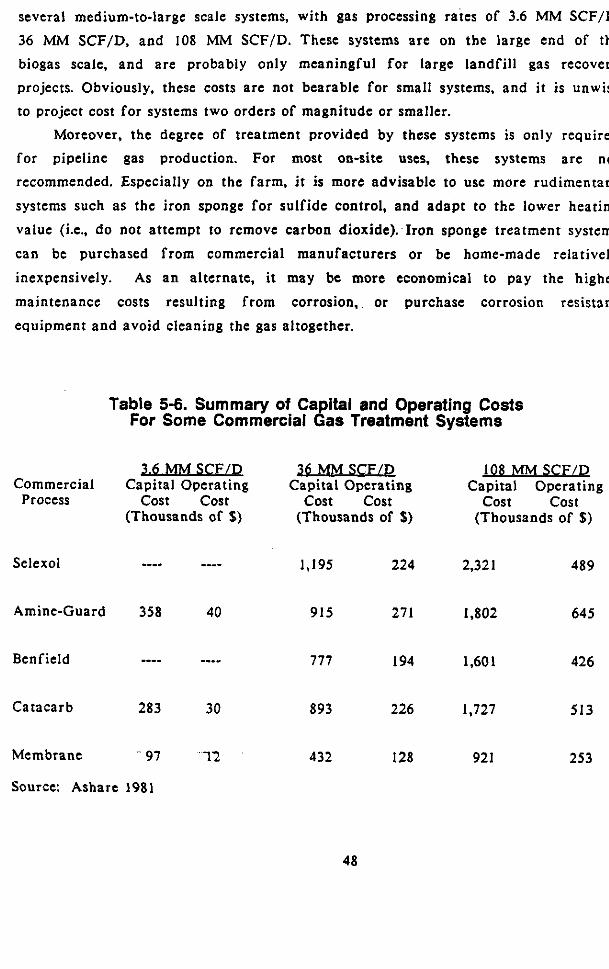
several medium-to-large scale systems, with gas processing rates of 3.6 MM SCF/D,
36 MM SCF/D, and 108 MM SCFfD. These systems are on the large end of the biogas scale, and are probably only meaningful for large landfill gas recovery projects. Obviously, these costs are not bearable for small systems, and it is unwise
to project cost for systems two orders of magnitude or smaller. Moreover, the degree of treatment provided by these systems is only required
for pipeline gas production. For most on-site uses, these systems are not recommended. Especially on the farm, i t is more advisable to use more rudimentary
systems such as the iron sponge for sulfide control, and adapt to the lower heating
value (i.e., do not attempt to rcmove carbon dioxide). Iron sponge treatment systems
can be purchased from commercial manufacturers or be home-made relatively
inexpensively. As a n alternate, it may be more economical to pay the higher
maintenance costs resulting from corrosion. or purchase corrosion resistant
equipment and avoid cleaning the gas altogether.
Table 5-6. Summary of Capital and Operating Costs For Some Commercial Gas Treatment Systems
Commercial Process
Selexol
Amine-Guard
Benfield
Catacarb
Membrane
- Capital Operating
cost cost (Thousands of $)
358 40
283 30
.. 97 '12
26 MM SCF/D Capital Operating
cost cost (Thousands of $)
1,195 224
915 271
777 194
893 226
432 128
108 MM SC F / D Capital Operating
cost Cost (Thousands of 16)
2.32 1 489
1,802 645
I ,60 I 426
1,727 513
921 253
Source: Ashare 1981
48
CHAPTER 6 COMPRESSION OF BIOGAS
Amlications For Co mDresslon Compressing biogas reduces storage requirements, concentrates energy content,
and increases pressure to the level needed to overcome resistance to gas flow.
Sometimes the production pressure of a biogas source does not match the pressure requirements of the gas utilization equipment. Compression can eliminate the
mismatch and guarantee the efficient operation of the equipment. Systems that use biogas for digester mixing employ compressors (or blowers) to
overcome the resistance to gas flow imposed by the digester contents. Moreover,
large biogas systems rely on compression to reduce the size of the gas storage
facility or to transport the biogas to a pipeline. Biogas systems that fuel cars or trucks use compressors to achieve the high energy density required by the
application. T h e choice of either a blower or compressor depends on the amount of pressure increase needed. Regardless of the pressure requirements, both devices
must meet stringent design specifications for handling biogas.
a e c i a I Reauirements for Handlina 6 loa= Compressing biogas requires a gas compressor suitable for flammable gases.
These d i f fe r f rom regular compressors in several respects:
o o o o passageways are provided to vent leaks away from the
the cylinder is located fur ther from the crankcase,
higher quality packing is used,
hardened connecting rods are used.
crankcase and prevent explosions, o inlet and exhaust ports are designed to let contaminants pass
through instead of collect in the compressor, and
o explosion proof motors and electrical connections are used on
all equipment. Compression requires a "clean" gas that has had the H,S removed. Biogas
typically contains '1000 ppm to 2% H,S by volume. H,S must be removed before compression since it forms an acid when combined with the water vapor present in
the gas. The resulting acid corrodes compressor parts and will lead to premature
equipment failure. Additionally, removing the CO, and water vapor also improves
49
the energy value of the compressed biogas and eliminates the cost of compressing
undesired and unusable gas components. Condensation can be a problem in the compressor’s gas outlet line or a t other
locations in the gas train experiencing excessive pressure drop. Coolers are used
(e.& shell and tube exchanger), especially between the stages of a multi-stage
machine to localize and control condensation. Water traps should be provided on the inlet and discharge gas lines of all compressors used in biogas systems.
Some researchers have reported problems with freezing i n piping downstream of the compressor, when pressure regulating devices expanded the compressed gas.
Typically, the gas is passed through a restriction that lowers the pressure (i. e.,
throttling the gas.) The temperature of a throttled gas may be either higher or
lower a f te r throttling than before throttling, depending on the values of the initial
pressure and temperature (PI and TI), respcctively, and the final pressure (P2). For certain values of these properties, the value of the final temperature (T,) may
decrease enough to cause freezing. Freezing can be predicted by determining the
slope of a constant enthalpy line on a T vs. P diagram for the biogas. The slope is known as the Joule-Thompson coefficient. and is mathematically described by the
equation:
where: = Joule-Thompson coefficient
( T/P)h = change in temperature (T) with respect to pressure (P) a t constant enthalpy (h).
If p is positive, the temperature will decrease during throttling. If it is negative, the temperature will rise. If freezing could occur, the system design
parameters may be altered to change the values of P,. TI, and P,. If design
changes are impossible, heat may be added (e. g., from engine cooling water) to the
throttling process.
50
Selectina a Blower or Comwessor The choice of blower or compressor will depend on the amount of pressure
increase required by a system. Blowers are employed to overcome piping pressure drop or for filling low pressure storage vessels. Compressors are typically used to
obtain either medium (around 200 psi) and high (2000 psi or more) pressures. Some
medium pressure compressors that handle small biogas flows are called boosters.
A typical biogas compressor and the accessories and controls needed for effective operation is depicted in Figure 6-1.
When deciding which equipment is best suited for a system, the following
points should be considered
o Any part of a component that contacts the biogas stream should be
stainless steel, if possible. Other materials such as aluminum, ductile iron, and high grade carbon steel can be used in some cases
since they provide good corrosion resistance and cost much less.
o Copper or brass components should not be used where they may
contact biogas.
o Accessories like flame arresters and check valves are not always
essential, although they may be required by local codes and
insurance companies. They make a system safer and their use is highly recommended.
Some companies (especially valve manufacturers) use special coatings
on equipment used in biogas systems. These coatings are less expensive than stainless steel, but i t must be assured that the
coating will provide sufficient protection against biogas corrosion.
o
In the short term view these requirements only appear to increase the cost of
a biogas system. However, using the wrong materials or skimping on condensate
traps and other accessories will shorten the useful l ife of the system, and will
compromise not only its long-term reliability, but also personnel safety.
Power Neede d for Comwession The energy required for compression represents a major operating cost of a
biogas system. Accordingly, estimating the energy requirement becomes an
important component of the system design effort . Estimates a re usually based an an
adiabatic compression process (compression without cooling) since such a calculation
estimates the maximum energy required for compression in a frictionless compressor.
5 1
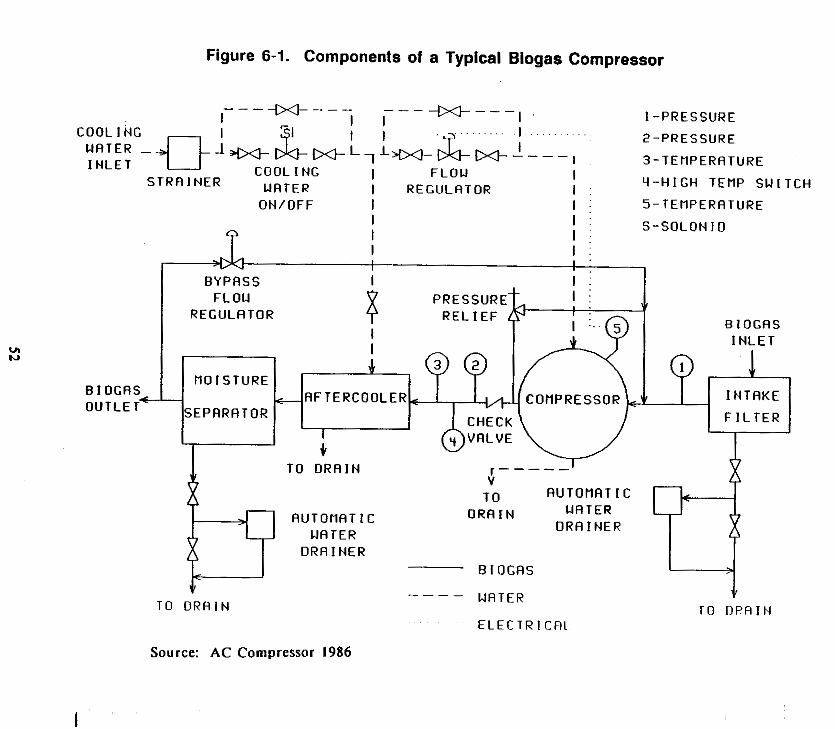
Figure 6-1. Components of a Typical Biogas Compressor
B I OGRS
---*--- ------- I I I I I -PRESSURE
I I I 2 -PRESSURE COOL I NC
I N L E T 3 -TEHPERRTURE WRTER - ~ ~ - & ~ L T L ~ 1 I q - H I C H TEHP S W I T C H I
I F L O U C O O L I NG S T R R I N E R WRTER I REGULRTOR
FLOW REGULRTOR
- D O 1 STURE
O N / O F F I I
9 I
OUTLET-
. . I j 5 -TEf lPERRTURE
I : S - S O L O N I D I :
c RFTERCOOLER SEPRRRTOR
~
I :
BYPASS I I :
I I I ' ~
-r----- G @;.;;E i-/ TO D R R I N r - - - - - V
AUTOflRT I C WRTER
T O R U T O f l R T I C O R R I N WRTER
D R A I N E R
DRR I NER B I OGRS
- T O D R A I N WATER
E L E C T R I C F ~ L
- - _ .G T O D P A l N
Source: AC Compressor 1986
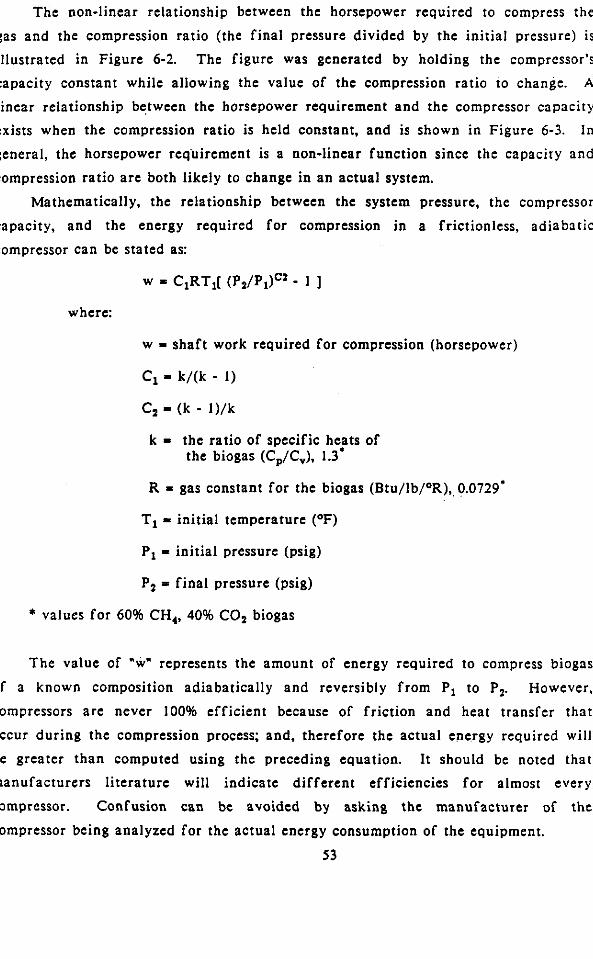
The non-linear relationship between the horsepower required to compress the
gas and the compression ratio (the final pressure divided by the initial pressure) is illustrated in Figure 6-2. The figure was generated by holding the compressor's capacity constant while allowing the value of the compression ratio to change. A
linear relationship between the horsepower requirement and the compressor capacity exists when the compression ratio is held constant, and is shown in Figure 6-3. I n
general, the horsepower requirement is a non-linear function since the capacity and
compression ratio are both likely to change in an actual system.
Mathematically, the relationship between the system pressure, the compressor
capacity, and the energy required for compression in a frictionless, adiabatic
compressor can be stated as:
w = C,RT,[ (P2/P,)cz - 1 ]
where:
w = shaft work required for compression (horsepower)
C, k/(k - 1)
C, (k - I)/k
k = the ratio of specific heats of the biogas (Cp/Cv), 1.3'
R = gas constant for the biogas (Btu/lb/OR), 0.0729'
T, = initial temperature (OF)
P, = initial pressure (psig)
P, = final pressure (psig)
* values for 60% CH,, 40% C02 biogas
The value of "w" represents the amount of energy required to compress biogas
of a known composition adiabatically and reversibly from P, to P,. However,
compressors are never 100% efficient because of friction and heat transfer that occur during the compression process; and, therefore the actual energy required will
be greater than computed using the preceding equation. It should be noted that manufacturers literature will indicate different efficiencies for almost every
compressor. Confusion can be avoided by asking the manufacturer of the
compressor being analyzed for the actual energy consumption of the equipment.
53
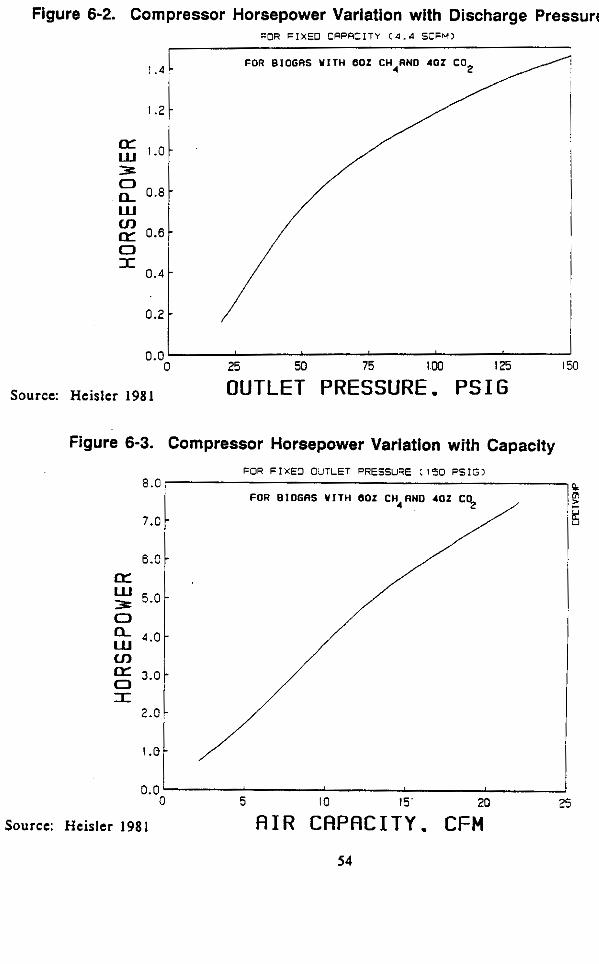
Figure 6-2. Compressor Horsepower Variation with Discharge Pressure FOR FIXED CPPACITY C4.4 SCFM)
1.4 -
1 . 2 -
oz 5 0
Lu 1.0 -
0.8 -
0.0 0 25 50 75 1OO I25 150
Source: Heisler 1981 OUTLET PRESSURE. PSIG
Figure 6-3. Compressor Horsepower Variation with Capacity
FOR FIXED OUTLET PRESSURE (150 PSIG) 8.0 1
0.0' I O I5 20 25 0 5
Source: Heislcr 1981 A I R CAPACITY. CFM 54
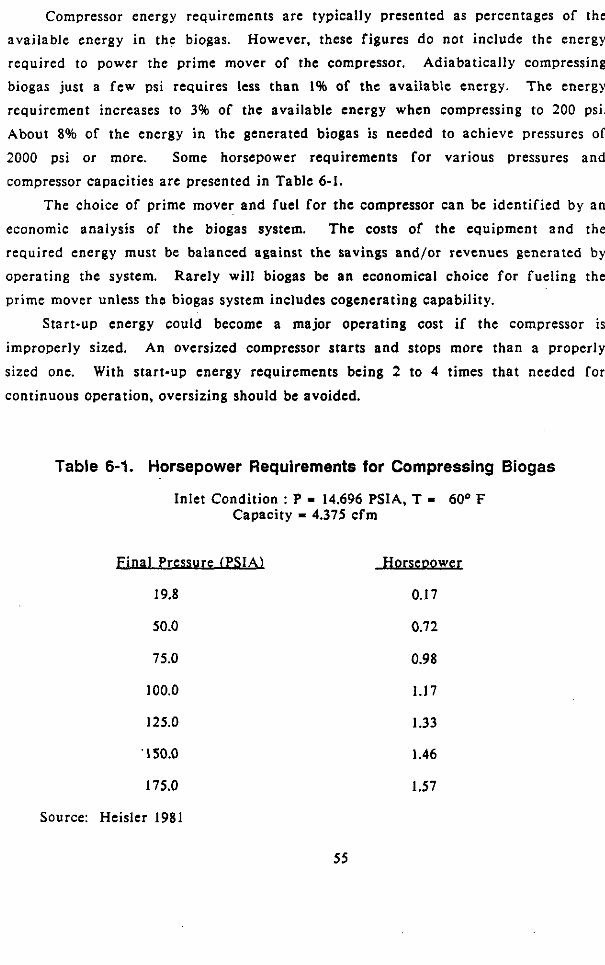
Compressor energy requirements are typically presented as percentages of the available energy in the biogas. However, these figures do not include the energy required to power the prime mover of the compressor. Adiabatically compressing biogas just a few psi requires less than 1% of the available energy. The energy requirement increases to 3% of the available energy when compressing to 200 psi. About 8% of the energy in the generated biogas is needed to achieve pressures of
2000 psi or more. Some horsepower requirements for various pressures and
compressor capacities are presented in Table 6-1.
The choice of prime mover and fuel for the compressor can be identified by an
economic analysis of the biogas system. The costs of the equipment and the required energy must be balanced against the savings and/or revenues generated by operating the system. Rarely will biogas be an economical choice for fueling the
prime mover unless the biogas system includes cogencrating capability.
Start-up energy could become a major operating cost if the compressor is
improperly sized. An oversized compressor starts and stops more than a properly
sized one. With start-up energy requirements being 2 to 4 times that needed for
continuous operation, oversizing should be avoided.
Table 6-1. Horsepower Requirements for Compressing Biogas
Inlet Condition : P - 14.696 PSIA, T - 60° F Capacity - 4.375 cfm
Final Pressure (PS IAl
19.8
50.0
75.0
100.0
125.0
' 150.0
175.0
Source: Heisler 1981
JorseDoweL
0.17
0.72
0.98
1.17
1.33
1.46
1.57
55
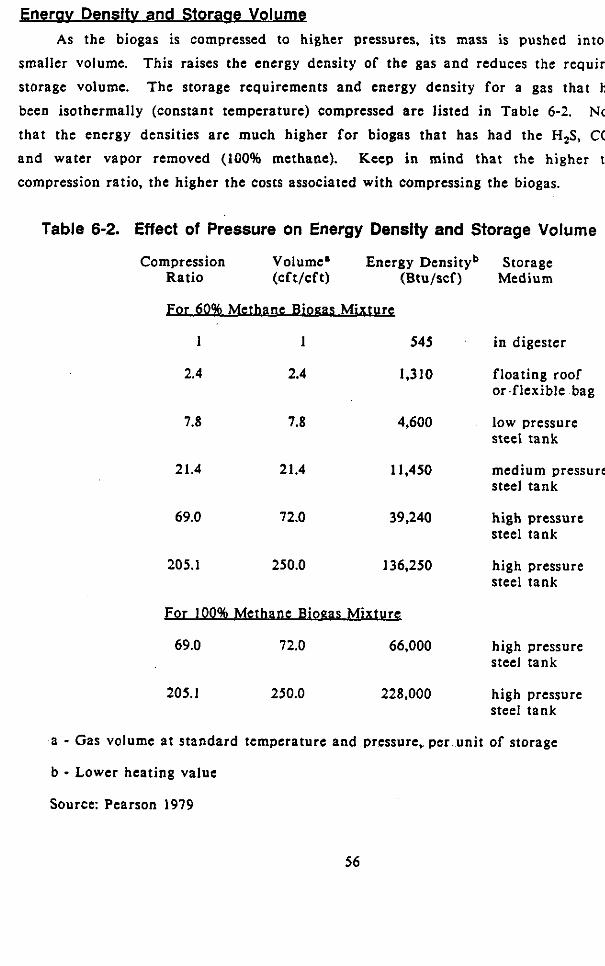
Enerav Densitv and Storaae Volumg As the biogas is compressed to higher pressures, its mass is pushed into a
smaller volume. This raises the energy density of the gas and reduces the required
storage volume. The storage requirements and energy density for a gas that has
been isothermally (constant temperature) compressed are listed i n Table 6-2. Note that the energy densities are much higher for biogas that has had the H,S, CO,, and water vapor removed (100% methane). Keep in mind that the higher the
compression ratio, the higher the costs associated with compressing the biogas.
Table 6-2. Effect of Pressure on Energy Density and Storage Volume
Compression Volume' Energy Densityb Storage Ratio (cft/cf t) (Btu/scf) Medium
For 60% Methane Bioaas Mixturc
545 . in digester 1 1
2.4 2.4
7.8 7.8
21.4 21.4
1,310 floating roof or.flexible bag
4,600 low pressure steel tank
1,450 medium pressure steel tank
69.0 72.0 39,240 high pressure steel tank
205.1 250.0 136,250 high pressure steel tank
For 100% Me thane Bioaas M' Ixturc
69.0 72.0 66,000 high pressure steel tank
205.1 250.0 228,000 high pressure steel tank
a - Gas volume a t standard temperature and pressure. per unit of storage
b - Lower heating value
Source: Pearson 1979
56
CHAPTER 7 STORAGE OF BIOGAS
Purpose of Storaae Biogas is not always produced a t the time or in the quantity needed to satisfy
the load that it serves. When this occurs, storage systems are employed to smooth out variations in gas production, gas quality. and gas consumption. The -storage component also acts as a buffer, allowing downstream equipment to operate a t a
constant pressure.
TvDes of Storaoe Several methods for storing biogas have been successfully demonstrated or
Seven possible suggested by researchers working in the area of biogas utilization.
options (Stahl 1983) are illustrated in Figure 7-1.
A biogas system with 3 possible gas utilization options; including direct use,
compression by a blower and storage a t low pressure, and compression and storage
a t medium pressure are illustrated in Figure 7-2. The technical requirements,
capital cost, and operating cost of each option (Heisler 1981) are also shown in the
figure. Direct Use . In some cases the match between gas production and gas usage is
close enough to allow direct use of the gas. Any gas that is not used as i t is produced is vented to the atmosphere. Some direct use systems usually rely on a pressure regulating device in the gas line to ensure that sufficient gas pressure is
available a t the burner or gas converter. Other direct use devices such a s the Tracker-Trol @ b y Perennial Energy, Inc. (Walsh u, 1986) adjust the engine or burner throttling according to pressure or biogas availability. Direct use systems
are lower in capital cost and less complex than systems employing storage.
However, i t is rare that the match between production and usage is good enough to
prevent biogas waste or make the direct use system very efficient.
Low Pressure S t o r a E . Low pressure storage options have been successfully demonstrated by several research organizations and universities. They typically
operate below 10 inches water gauge, but some options are capable of much higher pressures. Generally, low pressure storage vessels cost more but the systems feature the lowest operating cost of any storage option.
57
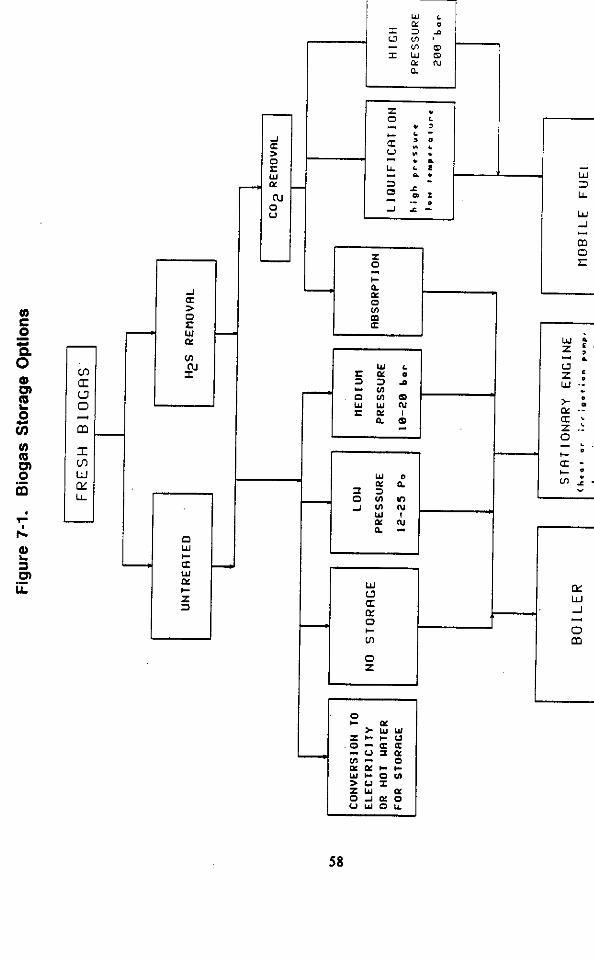
i W ' 1
I I
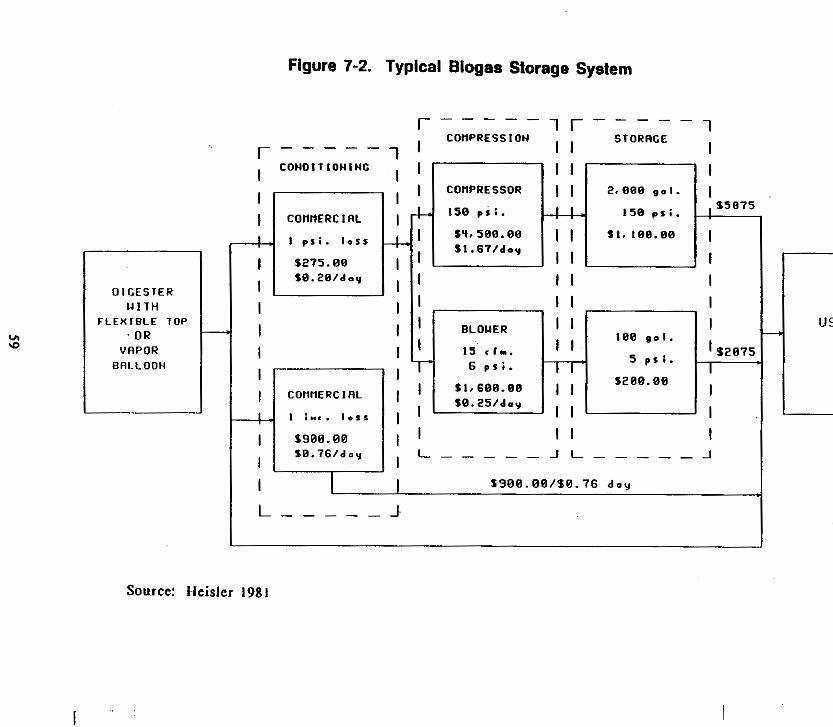
Figure 7-2. Typical Biogas Storage System
I I 1 1 C O N O I l l O H l N C I I I
I COnPRESSOR I I 2,899 901.
158 p s i . 158 p s i . I COflHERClAL I I 5'1.580.88 I I s 1 . 1 ~ 8 . e a
I I p s i . l o s s &
I I I 1 51.67/d-y
5275.88
D I G E S T E R U I T H
F L E X I B L E TOP ' OR
VRPOR BALLOON
I I
S 5 8 7 5
I I
I I I I I
4 I I I L
I I ELOUER I 1 I IS < r r . I 1
lee # - I .
5 p s i .
IZBE.BB 6 p s i .
I si.~~e.ea I I I 59.25/day
I
I 92875 I I
-
1 i".. 1 - 1 5
S988. BE Sa. 7 6 / d o y
I 53B8.08/$8.76 d o g .
USRGE 1 Source: Heisler 1981
Biogas can be stored between the liquid level of the digester and the digester
cap. The roof can float (is. rise as more gas is stored) or can be made of a flexible material. Restraining the top will increase the pressure under which gas can be stored. Most systems employing these types of Storage vessels hold biogas
a t pressures under 10 inches of water gauge. The major advantage of a digester with an integral storage component has to be the reduced capital cost of the system. However, such a design features several areas that require special attention. The roof of the digester must be insulated. Uninsulated covers are
susceptible to large temperature fluctuations which will cause operating problems in
the digester. Floating and flexible covers present a second problem. They must be protected against wind loading, perhaps by a building or shelter.
Biogas may be stored in flexible bags. The bags are manufactured from
impermeable materials such as rubber, plastic, or fiber-reinforced plastic. These bags are tough but can suffer damage by puncture. They are also subject to heat
gains and losses if they are not insulated. Bags have also been used between the
liquid level and cap of a digester but most are used as liners in steel or concrete
tanks. Some larger systems use a bag or flexible roof to hold biogas a t low pressure and then draw the gas off for cleaning, compression, and subsequent
storage a t a higher pressure. Some systems use water sealed gas holders for low pressure storage. Such a
Care must be taken to unit operates between 6 inches and 10 inches water gauge. Prevent the water in these devices from freezing.
Medium Pressurg. If a system requires a gas pressure greater than several psi
but less than 200 psi, clean biogas (H,S removed) may be compressed and stored in tanks such as propane gas tanks. These tanks are typically rated to 250 psia.
Compressing biogas to this pressure range costs about 5 kwh per 1000 f tS or
approximately 3% of the energy content of the stored biogas. At these higher pressures, insurance investigations may be required. Local pressure vessel codes
may also apply. Pressure safety devices a rc a must (and are required by law).
Tanks, compressors, blowers, and all metal hardware must be protected from corrosive "raw" biogas. H,S must be removed from the gas to insure safe operation
of these componcnts. -Unscrubbed biogas can lead to early failure of compressors
and other metal components. Once corrosion starts, the safety of the entire biogas system is compromised.
60
Medium pressure storage tanks are less expensive than their low pressure
counterparts but the requirements for compression and gas cleanup make medium
pressure storage more expensive. In exchange for the higher cost, the same volume
of gas can be stored in a smaller vessel and the stored biogas possesses a higher
energy density than that in a low pressure system.
Hiah Pressur e Bioaas S toraQg High pressure storage of gas is used in cases where very high energy densities
are required or the size of a system's storage facility must be limited. High
pressure storage systems are intended to maintain pressure between 2000 - 5000 psi. Compression to 2000 psig requires nearly 14 kWh per 1000 f t3 of biogas, or about
8% of the available energy. The gas is stored in steel cylinders similar to those used
to store commercial compressed gases such as nitrogen. Large high pressure storage
facilities have made use of longer, interconnected, convex-ended cylindrical steel
tanks.
Since corrosion becomes more of a problem as pressure increases, the
requirements fo r drying and scrubbing the gas are more stringent than fo r medium
pressure systems. Safety also becomes more important. Tanks must be properly constructed a n d fi t ted with suitable safety devices (bursting disk devices are
suitable in this case). System controls must prevent overpressurization of the storage facility. Although the initial cost of storage vessels is low, overall system
costs are high and limit high pressure storage to large facilities or special
applications like vehicle fuel or the sate of pure methane.
Absomtion Storaae Absorption of methane in liquid propane has been suggested as a way to store
clean, dry biogas. The methane dissolves in the propane resulting in a 4- to 6-fold
increase in the amount of gas stored a t a given pressure. Only 4% of the storage
medium (propane) escapes when the methane is removed. However, the technology remains unproven, and some researchers think the technique may require
refrigeration. The requirements of H,S, CO,, and water vapor removal coupled with
the need Tor refrigeration make this a n extremely expensive storage alternative suitable only in special cases.
61
Liauefaction I t is a common error to assume methane can be liquefied a t ambient
temperatures like propane and butane. Liquefaction of biogas requires a
temperature of -59OF a t atmospheric pressure. Since CO, solidifies a t -1l0F, no
CO, can be present. Trace impurities in the gas can cause problems at these low
temperatures as well. Although the liquefying temperature can be raised by
increasing the pressure (-14OF a t 682 psia), the technology is limited to large
systems because of the extremely high costs.
Considerat ions Five factors must be studied to determine the type of storage facility required
by a biogas system. These are:
o safety,
o volume,
o pressure,
o location, o and fluctuations in gas production.
w. Unscrubbed biogas contains H,S and is extremely corrosive. Moreover, its corrosiveness increases with increasing system pressure. Unless
cleaned, the biogas will quickly corrode metals, drastically reducing their usef ul l ife
and creating a safety hazard. The H,S in biogas is also toxic to humans.
Therefore, all storage vessels should be adequately vented when personnel must
enter them. If not, death can result. This also goes for buildings which house
digesters and their storage facilities. In these facilities, adequate ventilation must
be provided to prevent a buildup of biogas in the space from small leaks. Biogas
can be heavier or lighter than air depending on its CH, to CO, ratio. The danger
of f i re is reduced for outdoor installations.
Volumg Proper sizing of a storage vessel depends on the volume of gas produced and the volume of gas required by the end user. The designer compares
the daily production pattern to the need for biogas throughout the day. The storage
vessel is sized so that the usage requirements are economically satisfied. Storing more than one day's production has proven uneconomical for small scale systems
(Heisler 1981) and any unused gas is usually vented or flared to the atmosphere.
62
Pressure. The minimum pressure will be dictated by the gas utilization equipment. Piping losses must be included when determining the minimum system
pressure. The system pressure must be sufficient to insure the safe, efficient operation of all equipment. Increasing storage pressure can reduce the required storage volume as shown in Table 6-2. Pressurization equipment allows the use of
less expensive filters (with higher pressure drop specifications). This helps offset
the increased operating costs when blowers or compressors are used.
Location. Safety and system losses are influenced by the location of the
storage facility. Long piping runs with bends and valves may require blowers to
maintain system pressure a t the required level. Proximity to buildings and the general public must be considered from a safety standpoint and in light of local
building codes.
Production Fluct- ’ . Daily fluctuations in gas production can lead to pressures below the minimum pressure required by the gas utilization equipment and
peaks in gas pressure above the maximum specification as well. Adding pressurization equipment would prove more economical than designing the digester
to handle these wide fluctuations in pressure.
Materials A wide variety of materials have been used in making biogas storage vessels.
Medium and high pressure storage vessels are usually constructed of mild steel while low pressure storage vessels can be made of galvanized iron, concrete, and plastics.
Each material possesses advantages and disadvantages that the system designer must consider. Plastics reinforced with scrim appear to be the most popular material for
flexible digester covers in the United States. The materials are similar to those
used as liners for treatment ponds and containment of hazardous wastes. In several cases, exposed scrim fibers have wicked in solutions that have weakened the fabric
joints of these materials. The newest reinforced plastics feature polyester fabric
which appears to be more suitable for flexible digester covers. A summary of the devices, materials, and equipment sizes for storage of biogas a t low, medium and
high pressure is provided in Table 7-1. The most popular materials of construction for storage vessels and details some of the pros and cons of each one are listed in Table 7-2.
. .
63
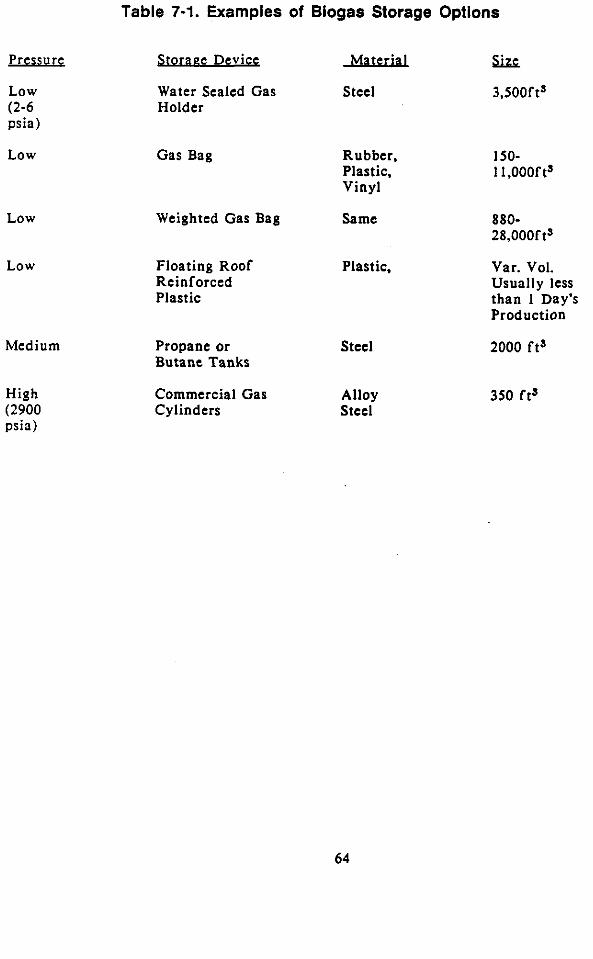
Pressure
Low (2-6 psia)
Low
Low
Low
Medium
High . . (2900
psia)
Table 7-1. Examples of Biogas Storage Options
Storage Devicc Ma t e r i d six Water Scaled Gas Steel 3,500fts Holder
Gas Bag Rubber, Plastic, Vinyl
Weighted Gas Bag Same
Floating Roof Plastic, Reinforced Plastic
Propane or Butane Tanks
Commercial Gas Cylinders
Steel
Alloy Steel
150- 11,000f tS
880- 28,000fts
Var. Vol. Usually less than 1 Day's Production
2000 f t3
350 f t s
64
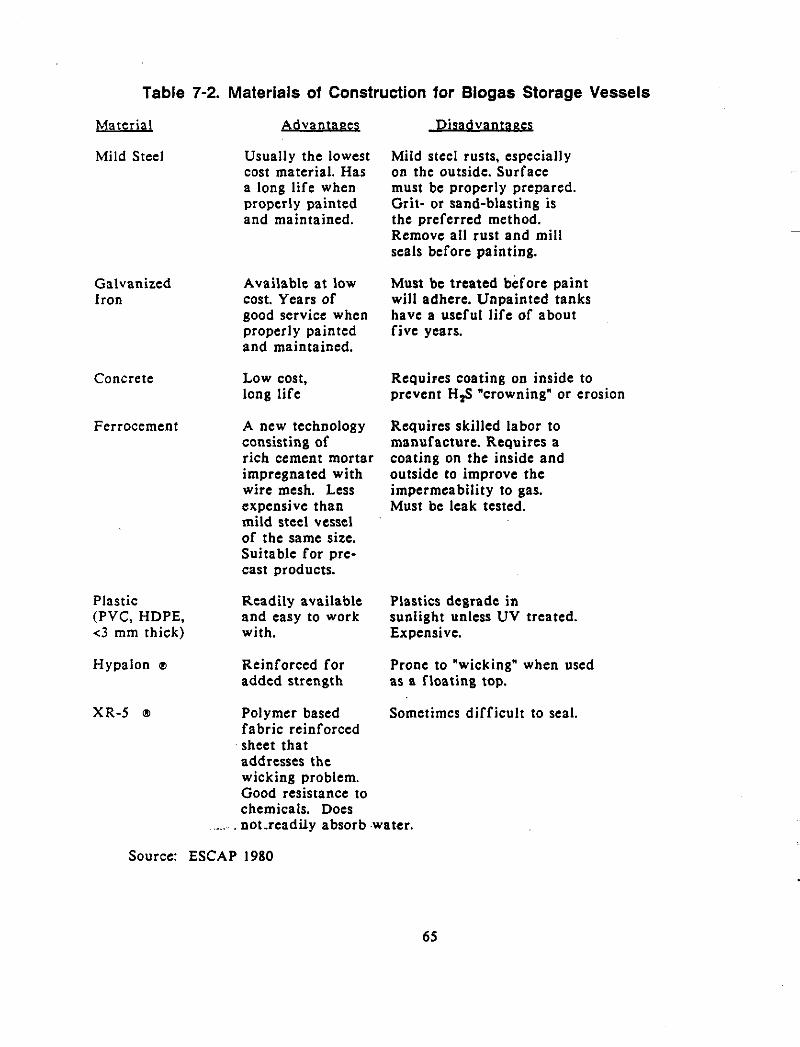
Table 7-2. Materials of Construction for Biogas Storage Vessels
Material Advantaeez
Mild Steel Usually the lowest cost material. Has a long life when properly painted and maintained.
Galvanized Iron
Concrete
Ferrocement
Plastic (PVC, HDPE, <3 mm thick)
Hypalon Q,
XR-5 Q,
Available a t low cost. Years of good service when properly painted and maintained.
Low cost, long life
A new technology consisting of rich cement mortar impregnated with wire mesh. Less expensive than mild steel vessel of the same size. Suitable for pre- cast products.
Readily available and easy to work with.
Reinforced for added strength
Polymer based fabric reinforced sheet that addresses the wicking problem. Good resistance to chemicals. Does
DisadvrUUilgy
Mild steel rusts, especially on the outside. Surface must be properly prepared. Grit- or sand-blasting is the preferred method. Remove all rust and mill seals before painting.
Must be treated before paint will adhere. Unpainted tanks have a useful life of about five years.
Requires coating on inside to prevent H,S "crowning" or erosion
Requires skilled labor to manufacture. Requires a coating on the inside and outside to improve the impermeability to gas. Must be leak tested.
Plastics degrade in sunlight unless UV treated. Expensive.
Prone to "wicking" when used as a floating top.
Sometimes difficult to seal.
_ _ _ . not .readily absorb -water.
Source: ESCAP 1980
65

CHAPTER 8 BIOGAS UTILIZATION TECHNOLOGIES
Introduction There are several viable options for the utilization of biogas as shown in
Figure 8-1. Foremost among these are: 0 direct combustion, 0 fueling engines, and
0 sales to natural gas pipelines.
Direct Combustion Direct combustion is inarguably the simplest method of biogas utilization.
Conversion of combustion systems to biogas combustion is basically a matter of fuel orifice enlargement and intake air restriction, with attendant modification of the
fuel delivery and control system. However, when implementing these modifications with either new or retrofitted
systems, a number of variables should be considered; including the heat input rate,
the fluid handling capabilities, flame stability, and furnace atmosphere.
Heat i n m t rat€. Because biogas sometimes has energy values lower than 400
Btu/SCF, some combustion systems will be restricted by a limit in volumetric fuel throughput, including the supply to the combustor. The result is a decrease in
equipment output (derating) which must be evaluated for each combustion unit.
. . Fluid handline caoabll itv. Besides the combustor, the rest of the fuel system (flues, piping, valves, and controls) must be evaluated to determine if increased fuel
and exhaust flows, and decreased flow of combustion air, can be handled.
. . Flame stab11 ity. Since flame or burner stability is primarily a function of flame velocity and flammability limits, i t must be evaluated both theoretically and
empirically for individual sources of biogas. Biogas may produce a slower flame
speed (relative to natural gas) and a higher volume of biogas must be fed to a burner to maintain an equal heat input, or the flame may "blow off" the burner tray.
67
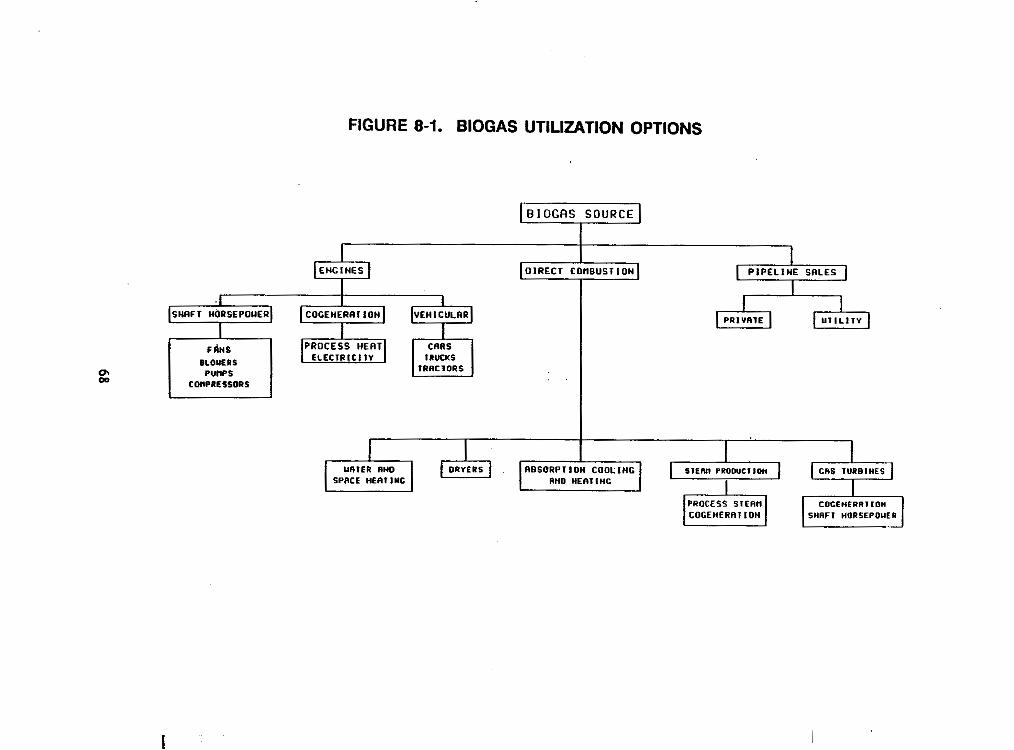
a m
SHAFT HORSEPOUER
ILOUERS PunPs
conpncssons
FIGURE 8-1. BIOGAS UTILIZATION OPTIONS
ENCINES Q PROCESS H E R 1
E L E C T P I C I l Y
I
Furnace a tmoso her€. Because of the corrosive nature of biogas containing
hydrogen sulfide and moisture, the burner and its combustion zone should be adequately protected. Corrosion of iron, copper, and steel components in the combustion, heat transfer, and exhaust zones of a combustion system should be carefully evaluated. To help protect from moisture and H,S corrosion, system temperatures should be maintained above the dew point temperature (approximately
26OOF) to prevent condensation. In biogas fuels with high H,S levels, sulfur
compounds have been reported to accumulate a t and around the burner.
T o help maintain operation above the dew point, boiler water temperatures
should be maintained in excess of 22OOF a t all times. In the case of a "cold start",
a boiler should be f i red with natural gas, propane, or fuel oil until the system is u p
to operating temperature (Parish 1986). Also, preventing the stack temperatures
from falling below dewpoint may be accomplished by bypassing the second pass of a boiler unit. Although this helps prevent sulfurous and sulfur ic acid formation and
subsequent corrosion, boiler efficiency may be adversely affected. Similar concern should be given to the use of stack gas economizers, which should not use
reedwater with temperatures less than 250°F or reduce stack gas temperatures below
dew point.
Burner Conversion Burner conversion to f i re biogas rather than natural gas or propane involves
insuring that an exit velocity and corresponding pressure drop of the biogas is
maintained for proper fuel and air mixing (Parish 1986). The pressure drop across a burner orifice will increase with decrease in heating value and specific gravity of biogas relative to natural gas and propane.
This increase in the pressure drop can be determined by the equation:
P Gas B (Heating Value Gas A)z Spg Gas B = m e a t ine Value Gas B) f X axsasA
For example, if natural gas (1050 Btu/SCF, 0.65 spg) is replaced by a typical
biogas (550 Btu/SCF, 0.80 spg) the increase in pressure drop across the orifice would be:
" = I 1 0 5 0 B t u / S C F ) ' x La P Nat Gas (550 Btu/SCF)* 0.65
= 4.490 times the pressure drop across the natural gas burner orifice.
69
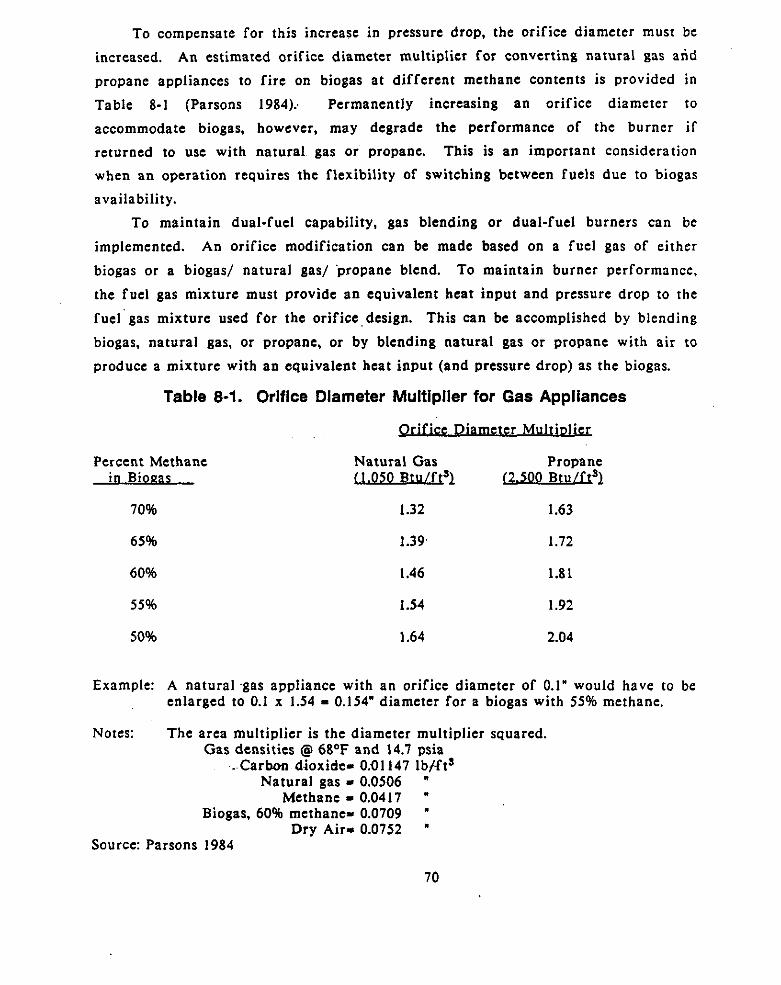
Percent Methane i n Biogas
70%
65%
60%
55%
50%
To compensate for this increase in pressure drop, the orifice diameter must be increased. An estimated orifice diameter multiplier for converting natural gas and
propane appliances to f i re on biogas a t different methane contents is provided i n Table 8-1 (Parsons 1984): Permanently increasing an orifice diameter to accommodate biogas, however, may degrade the performance of the burner if returned to use with natural gas or propane. This is an important consideration when a n operation requires the flexibility of switching between fuels due to biogas
availability.
To maintain dual-fuel capability, gas blending or dual-fuel burners can be implemented. An orifice modification can be made based on a fuel gas of either
biogas or a biogasf natural gas/ propane blend. To maintain burner performance,
the fuel gas mixture must provide an equivalent heat input and pressure drop to the fuel gas mixture used for the orifice design. This can be accomplished by blending
biogas, natural gas, or propane, or by blending natural gas or propane with a i r to produce a mixture with an equivalent heat input (and pressure drop) as the biogas.
Table 8-1. Orifice Diameter Multiplier for Gas Appliances . .
Natural Gas Propane (1.050Btu/f1 1 2 . 5 0 0 8 1
1.63
1.72
1.81
1.92
2.04
1.32
1.39
1.46
1.54
1.64
Example: A natural gas ap t ancc with an orifice diameter o 0.1" would have to be enlarged to 0.1 x 1.54 = 0.154" diameter for a biogas with 55% methane.
The area multiplier is the diameter multiplier squared. Notes: Gas densities @ 68OF and 14.7 psia
. Carbon dioxides 0.01 147 Ib+ftS Natural gas - 0.0506 "
Methane 0.0417 " Biogas, 60% methanes 0.0709 "
Dry Air- 0.0752 " Source: Parsons 1984
70
An indicator of this fuel mixture compatibility with the burner orifice design is
the Wobbe Index. This index is defined as:
Where:
H = heating value of gas G = specific gravity of gas o 5 original gas m - substitute mix including pure substitute and air
Source: North American Manufacturing 1978
The concept is to create mixtures with similar Wobbe Index Numbers to allow proper combustion system operation.
The other option for achieving fuel flexibility is the use of dual-gas burners that can maintain the orifice pressure drop for each fuel gas independently. A dual
canister burner can provide a separate set of orifice jets for each gas (Parish 1986)
to allow for independent fuel flow. On smaller systems such as water heaters,
burner trays can be easily removed and interchanged so that a biogas tray can be
replaced by a propane gas tray in the event of a biogas shortage (Walsh etal. 1986).
Since many systems operate intermittently, consideration must be given to the
type of pilot used to ignite the fuel mixture. Biogas pilots have been used with success; however, some installations have experienced problems with pilot extinguishing, which led to the installation of a separate propane pilot (Walsh u. 1986). Some water heater and boiler systems are specifically designed to operate on biogas fuels. Several of these are listed in the Appendix A.
AbsorDtion Chillere A biogas conversion method with limited application to date involves absorption
heating and cooling. Utilizing biogas i n a gas burner, a double-effect absorption
chiller-heater can be used to provide chilled water for refrigeration and space cooling and hot water for industrial processes and space heating.
This system is similar to vapor-compression refrigeration, except that the high
Pressure side of the system has a series of heat-transfer vessels and a pump rather than a compressor. Most absorption systems utilize ammonia as the refrigerant and
an ammonia solution as the solvent/absorbent (Salisbury 1950). However, for air-
-
7 1
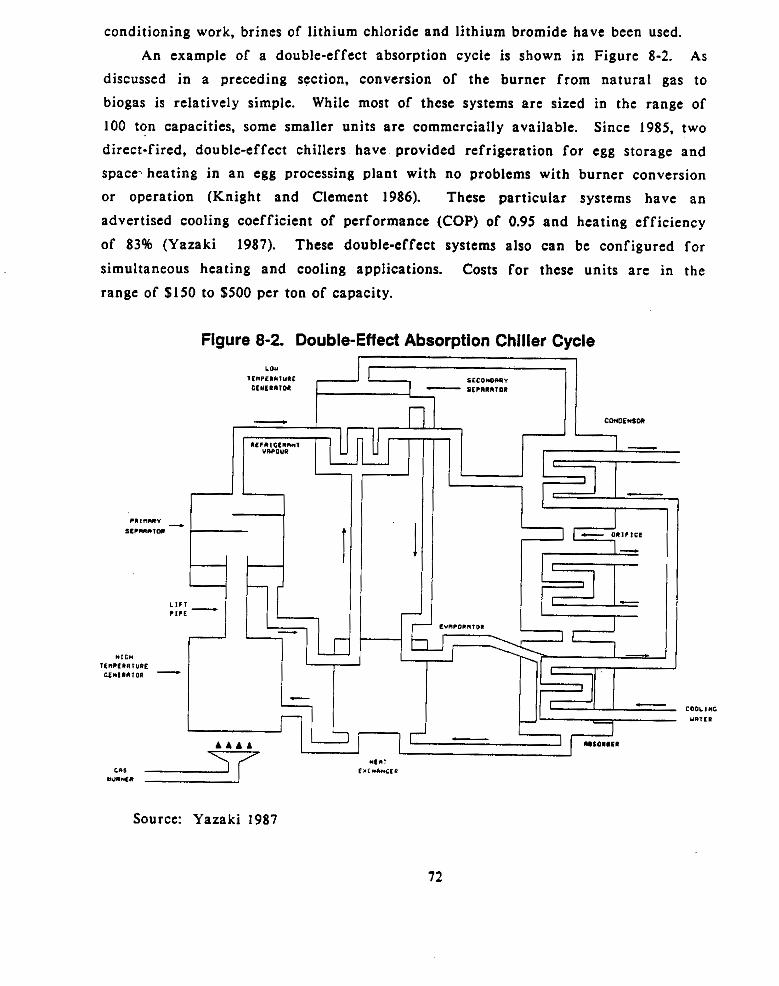
conditioning work, brines of lithium chloride and lithium bromide have been used.
An example of a double-effect absorption cycle is shown in Figure 8-2. As discussed in a preceding section, conversion of the burner f rom natural gas to
biogas is relatively simple. While most of these systems are sized in the range of
100 ton capacities. some smaller units are commcrcially available. Since 1985, two direct-fired, double-effect chillers have provided refrigeration for egg storage and space-heating in an egg processing plant with no problems with burner conversion or operation (Knight and Clement 1986). These particular systems have a n
advertised cooling coefficient of performance (COP) of 0.95 and heating efficiency
of 83% (Yazaki These double-effect systems also can be configured for
simultaneous heating and cooling applications. Costs for these units a r e in the range of $150 to $500 per ton of capacity.
1987).
Figure 8-2. Double-Effect Absorption Chiller Cycle LO"
Il".l.I)IY.C c t I (E l l l rDI
I SICO"DI)."
Source: Yazaki 1987
72
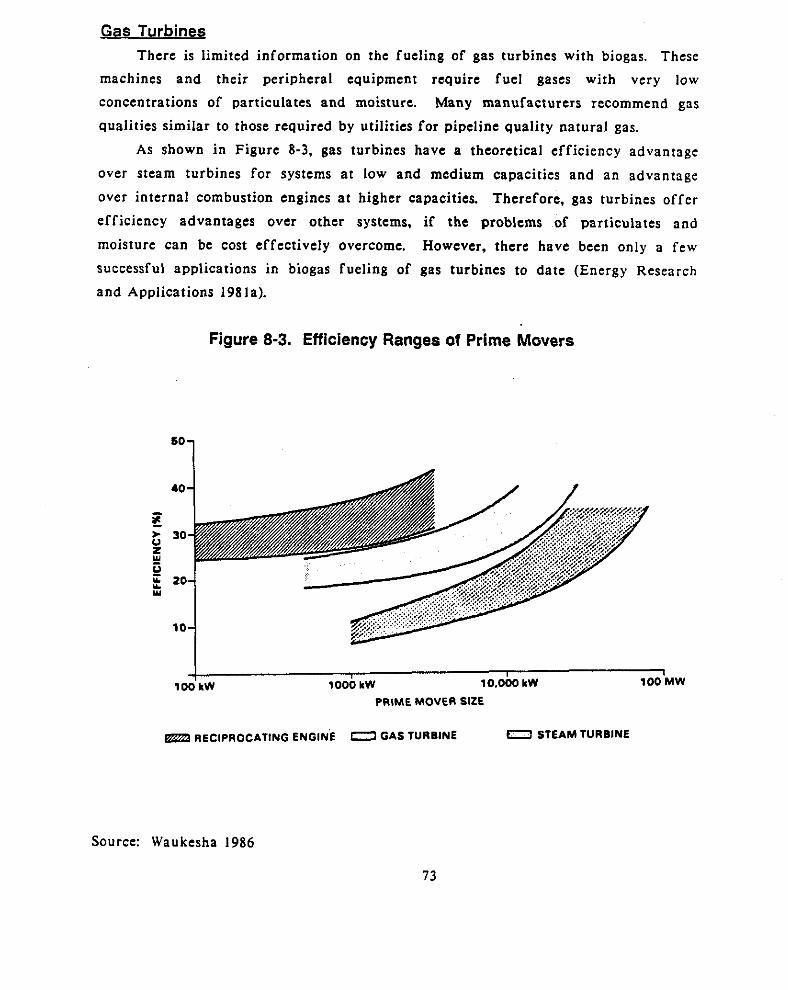
Gas Turbines There is limited information on the fueling of gas turbines with biogas. These
machines and their peripheral equipment require fuel gases with very low
concentrations of particulates and moisture. Many manufacturers recommend gas
qualities similar to those required by utilities for pipeline quality natural gas.
As shown in Figure 8-3, gas turbines have a theoretical efficiency advantage over steam turbines for systems at low and medium capacities and an advantage
over internal combustion engines a t higher capacities. Therefore, gas turbines offer efficiency advantages over other systems, if the problems of particulates and
moisture can be cost effectively overcome. However, there have been only a few successful applications in biogas fueling of gas turbines to date (Energy Research
and Applications 1981a).
Figure 8-3. Efficiency Ranges of Prime Movers
"1 40
E 30
E E 20 0
Y
10
I t I000 kW 10.000 kW 100 M W 100 kW
PRIME MOVER SIZE
RECIPROCATING ENGINE 0 GAS TURBINE R STEAM TURBINE
Source: Waukesha 1986
73
Enaine Svste ms Internal combustion engines have been fueled by biogas from municipal digester
systems for more than 40 years with varying degrees of success. In recent years, this application has been extended to agricultural and industrial systems for a variety of power requirements. Stationary spark ignition engines can supply power
for many loads including:
o cogeneration. o pumps, o fans and blowers, o elevators and conveyors, and o heat pumps and air conditioners.
There is also the potential for biogas fueling o f cars, trucks and industrial 'equipment including tractors.
Evaluation of which system would provide optimum economic use of a biogas
source hinges on a number of considerations including:
D a ree of utilization . What combination of engine systems will provide the most efficient use of biogas on a daily basis throughout the year? Will a gas
compression system or other special gas handling system be required?
Cost of installation. Cogeneration systems are fa i r ly expensive when compared to reducing a high electrical load by replacing electric motor shaf t with horsepower
from a biogas fueled engine. Cogeneration systems also typically require costly interconnect and control systems. Before making electricity, look a t shaf t horsepower applications first.
Cost of ooeration and maintenancc. One large engine plant will inevitably have lower operating costs than a few smaller plants. The larger loads should be
satisfied first before looking to relieve smaller loads. The costs of providing
backup power to a conversion in the case of an engine failure or fuel unavailability
should be carefully evaluated.
erence with current ooe rat ipDs . Any engine application to replace a n electric motor in an industrial process will mandate that consideration be
given to load management and control. Engines also have higher maintenance
requirements, in both materials and labor.
14
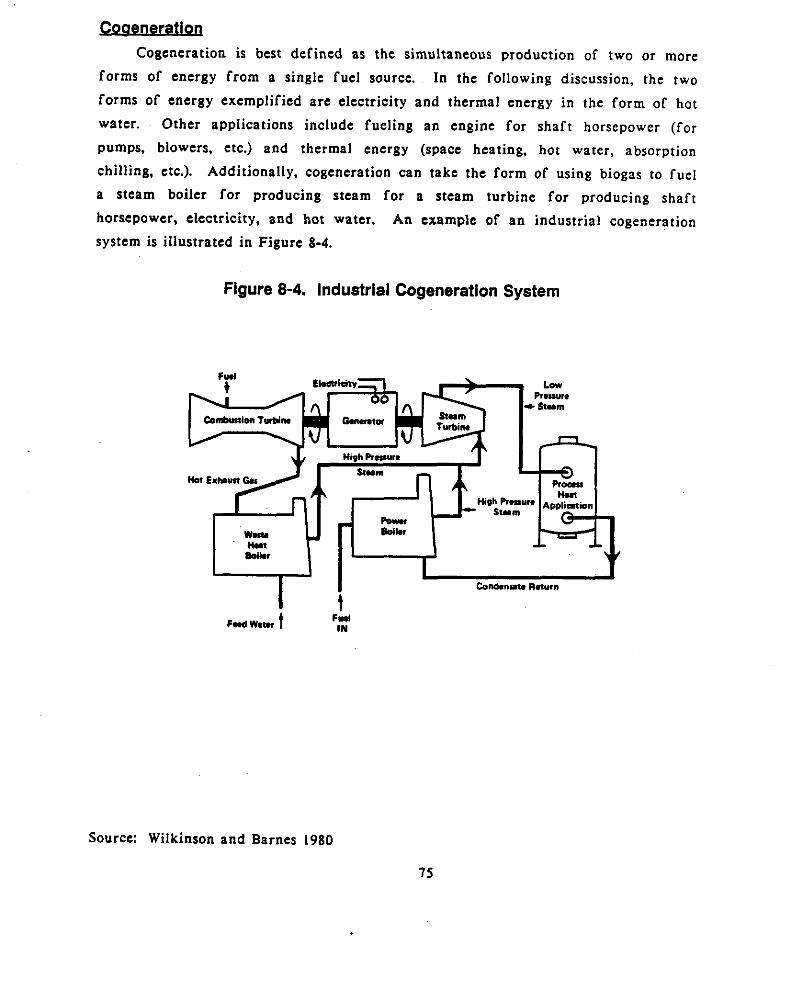
maeneration Cogeneration is best defined as the simultaneous production of two or more
forms of energy from a single fuel source. In the following discussion, the two
forms of energy exemplified are electricity and thermal energy in the form of hot
water. Other applications include fueling a n engine for shaf t horsepower (for pumps, blowers, etc.) and thermal energy (space heating, hot water, absorption chilling, etc.). Additionally, cogeneration can take the form of using biogas to fuel a steam boiler for producing steam for a steam turbine for producing shaf t
horsepower, electricity, and hot water. An example of a n industrial cogeneration system is illustrated in Figure 8-4.
Figure 8-4. Industrial Cogeneration System
Source: Wilkinson and Barnes 1980
7s
The layout of a small-scale ( 5 5 kW) cogeneration system including the major components of power unit, generator, heat recovery system, and controls is shown in Figure 8-5. This section will provide practical technical information on the
selection and operation of these various components relative to fueling by biogas.
Power Units Unit S i z i n e The sizing of a cogeneration system will have an impact on the
overall capital cost of the system, and the efficiency of tne system to produce
electricity and hot water. Optimal utilization is a function of operational energy
needs (electrical and thermal), the output of the cogeneration system, and the rate of production and storage of biogas for use by the system.
As illustrated in Figure 8-3. there are three basic options for prime mover in
a cogeneration system: reciprocating (internal combustion) engines, gas turbines,
and steam turbines. The ensuing discussion will be limited to internal combustion
engines, specifically spark ignition and compression ignition units.
Matching an Enerev Load. Once the diurnal energy pattern of an operation
has been established. an attempt can be made to match cogenerator operation to
provide the most power over the longest period of time. This procedure is
illustrated in Figure 8-6 where the electrical load of a dairy is evaluated for cogenerated electriciry. In this example, if biogas availability allows for the production of IO00 kWh of electricity per day, it may be economical to provide 50
k W for 20 hours per day rather than 100 kW for 10 hours per day. Most engine
manufacturers recommend continuous operation of their units over intermittent
operation for maintenance and longevity reasons.
In other operations, however, it may be more economical to use the
cogeneration system to either match or shave peak loads in order to reduce utility
demand charges. Sizing of a cogeneration system, therefore, would primarily be a
function of the amount of biogas that can be economically stored and the peak
demand period that must be met. Peak shaving requires a greater degree of system control and reliability to be effective.
In all cases, the radiator for a cogeneration system should be sized to meet
the full load cooling requirements of the system. This will permit operation of the system a t f u l l electrical power output during periods of low thermal energy demand
or heat recovery system failure.
76
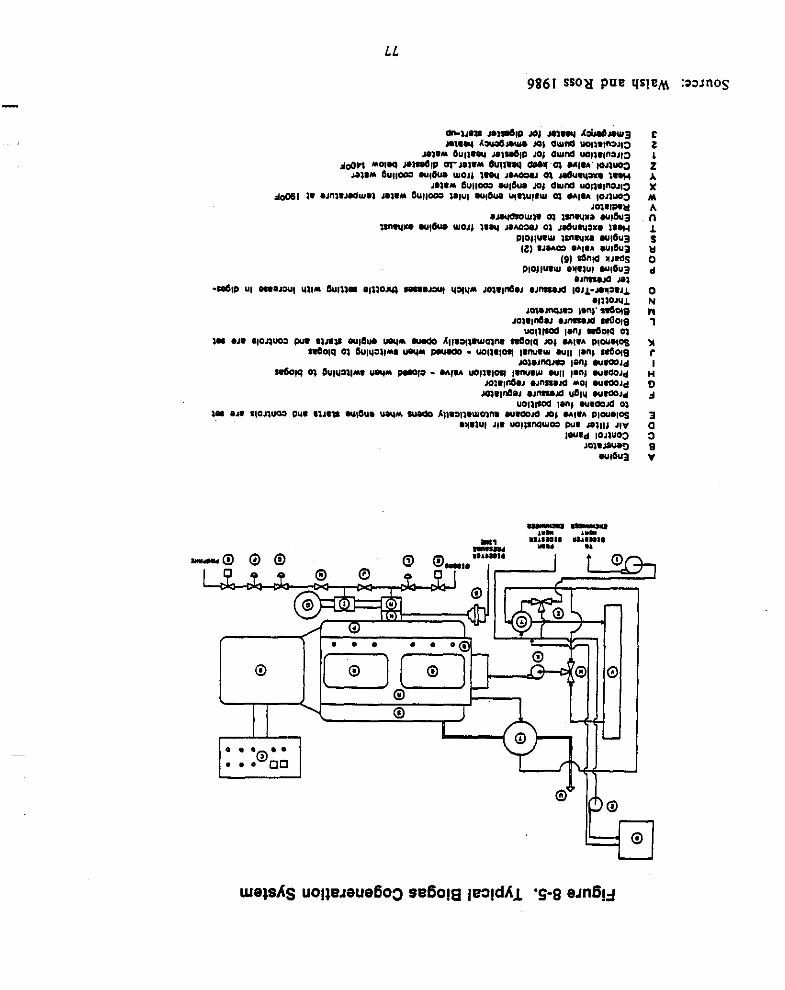
LL
E z I z A X M A
I S Y 0 d
0 N n 1
n
w r n I
0 d
3 0 3
I a
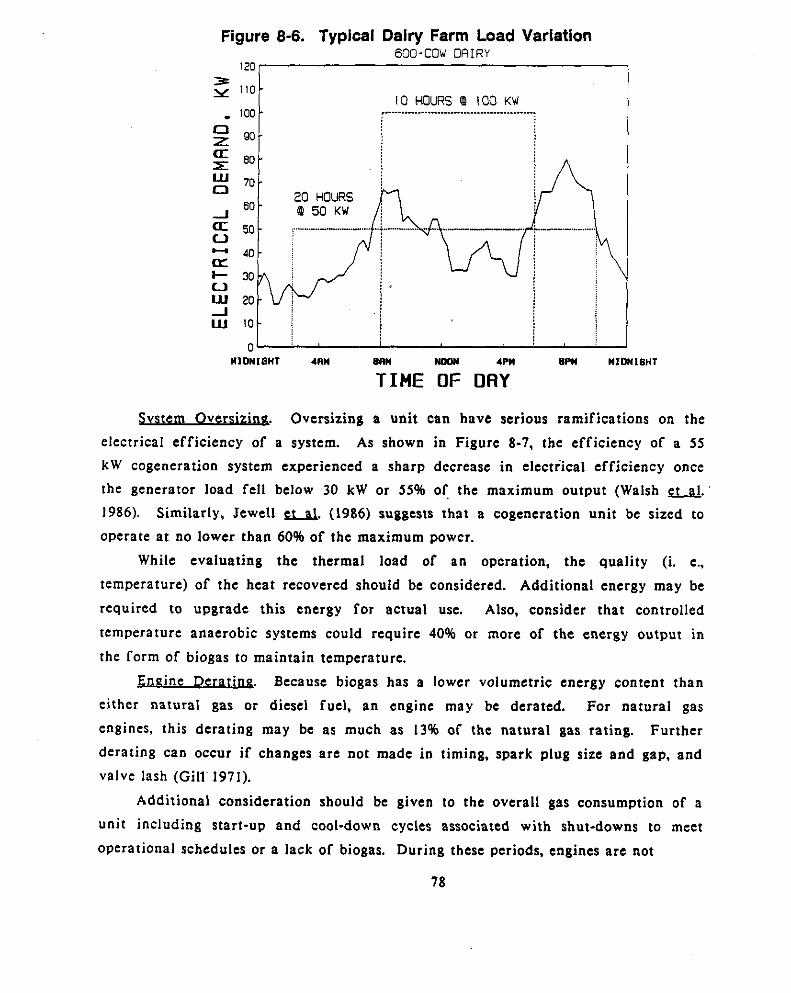
Figure 8-6. Typical Dairy Farm Load Variation 600-COW DAIRY
I L L
IO HOURS P 100 KW
0 z tK r UI 0
-1
o (L I- o UI -1 UI
a u
NIDNIGHT ~ R M 8flM wIo* 4PW 81% M I O N I ~ H T
TIME O f OAY
Svstem OversizirCg. Oversizing a unit can have serious ramifications on the
electrical efficiency of a system. As shown in Figure 8-7, the efficiency of a 5 5
k W cogeneration system experienced a sharp decrease in electrical efficiency once
the generator load fell below 30 kW or 55% of the maximum output (Walsh u. 1986). Similarly. Jewel1 a. (1986) suggests that a cogeneration unit be sized to
operate a t no lower than 60% of the maximum power.
While evaluating the thermal load of a n opcration, the quality (i. e.,
temperature) of the heat recovered should be considercd. Additional energy may be
required to upgrade this energy for actual use. Also, consider that controlled
temperature anaerobic systems could require 40% or more of the energy output in
the form of biogas to maintain temperature.
Engine Deratirlg . Because biogas has a lower volumetric energy content than
either natural gas or diesel fuel, an engine may be derated. For natural gas
engines, this derating may be as much as 13% or the natural gas rating. Further derating can occur if changes are not made i n timing, spark plug size and gap, and
valve lash (Gill 1971).
Additional consideration should be given to the overall gas consumption of a u n i t including start-up and cool-down cycles associated with shut-downs to meet
operational schedules or a lack of biogas. During these periods, engines are not
78
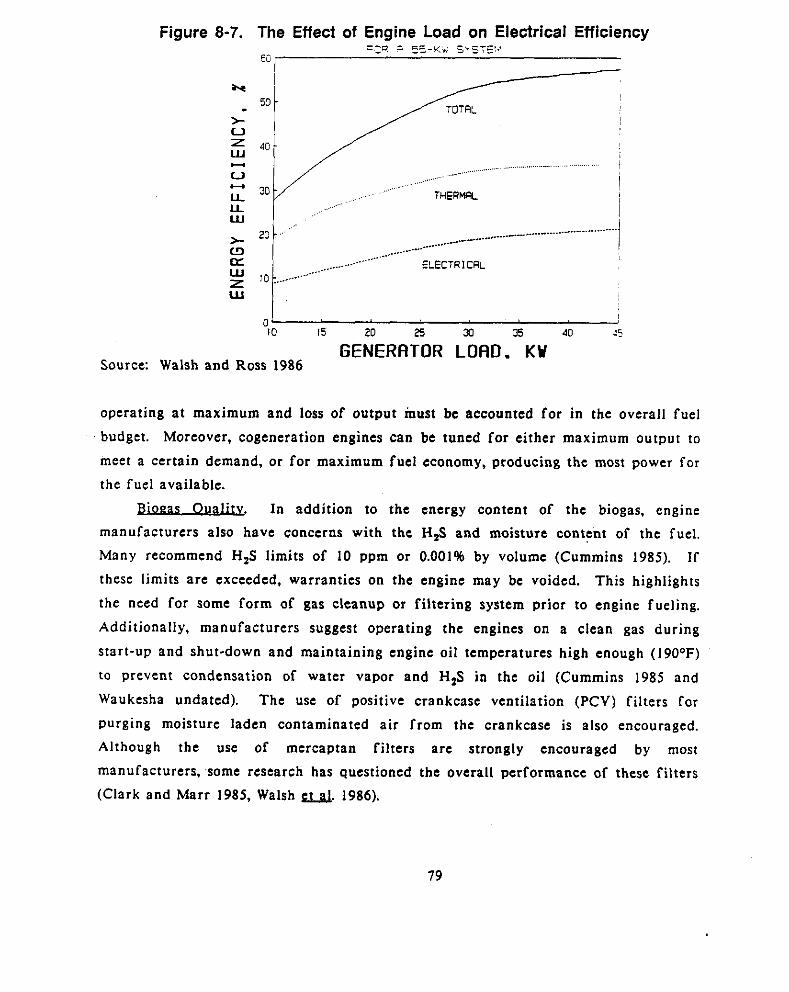
Figure 8-7. The Effect of Engine Load on Electrical Efficiency EO,
:-3 z = _ 5 - K N SY5TS'.,
r+ -
n I , , , , , . / - :5 40 15 20 25 30 35 10
GENERATOR LOAD. KW Source: Walsh and Ross 1986
operating a t maximum and loss of output must be accounted fo r in the overall fuel
budget. Moreover, cogeneration engines can be tuned fo r either maximum output to
meet a certain demand, or fo r maximum fue l economy, producing the most power for
the fuel available.
Bioeas Ouality . In addition to the energy content of the biogas, engine manufacturers also have concerns with the H,,S and moisture content of the fuel. Many recommend H,S limits of 10 ppm or 0.001% by volume (Cummins 1985). If
these limits are exceeded, warranties on the engine may be voided. This highlights
the need for some form of gas cleanup or filtering system prior to engine fueling.
Additionally, manufacturers suggest operating the engines on a clean gas during
start-up and shut-down and maintaining engine oil temperatures high enough ( 190°F) to prevent condensation of water vapor and H,S in the oil (Cummins 1985 and
Waukesha undated). The use of positive crankcase ventilation (PCV) filters for
purging moisture laden contaminated a i r from the crankcase is also encouraged. Although the use of mercaptan filters are strongly encouraged by most
manufacturers, some research has questioned the overall performance of these filters (Clark and Marr 1985, Walsh d. 1986).
79
%ark Ianition Enaines Fneine ModificatioQ . Spark ignition (SI) engines are the easiest engines to
convert to biogas due to the wide availability of natural gas fired units and the relative similarity of biogas to natural gas. There is also a large selection of diesel
powered cogeneration systems in the higher output ranges (over 500 kW).
Engine conversion to biogas fueling involves engine modification i n the
following areas:
o carburetion,
o spark gap settings, o spark timing, and
o maintenance requirements.
Carburetio& Carburetion modification basically involves accounting fo r the
lower volumetric heating value of the biogas relative to the primary fuel. For a
natural gas f i red engine, this amounts to increasing the fuel intake capacity of the
carburetor and restricting the combustion a i r intake.
Conversion of a gasoline fueled engine would require complete conversion to a
gaseous fuel carburetor sized to provide the volumetric flow necessary for maximum
power output. The anticipated fuel consumption of a biogas engine is a function of the engine itself. load considerations, engine speed, air-fuel ratio, and' fuel dilution.
The specific power output of an engine operated a t 900 rpm and a compression ratio of 15:l can be predicted using the equation shown below as developed by Neyeloff
and Gunkel (1981).
SPO = -154.8 - 9.24 x 10-*D + 41.9R - 3.24 RZ + 1.18 x 10"RS
Where: SPO = specific power output, HP/L CH4/min x 100 D R
(Note: 28.3 L/SCF)
- percent dilution, (COz/CH4) x 100 - percent fuel-air ratio, (CH4/air) x 100
The fuel consumption pattern of a 25 kW cogeneration unit a t various loads
(1985). noted the and air-fuel mix tures l s - illustrated in Figure 8-8. Walker
difficulty in physically adjusting the carburetor for maximum efficiency.
80
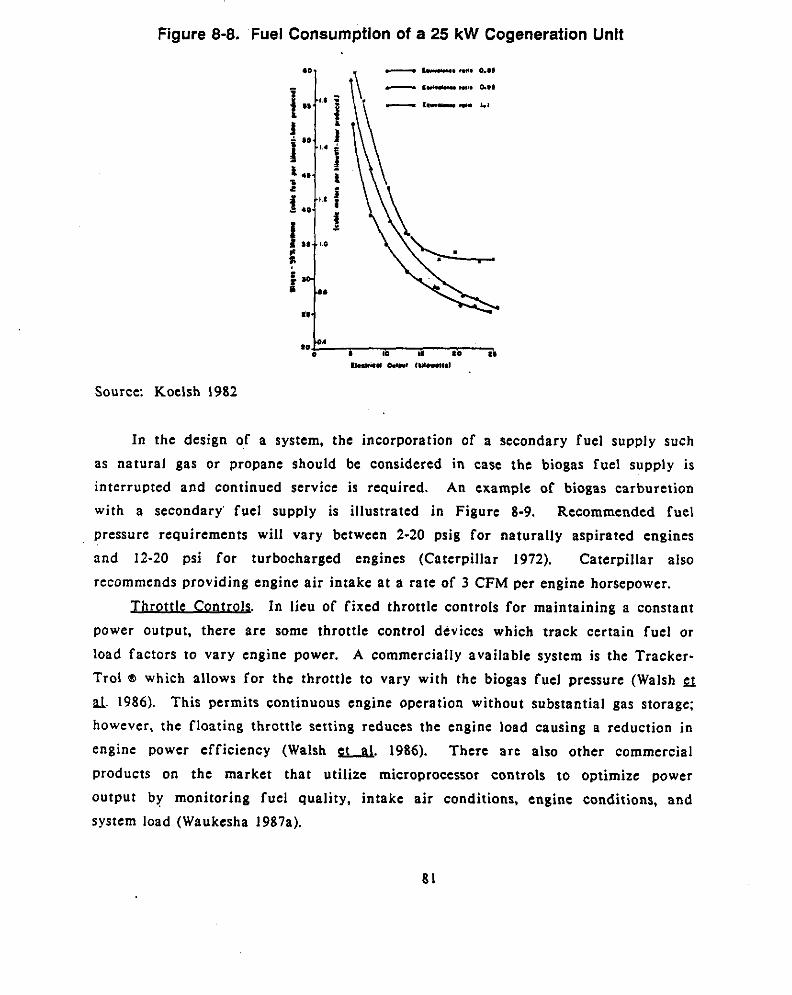
Figure 8-8. Fuel Consumption of a 25 kW Cogeneration Unit
t
Source: Koelsh 1982
In the design of a system, the incorporation of a secondary fuel supply such
as natural gas or propane should be considered in case the biogas fuel supply is interrupted and continued service is required. An example of biogas carburetion
with a secondary fuel supply is illustrated i n Figure 8-9. Recommended fuel pressure requirements will vary between 2-20 psig for naturally aspirated engines
and 12-20 psi for turbocharged engines (Caterpillar 1972). Caterpillar also
recommends providing engine air intake a t a rate of 3 CFM per engine horsepower.
Throttle ContEQLT . In lieu of fixed throttle controls for maintaining a constant
power output, there are some throttle control devices which track certain fuel or load factors to vary engine power. A commercially available system is the Tracker-
Trol a which allows for the throttle to vary with the biogas fuel pressure (Walsh
d. 1986). This permits continuous engine operation without substantial gas storage; however, the floating throttle setting reduces the engine load causing a reduction in
engine power efficiency (Walsh u. 1986). There a rc also other commercial
products on the market that utilize microprocessor controls to optimize power
output by monitoring fuel quality, intake air conditions, engine conditions, and
system load (Waukesha J987a).
81
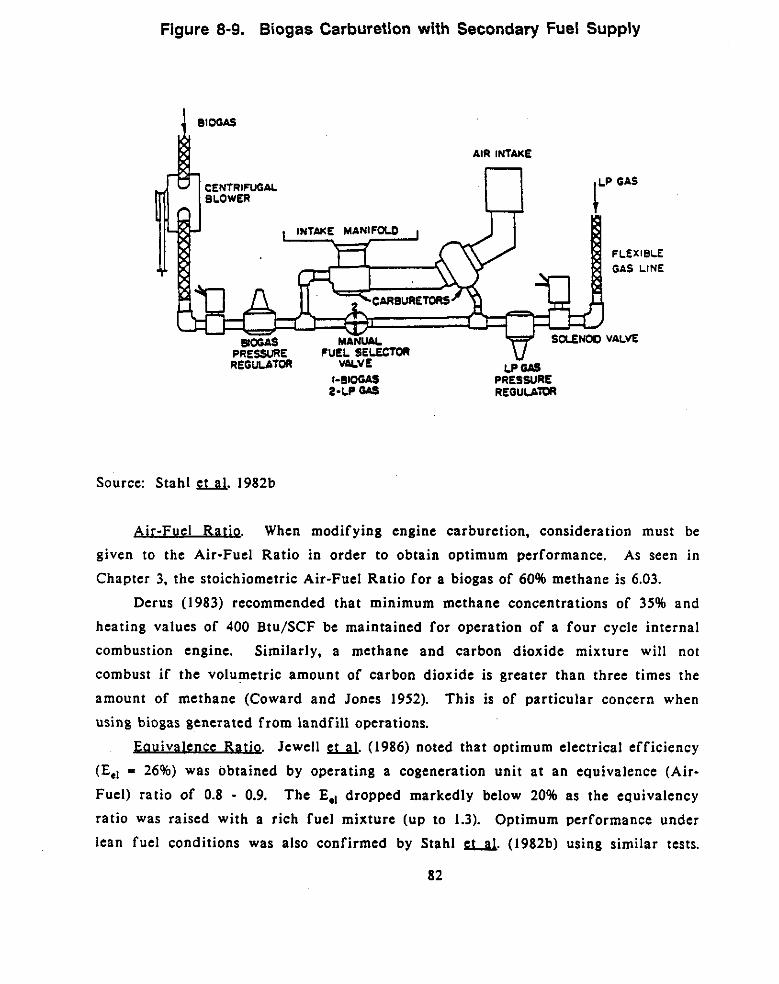
Figure 8-9. Biogas Carburetion with Secondary Fuel Supply
CENTRIFUGAL
MLVC L P a I-BIOGAS PRESSURE 2-LP ou REGULP;1W
Source: Stahl u. 1982b
Air-Fuel Rat ip. When modifying engine carburetion, consideration must be given to the Air-Fuel Ratio in order to obtain optimum performance. As seen in
Chapter 3, the stoichiometric Air-Fuel Ratio for a biogas of 60% methane is 6.03.
Derus (1983) recommended that minimum methane concentrations of 35% and
heating values of 400 Btu/SCF be maintained for operation of a four cycle internal
combustion engine. Similarly, a methane and carbon dioxide mixture will not
combust if the volumetric amount of carbon dioxide is greater than three times the
amount of methane (Coward and Jones 1952). This is of particular concern when
using biogas generated from landfil l operations.
Eauivalence Rat j ~ . Jewel1 u. (1986) noted that optimum electrical efficiency
(Ee1 = 26%) was obtained by operating a cogeneration unit a t an equivalence (Air-
Fuel) ratio of 0.8 - 0.9. The E,, dropped markedly below 20% as the equivalency
ratio was raised with a rich fuel mixture (up to 1.3). Optimum performance under lean fuel conditions was also confirmed by Stahl a. (1982b) using similar tests.
a2
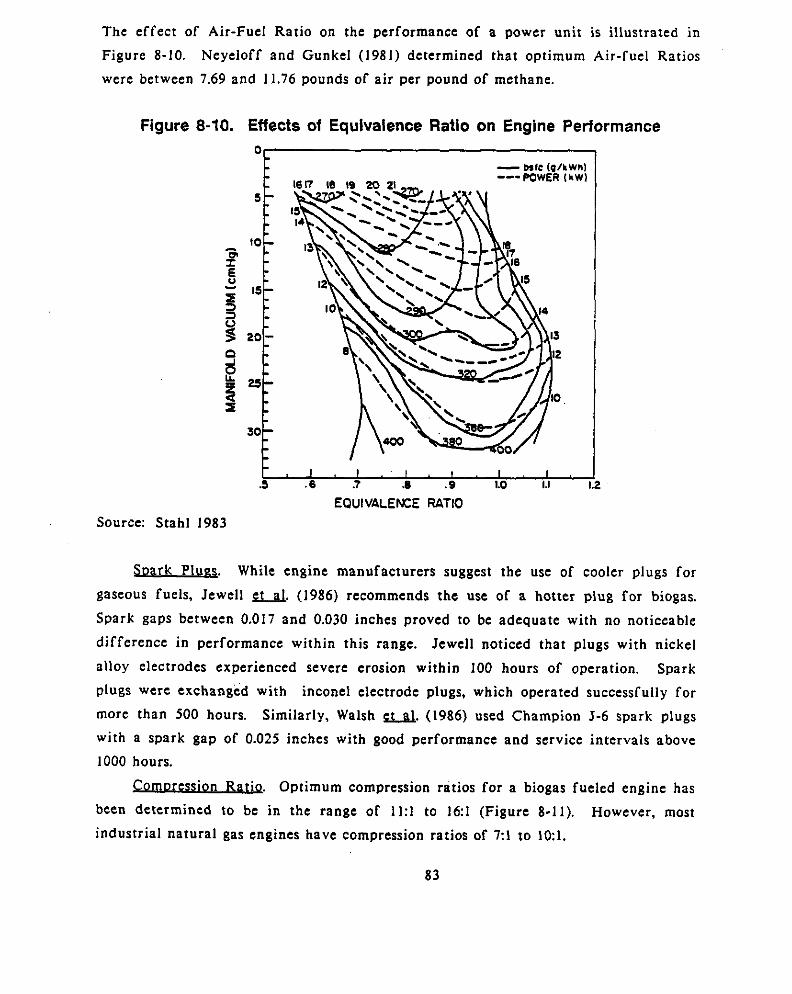
The effect of Air-Fuel Ratio on the performance of a power unit is illustrated in
Figure 8-10. Neyeloff and Gunkel (1981) determined that optimum Air-fuel Ratios
were between 7.69 and 11.76 pounds of a i r per pound of methane.
Figure 8-10. Effects of Equivalence Ratio on Engine Performance
.5 .6 .? .8 .s 1.0 1.1
EPUIVALEKE RATIO Source: Stahl 1983
Soark Plugs . While engine manufacturers suggest the use of cooler plugs for
gaseous fuels, Jewell u. (1986) recommends the use of a hotter plug for biogas.
Spark gaps between 0.017 and 0.030 inches proved to be adequate with no noticeable
difference in performance within this range. Jewell noticed that plugs with nickel
alloy electrodes experienced severe erosion within 100 hours of operation. Spark
plugs were exchanged with inconel electrode plugs, which operated successfully for more than 500 hours. Similarly, Walsh u. (1986) used Champion J-6 spark plugs
with a spark gap of 0.025 inches with good performance and service intervals above
1000 hours.
on Rat&. Optimum compression ratios for a biogas fueled engine has
been determined to be in the range of 11:l to 16:1 (Figure 8-11). However, most
industrial natural gas engines have compression ratios of 7:1 to 101.
83
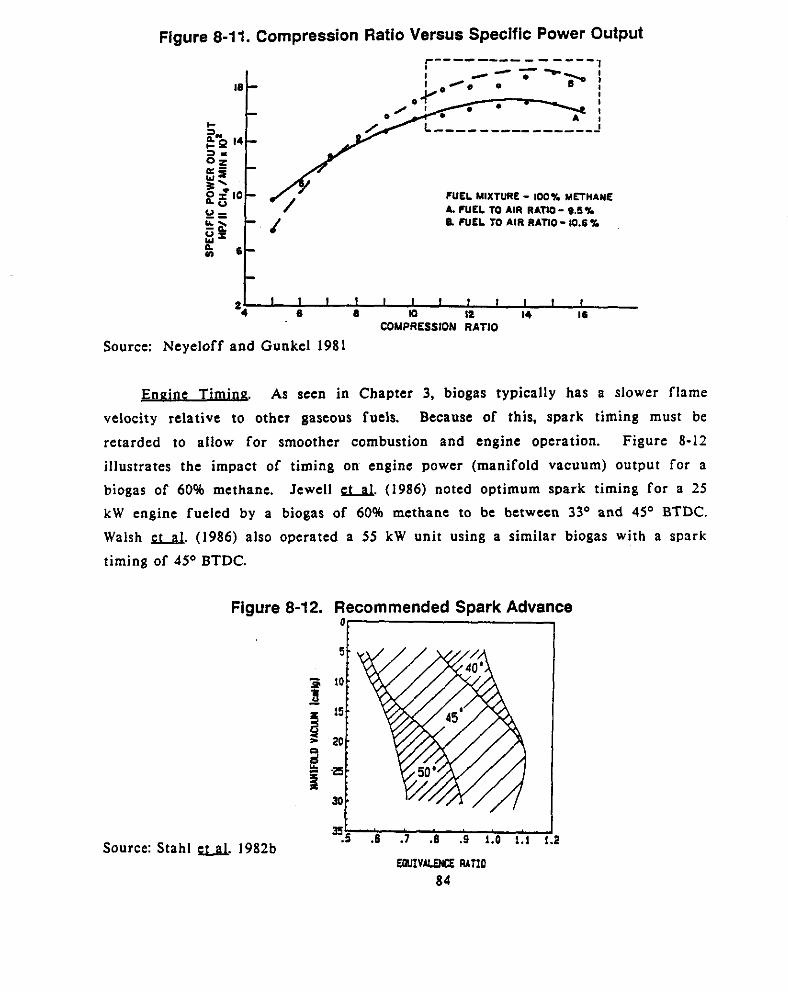
Source:
Figure 8-1 1. Compression Ratio Versus Specific Power Output r----- --__ - __-_,
?UEL MIXTURE - 100% Ml3HANE A. WLL TO AIR RATIO- 9.5% 0. N E L TO AIR RATIO- 10.6%
1 I 1 I I 1 I I 1 1 I 6 e m I2 I4 16
COMPRESSION RATIO
Neyeloff and Gunkel 1981
. As seen in Chapter 3, biogas typically has a slower flame Engine Tarmog velocity relative to other gaseous fuels. Because of this, spark timing must be
retarded to allow for smoother combustion and engine operation. Figure 8-12
illustrates the impact of timing on engine power (manifold vacuum) output for a biogas of 60% methane. Jewel1 u. (1986) noted optimum spark timing f o r a 25
k W engine fueled by a biogas of 60% methane to be between 3 3 O and 45' BTDC. Walsh u. (1986) also operated a 55 kW unit using a similar biogas with a spark timing of 4 5 O BTDC.
. .
Figure 8-12. Recommended Spark Advance
Source: Stahl d. 1982b
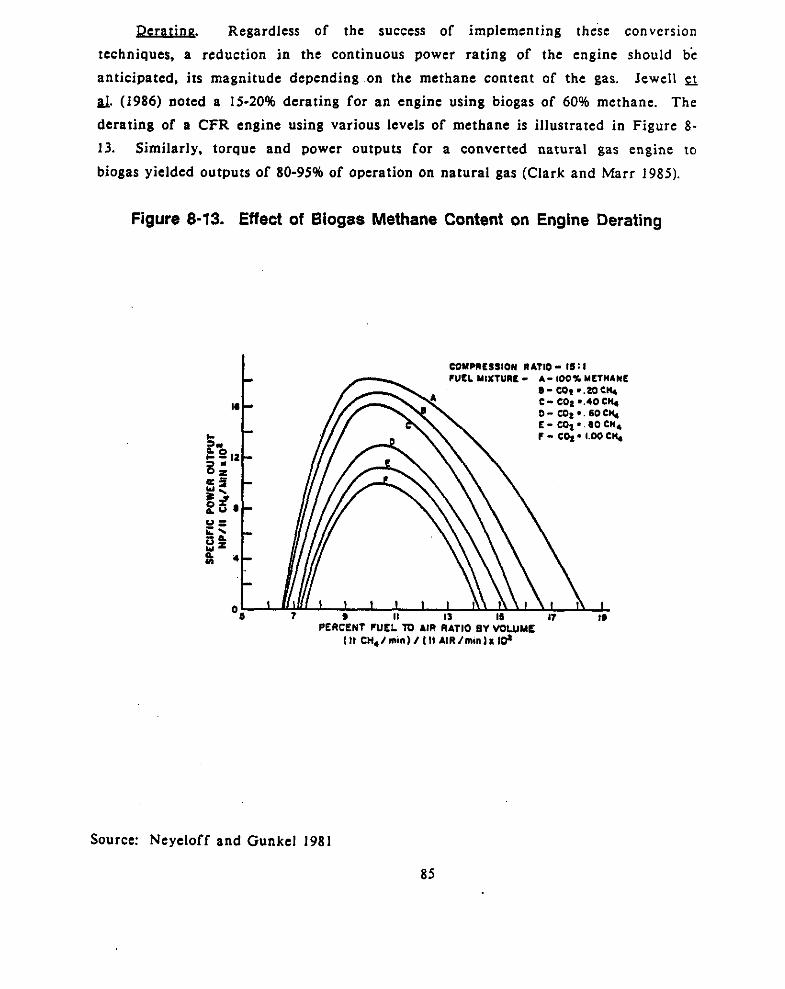
m. Regardless of the success of implementing these conversion techniques, a reduction in the continuous power rating of the engine should be
anticipated. its magnitude depending on the methane content of the gas. Jewel1 a a. (1986) noted a 15.20% derating for an engine using biogas of 60% methane. The derating of a CFR engine using various levels of methane is illustrated in Figure 8- 13. Similarly. torque and power outputs for a converted natural gas engine to
biogas yielded outputs of 80-95% of operation on natural gas (Clark and Marr 1985).
Figure 8-13. Effect of Biogas Methane Content on Engine Derating
Source: Neyeloff and Gunkel 1981
85
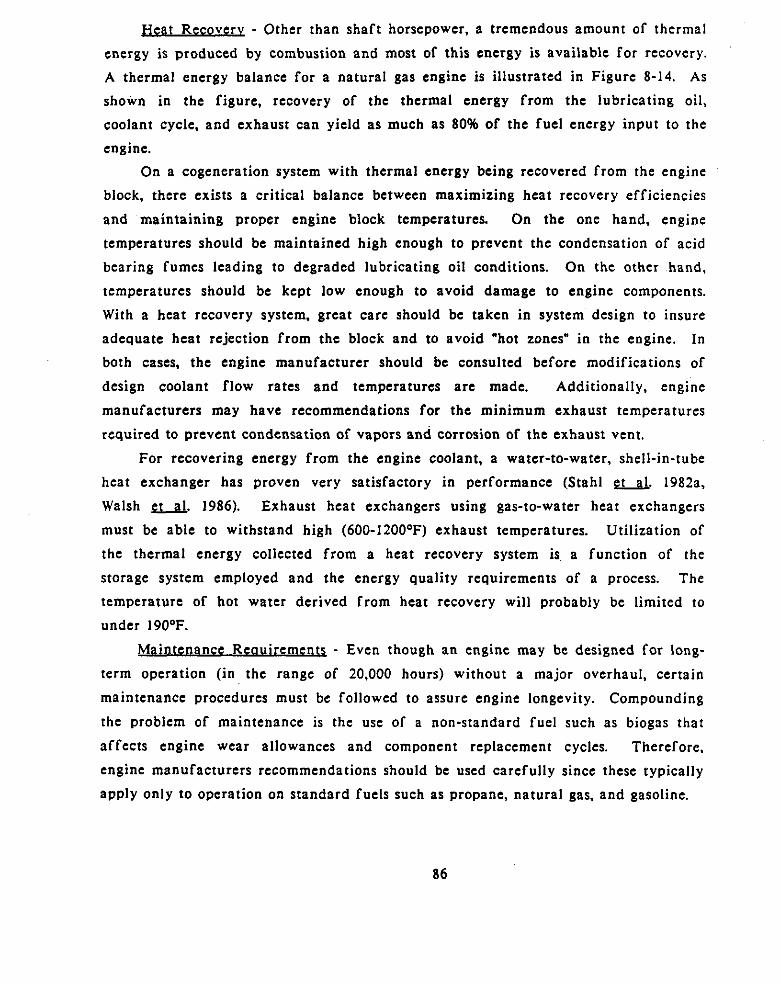
Heat Recovery - Other than shaf t horsepower, a tremendous amount of thermal
energy is produced by combustion and most of this energy is available for recovery. A thermal energy balance for a natural gas engine is illustrated in Figure 8-14. As
shown in the figure, recovery of the thermal energy from the lubricating oil,
coolant cycle, and exhaust can yield as much as 80% of the fuel energy input to the
engine. On a cogeneration system with thermal energy being recovered from the engine
block, there exists a critical balance between maximizing heat recovery efficiencies
and maintaining proper engine block temperatures. On the one hand, engine
temperatures should be maintained high enough to prevent the condensation of acid bearing fumes leading to degraded lubricating oil conditions. On the other hand,
temperatures should be kept low enough to avoid damage to engine components. With a heat recovery system, great care should be taken in system design to insure
adequate heat rejection from the block and to avoid "hot zones" in the engine. In
both cases, the engine manufacturer should be consulted before modifications of design coolant f low rates and temperatures are made. Additionally. engine
manufacturers may have recommendations for the minimum exhaust temperatures
required to prevent condensation of vapors and corrosion of the exhaust vent.
For recovering energy from the engine coolant, a water-to-water, shell-in-tube
heat exchanger has proven very satisfactory in performance (Stahl et. 1982a,
Walsh u. 1986). Exhaust heat exchangers using gas-to-water heat exchangers
must be able to withstand high (600-1200°F) exhaust temperatures. Utilization of
the thermal energy collected from a heat recovery system is a function of the
storage system employed and the energy quality requirements of a process. The
temperature of hot water derived from heat recovery will probably be limited to under 190'F.
Main tena nce ReouiremenQ - Even though a n engine may be designed for long-
term operation (in the range of 20,000 hours) without a major overhaul, certain
maintenance procedures must be followed to assure engine longevity. Compounding
the problem of maintenance is the use of a non-standard fuel such as biogas that
affects engine wear allowances and component replacement cycles. Therefore,
engine manufacturers recommendations should be used carefully since these typically
apply only to operation on standard fuels such as propane, natural gas, and gasoline.
86
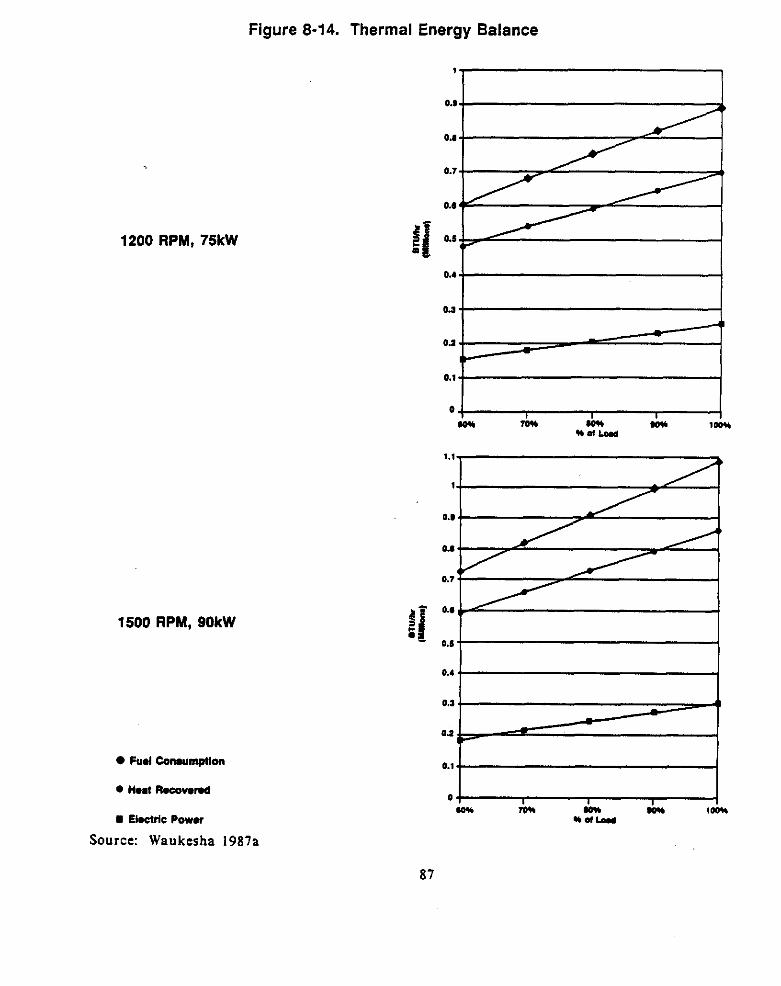
Figure 8-14. Thermal Energy Balance
1200 RPM, 75kW
1500 RPM. 90kW
Fud bnwmptlon
0 Had R ~ o w d
Electric Poww
Source: Waukesha 1987a
87
For this reason, i t is very difficult to estimate the maintenance cycles for
these engines, and subsequently. the costs of maintenance. It is very imporrant, however, that the costs of engine maintenance be reviewed in the context of biogas fueling of the engine. Oil and fi l ter change intervals may be shorter, as may be the intervals for minor and major overhauls. This will have a serious impact on the
cost per kWh of electrical production or Btu/hour of thermal energy production. Since engine maintenance costs are primarily based on the hours of engine
operation, there exists a distinct economy of scale factor, i. e.. a 40 kW uni t will
have higher costs per kWh output than a 150 kW unit.
Operation and maintenance costs of $3.700 for a 55 kW system operated for 7,880 hours per year have been reported (Walsh and Ross 1986). Pellerin
(1988) indicated similar costs for a 35 kW unit. S3.200 for 7,440 hours. Table 8-2
illustrates the various cost items and maintenance frequency for the 55 k W
cogeneration system. These data compare well with a rule-of-thumb for
maintenance costs of $0.0125 per kWh (Cummins 1982). A 55 kW unit operated 7,800
hours per year a t 80% load would have maintenance costs of $4,300 per year.
Oil TesQ - A major consideration in engine maintenance is the frequency of oil changes and type of oil used. Most manufacturers have recommendations for
oils to be used in their engines fueled by biogas or "sour" gases and for the
frequency of oil changes based on general engine operation. In order to monitor the general well-being of an engine using biogas, oil
testing is essential. Selecting an oil testing lab could be considered as important as selecting a good medical doctor. Although cost is a consideration, i t should be
third on the list following lab reliability and response time. Because signs of
engine failure can appear within a short span of operation, being able to take an
oil sample, send it to a test lab, and receive the lab report within a two week
period is essential. Most test labs will provide a sample mailer with a label for
detailing the source of the oil and other operational data.
Test results from the test lab must be interpreted; therefore, i t is important
that the laboratory chosen understands the type of engine and fuels being used. The concentration of wear metals in the sample will be dependent on the make of engine, fuel, and total hours of operation. A sample of an oil test performed on a biogas fired engine as determined by Walsh (1986) is shown in Table 8-3 . Additional information regarding the type of wear metals and the concentrations to expect, should be available from the engine manufacturer.
88
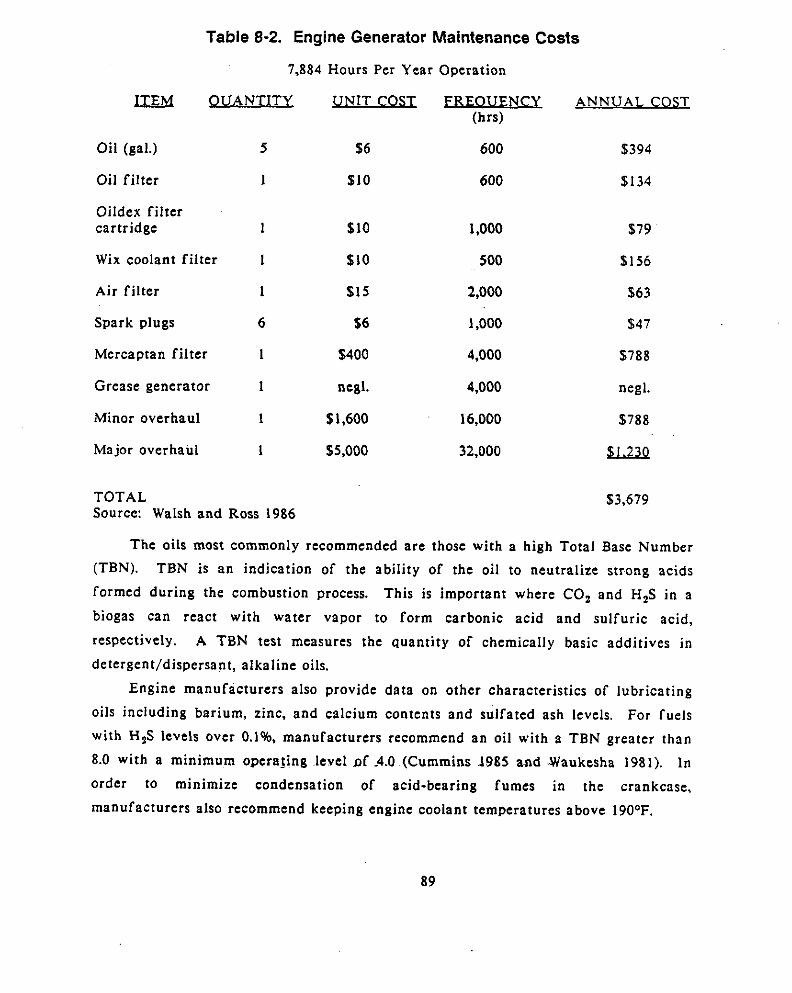
Oil (gal.)
Oil f i l ter
Oildex fi l ter cartridge
Table 8-2. Engine Generator Maintenance Costs
7,884 Hours Per Year Operation
QUA NTITY UNIT COS T FREOUENCY ANNUAL COS T (hrs)
5 $6 600 $394
1 $10 600 $134
1 $10 I.000 $79
Wix coolant f i l ter I $10
Air fi l ter I $15
500 $156
2,000 $63
Spark plugs 6 $6 1.000 $47
Mercaptan fi l ter I $400 4,000 $188
Grease generator I negl. 4,000 negl.
Minor overhaul 1 $ 1.600 16,000 $188
Major overhaul 1 $5,000 32,000 U2x!
TOTAL Source: Walsh and Ross 1986
$3,679
The oils most commonly recommended are those with a high Total Base Number
(TBN). TBN is an indication of the ability of the oil to neutralize strong acids
formed during the combustion process. This is important where CO, and H,S i n a
biogas can react with water vapor to form carbonic acid and sulfuric acid,
respectively. A TBN test measures the quantity of chemically basic additives in detergent/dispersant, alkaline oils.
Engine manufacturers also provide data on other characteristics of lubricating
oils including barium, zinc, and calcium contents and sulfated ash levels. For fuels with H2S levels over 0.1%. manufacturers recommend an oil with a TEN greater than
8.0 with a minimum operating level nf .4.0 (Cummins 1985 and Waukesha 1981). I n order to minimize condensation of acid-bearing fumes in the crankcase,
manufacturers also recommend keeping engine coolant temperatures above 190OF.
89
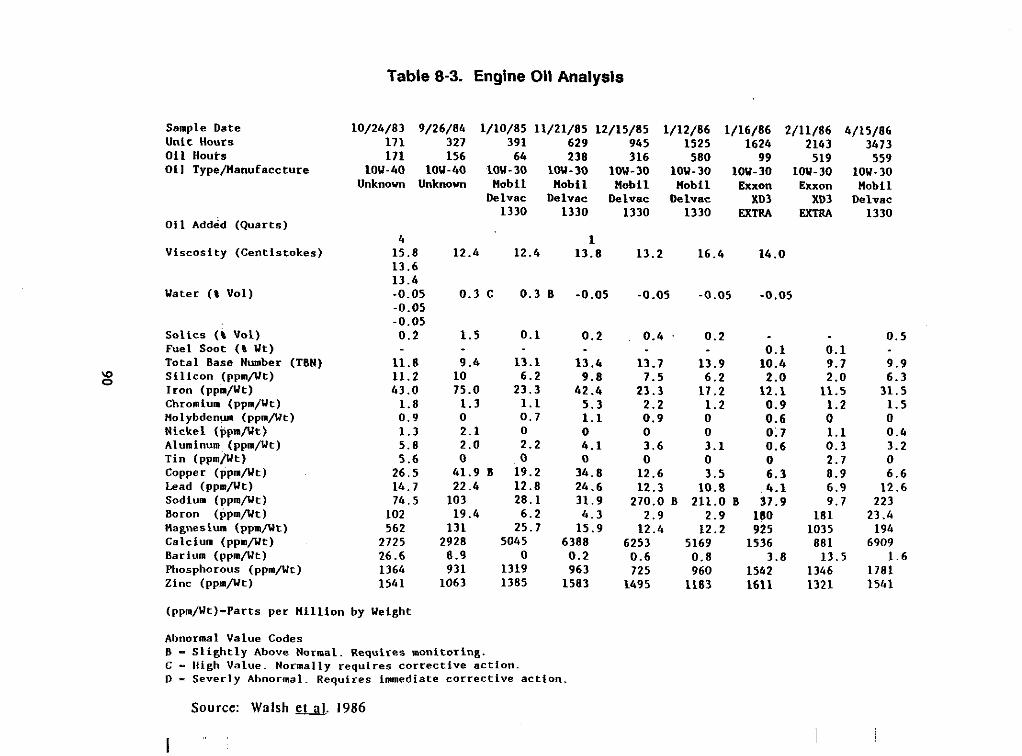
Table 8-3. Engine Oil Analysls
W 0
Sample Date 10/24/83 9/26/84 1/10/85 11/21/85 12/15/85 1/12/86 1/16/86 2/11/86 4/15/06 Unit Hours 171 321 391 629 945 1525 1624 2143 3473 Oil Houts 1 7 1 156 64 238 316 580 99 519 559 Oil Type/Manufaccture 1OU-40 1OU-40 1OU-30 1OU-30 1W-30 1oV-30 1OW-30 1OU-30 low-30
Unknown Unknown Mobil Mobil Mobil Hob11 Exxon Exxon Mobil Oelvac Oelvac Delvac Oelvac xo3 X03 Delvac
1330 1330 1330 1330 EXTRA EXTRA 1330 Oil Added (Quarts)
Viscosity (Centistokes) 15.8 12.4 12.4 13.8 13.2 16.4 14.0 4 1
13.6 13.4
-0.05 -0.05
Water (e V o l ) -0.05 0.3 C 0 . 3 B -0.05 -0.05 -0.05 -0.05
SOlLCS (% Vol) 0.2 1.5 0.1 0.2 , 0.4 ' 0.2 0.5 Fuel Soot ( E Ut) 0.1 0.1 Total Base Number (TEN) 11.8 9.4 13.1 13.4 13.7 13.9 10.4 9.1 9.9 Silicon (ppmpt) 11.2 10 6.2 9.8 7.5 6.2 2.0 2.0 6.3 Iron (ppmpt) 43.0 15.0 23.3 42.4 23.3 11.2 12.1 11.5 31.5 Chromium (ppm/Ut) 1.8 1.3 1.1 5.3 2.2 1.2 0.9 1.2 1.5
Nickel (ppm/Ut) 1 . 3 2.1 0 0 0 0 0;7 1.1 0.4 Aluminum, (ppmflt) 5.8 2.0 2.2 4.1 3.6 3.1 0.6 0 . 3 3.2
Copper (ppm/Ut) 26.5 41.9 B 19.2 34.8 12.6 3.5 6.3 8.9 6.6 Lead (ppm/Ut) 14.7 22.4 12.8 24.6 12.3 10.8 4.1 6.9 12.6 Sodium (ppmpt) 14.5 103 28.1 31.9 270.0 B 211.0 B 37.9 9.7 223 Boron (ppmpt) 102 19.4 6.2 4.3 2.9 2.9 180 181 23.4 Magnesium (ppm/Ut) 562 131 25.7 15.9 12.4 12.2 925 1035 194 Calcium (ppmpt) 2725 2928 5045 6388 6253 5169 1536 881 6909 Barium (ppm/Ut) 26.6 8.9 0 0.2 0.6 0.8 3.8 13 .5 1.6 Phosphorous (ppm/Ut) 1364 931 1319 963 725 960 1542 1346 1781 Zinc (ppm/Ut) 1541 1063 1385 1583 1495 1183 1611 1321 1541
(ppn/Ut)-Parts per Million by Weight
Abnormal Value Codes B - Slightly Above Normal. Requires monitoring. C - Iligh Value. Normally requires corrective action. D - Severly Abnormal. Requires immediate corrective action.
Molybdenw (ppmpt) 0.9 0 0.1 1.1 0.9 0 0.6 0 0
Tin (ppm/Vt) 5.6 0 0 0 0 0 0 2.7 0
Source: Walsh et. 1986
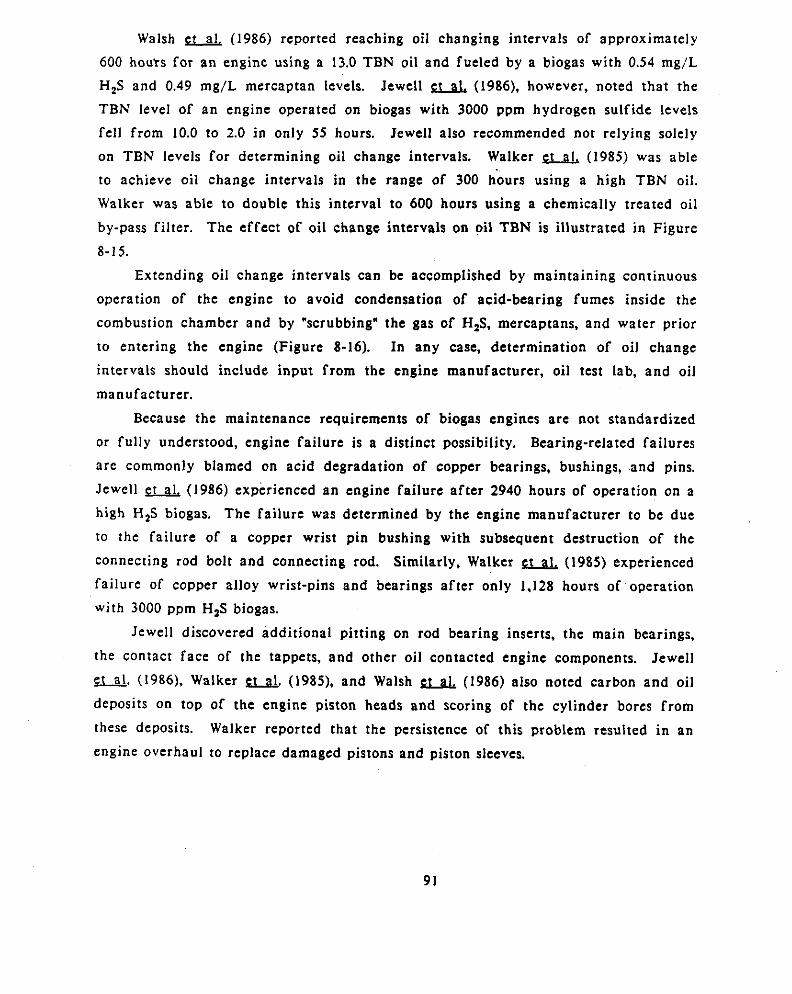
Walsh a (1986) reported reaching oil changing intervals of approximately
600 houys for a n engine using a 13.0 TBN oil and fueled by a biogas with 0.54 mg/L H,S and 0.49 mg/L mercaptan levels. Jewell (1986), however, noted that the
TBN level of a n engine operated on biogas with 3000 ppm hydrogen sulfide levels
fell from 10.0 to 2.0 i n only 55 hours. Jewell also recommended not relying solely
on TEN levels fo r determining oil change intervals. (1985) was able
to achieve oil change intervals in the range of 300 hours using a high TBN oil. Walker was able to double this interval to 600 hours using a chemically treated oil by-pass filter. The effect of oil change intervals on oil TBN is illustrated in Figure
8-15,
Walker
Extending oil change intervals can be accomplished by maintaining continuous
operation of the engine to avoid condensation o f acid-bearing fumes inside the combustion chamber and by "scrubbing" the gas of H,S, mercaptans, and water prior
to entering the engine (Figure 8-16). In any case, determination of oil change
intervals should include input from the engine manufacturer, oil test lab, and oil
manufacturer. Because the maintenance requirements of biogas engines are not standardized
or fully understood, engine failure is a distinct possibility. Bearing-related failures
are commonly blamed on acid degradation of copper bearings, bushings, and pins. Jewell (1986) experienced a n engine failure af ter 2940 hours of operation on a
high H,S biogas. The failure was determined by the engine manufacturer to be due
to the failure of a copper wrist pin bushing with subsequent destruction of the
connecting rod bolt and connecting rod. Similarly, Walker (1985) experienced
failure of copper alloy wrist-pins and bearings af ter only 1,128 hours of operation w i t h 3000 ppm H,S biogas.
Jewell discovered additional pitting on rod bearing inserts, the main bearings,
the contact face of the tappets, and other oil contacted engine components. Jewell
U. (1986), Walker u. (1985). and Walsh (1986) also noted carbon and oil deposits on top of the engine piston heads and scoring of the cylinder bores from
these deposits. Walker reported that the persistence of this problem resulted in an engine overhaul to replace damaged pistons and piston sleeves.
91
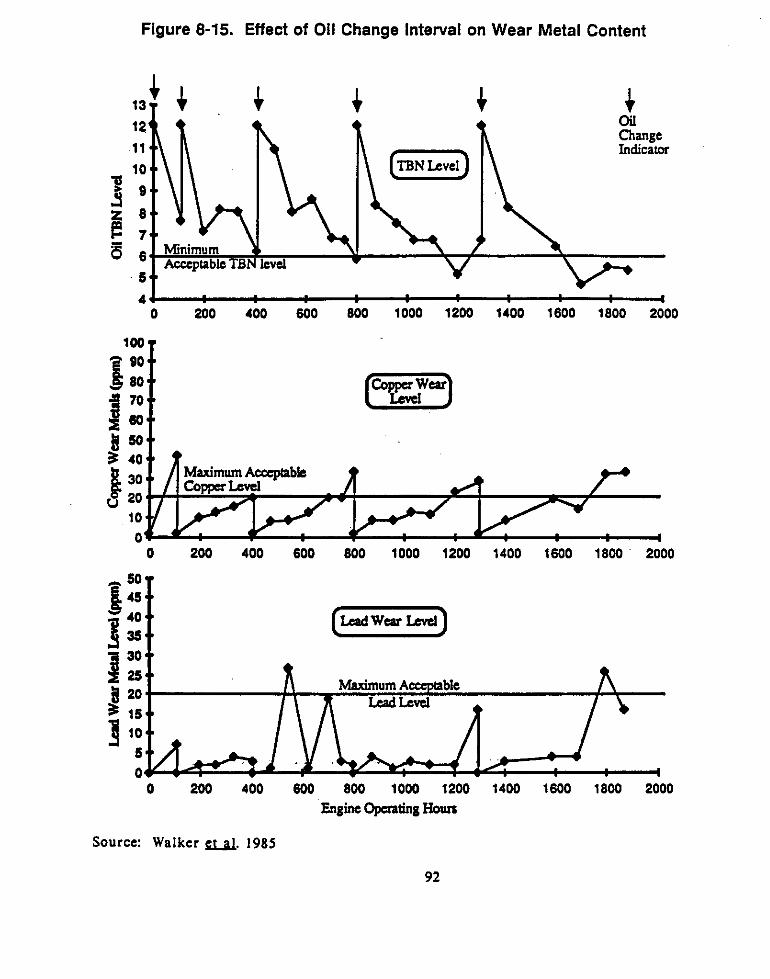
Figure 8-15. Effect of Oil Change Interval on Wear Metal Content
0 200 400 600 800 1000 1200 1400 1600 1800 2000
loo r
(-2) 8 :::: ? 'O:: E"
Maximum Acccptpble
0 200 400 600 800 1000 1200 1400 1600 1800 2000
Marimum Acceptable
0 200 400 600 800 1000 1200 1400 1600 1800 2000 Engine opcnting Houn
Source: Walker a. 1985
92
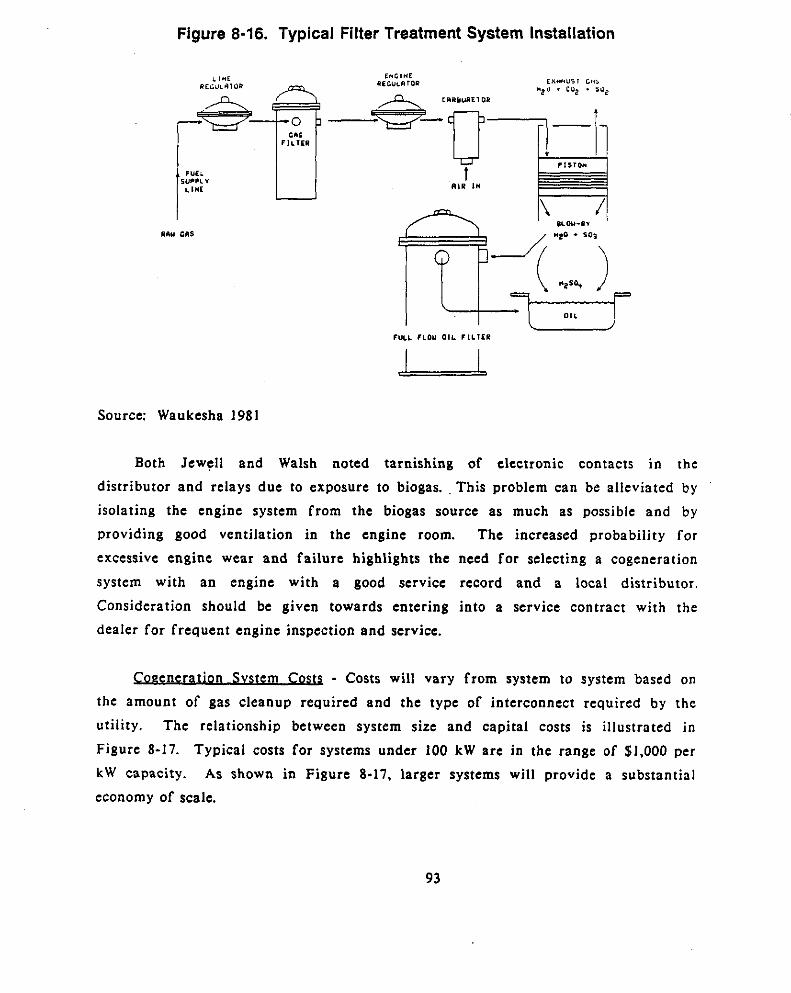
Figure 8-16. Typical Filter Treatment System Installation
re- F l l l F R 7 t
Source: Waukesha 1981
Both Jewel1 and Walsh noted tarnishing of electronic contacts in the
distributor and relays due to exposure to biogas. . This problem can be alleviated by
isolating the engine system from the biogas source as much as possible and by providing good ventilation in the engine room. The increased probability for
excessive engine wear and fai lure highlights the need for selecting a cogeneration
system with an engine with a good service record and a local distributor.
Consideration should be given towards entering into a service contract with the dealer for frequent engine inspection and service.
C o e e n e r u n Svstem Cos& - Costs will vary from system to system based on the amount of gas cleanup required and the type of interconnect required by the
utility. The relationship between system sire and capital costs is illustrated i n Figure 8-17. Typical costs for systems under 100 kW are in the range of $1.000 per k W capacity. As shown in Figure 8-17, larger systems will provide a substantial
economy of scale.
93
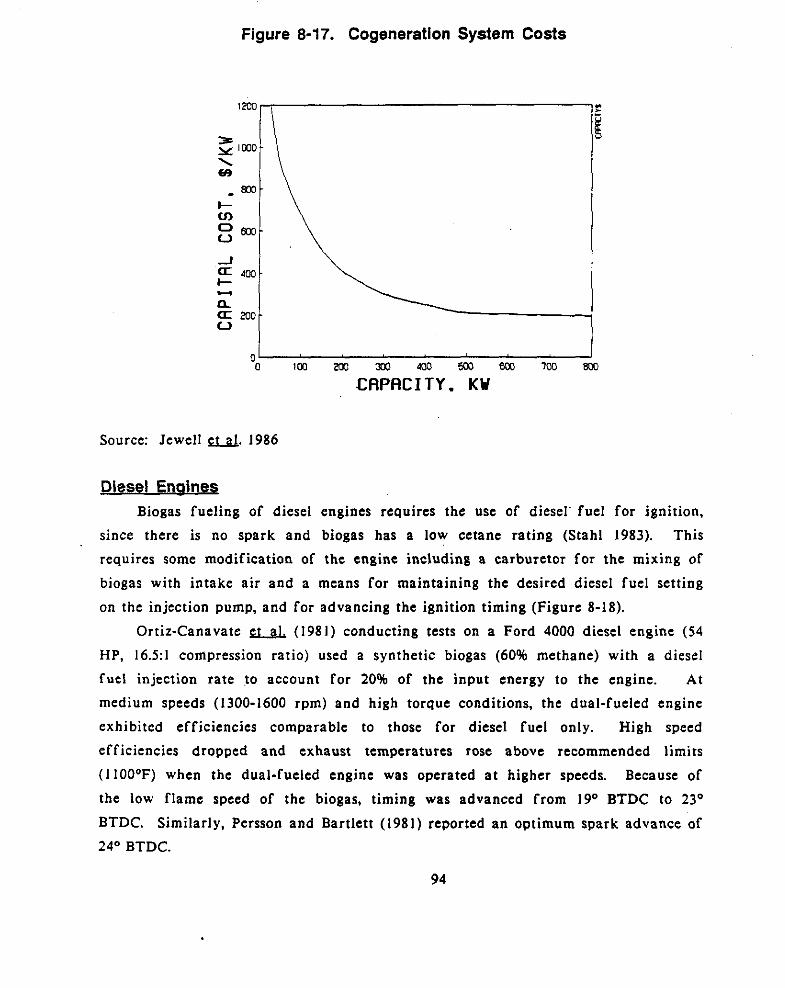
Figure 8-17. Cogeneration System Costs
I 0 im 203 xc 400 5~ m 700 m
CAPACITY. KY
Source: Jewel1 u. 1986
Diesel Enoines Biogas fueling of diesel engines requires the use of diesel fuel for ignition,
since there is no spark and biogas has a low cetane rating (Stahl 1983). This
requires some modification of the engine including a carburetor for the mixing of
biogas with intake air and a means for maintaining the desired diesel fuel setting
on the injection pump, and for advancing the ignition timing (Figure 8-18).
Ortiz-Canavate (1981) conducting tests on a Ford 4000 diesel engine (54
HP, 1621 compression ratio) used a synthetic biogas (60% methane) with a diesel
fue l injection rate to account for 20% of the input energy to the engine. At
medium speeds (1300-1600 rpm) and high torque conditions, the dual-fueled engine
exhibited efficiencies comparable to those for diesel fuel only. High speed
efficiencies dropped and exhaust temperatures rose above recommended limits
(llOO°F) when the dual-fueled engine was operated a t higher speeds. Because of
the low flame speed of the biogas, timing was advanced from 1 9 O BTDC to 2 3 O
BTDC. Similarly. Persson and Bartlett (1981) reported an optimum spark advance of 24' BTDC.
94
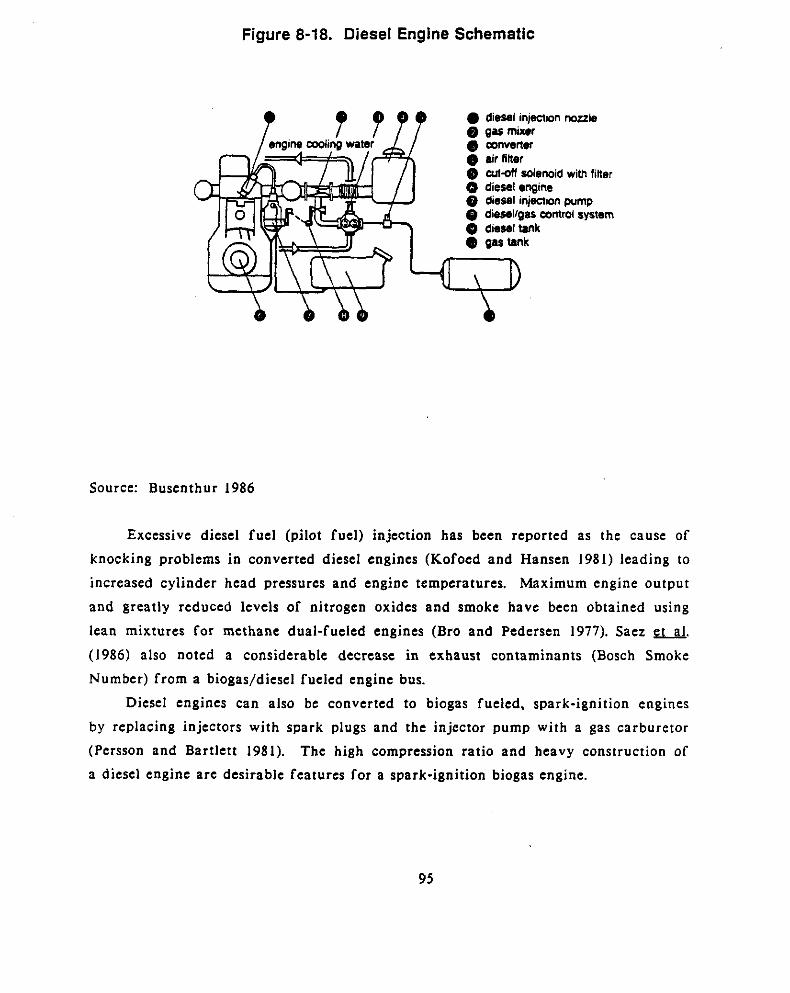
Figure 8-18. Diesel Engine Schematic
diesel injectlon nozzle
@ add solenoid with finer Q dieselengine @ diesel inleaon pump Q diesel/gas control system Q diesel tank
Source: Busenthur 1986
Excessive diesel fuel (pilot fuel) injection has been reported as the cause of
knocking problems i n converted diesel engines (Kofoed and Hansen 1981) leading to
increased cylinder head pressures and engine temperatures. Maximum engine output
and greatly reduced levels of nitrogen oxides and smoke have been obtained using
lean mixtures for methane dual-fueled engines (Bro and Pedersen 1977). Saez etal. (1986) also noted a considerable decrease in exhaust contaminants (Bosch Smoke
Number) from a biogas/diesel fueled engine bus.
Diesel engines can also be converted to biogas fueled. spark-ignition engines by replacing injectors with spark plugs and the injector pump with a gas carburetor
(Person and Bartlett 1981). The high compression ratio and heavy construction of a diesel engine are desirable features for a spark-ignition biogas engine.
95
Coaeneration Policiea Electricity produced by cogeneration from biogas can be used i n basically four
ways: 1) isolated consumption for loads on-site, 2) parallel consumption on-site and re-sale to a utility grid, 3) third party sales, and 4) direct sale to a utility grid.
In all cases, design considerations must be given to the metering of power and the
protection of loads, metering equipment. generating equipment, and personnel. When considering sale of electricity to a utility, most of the negotiations will
fall under the tenants of the Public Utilities Regulatory Act of 1978 (PURPA).
These include:
o requiring a utility to buy all power from any qualifying
facility, o exempting a cogenerator from utility commission
regulations,
back’ing up a cogenerator, and exempting a cogenerator from the Public Utility Holding
Company Act and other federal utility acts.
o blocking utilities from charging excessive rates for
o
Although PURPA has been implemented since 1978, several court challenges have and continue to change its exact meaning and intent (Wooster and Thompson
1985). Subsequently, there are as many interpretations of PURPA as there are
utili ties.
This means that each cogeneration project should be considered site-specific
and negotiated as such. Items for negotiation include:
o metering requirements,
o buy-back rates,
o stand-by or backup rates,
o liability insurance,
o protection system design, o o
power quality (power factor, etc.).
project scheduling (when and who will build
system),
96
o interconnect ownership (important in third party
systems), and utility service charges for operating the
system.
o
The issue of interconnecting with a utility should not be considered trivial. A
significant amount of time and effor t may be invested in the preliminary discussions, planning, and for implementation of an interconnect system between a
cogenerator and the utility (Ross and Walsh 1986, Regulatory Policy Inst. 1983). Technical requirements for a utility interface are based on reliability and speed
for the protection of equipment and personnel. These technical requirements
typically are not negotiable with a utility and may be found in the interconnection
standards published by the prospective utility. A number of variables will affect
the design of an interconnect system including:
Generator tvDc . Generally, electrical generators are basically grouped into two types: synchronous and induction (asynchronous). Induction generators are basically
induction motors operated overspeed and are typically used for parallel cogeneration
to a utility grid and to plant loads. The inherent protection characteristic of the
induction generator in that i t requires power from the grid to operate makes i t well
suited for this application. Synchronous generators require the use of additional components to maintain synchronous operation with the grid.
. . Condition of the utllitv er iQ. The age of the utility grid and the type of grid components within the affected area of a cogeneration project are interrelated with
the performance of a cogeneration interface.
Proxim' itv to other DO wer aroducerq . Utilities are concerned with a power phenomena called "islanding" whereby induction power units could conceivably
support each other in the event of a grid outage causing mayhem in the system.
Power aua lity. Utilities will require that measures be taken for the cogenerator to match or exceed the power quality (power factor) of the power
supplied to the cogenerator. Many small generators have power factor ratings
below 0.80 while many utilities require them to be over 0.90. In most cases, this can be accomplished by using power factor correcting capacitors or similar devices.
Of additional concern are the types and quality of relays for sensing and signaling abnormal conditions i n either the interconnect. the grid, or the
cogenerator and quickly signaling for disconnection. While some utilities will allow a less-expensive industrial grade relay for this function, most utilities prefer utility
91
grade relays which will quickly signal for disconnection (Reason 1984). The physical disconnection of the generator from the grid can be accomplished
using either a breaker or a contactor. Utilities prefer breakers over contactors
because they open faster (within 5 cycles versus 7 cycles), and they provide a
greater separation, thus decreasing the possibility of reverse current flow or arching (Ross and Walsh 1986). An example of a cogeneration interconnect with metering and protection systems for a 100 kW system is illustrated in Figure 8-19.
Vehicular Fu el I t is possible to utilize biogas for vehicular fuel (cars, trucks, tractors,
loaders, etc.), with the major components of a system consisting of gas cleanup,
compression, f i l l ing station, and vehicular storage and carburetion a s shown i n
Figure 8-20. Accordingly, the critical factors which need to be evaluated for the
utilization of biogas as a vehicular fuel include: - A determination must be made on how much fuel biogas
can replace on a continuous basis. Because biogas typically must be used within a
day or two of generation, there must be a daily consumption pattern established for
a vehicular f leet to warrant the conversion of vehicles to biogas and the cost of compression, storage, and refilling systems. Seasonal variations in daily consumptive
patterns must be taken into account. Large packaged compressed natural gas
systems for vehicular fueling have minimum compression rates of 18 cfm @3600 psi
and require a daily consumption of gasoline of 100 gpd to be economically justified
(Meloy 1981).
Degree of Utlllzatlon .. .
Dualitv of Biocas. Biogas quality has a significant impact on the amount of gasoline and diesel fuel equivalents per cylinder of compressed gas. The bulky
nature of biogas versus gasoline and diesel creates some range problems due to fuel storage. Removal of CO, and other inert gases will increase the fuel equivalence
for a cylinder of gas. Because of the corrosive nature of H,S and water on
compression. storage, and fueling systems, the biogas would have to be relatively clean.
98
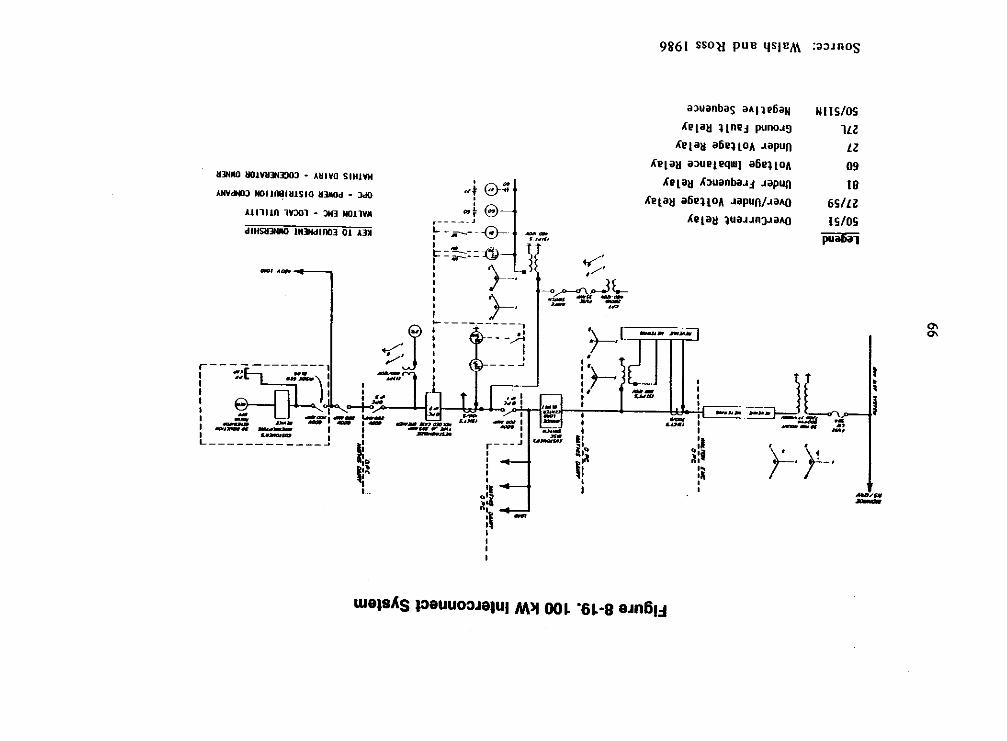
a QI
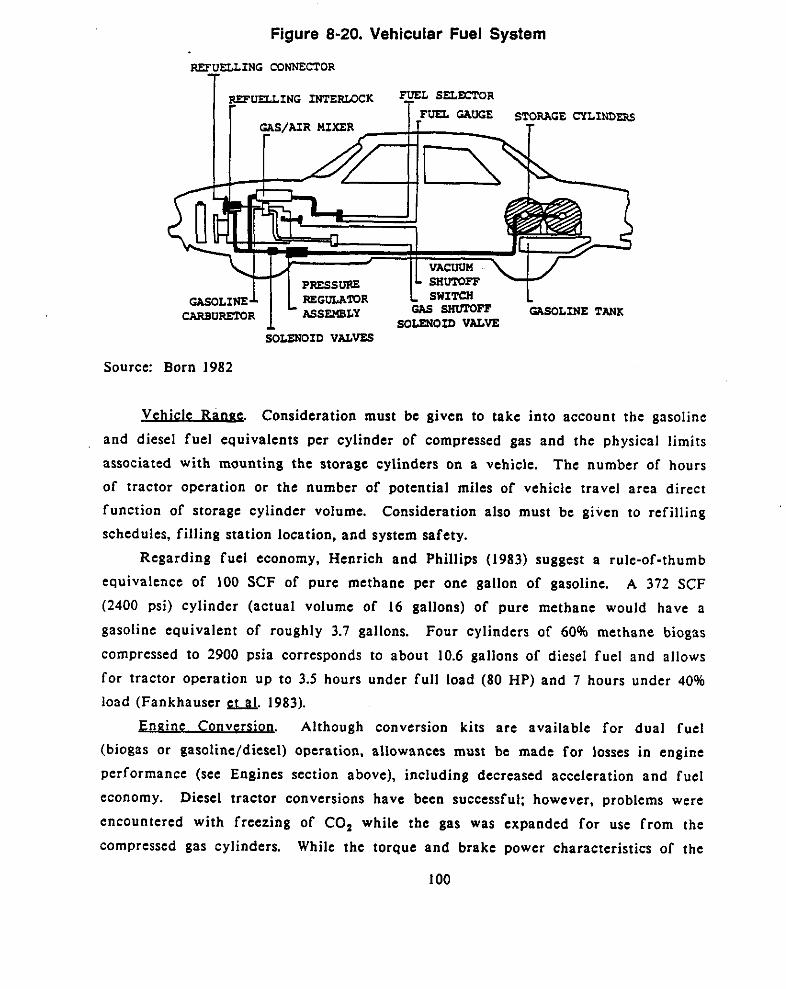
Figure 8-20. Vehicular Fuel System
R E F U E U I N G CONNECTOR
GAS smFF WLSOLINE TANK SOLENOID VAL- CARBURETOR
;OLENOID VALVES
Source: Born 1982
Vehicle . Consideration must be given to take into account the gasoline
and diesel fuel equivalents per cylinder of compressed gas and the physical limits associated with mounting the storage cylinders on a vehicle. The number of hours
of tractor operation or the number of potential miles of vehicle travel area direct function of storage cylinder volume. Consideration also must be given to refilling
schedules, filling station location, and system safety. Regarding fuel economy, Henrich and Phillips (1983) suggest a rule-of-thumb
equivalence of 100 SCF of pure methane per one gallon of gasoline. A 372 SCF
(2400 psi) cylinder (actual volume of 16 gallons) of pure methane would have a
gasoline equivalent of roughly 3.7 gallons. Four cylinders of 60% methane biogas
compressed to 2900 psia corresponds to about 10.6 gallons of diesel fuel and allows
for tractor operation up to 3.5 hours under full load (80 HP) and 7 hours under 40%
load (Fankhauser u. 1983).
Fnaine Con vers ion. Although conversion kits are available for dual fuel (biogas or gasoline/diesel) operation, allowances must be made for losses in engine
performance (see Engines section above), including decreased acceleration and fuel
economy. Diesel tractor conversions have been successful: however, problems were
encountered with freezing of CO, while the gas was expanded for use from the
compressed gas cylinders. While the torque and brake power characteristics of the
100
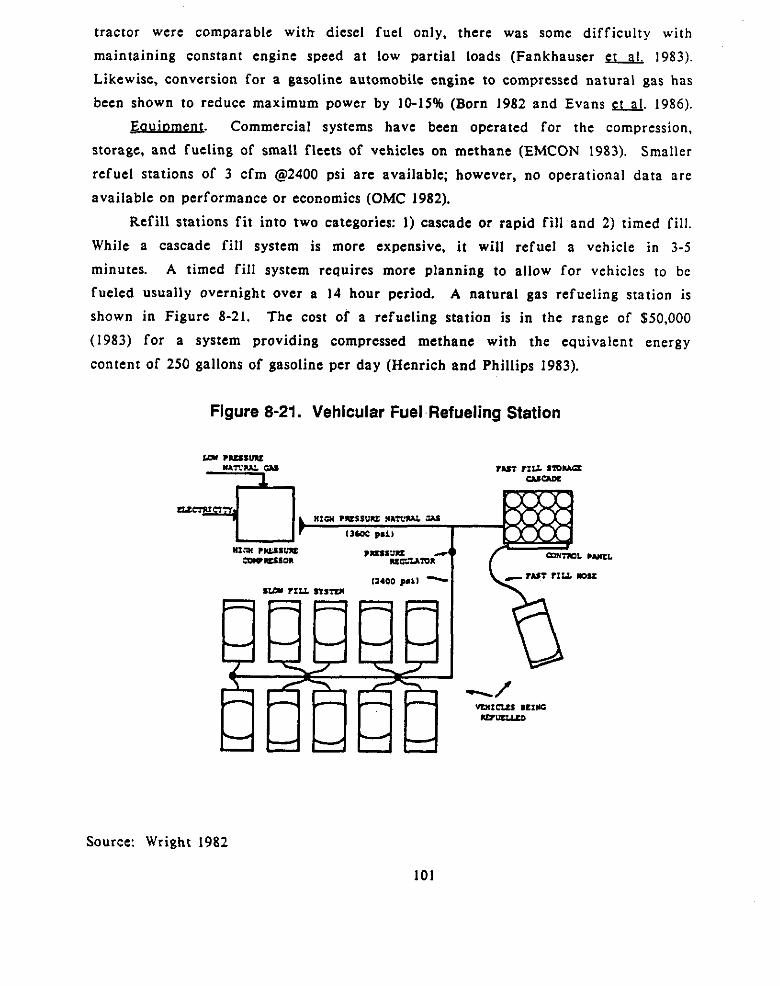
tractor were comparable with diesel fuel only, there was some difficulty with maintaining constant engine speed a t low partial loads (Fankhauser 1983). Likewise, conversion for a gasoline automobile engine to compressed natural gas has
been shown to reduce maximum power by 10-15% (Born 1982 and Evans u. 1986). Eauloment . Commercial systems have been operated for the compression,
storage, and fueling of small fleets of vehicles on methane (EMCON 1983). Smaller
refuel stations of 3 c fm @2400 psi are available; however, no operational data are
available on performance or economics (OMC 1982).
Refil l stations f i t into two categories: 1) cascade or rapid fill and 2) timed fill. While a cascade fi l l system is more expensive, i t will refuel a vehicle in 3-5
minutes. A timed fi l l system requires more planning to allow for vehicles to be fueled usually overnight over a 14 hour period. A natural gas refueling station is shown in Figure 8-21. The cost of a refueling station is in the range of $50,000
(1983) for a system providing compressed methane with the equivalent energy
content of 250 gallons of gasoline per day (Henrich and Phillips 1983).
Figure 8-21. Vehicular Fuel Refueling Station
Source: Wright 1982
101
Vehicle storage requires the use of Department of Transportation approved g3s
cylinders, most with a capacity of 372 SCF of gas a t 2400 psi and the dimensions of 9.25 inches in diameter and 55 inches in length (16 gallons). Tanks should include
pressure and heat fusible rupture discs for controlled gas release under stressed conditions.
Gasoline engine conversion kits for propane and compressed natural gas a re commercially available from a number of domestic and foreign suppliers (EMCON 1983). Some systems allow for dual fueling by mounting the fuel gas carburetor
between the existing carburetor and the intake manifold. These can be switched
between gasoline and biogas by flipping a switch inside the vehicle. The cost of converting a car or truck to compressed methane averages $1,500 per installation
including labor (Henrich and Phillips 1983 and A d a m 1986). As previously discussed, diesel engine conversion involves a more radical
modification which allows for simultaneous injection of some diesel fuel (pilot fuel)
to aid in ignition of the biogas which is introduced with the intake air to the
engine. There are no known commercial systems for diesel conversion to biogas for
vehicular use.
problem& A number of problems have surfaced in the conversion of a fleet of gasoline vehicles to methane (EMCON 1983); including:
o loss of power (10-20%), o o gas leaks a t filling stations, vehicle storage tanks,
difficulty in starting, particularly in cold weather,
and carburetors,
corrosion of equipment from biogas,
r e fue l ing scheduling and capacity, and
o o limited range,
o o driver dissatisfaction.
102
Pioeline Oual i tv Gas To maintain the high heating value and purity standards for pipeline quality
gas, biogas must be treated to meet the following standards (Cairns and Pincince 1984):
o o o carbon dioxide and nitrogen levels sufficiently low
(3% or less) to provide gas energy contents of 975
Btu/SCF or greater.
water levels less than 7 Ibs/MMSCF (0.1 1 mg/L), hydrogen sulfide levels less than 2.7 ppm, and
These gases, particularly landfill gases, may also contain other trace elements
that a r e not acceptable to the local natural gas utility for purchase (GRI 1-982). A
number of gas treatment methods for the removal of these components are detailed
in Chapter 5. Besides gas quality, other considerations for resale of pipeline Quality
biogas include meeting pipeline pressures and maintaining flowrates to the purchaser.
Environmental Considerations All methods of biogas utilization should be evaluated for environmental impact
on the site surroundings. Most of these considerations are associated with the
technology rather than the fuel and are regulated by existing state and federal
statutes. These include the emission of nitrogen oxides and smoke particulates from
combustion systems. Noise pollution from the operation of engines and compressors may also require site-specific modifications.
Fuel specific environmental concerns may include the proper handling and
disposal of chemicals and compounds used for biogas clean-up. Handling of common materials such as anti-freeze solutions and engine oils should also receive special
attention.
Any biogas utilization system should be reviewed early in the planning stager for environmental compliance with the appropriate state agencies.
I03

CHAPTER 9 INSTRUMENTATION AND CONTROLS FOR BIOGAS EQUIPMENT
Introduction There a re a number of measurements that are desirable for designing,
monitoring, and controlling both the anaerobic processes which produce biogas and the systems which recover the energy from the biogas. T h e equipment required will
vary depending on the source of the biogas (digester versus landfill) as well as the
complexity of the utilization system. Some of these measurements are performed continuously, but some portable and laboratory equipment is essential. There is a
wide variety of equipment available off-the-shelf which can be used to measure all
parameters of interest for gas production and quality. The operation and
maintenance costs of such equipment can be high due to the corrosive nature of the
gases. A list of suggested equipment and processes for almost every measurement derived during anaerobic digestion is provided in the U. S. Environmental Protection
Agency Process Design Manual (USEPA 1979~). Price (1981) and EMCON (1980)
have also reviewed basic measurement processes, and the Sierra Monitor Corporation summarizes guidelines of proper gas monitoring management for wastewater systems.
Based on these reviews and practical experiences, this chapter provides an overview
of equipment and strategies needed for proper biogas monitoring and control.
Gas COIllDOS ition Gas composition (%CH,, %CO,, %N,, %O,, %H,S) is a useful parameter for
energy and mass calculations and for monitoring the relative health of the anaerobic
process. Data on composition is needed for design of clean-up equipment, burners,
and engine modifications such as compression ratio and spark advance. Variations in gas composition can indicate problems in digester operation or depletion of gas
being produced by a landfill. Natural gas distributors purchasing pipeline quali ty biogas may require periodic or continuous measurements of gas composition.
Composition can be measured with simple, hand-held instruments or complex
continuous monitoring equipment. The more common instruments used for determination of biogas composition are briefly described in the following sections.
P i f fus io n Tub€ . Chemical sensing diffusion tubes are hand-held instruments that determine biogas composition by measuring the chemical reaction of a single
constituent in the gas with material in the tube. These devices can be used to
10s
measure most all of the constituents of biogas including water vapor, but different tubes must be used for each constituent. In addition, the tubes are designed for a
specific concentration range, and thus, the appropriate tube must be used to measure a specific range of concentration. The expendable tubes are packed with a
material that changes color when exposed to a specific gas. Gas is pulled through
the tube by a bellows or pump which determines the quantity of the gas sample. As the gas is pulled through the tube, the constituent being measured reacts with the material in the tube and causes the material to change color. The exterior of
the tube is calibrated such that the point a t which the color change stops determines the quantity of a particular constituent in the gas. These devices are
manufactured by a number of companies.
-1 AbsorDtion . Chemical absorption analyzers such as the one
manufactured by Bacharach Instruments are hand-held devices and are typically
used to determine the concentration of CO, and 0, in boiler exhaust. These
devices can be used to determine the approximate composition of biogas by
determining the concentration of CO, and 0, in the biogas and assuming the
balance of the gas is CH,. A separate tester is used for CO, and for 0,. A quantity of gas is pulled into the analyzer with a hand pump and the f luid
in the analyzer absorbs a portion of the gas constituent being analyzed. The
absorption of a portion of the gas causes the pressure inside the analyzer to fa l l below atmospheric. The atmospheric pressure on the outside of the analyzer pushes
on a rubber diaphragm in the analyzer wall and causes the f luid level in the
analyzer to rise. The height of the fluid rise determines the concentration of the
specific constituent in the biogas.
GasChromatonraDh. The best equipment for measuring gas composition is an on-line chromatograph. This instrument contains a packed column (tubing filled
with absorbent material) which serves to separate the different components of the gas on the basis of molar weight and other molecular properties. The individual
components of the exiting gas are measured by a detector (preferably a thermal-
conductivity detector since flame ionization detectors are not useful for measuring
carbon dioxide). T h e output f rom the detector is plotted as a function of time, and component concentrations are calculated from the areas under each output peak.
MassSDccrrometcr. Another instrument capable of on-line gas composition analysis is the mass spectrometer. The principal of operation is similar to that of the gas chromatograph except that detection of the constituents separated by
106
molecular weight differences is accomplished by electronic detection.
instrument is prohibitively expensive fo r most applications.
However, this
Gas Caloric Value The caloric value of the gas is the most important parameter as i t indicates
the heat value of the gas. The caloric value must be determined to compute the Wobbe Index for a specific burner orifice (See Chapter 8). This value can be used to directly control any blending operations, or to control variable burner orifices to
ensure a constant heat input to the process. The caloric value is typically
computed from the percentages of combustibles in the biogas, but equipment can be used to determine this parameter.
Continuous Record ine Calorrmeter . In order to determine the caloric value of biogas, a gas sample of known volume is burned under strictly controlled conditions
i n a calorimeter, where heat developed by combustion is measured (ASTM D-1826).
Accuracies of 21.5% of full scale can be expected; however, the response of the
calorimeter is slow.
Gas Density Measurement of gas density alone is made infrequently, since this parameter
can often be computed from data from other analyses such as gas chromatography.
The density of the gas is also needed to compute the Wobbe Index for a specific
burner.
The density of the gas can be determined by the use of a balance detector cell which is the pneumatic analog of a Wheatstone bridge. In this
method, a reference gas and the sample gas a re passed through the cell. The temperature differential created is measured with thermocouples in the device, and
related to the difference in the density of the reference gas and the unknown
density. Because the process has a complex purging system, analysis of wet o r
dirty biogas or biogas from long sample lines may be difficult.
BELLgnce Detector.
Gas Flow One of the more basic biogas instrumentation requirements is that of gas flow.
Gas production from a digester is a n indication of performance and is directly
related to the general "health" of the anaerobic system. Biogas being blended with an auxiliary fuel must be controlled and thus the flow rate must be known. The total quantity of biogas supplied to a natural gas pipeline must be recorded to
107
establish the basis for payment for the fuel. There are a number of methods available to measure gas flow which are briefly described in the following sections:
Rotat ine Vane Meter . The most common method of measuring gas flow is by the use of a rotating vane gas meter such as those used on natural gas wells. The
gas flowing through the meter causes internal vanes to rotate which in turn move the dials on the front of the meter. These meters are typically totalizing types
that indicate the total quantity of gas produced, but can be modified to read rate if needed. Electronic pick-offs can be added for automatic recording of data.
Maintenance of rotating meters in biogas systems can be a problem due to
corrosives in the biogas. Care must be taken to insure tha t the lubricating oils for
the meter do not become contaminated, and that the oil is changed on a periodic
basis. These meters should be removed and cleaned if the system is not operated
for an extended period of time. Differential PressurG . Another common method for determination of biogas
flow is detecting the differential pressure across a fixed (normally concentric) orifice or venturi which is installed between flanges in the gas piping. T h e flow
rate is calculated from the differential pressure using a discharge factor for the
measuring device. Measurements made a t approximately 100 in. of water column
differential pressure ar t the most accurate. This high pressure occurs if the gas is
being pumped from the digester. When the digester pressure governs flow, differential pressures of approximately 1 in. water column are used, making the measurement more diff icul t and less accurate.
Pitot Tubc. The pitot tube used in conjunction with a manometer or a
Magnehelic gauge, is the most common method of measuring velocity. Accuracies of +15% may be achieved with the pitot tube. A pitot tube is a probe with a 90° bend
a t the end which is inserted into the gas stream such that the open end a t the t ip
of the bend faces directly into the gas flow. The dynamic pressure measured with the probe and the static head measured at the wall of the gas pipe are used in
Bernouli’s equation to determine gas velocity. Flow rates can be determined by
utilizing the continuity equation which states that the flow rate equals the average
gas velocity times the area normal to the flow. However, when these devices are subjected to a very wet, corrosive gas, maintenance requirements can be very high.
This fact also makes device material selection very important.
A thermal mass flow meter measures the flow rate
by determination of the cooling rate of the fluid passing the heated probe. Another
Thermal Mass Flo w Meter .
108
type of device heats a portion of the gas stream and correlates mass flow to the rate of heat transfer to the gas. Both designs must be calibrated for the thermal properties of the specific gas being measured.
Selection of materials for biogas flow measurement equipment is critical since parts of the equipment will be exposed to the gas stream (See Chapter 4).
Hydrogen sulfide and other corrosives (particularly those found in biogas from
landfills) can cause corrosion problems. Flow monitoring equipment must be accurately calibrated before operation and
at periodic intervals af ter the start of operation. Erosion of surfaces or plugging
by contaminants can cause changes in output. Calibration curves must be corrected for differences in the density of a i r and biogas unless the equipment is calibrated using biogas or a synthetic biogas (CH,/CO, mixture).
Pressure Pressure can be used to control system operation such as the starting and
stopping of an engine or the power output of the engine. I t is also an indicator of the health of the digester or landfill i n that low pressure can be used to indicate a lack of biogas production. On high pressure systems which use a compressor,
pressure data can be used to control compressor operation and indicate its
performance. The type of instrumentation required depends on the operating
pressure of the system. Low Pressure S v y u ~ s . Low pressure systems which operate a t a maximum of
approximately 1 psig (27.7 inches water column) typically use manometers for
pressure measurement. A manometer indicates pressure in inches of water column (in. w.c.) by the difference in level of the water in a "U" shaped tube with one end
connected to the system and the other end open to atmosphere. Gauges are also
available for reading pressure in inches water column. The gauges can be combined
with electrical contacts for the starting and stopping of equipment. The simplest pressure measurement device is the inclined manometer. The Dwyer Magnehelic
differential pressure gauge is an alternative to the manometer. These gauges are accurate to +2% of scale (EMCON 1980), but need to be calibrated prior to each use.
Hieh Pressure S v s t a . Standard pressure gauges are used for high pressure systems. Materials selection is not as critical with these components since H,S and other corrosives are usually removed before compression.
IO9
Ambient ExDosure Potential Biogas presents a number of toxicity and explosive hazards due to CH,, H,S,
and other constituents. The details of these hazards are discussed in Chapter 10.
Gas concentrations which present a hazard to personnel can be detected through the use of a diffusio n tube and by obtaining a gas sample and analyzing the sample with
a gas chr- r or mass s o e m r. There a re several devices available to
actively monitor for biogas in areas where gas buildup could occur. Combustible Gas Sensou. These devices are remote catalytic type sensors
which consist of a heated catalytic element which is exposed to the ambient a i r ,
and a similar inert reference element. A collar protects the reference element from the ambient conditions. When the element is exposed to a flammable gas its
temperature rises above that of the reference element and the differential is sensed.
The rise in temperature of the element is attributed to the catalytic oxidation of
the gas by the element which produces heat. A flame arrester will provide
operating safety with fast sample diffusion.
p e t a l Oxide w u c t o r (MOS]. These hydrogen sensitive electronic sensors can be used for the detection of various hydrogen based gases including CH,, H,,
and H,S. The sensor works on the principle of ionadsorption whereby
oxidation/reduction reactions a t the sensor surface change the conductive properties
bf the material. This effect can then be measured as a change in the resistance
correlated to a gas concentration. Combustible gas sensors utilize this technology; however, they are often prone
to dr i f t and must be calibrated frequently. While some sensors are designed to
monitor only a particular gas, they tend to indicate the cumulative presence of all
hydrogen containing gases.
E lec t rochemid . This series of sensors incorporate the use of ion selective
membranes and/or electrolytes to selectively sense a single gas component. They
work on the principle of ion transport across a membrane filter to react with an
electrolyte. The change in the electropotential between the measuring cell and a reference cell is correlated to the gas concentration.
These sensors have been used for monitoring a variety of gases including H,,
CO, CO,, and H,S. Like MOS sensors, they require frequent calibration and
maintenance.
CHAPTER 10 BIOGAS SAFETY CONSIDERATIONS
lntroductio n This chapter discusses the major safety aspects of biogas installations. There
are three major dangers to property and personnel that must be considered: toxicological dangers due to poisonous and asphyxiating gases, f i re and explosion
dangers due to combustible gases, and physical dangers due to operation of the system a t both positive and negative pressures. The specifics of each of these three dangers will be presented first. Recommendations for prevention of accidents
will be discussed later since accident prevention techniques often apply to more
than one danger.
Toxicoloaical Danaera The toxicological dangers of biogas are essentially a combination of the
individual component gases: methane, carbon dioxide, hydrogen sulfide, and methyl
mercaptan. A summary of these characteristics are presented in Table 10-1. Data
on the color and odor characteristics which could be used to identify the presence
of the gases a r e presented in the table. The minimum identifiable odor (MIO) listed is the concentration level in parts per million a t which the gas can be detected.
The Threshold Limit Values (TLV’s) for various industrial hazardous chemicals
are established by the American Conference of Governmental Industrial Hygienists in Cincinnati, Ohio. The definitions of the two values shown in the Table 10-1 a re as
follows:
Value - T ime Weiehted A veraee (TL V-TWA), is the time- D r e s h o l d Limit
weighted average concentration for a normal 8-hour workday and 40-hour workweek, to which nearly all workers may be repeatedly exposed, day af ter
day, without adverse effect.
Threshold L imit Value - Sho rt Term Exoosure Limi t ITL V-STEU is the 15 minute time weighted average exposure which should not be exceeded a t any
time during a work day even if the eight-hour time weighted average is within the TLV.
The table also indicates the major physiological effects of each of the gases
It can be concluded from the table that biogas should be
. .
. .
which compose biogas. considered a poisonous gas since it contains more than 10 ppm of hydrogen sulfide.
1 1 1
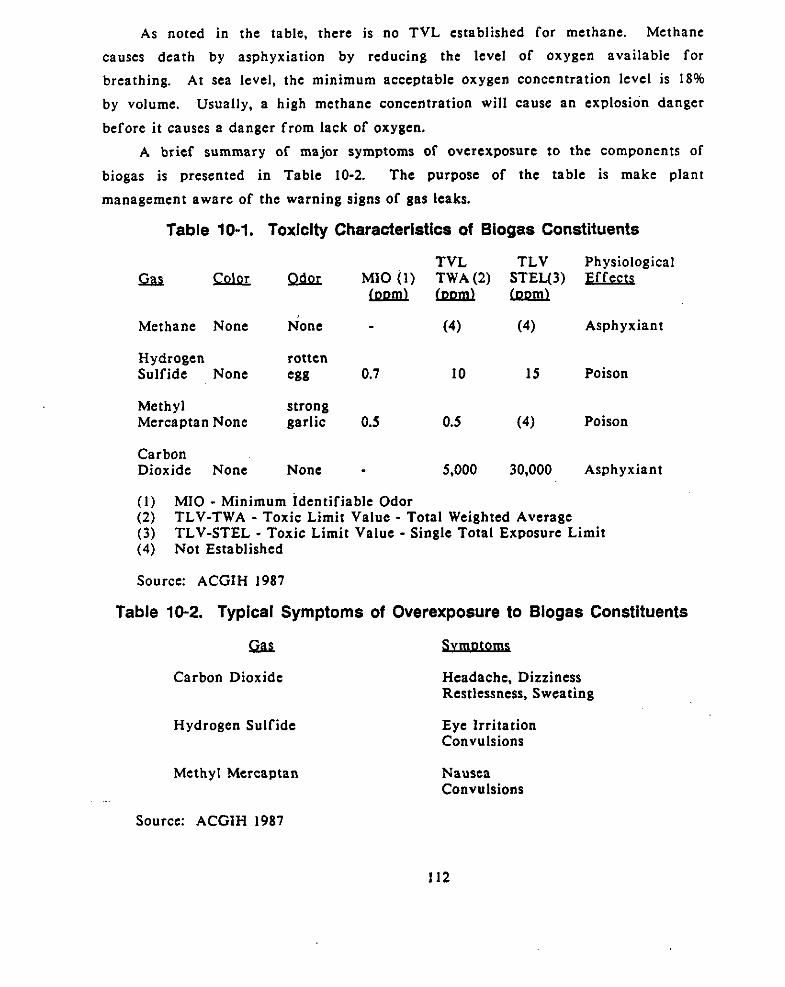
As noted in the table, there is no TVL established for methane. Methane
causes death by asphyxiation by reducing the level of oxygen available for breathing. At sea level, the minimum acceptable oxygen concentration level is 18%
by volume. Usually, a high methane concentration will cause an explosion danger
before i t causes a danger from lack of oxygen. A brief summary of major symptoms of overexposure to the components of
biogas is presented in Table 10-2. The purpose of the table is make plant
management aware of the warning signs of gas leaks.
Table 10-1. Toxicity Characteristics of Biogas Constituents
W a e P E M I 0 (1) TWA(2) STEL(3) F f f e c Q TVL TLV Physiological
lnnmllnnmllnenl Methane None None - (4) (4) Asphyxiant
Hydrogen rotten Sulfide None egg 0.7 10 I5 Poison
Methyl strong Mercaptan None garlic 0.5 0.5 (4) Poison
Carbon Dioxide None None 5,000 30,000 Asphyxiant
(1) (2) (3) (4) Not Established
Source: ACGIH 1987
M I 0 - Minimum Identifiable Odor TLV-TWA - Toxic Limit Value - Total Weighted Average TLV-STEL - Toxic Limit Value - Single Total Exposure Limit
Table 10-2. Typical Symptoms of Overexposure to Biogas Constituents
!a Svmotoms
Carbon Dioxide
Hydrogen Sulfide
Methyl Mercaptan
Headache. Dizziness Restlessness, Sweating
Eye Irritation Convulsions
Nausea Convulsions
Source: ACGIH 1987
112
ANY PERSONNEL WHO EXHIBIT ANY OF THE SY MPTOMS LISTED
SHOULD BE CHECKED FOR ANY LEAKS. SHOULD BE C HECKED BY MEDICAL PE RSONNEl AND THE SYSTEM
Flammabllltv Danaers The flammability characteristics of the components of biogas are presented in
Table 10-3. Carbon dioxide is not combustible and thus the only characteristic
applicable to this gas is specific gravity. The significance of each of the
characteristics provided is as follows: Vaoor Density. The vapor density is the ratio of the density of the gas to
the density of a i r a t the same temperature and pressure. As shown in Table 10-3 methane is lighter than air and will tend to collect near the ceiling of an enclosed
building. Therefore, i t is important to adequately vent a building containing biogas
equipment. The other gases are heavier than a i r and would tend to collect in any sumps or low areas near the biogas system.
Lower . The lower explosive or flammability limit is the
minimum concentration of a combustible gas in air which sustains combustion. If
the concentration of the gas is below this level, combustion will not be sustained since there is insufficient fuel to maintain burning.
UDDW ExDlosi ve L i m i t The upper explosive or flammability limit is the maximum concentration of a combustible gas which sustains combustion. If the
concentration of the gas is above this level, combustion will not be sustained since there is insufficient a i r to maintain burning.
Autolanit . . . ion T e m D m . The autoignition temperature is the temperature at
which combustion will be initiated without the addition of source of ignition such as
a spark. The concentration of the combustible must be within the flammability range.
113
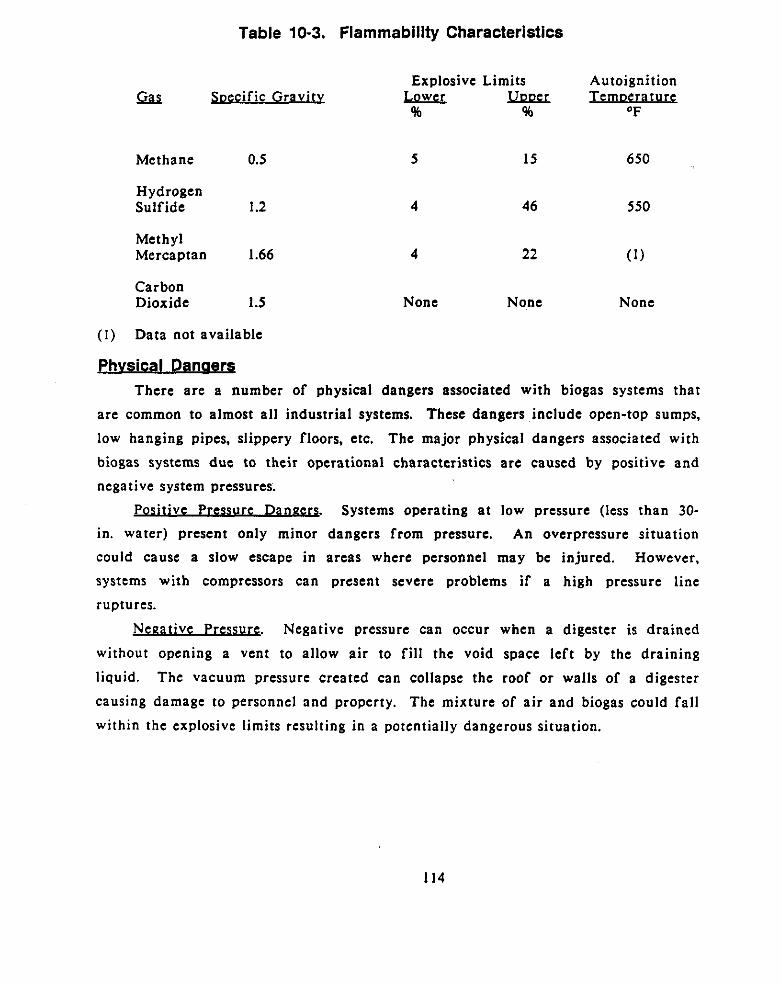
Table 10-3. Flammability Characteristics
Explosive Limits Autoignition m Soccific Gravity Lowcr ynnrr Tcmoeratu re % % O F
Methane 0.5 5 15 650
Hydrogen Sulfide 1.2
Methyl Mercaptan 1.66
Carbon Dioxide 1.5
4 46 550
4 22
None None None
( I ) Data not available
Phvsical Da naerg There a re a number of physical dangers associated with biogas systems that
are common to almost all industrial systems. These dangers include open-top sumps,
low hanging pipes, slippery floors, etc. The major physical dangers associated with
biogas systems due to their operational characteristics a re caused by positive and negative system pressures.
Positive Pressure D a n m . Systems operating a t low pressure (less than 30- in. water) present only minor dangers from pressure. An overpressure situation could cause a slow escape in areas where personnel may be injured. However,
systems with compressors can present severe problems if a high pressure line ruptures.
Neeative Pressurc . Negative pressure can occur when a digester is drained
without opening a vent to allow air to fi l l the void space left by the draining
liquid. The vacuum pressure created can collapse the roof or walls of a digester
causing damage to personnel and property. The mixture of air and biogas could fal l
within the explosive limits resulting in a potentially dangerous situation.
114
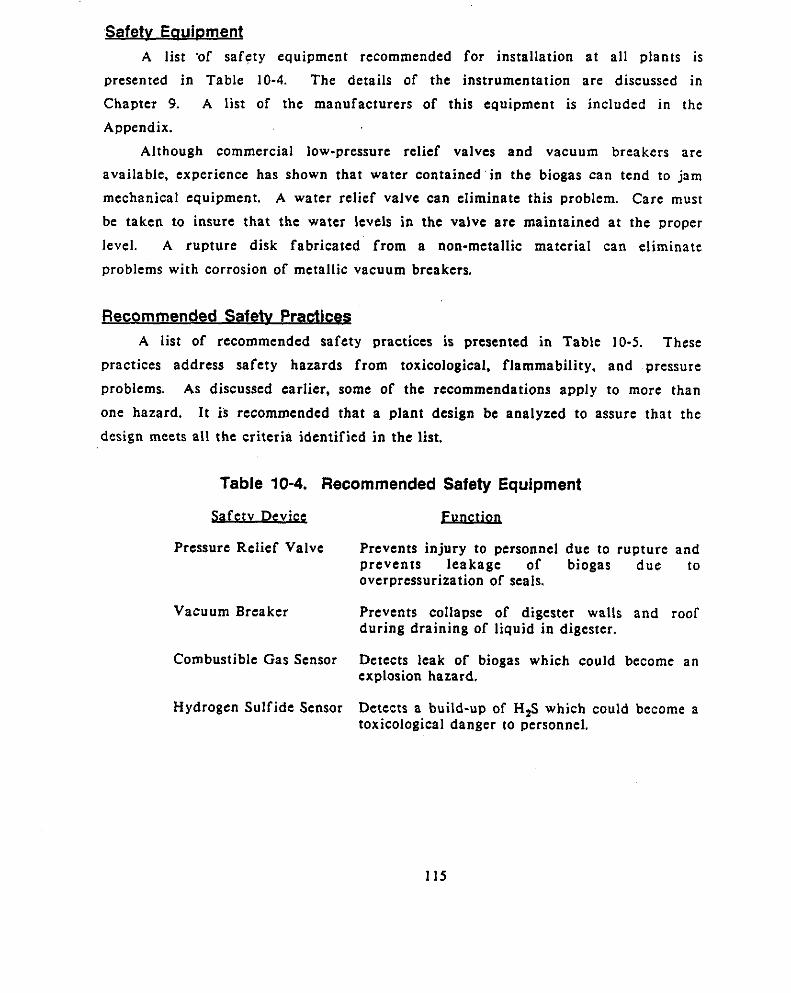
Safetv Eauiament A list .of safety equipment recommended for installation a t all plants is
presented in Table 10-4. The details of the instrumentation are discussed in
Chapter 9. A list of the manufacturers of this equipment is included in the
Appendix. Although commercial low-pressure relief valves and vacuum breakers are
available, experience has shown that water contained in the biogas can tend to jam
mechanical equipment. A water relief valve can eliminate this problem. Care must
be taken to insure that the water levels in the valve are maintained a t the proper
level. A rupture disk fabricated from a nonmetall ic material can eliminate
problems with corrosion of metallic vacuum breakers.
Recommended Sa fetv PracticQ A list of recommended safety practices is presented in Table 10-5. These
practices address safety hazards from toxicological. flammability, and pressure
problems. As discussed earlier, some of the recommendations apply to more than
one hazard. I t is recommended that a plant design be analyzed to assure that the
design meets all the criteria identified in the list.
Table 10-4. Recommended Safety Equipment
Safetv De vicc Function
Pressure Relief Valve Prevents injury to personnel due to rupture and prevents leakage of biogas d u e to overpressurization of seals.
Vacuum Breaker Prevents collapse of digester walls and roof during draining of liquid in digester.
Detects leak of biogas which could become an explosion hazard.
Hydrogen Sulfide Sensor Detects a build-up of H,S which could become a toxicological danger to personnel.
Combustible Gas Sensor
115
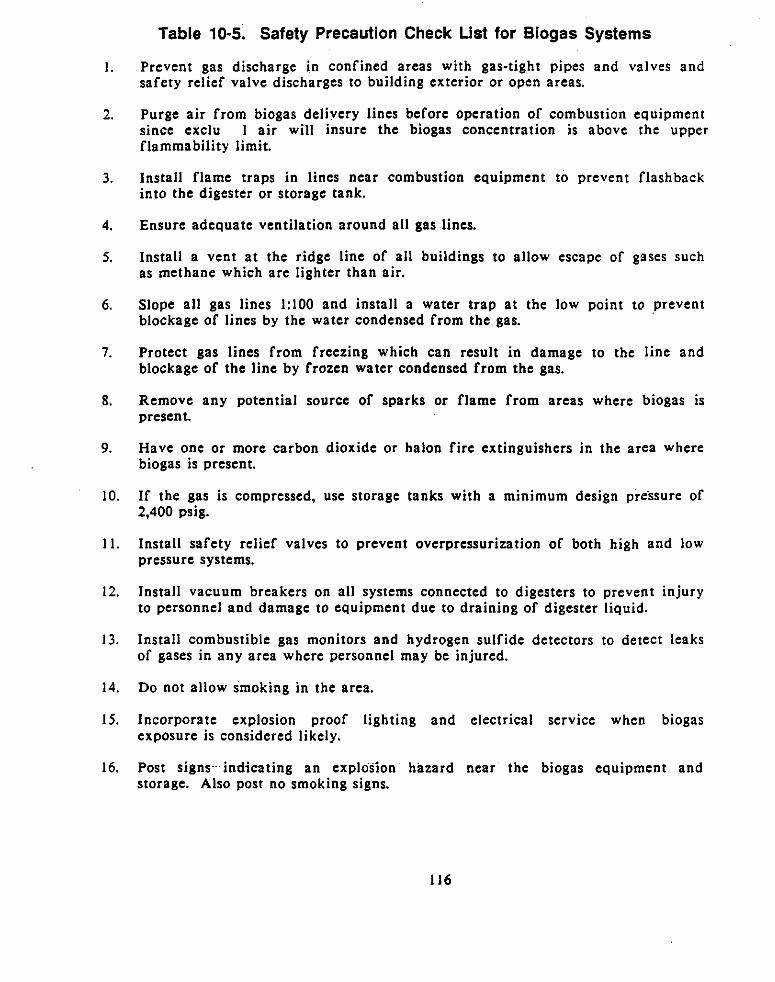
Table 10-5. Safety Precaution Check List for Biogas Systems
Prevent gas discharge in confined areas with gas-tight pipes and valves and safety relief valve discharges to building exterior or open areas.
Purge air f rom biogas delivery lines before operation of combustion equipment since exclu 1 air will insure the biogas concentration is above the upper flammability limit.
Install flame traps in lines near combustion equipment to prevent flashback into the digester or storage tank.
Ensure adequate ventilation around all gas lines.
Install a vent a t the ridge line of all buildings to allow escape of gases such as methane which are lighter than air.
Slope all gas lines 1:lOO and install a water t rap a t the low point to prevent blockage of lines by the water condensed from the gas.
Protect gas lines from freezing which can result in damage to the line and blockage of the line by frozen water condensed from the gas.
Remove any potential source of sparks or flame from areas where biogas is present.
Have one or more carbon dioxide or halon f i re extinguishers in the area where biogas is present.
If the gas is compressed, use storage tanks with a minimum design pressure of 2,400 psig.
Install safety relief valves to prevent overpressurization of both high and low pressure systems.
Install vacuum breakers on all systems connected to digesters to prevent injury to personnel and damage to equipment due to draining of digester liquid.
Install combustible gas monitors and hydrogen sulfide detectors to detect leaks of gases in any area where personnel may be injured.
Do not allow smoking in the area.
Incorporate explosion proof lighting and electrical service when biogas exposure is considered likely.
Post signs indicating an explosion hazard near the biogas equipment and storage. Also post no smoking signs.
1.
2.
3.
4.
5.
6.
7.
8.
9.
10.
11.
12.
13.
14.
15.
16.
116
REFERENCES
AC Compressor Corporation Literature, RO Flow Sewage Gas Compressor, No. CCB0032, West Allis, WI, 1986.
Adams, T. G., "Ford's Experience with Dedicated Compressed Natural Gas Powered Vehicles," In: Gaseous Fuels for Transnprtation I Vancouver, BC, Canada, pp. 759- 770, 1986.
ACGIH, American Conference of Governmental Industrial Hygienists, "Threshold Limit Values and Biological Exposure Indices for 1987-1988," Cincinnati, OH, 1987.
Ashare. E., "Analysis of Systems for Purification of Fuel Gas," In: Fuel Gas Production From Biomass. Volume 2, CRC Press, Inc., Boca Raton. FL, 1981.
ASTM D-1826, "Standard Test Method for Caloric Value of Gases in Natural Gas Range by Continuous Recording Calorimeter," American Society for Testing and Materials, 1916 Race Street, Philadelphia, PA 19103, 1983.
Barnes, J. D., "Small Scale Landfill Gas Electric Generating System," In: Proceedings of the GRCDA Sixth International Landfill Symposium, Industry, CA, March, 1983.
Berdoll. D. and D. Raley, "Del Valle Hog Farm: Energy Integrated Farm System Phase 111: Demonstration," US. Dept. of Energy, DE-AC07-84ID12493, August, 1985.
Born, G. J., "The Natural Gas Fueled Engine," In: &thane : Fuel for the Future, Plenum Press, NY, 1982.
Boyer, R. L.. "Status of Dual Fuel Engine Development," In: Proceedings of the SAE Annual Meeting, Detroit, MI, January, 1949.
Bro, K. and P. S. Pedersen, "Alternate Diesel Engine Fuels: An Experimental Investigation of Methanol, Ethanol, Methane, and Ammonia in a D.I. Diesel Engine with Pilot Injection," Society of Automotive Engineers Paper 170194, 1977.
Busenthur, H. B., "Facts Concerning the Utilization of Gaseous Fuels in Heavy Duty Vehicles," In: -eo us Fue Is for Transnortat ' ion I. Vancouver. BC. Canada, pp. 813- 849, 1986.
Buvet, R., M F. Fox, and D. J. Picken, "Biomethane: Wheatland Ltd., 1980.
Cairns, C. A. and A. B. Pincince, "Sale of Surplus Digester and Landfill Gas to Public Utilities," EPA-600/S2-84-039, 1980.
Cairns. C. A. and A. B. Pincince, A. B., "Sale of Surplus Digester Gas to Public Utilities," U.S. En\lLonracntal-Protootion.Agcncy Report NO. -PB-84-155 555, 1984.
Caterpillar Tractor Co., "Handbook on Diesel and Gas Engines in Sewage Plants." 1972.
Production and Uses," Turret-
117
Clark, S. J., M. Goodman, and M. D. Schrock.,"Biomass Gas Fueling of Spark Ignition Engines," In: Atlanta, GA, April 23-25, 1985.
Pro ceedinns of Fifth Annual Solar and Biomass-Enernv Woikshop,
Clark, S. J. and J. Marr, "Digester Gas Fueling of Engines." In: Proceed inas of Fif th Annual Solar and B' lomass Enernv Workshoa April 23-25, 1985.
Cogeneration and Small Power Monthly, Jhe Industr ial Coneneration Man ual, 1983.
Combes, R. S., u., "Energy Integrated Dairy Farm: Second Quarterly Report," U.S. Dept. of Energy, DE-FC-01-8OCS-40379. Georgia Institute of Technology, Atlanta, GA, May, 1981.
Conrad, L.G. and R. Rothfuss., "Ten Years of Landfil l Gas Collection: System Operation and Maintenance," In: Proceed ines of the G RCDA N inth International Landfil l Gas Svmo a Newport Beach, CA, March, 1986.
Coward, A. F. and G. W. Jones, m s of Flammab ilrtv of Gas es and Vaoorc, U. S. Bureau of Mines Bulletin No. 503, 1952.
Cummins Gas Engines. Inc., "Sour Gas Application," Application Bulletin AB-2-85, El Paso, TX, 1985.
Cummins R io Grande, "Packaged Gas-Fired Cogeneration Systems," Albuquerque, NM, 1982.
Demuynck, M and E. J. Nyns, m a s P lants in Eurooe : A Practical Handbook, Series E, Volume 6, D. Reidel Publishing Co., 1984.
De Renzo, E. and J. Dorothy, Enernv from B ioconversion of Waste Mat erialc, Noyes Data Corporation, Park Ridge, NJ, 1977.
Derus, H. M, "Landfill Gas: Internal Combustion Engine Generating Systems," In: P I T ' I1 , Industry, CA, 1983.
Duckworth, G. L., and J. H. Geddes, "Natural Gas Desulfurized by the Iron Sponge Process," The Oil and Gas J o u r a September 13, 1965.
Egger, K., u., "Purification of Biogas." Biogas Project, Swiss Federal Research for Farm Management and Agricultural Engineering, CH-8355 Taenikon, Third International Conference on Biomass, Venice, Italy, 1983.
Energy Research and Applications, Inc., "Biogas Electric Power Cogeneration: or Greater," Tennessee Valley Authority, Solar Applications Branch, 1981a.
Energy Research .and..Applica-tions, Inc.. "Small Scale Biogas Applications," Tennessee Valley Authority, Solar Applications Branch, 1981b.
ESCAP (Economic and Social Commission for Asia and the Pacific), Guidebook o n s De vel- Energy Resources Development Series. No. 21, United Nations,
New York, NY, 1980.
. .
25kW
118
EMCON Associates, Feas ibilitv St udv: Utilization of Landfil l Gas for a Vehicle Fuel Svstem: Rossma n's Land fill. Clac kamas Countv. O r e m U.S. Department of Energy, Contract No. DE-FGOI-80RA50366, Washington, DC, 1983.
EMCON Associates, Meth ane Gene ration and Reco verv from Landf ills, Ann Arbor Science Pub., Inc., 1980.
Evans, u., "A Comparison of Natural Gas and Gasoline in a Spark-Ignition Engine," Gaseous Fuels for Tra- Vancouver, BC, Canada. pp. 713-726. 1986.
Fannin, K. F., u., "Anaerobic Processes," Water Pollution Control Federation, Vol. 54, No. 6, June, 1982.
Fankhauscr, J., u., "Biogas as a Fuel: The Adaptation of a Tractor Diesel Engine and a Small Spark Ignition Engine to Biogas Operation," Swiss Federal Research Station for Farm Management and Agriculture Engineering, pg 1136-1 140, 1983.
Gill, J., "The Performance and Behavior of Caterpillar Gas-Fueled Engines," Industrial Division Sales Training, Peoria, IL, 1971.
GRCDA, "Project Summaries - Online Landfil l G a s Recovery Facilities," In: ional Landfill Government Refuse Col lection and Dim- 6th Internat
Gas SvmDosiu& March 1983.
GRI (Gas Research Institute). "Landfill Methane Recovery, Part 11: Gas Characterization," Final Report by Escor. Inc., GRI 81/0105. December 1982.
. .
Halsam. R. T. and R. P. Russell., Fuels a nd Their Combu 'stion, First Edition, McGraw-Hill Inc., New York, NY, 1926.
Harper, S. R. and F. G. Pohland, "Design and Management Strategies for Minimizing Environmental Impact a t Municipal Solid Waste Landfill Sites," In: Proceedings of the 1 1 V ' t n in r i , Vancoiver, BC, Canada, July 1988, p. 669.
Heisler, M., "Biogas Filtration and Storage," In: Methan e Technolonv for Aariculture. Northeast Regional Agricultural Engineering Service, Ithaca, NY, 1981.
Henrich, R. A. and B. Ross., "Landfill and Digester Gas Purification by Water Extraction: A Case Study of Commercial System, Baltimore's Back River Wastewater Treatment Plant," Institute of Gas Technology, 1983.
Henrich, R. A., and C. Phillips., "Purification of Digester Gas into Saleable Natural Gas or Vehicle Fuel," In: Water Po Ilution Co ntrol Federation 5 gth A n n u a l
Hill, D. T.. "Methane Productivity of the Major Animal Waste Types," Journal Series NO. 2-83448, u t ' ions of the AS- 1984.
Hill, D. T.. "A Comprehensive Dynamic Model for Animal Waste Methanogenesis", Journal Series No. 2-810076. Transactions of the As& 1982.
October, 1983. . . - X D O W
I19

Hobson, P. N., S. Bousfield, and R. Summers, Methane Product ion from Aericultural
Applied Science Publishers LTD., London, 1981.
Jawurek. H. H., u., "Biogas/Petrol Dual Fueling of ST Engine for Rural Third World Use," Bjomass. 13 (1987), pp. 87-103.
Jones, D. D., u., and A. C. Dale, "Methane Generation From Livestock Wastes,'' Dept. of Agricultural Engineering, Purdue University, West Lafayette, IN, 1980.
Jones, V. W. and C. R. Perry, "Fundamentals of Gas Treating," Perry Gas Processors, 1976. Inc., Odessa, TX. From: G-
Jones, H. B. and E. A. Ogden. "Economics of Methane Generation From Livestock and Poultry Wastes in the South," Dept. of Agricultural Engineering, University of
and Domest ic Wastes, Microbiology Dept., Rowett Research Institute, Aberdeen, UK,
. . .
Georgia, Presented at: University of Florida, Gainsvillc, FL, March, 1985.
The Third Southern B i o m w Enerev Resea rch Conference,
Joseph Oat Corp., "Pilot Studies Highlight Versatility," In: No. 1, Joseph Oat Corporation, Camden. NJ, 08104.
Jewell, W. J., u.. Qgmgrat ion of Electr icitv and Heat f ro m B I ~ , Report for Science and Education Administration, U. S. Dept. of Energy, Solar Energy Research Institute, NY State College of Agriculture and Life Sciences, 1986.
Karim, G. A. and I. Wierzba, "The Ignition Limits in a Spark-Ignition Engine Fueled with Methane," Gaseous Fuels for Transoortation L Vancouver, BC, Canada, pp.691- 700, 1986.
Karim, G. A., "Methane and Diesel Engines," In: -ne : Fuel for the Future, Plenum Press, New York, NY, pp. 113-129, 1982.
Kayhanian, R. K. and D. J. Hills, "Membrane Purification of Anaerobic Digester Gas," In: BielQgical W u 23rd Volume (I ) , pp. 1-16, 1988.
Knight, D. K. and M D. Clement, "Project Update on Biogas Utilization at Dal-Ge Poultry Farm, Inc.," Sixth Annual Solar and Biomass Workshop , pp. 150-155, Atlanta, GA, 1986.
Koelsch, R. K., u., "Cogeneration of Electricity and Heat from Biogas," American Society of Agricultural Engineers Paper No. 82-3621, St. Joseph, MI, 1982.
Kofoed, E. and B. Hansen, "Gas Motors," In: Northeast Regional Agricultural Engineering Service, Ithaca, NY, 1981.
Lindley, J. A., and V. J. Haugen. "Biogas Production After Solid-Liquid Separation of Dairy Manure," In: ._ .Pzoceed' ines o f the Fifth - International Svmoos ium OQ
Biothane Dizesl, Vol 2,
Methane Technoloev f o r Aericul turd,
Aericultural W a s t a 1985.
Love, D. L.. "Overview of Process Options and Relative Economics," In: procee- gf t he GRCDA Sixth w t i o n a l Gas SvmD a Industry, CA. March, 1983.
120
Meloy, W.R., "Cleaning and Use of Digester Gas for Vehicle Use," Conference on Energy Conservation: Retrofit of Wastewater Treatment Facilities, Los Angeles, CA, 1981.
Mclnerney, M. J., and M. P. Bryant, "Review of Methane Fermentation Fundamentals," In: Fuel Gas P roduction From B i o m m Vol. 1, edited by Donald L. Wise, CRC Press, 1981.
i W , National Academy of Sciences, 1 r National Academy Press, Washington, DC, 1981.
National Academy of Sciences, Vethane G e n e u o n from Human. Animal. and Aericultural W a s t a National Academy Press, Washington, DC. 1977.
Neyloff, S. and W. W. Gunkel, "Performance of a CFR Engine Burning Simulated Anaerobic Digester Gas," from Proceedings of 1980 American Society of Agricultural Engineers National Energy Symposium, Volume 2, St. Joseph, MI, pp. 324-329, 1981.
North American Manufacturing, North Ame rican Combustion Ha ndboo k, North American Manufacturing Co., Cleveland. OH, 1978.
Ortiz-Canavate, 3.. u., "Diesel Engine Modification to Operate on Biogas," Transactions of the American Society of Agricultural Engineers, 1981, pp. 808-813.
Outboard Marine Corporation, OMC Lincoln, Energy Department, Lincoln. NE, Product Literature, 1982.
Palmer, D. G.. Bioeas Ene rev F rom m a l Was&, Solar Energy Research Institute, 1981.
Palz, W., J. Coombs, and D. 0. Hall., E n e r w from B i o m m , Third International Conference on Biomass, Venice, Italy, 1985.
Parish, M. G., "The Use of Digester Gas in Industrial Applications: An Overview of Design Considerations," The Purdue Industrial Waste Conference, 1986.
Parsons, R. A., Qn Farm B' 10eas Product &, USDA, Northeast Regional Agricultural Engineering Service, 1984.
Pellerin, R. A., u., "Operation and Performance of Biogas-Fueled Cogeneration Systems," a e r e v in Aericultu rG 6. 4, pp. 295-310, 1988.
Persson, S., u., Aericultural Anaerobic Dieeste rs: Desien and ODe ration. College of Agriculture, Penn State University. 1979.
Persson, S. and H. Bartlett, "Use of Farm Produced Biogas in Engines," Methane Technology for Agriculture, Northeast . Regional -Ag&x~ltUFa! Engineering Service, Ithaca, NY, 1981.
Petro, P. P., "Use of Polyethylene Pipe for Landfill Gas Recovery," In: P r o c e e d i m o-I&tsLE- f t d f i l l Gas Svmo u, Industry, CA, March, 1983.
. .
I21
Pohl, J. H., R. Payne, and J. Lee, "Evaluation of the Efficiency of Industrial Flares: Test Results," EPA Project Summary, EPA-600/S2-84-095, July, 1984.
Pohland, F. G. and S. R. Harper, "Biogas Developments in North America," in Proceedings of 4th Inter nat ional SvmDosium on Anae robic Dinest ing, Guangxhov, China, November 1985.
Pohland, F. G. and S. R. Harper, "Critical Review and Summary of Leachate and Gas Production From Landfills," USEPA/600/S2-86/073 or NTIS PB 86-240, March 1987a.
Pohland, F. G. and S. R. Harper, "Retrospective Evaluation of the Effects of Selected Industrial Wastes on Municipal Solid Waste Stabilization in Simulated Landfills," USEPA/600/S2-87/044 or NTIS PB 87-198. August 1987b.
Pratt, G., et., Enerev Intea rated D a m Fa rm Svstem in No rth Dakota, Final Report, Department of Energy Contract No. DE-FC07-80CS40377, November 1986.
Price, E. C. and P. N. Cheremisinoff, m: Science, Inc., Ann Arbor, MI, 1981.
Probstein, Ronald F. and R. Edwin Hicks, m e t i c Fuel& McGraw-Hill Chemical Engineering Series, McGraw-Hill, Inc., 1982.
Reason, J., "Cogeneration: Controlling the Industrial/Utility Interface," In: m. VOI. 128, NO. 4. pp. 41-49, 1984.
Regulatory Policy Institute, The Industr' la1 Cone neration Ma nu& Washington, D.C., 1983.
Ring, Robert. "Filtration Solutions for Sour Fuels". Reprint from: Diesel and Gas
Product ion & Ut ilization, Ann Arbor
J urbine Worldwide, July-August, 1987.
Ross, C.C. and J.L. Walsh. Jr., "Energy Integrated Farm Digester and Cogeneration System Installation," American Society of Agricultural Engineers Paper 84-3037, St. Joseph, MI, 1984.
Ross, C.C. and J.L. Walsh, Jr., "Impact of Utility Interaction on Agricultural Cogeneration", American Society of Agricultural Engineers Paper 86-3020, St. Joseph, MI, 1986.
Saez, A., u., "Landfill Biogas Operated Diesel Truck - A Chilean Experience," Gaseous Fuels for -tation I. , Vancouver, BC, Canada, pp. 1033-1045, 1986.
Safely, L. M., R. L. Vetter, and D. Smith, "Managing a Poultry Manure Anaerobic Digester," In: Proceed' ines o f the Fifth Inter -1 Svmoosium o n Aaricultural lW&s,, 1985.
Sasser, D. S. and T. 0. Morgan, Ene rev Inteerated Dai rv Farm Svstem I n P u e r u R ~ Q , Final Report, Department of Energy Contract No. DE-FC07-80CS40376, October 1986.
122
Shaffer, S., "Biogas Production from Dairy Manure: A Case Study of the Langerwerf Dairy, Durham, California," California Department of Food and Agriculture, Sacramento, CA, 1985.
Salisbury, J. K. (Editor), Kent's M e c h a n i c a l o o k : Power Volumg , John Wiley and Sons, Inc., NY, 1950.
Schell, W. I., "Membrane Systems for Landfill Gas Recovery," In: the GRC DA Sixth Inter n a t i a Landfill Gas SVmD Q$&& Industry. CA, March, 1983.
Proceedinas of
Schellenback, S., Qn the Farm Methanc, Biogas of Colorado, Inc., 1980.
Schulte, D. D. and W. E. Splinter, "Energy Integrated Farm: Progress Report," University of Nebraska, October, 1983.
Sierra Monitor Corporation. "Gas Monitoring Specification for Wastewater Treatment Facilities," Milpitas, CA, Undated.
Smith, R. J., "Practicality of Methane Production from Livestock Wastes: State of the Art," Journal Paper No. J-9918, Project No. 2126, Iowa Agricultural and Home Economics Experiment Station, Ames, IA, 1980.
Splinter, W. E. and D. D. Schulte, k r n v Intearated S wine Farm Svs tem in Nebraskx, Final Report, Department of Energy Contract No. DE-FC07-80CS40378, May 1987.
Stafford, D. A., D. L. Hawkes, and R. Horton. Methane Product ion from Wastc m a n i c M a t t e t CRC Press, Boca Raton, FL. 1980.
Stahl, T., u., "Thermal Energy from a Biogas Engine/Generator System," American Society of Agricultural Engineers Paper No. 82-2630, St. Joseph, MI, 1982a.
Stahl, T., u., "Farm Scale Biogas Fuel Engine/ Induction Generator System," American Society of Agricultural Engineers Paper No. 82-3543. St. Joseph, MI, 1982b.
Stahl, T., "Energy Cogeneration with Biogas Fuel," PhD. Dissertation, University of Missouri-Columbia, May, 1983.
Strelzoff, S., "Choosing the Optimum CO, Removal System," Chem' ical September IS, 1975.
SumX Corporation, "Topical Report: Anaerobic Digestion System," U. S. Dept. of Energy, Contract No. DE-FC07-80CS-40383. July, 1983.
Ene ineerinK,
TVA (Tennessee Valley Authority). Commercial a nd lndustrial Biomass P ro lects, March, 1982.
USEPA. U. S. Environmental Protection Agency, Peco very. Process] na. a n d of Gas fr-v L a w EPA-600/2-79-001, February, 1979a.
USEPA, US. Environmental Protection Agency, QQ& end W t r u c t ion of Cover& for Sol id Waste LandTtlls. . NTlS PB 80-100381, August. 1979b.
123
USEPA, U.S. Environmental Protection Agency, Process Design Man ual for Sludpe u e a t m e n t and DisoosaL EPA 625/1-79-011, September, 1979c.
Van Heuit. R. E., "Extraction, Metering and Monitoring Equipment for Landfill Gas Control and Recovery Systems," In: Proceedinns of the G RCDA Sixth Internat iond J J & i Industry, CA. March, 1983.
Van Velsen, A. F. M.. Anae robic Digestion of Pigaerv WastG Dept. of Water Pollution Control, Agricultural University. Wageningen, The Netherlands, 198 1.
Walker, L. P., u., Fne rev I n t m e d Dairv Farm Svstem in Ne w York, Final Report, Department of Energy Contract No. DE-FC07-80CS40380, September 1985.
Walsh, J.L. and C.C. Ross, "Cogeneration of a Southeastern Dairy". American Society of Agricultural Engineers Paper 86-6577, St. Joseph, MI, 1986.
Walsh. J. L., u., &rav Inteerated Dai rv Farm Svstem in Geo rei&, Final Report, Department of Energy Contract No. DE-FC07-80CS 40379, September 1986.
Wark, K., m v n a m ics, 3rd Edition, McGraw-Hill, New York, NY, 1977.
Lube Oil R e c o m n d a t iolls, Waukesha Service Bulletin 12-1880H. Waukesha Engine Division, Dresser Industries, Waukesha, W1, 1981.
Waukes ha Cogeneration Handbook, Waukesha Engine Division, Dresser Industries, Inc., Waukesha, WI, 1986.
Waukesha Power Generation Aoolication Data Book, Waukesha Engine Division, Dresser Industries, Waukesha, WI, 1987a.
power Generation Aoolicat ion Data . Technical Communicator #20, Waukesha Engine Division, Dresser Industries, Waukesha, WI, April 1987b.
"Ways to Use Digester Gas to Your Best Advantage," Waukesha Engine Division, Dresser Industries, Waukesha, WI. undated.
Williams, D. W., u., "Utilization of Biogas for Farm Production Energy," American Society of Agricultural Engineers Paper No. 75-1071, St. Joseph, MI, 1975.
. .
. .
Wilkinson, B. W. and R. W. Barnes, Qgcnerat ion o f Electricitv and Use f u l Heat, CRC Press, Inc., Boca Raton, FL, 1980.
Windholz, M, a., The Merck Indey, 10th Ed., Merck and Co., Rahway, NJ, 1983.
Wooster, C. and E. Thompson, "How Well are PURPA's Cogeneration Incentives Functioning?" In: Inc., Atlanta, GA. pp..155-.175, 1985.
The Conen eration Sourcebook F.W. Payne (ed.). Fairmont Press,
Wright, J. E., "Innovative Approach to Compressed Natural Gas," In: -ne Fue I for Th e F u t u r t Plenum Press, 1982.
Yazaki Brochure, American Yazaki Corporation, Farmers Branch, Texas, 1987.
124
APPENDIX A
ALPHABETICAL LISTING OF EQUIPMENT SUPPLIERS
A-C Compressor Corporation I126 South 70th Street West Allis, WI 53214 414-475-4305
Advanced Industrial Technology Corp. P.O. Box 555 T Lodi, NJ 07644 Industrial Gas Systems 201 -265-1 4 14
Advanced Manufacturing Systems, Inc. 110 Technology Parkway Technology Park Atlanta Norcross, GA 30092 404-448-6700
Aero Tech Labs, Inc. Spean Road Industrial Park Ramsey, NJ 07446 201-825-1400
Aerzen USA Corporation 313T National Rd. Exton Industrial Park Exton, PA 19341 21 5-524-9870
Airco Industrial Gases 575 Mountain Ave. Murray Hill, NJ 07974 201-464-8 100
Airovent, Inc. Gartmer Equipment Company P.O. Box 206 Syracuse. NY 13208 3 15-416-832 1
Alemite & Instrument Div. Stewart - Warner Corp. 1826 Diversey Pkwy. Chicago. IL 60614 3 12-883-6000
Alphasonics, Inc.
Austin, TX 78737 12010 HWY. 290 W., Stc 200-C
5 12-288-366 I
American Yazaki Corp. 13740 Omega Rd. Farmers Branch, TX 75244 214-385-8725
Applebee-Church, Inc. P.O. Box 80186 - Chamblee Atlanta, GA 30341 404-451-2747
Applied Cogeneration 11341 San Fernando Rd. San Fernando, CA 91340 818-896-7443
Applied Thermal Systems, Inc. P.O. Box 101493 Nashville, TN 3721 0 61 5-366-022 1
Automatic Switch Co. 50-60 Hanover Rd. Ftorham Park, NJ 07932 800-972-2726
Babock & Wilcox. Industrial Power Generation Div.
4282 Strausser Street NW P.O. Drawer 2423T North Canton, OH 44720 216-497-6223
Bauer Compressors, Inc. 1328 W.. AzaIea .Garden Rd. Norfolk, VA 32502 804-855-6006
I25
The Bigelow Co. 142 River St. P.O. BOX 706-T . New Haven, CT 06503 203-772-3150
Boulder Associates, Inc. 473 E. Church Rd. P.O. Box 88 King of Prussia, PA 19406 2 15-277-7730
Bradford-White International Ltd. 2401 Ellsworth St. Philadelphia, PA 19146 215-546-3800
Calvert Environmental Equipment Co. 5191-T Sante Fe St. San Diego, CA 92109 6 19-272-0050
Carolina Technical Representatives, Inc. P.O. Box 1115 Matthews, NC 28105 104-841-4494
CECA, lnc. Adsorption Technology 4150 S. 100th East Ave., Ste 300 Tulsa, OK 74146 3 13-737-459 1
CH2M Hill Solid Waste Specialists P.O. Box 4400 Reston, VA 22090 804-471-1441
Chemical Design, inc. 285 Market St.
Lockport, NJ 14094 BOX 513-T
7 16-433-6744
Coen Company, Inc. 1510-12 Rollins Rd. Burlingame, CA 94010 415-697-0440
Connelly-GPM Inc. 200 S. Second Street Elizabeth, NJ 07206 3 12-247-723 I
Continental Products, Inc. P.O. Box 418165 M Indianapolis, IN 46241 317-241-4748
Coppus Engineering 344 Park Ave Worcester, MA 01610 617-756-8393
Corken International Corp. P.O. Box 12338 Oklahoma City, OK 73157
Distral Energy Corporation 1125 NE 7th Ave. Dania, FL 33004
405-946-5576
305-920-8100
Dresser Measurement Dresser Industries, Inc.
Houston, T'X 77242 P.O. BOX 42176 - TR
7 13-972-5000
Dual1 Industries, Inc. 760 S. McMillan St. Owosso, MI 48867 517-725-8184
Ecolaire, Inc. 2 Country View Rd. Malvern, PA 19355 215-647-9900
Edwards Engineering Corp. ]@I-A -Alexander Ave. Pampton Plains, NJ 07444 800-526-520 1
126
EMCON Assoc. 1941 Ringwood Ave. San Jose, CA 95131 408-275- 1444
EnerTech Corp. 201 Allen Rd. Atlanta, GA 30328 404-432-1234
Enerquip, Inc. Dept. M P.O. Box 368 611 North Rd. Medford, WI 54451
Entcrra Instrumentation Technologies
Exton, PA 19341
715-748-5888
251-ET Welsh PO01 Rd.
215-363-5450
Ergcnics 681-T Lawline Rd Wycoff, NJ ,07481 201-891-9103
ESCOR, Inc. 550 Frontage, e208 Northfield, IL 60093 3 12-501 -2 I90
Fermont 141 T North Ave. Bridgeport, CT 06606 203-366-521 1
Fischer & Porter Company 51 Warminster Rd. Warminster, PA 18974 21 5-674-6000
Flaregas Corporation 100 Airport Executive Park Spring Valley, NY 10977 914-352-8700
The Foxboro Company 86 Neponset Ave. Foxboro, MA 02035 61 7-543-8750
Friedrich Air Conditioning & Refrigeration Co.
4200 N. Pan Am Expwy. San Antonio, TX 78295 512-225-2000
Getty Synthetic Fuels, Inc. P.O. Box 1900 Long Beach, CA 90801
Groth Equipment Corp. P.O. Box 15293 1202 Hahlo
213-739-2100
~ ~ ~~~~~ ~
Houston, TX 77020 7 13-675-61 5 1
Hamworthy USA. Inc. Pump & Compressor Div. 10555 Lake Forest Blvd., Ste. 1 F-T New Orleans, LA 70127 504-244-9074
Hedland Div. of Racine Federated, Inc. 2200 South St. Racine, W1 53404 800-433-5263
Henderson Sales & Service, Inc. P.O. Box 830876 Richardson, TX 75083 214-234-3226
Hydronics Engineering Corp. Godwin Ave.
Midland Park, NJ 07432 P.O. BOX 179-T
2 10-444-4376
Industrial Marketing Assoc. I1642 Knott Ave., Suite 5 Garden Grove, CA 92641 714-836-4706
Industrial Gas Systems 13477 Prospect Rd.
Dep t 207 Cleveland, OH 44136 904-445-4200
127
Industronics, Inc. 489 Sullivan Ave. South Windsor, CT 06074 203-289-1551
Industry Hills SCS Engineers 4014 Long Beach Blvd. Long Beach, CA 90807 2 13-426-9544
John Zink Co. 4401 S. Peoria Tulsa, OK 74105 91 8-747- 1371
Kemlon Products & Development Corp
Houston, T X 77021 P.O. Box 14666-TR
713-747-5020
Kennedy Van Saun Corp. P.O. Box 500 Danville. PA 17821 717-275-3050
Kurz Instruments, Inc. 2411 Garden Rd. Monterey, CA 93940 800-424-7356
Linde Specialty Gases, Union Carbide Corp.
P.O. BOX 6744-T
800-982-0030 Somerset, NJ 08873
Matheson Gas Products, Inc. 30-T Seaview Dr. Secaucus, NJ 07094 20 1-867-4 100
Microtrol Environmental Systems, Inc. One Oscar Hammerstein Way
New Hope, PA 18738 P.O. BOX 426-T
21 5-862-9465
Midwesco Energy Systems 7720 Lehigh Ave. Dept. TI 15 Niles, IL 60648 3 12-966-2 150
Monroe Environmental Corp. 11 Port Ave. P.O. Drawer 806-T Monroe, MI 48161 800-992-7707
Natco P.O. Box 1710 Tulsa, OK 74101
Nelson Filter P.O. Box 280 Stroughton, WI 53589 608-873-4300
Neotronics N.A., Inc. P.O. Box 370 2144 Hilton Dr. SW Gaincsvillc, GA 30503 404-535-0600
O'Brien Energy Systems Green Street & Powerhouse Place Downington. PA 19335
9 18-663-9 100
215-269-6600
Parker Engineering & Chemicals, Inc. Dept. G 3077 McCalI Dr. P.O. Box 81226 Atlanta, GA 30366 404-458-91 3 1
Perennial Energy Inc. Route 1, Box 645 West Plains, MO 65775 4 17-256-2002
Pierburg Metering Systems, Inc. 4J-TY_reeland Ave. Totowa, NJ 07512 201-785-0136
128
Power Flame, Inc. 2001 S. 2lst Street Parsons, KS 67357 316-421-0480
Process & Cyrogenic Services, Inc. 2170-T Old Oakland Rd. San Jose, CA 95131 800-826-3062
Public Service Electric 8c Gas Company Research Corp. P.O. BOX 570 T-16A Newark, NJ 07101 201-430-7000
Resource Systems, Inc. B-6 Merry Lane East Hanover, NJ 07936 201-884-0650
Scientific Gas Products Ashland Chemical Co. 2330-T Hamilton Blvd. South Plainfield, NJ 07080 20 1-344-6998
SCS Engineers 11260 Roger Bacor Dr. Reston, VA 22090
Semblex 1635 W. Walnut Springfield, MO 65806
804-47 1-61 50
417-866-1035
Sierra Monitor Corp. 1991-T Tarob Court Milpitas, CA 95035 408-262-661 1
Spectra Gases, Inc. 3033 Industry St. Oceanside, CA 92054 800-932-0624
Stahl, Inc. Farrier Products Div. Church Rd. & Derry Ct. BOX M-34A York, PA 17405 71 7-767-697 1
Stevens Electric Company, Inc. 810-812 N. Main St. Memphis, TN 38107 800-874-5909
Super-Ice Corp. P.O. Drawer 783 San Leandro. CA 94557 4 15-483-1 778
Syn Fuels 1221 Ave of the Americas New York, NY 10020 212-5 12-3916
Technotherm Corporation 5508 West 66th Street South Tulsa, OK 74131 91 8-446-1533
ThermaFlo Marketing Dept. 3640 Main St. Springfield, MA 01 107 800-556-60 15
Turbo Refrigerating Co.
Denton, TX 76202 P.O. BOX 396-T
817-387-4301
Turbosystems International 7 Northway Lane Latham, NY I21 10 518-783-1625
US. Turbine Corporation 7685 South State Route 48 Dept. A Maineville, OH 45039 5 13-683-6l40
129
Virginia Technical Associates, Inc. 7202 Impala Drive Richmond, VA 23228 804-266-9654
Vooner Equipment Co., Inc. Dept. T, P.O. Box 240360 4725 Stockholm Court Charlotte, NC 28224 800-345-7879
Vulcan Waste Systems, Inc. 300 Huron St. P.O. Box 4030 Elyria. OH 44036 7 I 1-822-21 6 1
Waste Management, Inc. 3003 Butterfield Rd. Oak Brook, IL 60521 312-572-8800
Waukesha Engine Division Dresser Industries, Inc. 1000 West St. Paul Ave. Waukesha, WI 53188 414-547-331 1
Wehran Engineering 666 East Main St. Middletown, NY 10940 914-343-0660
Wittemann - Hasselberg, Inc. 2 Commerce Blvd. Palm Coast, FL 32031 904-455-4200
Wormser Engineering, Inc. 225 Merrimac Street Woburn, MA 01801 611-983-9380
130
APPENDIX B LISTING OF COMPANIES BY PRODUCT OR SERVICE
GAS RECOVERY
Getty Synthetic Fuels, Inc. John Zink Co. Wehran Engineering
GAS PURIF ICATION
Advanced Industrial Technology Corp. Calvert Environmental Equipment Co. Chemical Design, Inc. Connelly-GPM, Inc. Dual1 Industries, Inc. Ergenics Hydronics Engineering Corp. Industrial Gas Systems Microtrol Environmental Systems, Inc. Morrow Environmental Corp. Natco Nelson Filter Process & Cyrogenic Services, Inc. Resource Systems, Inc.
COMPRESSOU
A-C Compressor Corporation Aerzen USA Corporation Airovent, Inc. Bauer Compressors, Inc. Corken International Corp. Ergenics Hamworthy USA, Inc. Henderson Sales & Service, Inc. Kemlon Products & Development Corp Vooner Equipment Co., Inc. Wittemann - Hasselberg, Inc.
131
CONSULTING
Advanced Manufacturing Systems, InC. Industry Hills O’Brien Energy Systems Perennial Energy Inc. SCS Engineers Vulcan Waste Systems, Inc. Waste Management. Inc. Wormer Engineering, Inc. CH,M Hill
BURNERS
Babcock & Wilcox Coen Company, Inc. Cleaver Brooks EnerTech Corp. Power Flame. Inc.
BOILERS Applebee-Church, Inc. Applied Thermal Systems, Inc. Bradford-White International Ltd. Carolina Technical Representatives, Inc. Technotherm Virginia Technical Associates, Inc.
COGENERATION
Applied Cogeneration Automatic Switch Co. The Bigelow Co. Boulder Associates, Inc. Caterpillar Coppus Engineering Cummins Engine Distral Energy Corporation Ecolaire, Inc. Enerquip, Inc. Ford Fermont Industronics, Inc. Midwesco Energy Systems O’Brien Energy Systems Parker Engineering & Chemicals, Inc. Perennial Energy, Inc. Stahl, Inc.
132
Stevens Electric Company, Inc. Technotherm Corporation Turbosystems International US. Turbine Corporation Vulcan Waste Systems, Inc.
ABSOR PTION CHILLERS
American Yazaki Corp. Continental Products, Inc. Edwards Engineering Corp. Friedrich Ai r Conditioning
Super-Ice Corp. ThermaFlo Marketing Dept. Turbo.Refrigerating Co.
& Refrigeration Co.
2 A
Aerzen USA Corporation Alemite & Instrument Div. Alphasonics, Inc. Dresser Measurement Enterra Instrumentation Technologies Fischer & Porter Company Fluid Components, Inc. The Foxboro Company Groth Equipment Corp. Hedland Div. of Racine Federated, Inc. Kurz Instruments, Inc. Neotronics N.A., Inc. Pierburg Metering Systems, Inc. Process & Cyrogenic Services, Inc. Semblex Sensidine, Inc. Sierra Monitor Corp. Spectra Gases, Inc.
133