biogeography of coral reef shore gastropods in the philippines · flunked his phd exams twice,...
TRANSCRIPT
Biogeography of Coral Reef Shore Gastropods in the Philippines
Thesis submitted by
Benjamin VALLEJO, JR, B.Sc (UPV, Philippines), M.Sc. (UPD, Philippines)
in September 2003
for the degree of Doctor of Philosophy in Marine Biology
within the School of Marine Biology and Aquaculture James Cook University

ABSTRACT
The aim of this thesis is to describe the distribution of coral reef and shore gastropods in
the Philippines, using the species rich taxa, Nerita, Clypeomorus, Muricidae,
Littorinidae, Conus and Oliva. These taxa represent the major gastropod groups in the
intertidal and shallow water ecosystems of the Philippines. This distribution is described
with reference to the McManus (1985) basin isolation hypothesis of species diversity in
Southeast Asia. I examine species-area relationships, range sizes and shapes, major
ecological factors that may affect these relationships and ranges, and a phylogeny of one
taxon.
Range shape and orientation is largely determined by geography. Large ranges are
typical of mid-intertidal herbivorous species. Triangualar shaped or narrow ranges are
typical of carnivorous taxa. Narrow, overlapping distributions are more common in the
central Philippines.
The frequency of range sizesin the Philippines has the right skew typical of tropical
high diversity systems. This shows that there are many species with small range sizes,
and suggests a tendency for these ranges to overlap.
The species area curves are consistent with predictions of basin isolation on species
richness. The central Philippine basins (Visayas and, Sibuyan) have a z estimate (a
parameter of the Species Area relationship or SPAR) close to unity (0.59-1.30). This
contributes to biogeographical provinciality (a measure of faunal uniqueness) in these
basins. The basin that is most provincial is the Sibuyan Sea basin. However this
provinciality may also be due to a small-area effect or the decoupling of species
richness with area as a result of habitat heterogeneity within the basin. Endemicity of
taxa is observed mainly in the central, as opposed to the peripheral, oceanic basins.
A regression approach was applied to test the effects of larval duration and habitat
availability on range size and species richness of Conus. The results suggest that habitat
is a more significant factor in determining species ranges and species richness than
larval duration. This supports the suggestion from basin isolation for an important effect
of habitat heterogeneity on range size and species richness. . Extinction rate estimates
are negative for the Philippines and other areas in the Indo-West pacific (IWP). This
suggests that species in the Philippine basins, and the IWP in general, have been
accumulating in these areas over the past 18,000 years.
In Conus, the mode of speciation was inferred from a published molecular phylogeny,
coupled with data on modern ranges. This study also tried to infer Conus speciation
within the IWP. The relationship of modern ranges and phylogenetic information is not
informative, and does not provide inferences on the mode or location of speciation. The
ranges and phylogenetic patterns of Conus suggest that changes in range extents have
been large during the evolution of the genus. This may be due to the long larval
duration, that allows for wide dispersal, being largely conserved during Conus
evolution.
In the sand-dwelling coral reef genus Oliva, the ranges and species area curves were
similar to those of Conus.. The central Philippines basin of the Sibuyan Sea has the
highest degree of provinciality. The area of the OGU (geographical regions) affects
species richness of Oliva significantly This observation is consistent with results of a
PCA ordination of the frequency of occurrence of Oliva. The presence of sandy
habitats affect Oliva species richness significantly. The morphological diversity of two
widely distributed species of Oliva was studied. Monotopic species (species that are
found only in a single substrate type) tend to show morphologies that are found only in
certain oceanic basins.
Modern ranges suggest basin isolation as an historical process that has maintained and
possibly caused the high taxonomic diversity of intertidal and shallow water gastropods
in the IWP. There is evidence that high species diversity in IWP is likely related to the
existence of numerous habitats. The geological histories of the Philippine oceanic
basins may provide important information in future biogeographic studies of patterns of
species richness. The evidence is considered with respect to current molecular
phylogenetic studies of gastropods. The study highlights the paradox of low endemism
in a highly diverse region. Suggestions are made for future research that could provide
insight into the nature of endemism and species persistence of marine organisms in the
IWP.

ACKNOWLEDGEMENTS Back in High School and until now, my favourite scientists have always been Galileo Galilei, Albert Einstein and John Steinbeck. You may wonder why John Steinbeck is in the list. While Galileo is rightly known to be the first modern scientist and Einstein flunked his PhD exams twice, Steinbeck is better known as a Nobel Prize winning writer. Steinbeck has only one science publication under his name and this was written with another marine biologist, Ed Ricketts. Steinbeck clearly understood that the impulse to do science and to find meaning in all things is the same. Nevertheless, Galileo, Einstein, Steinbeck, Ricketts and all the other good scientists did was to take that “bold guess” to conjecture and daringly propose explanations to the inner realities of what the world was all about. While we are unlikely to be that bold in the sense of Karl Popper, I hope that we can try to be like Einstein at times. To this end, I would like to thank the following My field volunteers whom kept good humour (and prayed!) when the odds were against us on land, at sea and in the air. I also thank the fisherfolk that extended their hospitality to us. The course of this project was riddled with difficulties. I thank all those who insisted that I conclude this project for it would be a highly significant contribution to understanding the biodiversity of the Philippines. These people are the late Jaime Cabrera of the Philippine National Museum and Professor Fernando Dayrit. I also thank the Philippine National Museum, Australian Museum, Australian Geographic Society and the Delaware Museum of Natural History for travel grants and assistance to do the biogeographical investigation. I thank the agencies and organisations that provided assistance and information, The Philippine Navy, Philippine Marines, Philippine National Police and the National Mapping and Resource Information Authority and Philippine Atmospheric, Geophysical, Astronomical Authority. I thank Professor Howard Choat, Dr John Collins and Associate Professor Garry Russ at JCU Samantha Itani and Tanya Acheson of the JCU PSA and Student Union respectively Dr Meryl Williams of the World Fish Centre and Dr John McManus of the University of Miami, Dr Winston Ponder, Dr Peter Middlefart of AMS, Drs Anne Hogget and Lyle Vail of the Lizard Island Research Station and Dr Jean Woods of the DMNH Professor Edgardo Gomez, Drs Suzanne Licuanan and Perry Aliño of the University of the Philippines, Dr Rhea Samonte of Case Western Reserve University and Dr Al Licuanan of De La Salle University, Professor Toby Dayrit of the Ateneo de Manila University Reverend Fathers Peter Quilty, Bienvenido Nebres PhD SJ and Daniel McNamara PhD SJ and the Most Reverend Reynaldo de la Paz DSc DD, Orthodox Bishop of Manila, Sister Lucy Kert FDSS, the soon to be Reverend Mel Santos MDiv and the

Jesuit scholastics that always remembered me in their prayers. These are good people who remind us that beyond this there is something more My mates at the Rotary International House and friends at the Ateneo Law School especially Helen Manzano D of Laws. Juned Sonido, Punay Caccam in Canberra, Gino and Baby Simpliciano in Melbourne and Bing and Ramon Santos in Sydney My undergraduate students at the Ateneo de Manila University and the University of the Philippines. I hope that you become better scientists than we are. I hope that in the course of your future studies, you will see much more. My family. And the Master for through Him all things were made, all that is seen and unseen. In the end all can be summarised by the Psalmist Omnia in opera sapientia fecisti!

Quam multa sunt opera tua Domine
omnia in sapientia fecisti
impleta est terra possessione tua
Hoc mare magnum et latum manibus ibi reptilia innumerabilia animalia parva cum grandibus
Ibi naves pertranseunt Leviathan istum plasmasti ut inluderet ei How diverse O Lord are your works! In wisdom you have made them all- the earth full with your creatures Behold the sea, wide and vast Teeming with countless creatures Living things both great and small, a strange world reserved for the ships For Leviathan, the dragon you made to play with Psalm 103: 24-26 Latin Vulgate and Revised Standard Version Translation

AD MAJOREM DEI GLORIAM This work is dedicated to all battlers especially Brigadier General Benjamin R Vallejo (Armed Forces of the Philippines) (1927-1991) Jaime J Cabrera (1938-2002) Curator of Molluscs, National Museum of the Philippines Professor Fernando Dayrit, Emeritus Curator of Molluscs, National Museum of the Philippines Professor Dr Edgardo D Gomez, University of the Philippines Professor Dr Lilia Rabago, University of the Philippines Integrated School Reverend Father Dr Bienvenido Nebres SJ, Ateneo de Manila University My friends and students And to those who labour for the good of the Philippines and not expect any reward

STATEMENT OF ACCESS
I, the undersigned, the author of this thesis, understand that James Cook University will make it available for use within the University Library and, by microfilm or other means, allow access to users in other approved libraries. All users consulting the thesis will have to sign the following statement: In consulting this thesis I agree not to copy or closely paraphrase it in whole or in part without the written consent of the author; in the case of Appendix 8 (Philippine Cones Database) seek the consent of the author and the National Museum of the Philippines; and to make proper public written acknowledgement for any assistance which I have obtained from it. Beyond this, I do not wish to place any restriction on access to this thesis. [Electronic signature affixed] BENJAMIN VALLEJO JR 31 January 2000 and 19 August 2003

STATEMENT ON SOURCES
DECLARATION
I declare that this thesis is my own work and has not been submitted in any form for another degree or diploma at any university or other institution of tertiary education. Information derived from published and unpublished work of others has been acknowledged in the text and a list of references is given.
BENJAMIN VALLEJO JR 31 January 2000 and 19 August 2003
AFN
FDP
7246 102

STATEMENT ON THE CONTRIBUTION OF OTHERS The following institutions or persons contributed primary and secondary material and or funding in this thesis. The nature of these contributions are indicated
1) National Museum of the Philippines- Access to collections and field labels and notes.
2) Mr Carlos Leobrera, Carfel Seashell Museum, Batangas Philippines – Museum catalogue
3) Australian Museum Sydney- Access to collections and published journals 4) Delaware Museum of Natural History, United States of America – Funding
support for travel, access to primary and secondary collection material and database.
5) Lizard Island Research Station, Australia – Access to primary material 6) Pontifical University of Santo Tomas, Manila – Access to Father De Elera’s
zoological catalogue and holdings of the university museum. 7) Ateneo de Manila University – Grants to complete PhD thesis 8) Australian Geographic Society – Travel grant 9) University of the Philippines Marine Science Institute – Access to Marine
Biodiversity Information Center and Museum. 10) Professor Fernando Dayrit, Quezon City, Philippines – Access to private
malacology collection
Benjamin Vallejo Jr 2 September 2003

ABSTRACT ACKNOWLEDGEMENTS FRONTISPIECE DECLARATION STATEMENT OF ACCESS TABLE OF CONTENTS LIST OF FIGURES LIST OF TABLES General Introduction 11.1 FACTORS AFFECTING DISTRIBUTION OF BIOTA 11.2 BASIN ISOLATION, EAST-WEST ISOLATION AND ARCUATE RANGES 5 1.3 THE SCOPE AND AIM OF THIS THESIS 9 Geology , Physical Oceanography and Climate of the Indo West Pacific (IWP) 102.1 GEOLOGICAL EVOLUTION OF SOUTHEAST ASIA, WITH EMPHASIS ON THE PHILIPPINES 11 2.2 THE PRESENT PHYSICAL OCEANOGRAPHY AND CLIMATE 15 2.3 ARE PRESENT CLIMATE AND OCEANOGRAPHIC PATTERNS SIMILAR TO THOSE OF THE PAST? 18 2.4 DISCUSSION 20 2.5 CONCLUSION 22 Materials and Methods of Biogeographical Analyses 243.1 MATERIAL 24 3.2 METHODS 26 3.3 INTRODUCTION TO THE GASTROPOD TAXA INVESTIGATED 36 Range and Distribution of Rocky Shore Gastropods in the Philippines 414.1 INTRODUCTION 41 4.2 MATERIAL 43 4.3 METHODS 43 4.4 RESULTS 44 4.6 DISCUSSION 75 4.7 CONCLUSIONS 85 The biogeography of intertidal and shallow-water Conus: environmental heterogeneity and the basin isolation hypothesis 875.1 INTRODUCTION 87 5.2 MATERIAL 90 5.3 METHODS 99 5.4 RESULTS 105 5.5 DISCUSSION 131 5.6 CONCLUSIONS 140 The biogeography of a sand dwelling coral reef gastropod, Oliva, in the Philippines 1426.1 INTRODUCTION 142 6.2 MATERIAL 145 6.3 METHODS 145 6.4 RESULTS 148 6.5 DISCUSSION 167

6.6 CONCLUSIONS 170 Inferring the mode of speciation in Indo-West Pacific (IWP) Conus 1717.1 INTRODUCTION 171 7.2 MATERIALS AND METHODS 176 7.3 RESULTS 179 7.4 DISCUSSION 184 General Discussion, Synthesis and Hypotheses 1888.1 INTRODUCTION 188 8.2 THE HISTORICAL NATURE OF THE IWP AS THE CENTRE OF MARINE SPECIES DIVERSITY 189 8.3 THE NATURE OF BASIN ISOLATION: GEOGRAPHICAL RANGE AND MORPHOLOGICAL DIVERSITY OF REEF GASTROPODS 192 8.4 THE SPECIES-AREA RELATIONSHIP AND CONSTRAINTS TO DISTRIBUTION 193 8.5 THE CENTRE OF ORIGIN HYPOTHESIS RE-EXAMINED: THE POSSIBLE SIGNIFICANCE OF DUAL DISTRIBUTIONS AND ENDEMIC SPECIES. 194 8.6 PHILIPPINE MARINE BIOGEOGRAPHICAL REGIONS: DEFINED BY EAST-WEST SEPARATION, OCEANIC BASINS AND MACROECOLOGICAL FACTORS 197 8.7 GENERAL CONCLUSIONS 199 LITERATURE CITED 203
APPENDICES Appendix 1 Field Sites Appendix 2a OGUs investigated Appendix 2b Oliva species richness and OGU area Appendix 2c Basin Isolation data Appendix 3 UPV Symposium Paper Appendix 4 Conus habitat frequencies in each OGU Appendix 5 Cone snails of the Philippines Appendix 6 Oliva species determined from DMNH material Appendix 7 Oliva species recorded from the Philippines Appendix 8 Philippine Cones Database

LIST OF FIGURES PAGE Chapter 1
Figure 1.1 The arcuate centre of IWP marine taxonomic diversity 6 Chapter 2
Figure 2.1 The Philippine archipelago 11 Figure 2.2 The Philippines in the Pleistocene 14 Figure 2.3 Western Pacific currents 18 Figure 2.4 Major surface currents 19Chapter 3
Figure 3.1 Sites of collection in the Philippines 27 Figure 3.2 OGU diagrams 28 Figure 3.3 Areography 32 Chapter 4
Figure 4.1a Clypeomorus distribution 45 Figure 4.1b Clypeomorus distribution 46 Figure 4.1c Nerita distribution 47 Figure 4.1d Disjunct distribution in Nerita 48 Figure 4.1e Distribution of uncommon Nerita 49 Figure 4.1f Distribution of muricids 49 Figure 4.1g Distribution of restricted range muricids 50 Figure 4.1h Distribution of littorinids 51 Figure 4.2 PCA biplot of macroecological variables in Littornidae 59 Figure 4.3a PCA biplot of macroecological variables in Nerita 60 Figure 4.3b PCA PC1 and PC3 biplot of macroecological variables in
Nerita 61
Figure 4.3c PCA PC2 and PC3 biplot of macroecological variables in Nerita
62
Figure 4.4 PCA biplot of macroecological variables in Clypeomorus 63 Figure 4.5 PCA biplot of macroecological variables in Muricidae 64 Figure 4.6 Shape of geographical ranges 70 Figure 4.7 Range size frequency distribution and species number 73 Figure 4.8 Provinciality graphs 74 Chapter 5
Figure 5.1 The Philippine archipelago and oceanic basins 88 Figure 5.2a PCA biplot of macroecological variables in Philippine
Conus assemblages 108
Figure 5.2b PCA PC1 and PC3 biplot of macroecological variables in Philippine Conus assemblages
109
Figure 5.3 SPAR curves for Philippine Conus 114 Figure 5.4 Provinciality graph 116
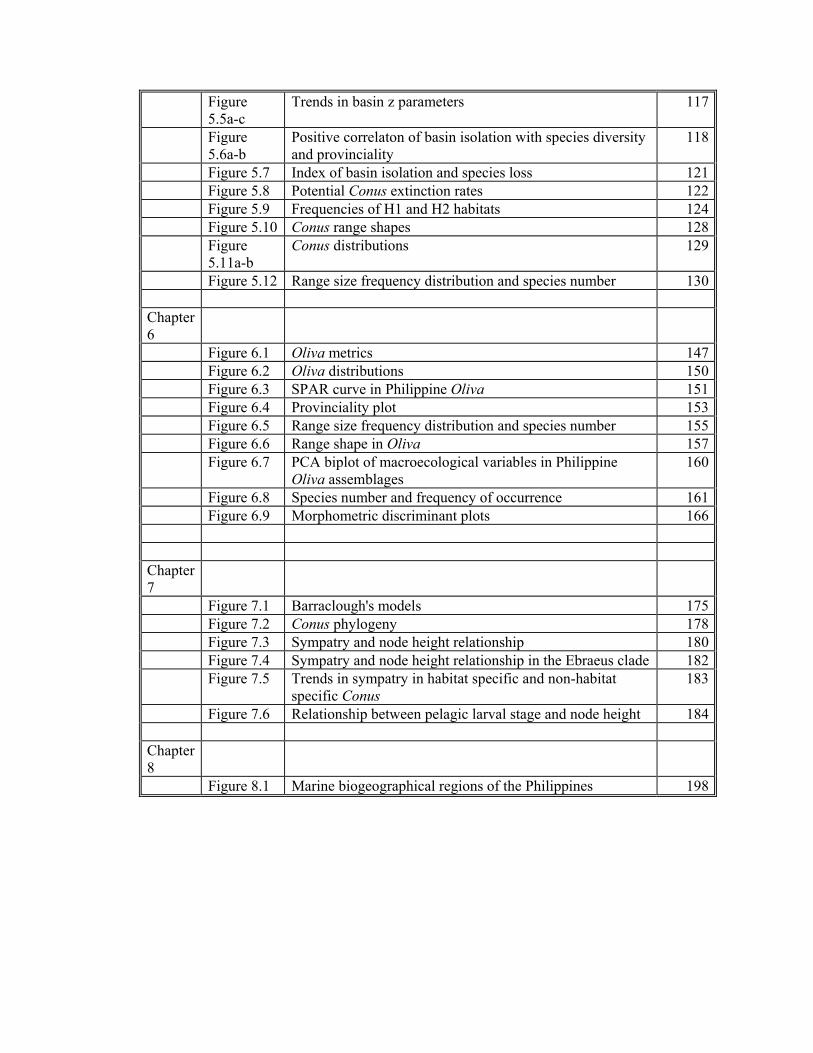
Figure 5.5a-c
Trends in basin z parameters 117
Figure 5.6a-b
Positive correlaton of basin isolation with species diversity and provinciality
118
Figure 5.7 Index of basin isolation and species loss 121 Figure 5.8 Potential Conus extinction rates 122 Figure 5.9 Frequencies of H1 and H2 habitats 124 Figure 5.10 Conus range shapes 128 Figure
5.11a-b Conus distributions 129
Figure 5.12 Range size frequency distribution and species number 130 Chapter 6
Figure 6.1 Oliva metrics 147 Figure 6.2 Oliva distributions 150 Figure 6.3 SPAR curve in Philippine Oliva 151 Figure 6.4 Provinciality plot 153 Figure 6.5 Range size frequency distribution and species number 155 Figure 6.6 Range shape in Oliva 157 Figure 6.7 PCA biplot of macroecological variables in Philippine
Oliva assemblages 160
Figure 6.8 Species number and frequency of occurrence 161 Figure 6.9 Morphometric discriminant plots 166 Chapter 7
Figure 7.1 Barraclough's models 175 Figure 7.2 Conus phylogeny 178 Figure 7.3 Sympatry and node height relationship 180 Figure 7.4 Sympatry and node height relationship in the Ebraeus clade 182 Figure 7.5 Trends in sympatry in habitat specific and non-habitat
specific Conus 183
Figure 7.6 Relationship between pelagic larval stage and node height 184 Chapter 8
Figure 8.1 Marine biogeographical regions of the Philippines 198

LIST OF TABLES PAGE Chapter 4
Table 4.1a Geographic unit loadings on PC axes in Nerita 54 Table 4.1b Geographic unit loadings on PC axes in Clypeomorus 55 Table 4.1c Geographic unit loadings on PC axes in Muricidae 57 Table 4.1d Geographic unit loadings on PC axes in Littorinidae 58 Table 4.1e Pearson and Randall correlations 59 Table 4.1f Rocky shore gastropod species diversity correlations with
macroecological factors 65
Table 4.2 Areographic summaries 66 Table 4.3 Linear regression of frequency of occurrence and range size 67 Table 4.4 Area, site number, species diversity, c and z parameters 68 Table 4.5 Basin and area effects on species diversity 72 Chapter 5
Table 5.1a OGU attributes 90-91 Table 5.1b Conus species recorded in each OGU 92-98 Table 5.2 List of shallow water Conus species used in life history and
habitat analyses 102
Table 5.3 Habitat characteristics of Conus 104 Table 5.4a Pearson and Randall correlations in PCA analyses 107 Table 5.4b Conus species diversity correlations with macroecological
factors 110
Table 5.5 Area, site number, species diversity, c and z parameters 112 Table 5.6 ANCOVA table of basin and bioregion effects 113 Table 5.7 ANCOVA table for range size, habitat availability and
occurrence frequency in Philippine Conus 125
Table 5.8 Results of stepwise multiple regression on species diversity and habitat type in Philippine Conus
126
Chapter 6
Table 6.1 Habitat attributes of Philippine Oliva 144 Table 6.2 Number of species of Oliva in the Philippine oceanic basins 148 Table 6.3 SPAR estimates 152 Table 6.4 Species-area regression statistics 152 Table 6.5 Species number and frequency of occurrence in each OGU 154 Table 6.6 PC loading of geographical units 159 Table 6.7 Stepwise regression statistics 162 Table 6.8 Classification statistics 164-
165 Chapter 7
Table 7.1 Conus species used in the mode of speciation study 177

Introduction
1
CHAPTER 1.
General Introduction
“Look at the animals. This is what we seem to know about them but the knowledge is not final, and any clear eye and sharp intelligence may see something we have never seen.” -John Steinbeck, Foreword to Between Pacific Tides by Edward F. Ricketts and Jack
Calvin, 1948
1.1 FACTORS AFFECTING DISTRIBUTION OF BIOTA 1.1.1 Historical Background
In 1859 Charles Darwin posed a question that remains central to biogeography and
evolutionary ecology: “Who can explain why one species ranges widely and is very
numerous and why another allied species has a narrow range and is rare?” Wallace
(1880) suggested a possible answer. He established modern biogeography by
suggesting that ranges of species often reflect effects of ancient, long-lasting barriers
to their dispersal. Wallace linked evolution, ecology, geological history and
geography (Wallace 1880). He maintained that an understanding of evolutionary
history is possible only through an understanding of the geological, geographical and
ecological history of the region where the species occurs.
Modern biogeography has sought to account for species distributions by borrowing
geology’s Principle of Uniformitarianism. This states that processes currently
operating on earth today are the same processes that operated in geological time
(Whittow 1984). Applying this to biology, biogeography assumes that present
distributions are a product of past temporal changes (Veron, 1995). This interaction of
space and time provides endless possible outcomes. To obtain an understanding of
biogeographical patterns, one must measure factors that determine distribution at local
and geographic scales. Kohn (1997) classifies these factors as extrinsic (changes in
environmental conditions at local and regional spatial scales) and intrinsic (ecological
and evolutionary responses of organisms to these factors).

Introduction
2
To examine the relative importance of these extrinsic and intrinsic factors, it is
necessary to look at several taxa occupying similar habitats. In nature, the effects of
these factors are not mutually exclusive (Kohn, 1997). The Indo-Pacific fauna
provides an excellent group to examine such questions.
The Indo-Pacific is characterised by island arc complexes on its western rim. On the
oceanic Pacific plate, numerous oceanic islands have formed. Others have subsided,
and form bases of atolls. These islands have gradients of species composition of
marine taxa. The IWP island arc shows the highest number of species. As distance
increases from this region, species richness declines. In comparable environments in
oceanic islands, some species that are likely to be found in the IWP island arc are
missing or replaced by another. These gradients are well known and are caused by
factors that select against dispersal by one species and favours dispersal by another
(Vermeij 1987). These selective factors are likely related to energetics (Vermeij
1990), geology, geomorphology (Vermeij 1978) and physical oceanography. Those
species that were able to cross these dispersal barriers and colonise oceanic islands
from the IWP island arc are likely to have undergone subsequent adaptive radiation
(Hourigan and Reese 1987; Kay 1990). This is reflected in the high levels of
endemicity on these oceanic islands.
Vermeij’s studies on molluscs focused on large (ocean-wide) scales. At these scales,
barriers to species dispersal are detectable and likely a function of geographical
distance. On the scale of the Philippine archipelago, the geographical distance
between islands is smaller, and is unlikely to have been an effective barrier to
dispersal. An archipelago is a mosaic of island habitats. Marine biota associated with
these islands may have different levels of genetic connectivity with each other. In the
linear Hawaiian archipelago, there is no distinct island-specific marine invertebrate
assemblage (Kay and Palumbi 1987). This implies that dispersal between the islands
has been sufficient to maintain genetic connectivity.
Dispersal barriers imply that mollusc faunas on islands and continental landmasses of
the Pacific Ocean have different degrees of isolation, and hence different degrees of
genetic connectivity. Rosen (1988) reviews current theories of historical marine
biogeography. He attempts to explain speciation, endemism and distribution of reef
Introduction
3
corals. Historical biogeographic hypotheses are framed in terms of (1) distributional
change and (2) origin in particular geological strata. These hypotheses are often
refered to as:
1. “Centres of origin”,
2. Centres of overlap or accumulation
The centres of origin hypothesis may still be further divided into A. marginal
basin isolation and allopatry, B. vicariant allopatry and C. glacial eustatic
inhibition of speciation.
None of these hypotheses are mutually exclusive. However, Rosen (1988) suggests
that island vicariance, Cainozoic isolation of Pacific plate areas and late Cainozoic
convergence of Indo-Pacific biota, have more support than the “centres of origin”
hypotheses. One of these hypotheses, with a specific reference to Southeast Asia, and
the Philippines, is the basin isolation hypothesis of McManus’ (1985).
This thesis examines the patterns of distribution of selected tropical intertidal
gastropods. Such organisms are model candidates for studies of biogeography of the
IWP. They are relatively easy to collect. Furthermore, their taxonomy and, in some
cases, fossil and phylogenetic histories, are reasonably well known.
1.1.2 Local scale distribution of shore gastropods
The local scale distribution and ecology of shore gastropods is well known. The most
obvious distribution is the vertical zonation observed on shores. Stephenson and
Stephenson (1972) defined three major zones, the supralittoral (high intertidal),
midlittoral (mid intertidal), and the infralittoral (low intertidal). This zonation scheme
holds for exposed to moderately exposed rocky shores throughout the world. It has
been called the “universal zonation” (Stephenson and Stephenson 1949). While it was
formerly believed that physical factors (dessication, temperatures) were the major
determinants of this zonation, biological factors such as competition and predation
can also determine zonation (Connell 1961; Connell 1961; Connell 1972). Both

Introduction
4
biological and physical factors interact to determine zonation patterns (Rafaelli and
Hawkins 1996).
The dominant herbivorous component of these tropical, intertidal gastropod
assemblages is Nerita. This has its highest diversity in the mid-intertidal. Other
components include the patellid and lottiid limpets, the monodont trochids and the
siphonariid limpets. The carnivorous component of these assemblages consists of
rapanine muricids. Lower on the shore, where habitat heterogeneity is highest, Conus,
buccinids and other muricid species are dominant. In sandy habitats in the intertidal,
Oliva are common.
Rocky shores intergrade with coral reefs in the Indo-west Pacific. Tropical rocky
shores thus include upper reef and the fringing reef flats, which provide a mosaic of
microhabitats including sandy areas. Coral reefs in this study are considered as a
special type of rocky shore, peculiar to the tropics (Stephenson and Stephenson 1949;
Stephenson and Stephenson 1972).
This study confines itself to exposed and moderately exposed shores with similar
geomorphology
1.1.3 Species-area relationships and Biogeography
The species-area relationship (SPAR), the relationship between total area surveyed
and the number of species recorded, is one of the fundamental constructs of modern
biogeography. The SPAR is used in this thesis to help infer the historical nature of
modern distributions, and to delineate biogeographical regions. This approach was
first used in terrestrial biogeography. Rosenzweig (1995) discusses the assumptions
of inferring aspects of history and biogeography from SPAR. The approach stems
from island biogeography (Macarthur and Wilson, 1967).

Introduction
5
1.2 BASIN ISOLATION, EAST-WEST ISOLATION AND ARCUATE
RANGES
McManus (1985) proposed basin isolation as one hypothesis to explain the high
species richness of marine biota in the IWP. Basin isolation was the successive
isolation and reconnection of marine faunas, due to changes in sea level. McManus
(1985) hypothesized that this facilitated speciation and endemism in Southeast Asia.
McManus (1985) showed that East-West isolation (a degree of isolation between
Indian and Pacific oceans) was suggested by a common distributional pattern of
molluscs in the western Pacific that stretches from southern Japan to the Solomons
and the Great Barrier Reef, via Southeast Asia (Figure 1.1). McManus (1985) called
such a distribution “arcuate”, to emphasize the arc-like shape (Fig. 1.1). This
distribution also corresponds with the regions of highest number of marine species.
Modern currents and distance are unlikely to cause enough isolation to promote
speciation. Thus suggests a mechanism operating in geological time. McManus
(1985) suggested basin isolation. Such a model may explain the low rates of
endemism in Philippine molluscs, in a region of high species richness (Springsteen
and Leobrera 1986).
McManus (1985) defined an arcuate range over a series of islands that essentially
follows the subduction zones of continental and oceanic plates in the western Pacific.
These islands include the Philippines, Japan, the Ryukyu Islands and the continental
island of Taiwan. This area makes up the northern portion of the arc (Fig.1.1). At this
scale, he also describes a phenomenon called East-West isolation. East-West isolation
is the observable discontinuity in species distribution between the Indian and Pacific
Oceans. This can be observed as a sharp regional difference in community similarity
and life-form distribution (Uychiaoco et al. 1992; Aliño 1994; Aliño et al. 2002), a
disjunction in gene flow and clear population genetic structuring (Endriga 2001),
morphological differences in shell shape in widely distributed species (Vallejo 2001)
and pairs of species that can be divided into Pacific and Indian Ocean populations
(McManus 1985; Bellwood and Wainwright 2002). Many IWP species display this
East-West isolation in the northern part of their arcuate ranges. In this thesis, I
examine arcuate ranges and east-west isolation within the Philippine archipelago, and
explore the possible implications to McManus’s original hypothesis.

Introduction
6

Introduction
7
Many species of gastropods have arcuate distributions like that shown in Fig. 1.1.
Many of these ranges display a good degree of East-West isolation in the Philippine
portion of this arcuate distribution. Many other groups of marine taxa conform to this
pattern, including corals, reef fish and seagrasses (McManus 1985, Fortes 1986
Uychiaoco et al 1992). This pattern of distribution is so common, that it is possible to
divide the Philippines into east and west biogeographical regions (DENR and UNEP
1997).
The causes of these biogeographical patterns may be historical, ecological or both.
Many of the species in the Philippines that have some degree of east-west separation
have wide IWP distributions. A potential criticism of my approach may be that a
study of ranges only in the Philippines examines a small part of the arcuate range.
However, McManus (1985) framed his hypothesis with Southeast Asia and the
Philippines as a primary area of interest. His main question was why this region is
species-rich. McManus envisioned that most speciation occurred through vicariance.
However he also stressed that ecological factors may account for the high species
diversity. The question of effects of ecological factors on species diversity can be
examined by looking at ranges within the Philippines. At the time McManus (1985)
did not have at his disposal detailed descriptions of distribution of many marine
organisms within the Philippines. He did use larger scale patterns obtained from the
western Pacific, and also used information on terrestrial biota.
By looking at higher resolution patterns of distribution of marine fauna within the
Philippines, collected since McManus first proposed basin isolation in 1985, new
hypotheses may be generated. Such hypotheses may provide new understanding of
Indo-West Pacific and Philippine biogeography.
1.3 THE SCOPE AND AIM OF THIS THESIS
This is a biogeographical study. The thesis examines distributions of biota in light of
McManus’ (1985) basin isolation hypothesis. The methods are limited by the nature
of the data, and cannot directly test the historical aspects of the basin isolation
hypothesis. The methods are inferential tests only of basin isolation. The thesis aims
to determine if new data on distributions of marine biota support McManus’ (1985)

Introduction
8
predictions or not. While the data on species distributions are modern, inferences
about their history can be made with biogeographical methods such as species-area
relationships (Rosenzweig, 1995) and molecular phylogenies (Berlocher 1998;
Barraclough et al. 1999).
The gastropods Nerita, Conus, Oliva, Clypeomorus, Muricidae, Oliva and Littorinidae
are common primary material in the Philippine National Museum (PNM), Carfel
Seashell Museum, the University of the Philippines, University of Santo Tomas and
the Delaware Museum of Natural Museum (DMNH). Other gastropod taxa, such as
Buccinidae, Mitridae, Trochidae, Turbinidae, Cerithiidae and Columbellidae are also
found in similar environments in the field. However, they are not well represented in
collections and an accurate description of their distributions is not possible.
Chapter 2 describes the geological and physical oceanographic environment of the
Philippines. This geographic entity is unique, consisting of more than 7000 islands of
varying geological ages, but with similar histories. This is due to complex tectonic
history. The islands are often fringed with coral reefs. The islands give name to the
oceanic basins or archipelagic seas in the country. Chapter 3 details the general
methods used in the biogeographical analyses.
Chapter 4 describes the biogeography of rocky shore gastropods in the Philippines,
with a focus on Nerita. Chapter 5 is a detailed examination of the basin isolation
hypothesis, focussing on the most species-rich genus of tropical intertidal gastropods,
Conus. This genus has been the focus of extensive ecological research since the 1950s
(Kohn 1990). More is known about Conus palaeontology than any other tropical
mollusc (Röckel et al 1995). Furthermore, the evolutionary ecology and radiation of
Conus is linked with the Miocene and Pliocene development of coral reefs in the
Pacific (Kohn 1997). The genus can be readily accessed from collections in museums
and private collections. In addition, a molecular phylogeny is now available for the
genus (Duda and Palumbi 1999).
The archipelagic nature of the Philippines provides an excellent test of the role of
oceanic basins in determining species-richness and morphological diversity. What
exactly are the roles of these basins in marine biogeography? These hypotheses are

Introduction
9
examined with reference to the McManus (1985) basin isolation model, and are tested
in Chapter 6, with a description of the biogeography of the tropical intertidal gastopod
Oliva.
In Chapter 7, the possible mode of speciation in Conus is inferred, drawing on models
of both sympatric and allopatric speciation (Berlocher 1998; Barraclough, Vogler et
al. 1999) and upon a molecular phylogeny of Conus (Duda and Palumbi 1999; Duda
et al. 2001)
Chapter 8 is a general discussion and synthesis of the study, with suggestions for
future research. A biogeographical delineation of the Philippines marine fauna is
proposed. The final conclusions in this thesis are presented as an hypothesis that can
be tested using other species-rich marine taxa.

Physical environment
10
CHAPTER 2.
Geology, Physical Oceanography and Climate of the Indo West Pacific (IWP) This chapter describes geography of the Indo West Pacific (IWP). It also describes the
recent geomorphology, physical oceanography and climate of the region. The role of
monsoons and the El Niño Southern Oscillation are discussed.
2.1 GEOLOGICAL EVOLUTION OF SOUTHEAST ASIA, WITH EMPHASIS
ON THE PHILIPPINES
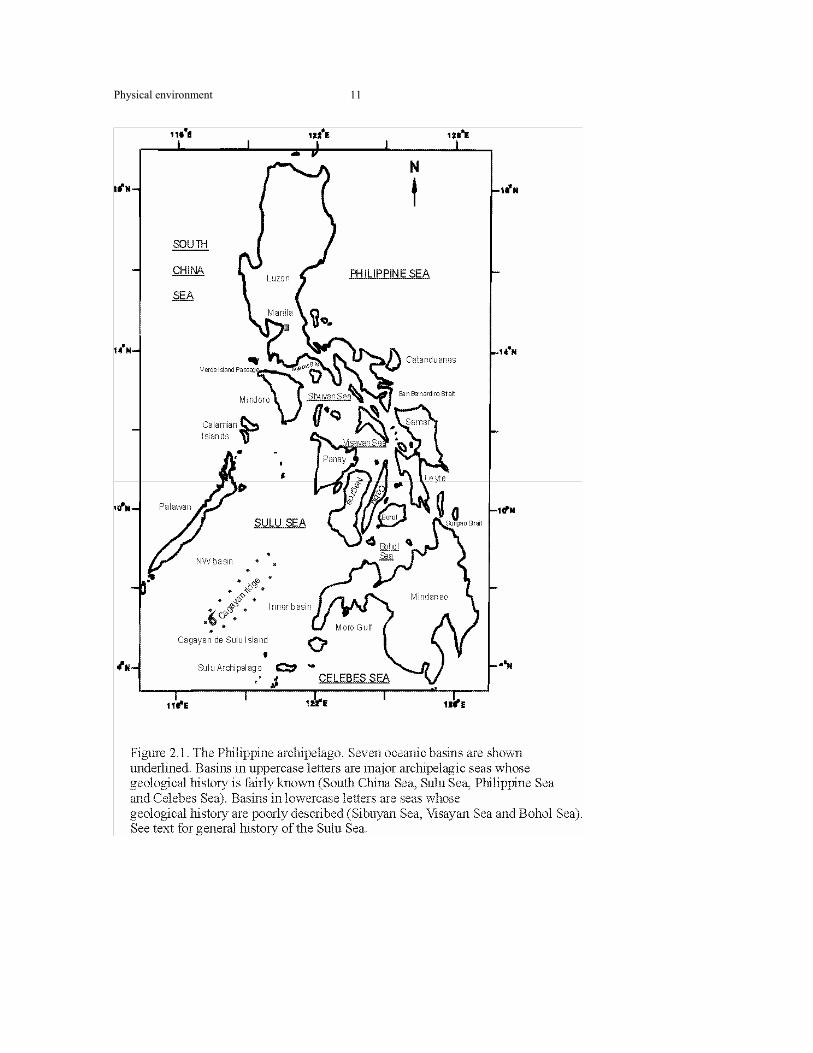
2.1.1 The Philippine Archipelago (Figure 2.1) With the exception of Palawan, the major islands of the Philippines are volcanic in
origin, composed of Cretaceous to Recent oceanic sediments. The islands have geologic
sequences composed of ophiolites, basaltic and andesitic lavas, granite intrusions and
intercalated coral reef limestones (McCabe and Cole 1989). There is a lack of
continental sedimentary influence dating back from the Cretaceous (McCabe and Cole
1989). The only exception is the islands of northern Palawan and the Calamian Group.
Northern Palawan and the Calamian Group are displaced continental terranes, derived
from the Asian landmass as a result of complex plate spreading that gave rise to the
South China Sea (Hutchinson 1989).
The Philippines is thus a complex amalgamation of Cretaceous and younger islands
that has been moved to its present position from the southeast by the clockwise rotation
of the Philippine Plate (McCabe and Cole 1989).
This rotation of the Philippine plate is of immense biogeographical significance. About
30 MY BP Luzon was separated from the eastern and southern Philippines (present day
Bicol peninsula, the Visayan Islands and Mindanao). The eastern and southern
Philippines was located a few degrees below the equator, near proto-New Guinea and
Australia. Continued clockwise rotation of these islands, and the counter clockwise
rotation of Luzon, Palawan, and Borneo, caused the two island groups to meet and thus
form the present Philippine archipelago.
Physical environment
11

Physical environment
12
The Philippine islands have different geological ages. The oldest island is Luzon, where
there is evidence of Cretaceous to Paleocene volcanic activity in the north (Karig
1983). Other islands of this age include Marinduque and Cebu. The youngest islands are
in the Sulu Archipelago, which is of Tertiary origin (McCabe and Cole 1989). The
different ages of the islands have biogeographical significance. It allows the estimation
of colonisation and extinction rates of biota (Heaney 1986)
The narrow continental shelves of these islands have provided a suitable environment
for coral reef development (Wilson and Rosen 1998). Coral reefs have developed,
altering the original shelf base. Thus the shelves now consist of sequences of
intercalated reefal limestone. The shorelines of some islands are fringed by non-reef
coral communities that have the ecological and functional properties of structural coral
reefs (McManus 1988). While these communities may be ephemeral features, they
modify the coastlines by reducing exposure to winds and waves, and by contributing
carbonate sediments that give volcanic rocky shores greater substrate heterogeneity.
2.1.2 Marginal Oceanic Basins
Oceanic basins on the edges of continental plates (Marginal Oceanic Basins) are one of
the most characteristic features of Southeast Asia (Hutchinson 1989). The marginal
oceanic basins are associated with continental rifting. The marginal basins of the Indo-
West Pacific are separated from the Pacific and Indian Oceans by island arcs (Karig
1971; Karig 1974) and these are described as marginal seas. Marginal basins are often
deep and have a seafloor made of oceanic crust. In active basins, there may be active
volcanism associated with seafloor spreading (Karig 1971; 1974). In the Philippines
four main marginal seas occur. These are the South China Sea, Sulu Sea, Philippine
Sea and Celebes Sea basins (Figure 2.1). Several types of marginal basins occur in the
Philippines, based on their sedimentary characteristics (Hutchinson, 1989). The major
basins are of the wrench and rift type, where new oceanic crust is formed (e.g. in the
Sulu Sea).

Physical environment
13
The histories of these marginal oceanic basins are not well known. It is possible to
reconstruct the general history of these marginal basins from paleomagnetic anomaly
data. The Sulu Sea basin is the best studied A submerged volcanic ridge called the
Cagayan ridge, from which Cagayan de Sulu Island emerges (Figure 2.1), divides the
Sulu Sea into a NW and an inner basin (Figure. 2.1) (Hutchinson 1989). The oceanic
crust of the inner basin dates from the Eocene (Weissel 1980). The whole Sulu Sea was
subsequently isolated by the formation of the Sulu Archipelago in the Tertiary. During
the Pleistocene glaciations, it was virtually an enclosed sea. The other basin is the
Celebes Sea basin. This is an extinct basin that no longer shows rifting activity. This
basin was part of the Tethys Sea (Weissel 1980).
2.1.3 The Ice Age Configuration of the Philippine Archipelago (Figure 2.2)
An important concept in basin isolation is the role of past ice ages in the geography of
the Philippines. The changes caused by glacial eustasy had significant biogeographical
implications both on land and sea. Glacial lowering of sea level in the Pleistocene
repeatedly isolated the marginal oceanic basins in the archipelago. During the last major
lowering of sea level (150-200 metre) 20,000 YBP, the archipelago was composed of
five major islands. These were Greater Luzon, Greater Palawan, Negros-Panay, Greater
Sulu, and Greater Mindanao (Heaney 1986). Other islands with no connection to any
larger landmass included Sibuyan, Camiguin and Mindoro. The major islands broke into
the modern day islands of Bohol, Samar, Leyte, Negros and Panay during the present
inter-glacial. Similarities in terrestrial flora and fauna of the various Philippine islands
correspond to the configuration of these larger, ice-age islands, now considered as
faunal provinces.
The marginal ocean basins between the terrestrial faunal provinces have acted as
dispersal barriers and filters to terrestrial fauna. The degree of isolation correlates
positively with endemicity levels of terrestrial mammals in the faunal provinces. For
marine fauna, the basins were almost completely isolated from the Pacific and Indian
Oceans. Based on the 200-metre isobath, the marginal basins were isolated from the
Pacific, with only the San Bernardino Strait linking the central Philippines with the
Pacific.

Physical environment
14

Physical environment
15
2.2 THE PRESENT PHYSICAL OCEANOGRAPHY AND CLIMATE (Figure 2.3)
The islands of the Southeast Asian region and adjacent areas have produced a complex
physical oceanography. This oceanography is further complicated by the monsoon
climate (Wyrtki 1961). The complex system of islands and basins, coupled with a
monsoonal climate, results in spatially and temporally variable biological production
in the marine environment (Sharp 1996).
2.2.1 Physical oceanography
The islands of the Philippines and Indonesia are seperated by only a few deep channels
that allow for mixing of Pacific and Indian Ocean water. Two of these channels are
found in the Philippines, the San Bernardino and Surigao Straits (Figure 2.1). These
allow the North equatorial current (Fig 2.3) to reach the eastern and central portions of
the archipelago and possibly as far as the northern Sulu Sea. The southern branch of the
North equatorial current is deflected by the Sunda shelf (Figure. 2.3) towards the
Arafura shelf (Figure. 2.3), between New Guinea and NW Australia (Sharp 1996).
The marginal ocean basins in the region include the Celebes, Sulu, Banda, South China
and Java Seas. Only in the deep Makassar Trough (2540 metres) near the Banda Sea
can Pacific water pass through to the Indian Ocean (Sharp 1996). The Banda and Flores
seas are connected to the Indian Ocean by sills with a depth of 1900 and 2100 metres
respectively (Postma and Mook 1988). Thus the Indian and Pacific Oceans are
relatively isolated from each other.
The surface and deepwater currents in the marginal ocean basins are not fully
understood. However the monsoon is believed to be a major factor. El Niño-Southern
Oscillation (ENSO) is likely to be an important influence on oceanography of the
region.

Physical environment
16
2.2.2 Regional Climate
2.2.2.1 The Monsoons and Water Transport
A characteristic of the Southeast Asian region is the two rainy seasons caused by the
monsoon. This is typical of the tropics, and results from the interaction between
continental high and low pressure cells. (Roy 1996). These pressure systems are
relatively stationary, and thus the wind regime is relatively constant, especially over the
open ocean. The climate system has a biannual cycle, related to the sun’s movement and
the earth’s inclination on its axis (Roy 1996). This weather system causes rainfall and
terrestrial runoff. Such processes affect temperature and density stratification in
nearshore and ocean waters (Sharp 1996). During the monsoon season, the upper
surface waters inshore are considerably lower in salinity than waters offshore in the
Pacific Ocean.
In the northern hemisphere, the summer or southwest monsoon occurs from June to
September with a peak in July to August and the winter or northeast monsoon occurs
from November to February with a peak in January. These climate phenomena are
driven by the interior heating and cooling of continental Asia and Australia. In the
northern summer, the formation of the Asian low pressure gradient and the Australian
high-pressure gradient drives the southwest monsoon. In the northern winter, the
situation is reversed, with a weak Australian low pressure gradient and an Asian high
pressure gradient driving the northeast monsoon. The latter also derive partially from
the northeast tradewinds. The extent of the northeast monsoon is dependent on the
movement of the equatorial low pressure system that lies over northern Australia in
January.
Water masses are advected by the monsoons. The northeast monsoon causes north to
south transport of surface waters that deflect southeast at the equator. The southwest
monsoon causes a westward transport of surface water, but the net transport of water is
northward. These monsoon seasons are the major climatic features affecting the
nearshore marine environment. The substantial sea level difference between the Pacific
and Indian Oceans forces a net southward flow, regardless of the monsoon season

Physical environment
17
(Sharp 1996). Deepwater currents from the Pacific pass westward through the
Mindanao and Surigao Straits to the Celebes Sea, and then to the deep Makassar Trough
(Postma and Mook 1988).
The two monsoon seasons cause the major currents in the Philippines to reverse (Figure
2.4). This results in almost continuous mixing in the first 40-50-m in eastern Indonesia
(Sharp 1996). Strong northeast monsoons may extend this mixing to 100 m depth. In
areas near the shelves, some upwelling occurs during strong monsoons.
2.2.2.2 El Niño Southern Oscillation (ENSO)
ENSO events occur irregularly, at intervals of three to six years. They are also of
variable duration. The pressure difference between the eastern and western Pacific
affects sea level in the west Pacific. This causes changes in the rates of water flow
between the Pacific and Indian Oceans. During an ENSO event, weakening northeast
trade winds result in stronger advection of warm water from west to east in the Pacific.
This also causes enhanced and deeper mixing of western Pacific waters. During “La
Niña” events, the opposite is true. Studies of throughflows from the Pacific to the Indian
Ocean during El Niño and La Niña events are lacking (Allan and Pariwono 1990). The
interplay of monsoon seasons and ENSO events provide a complex oceanography in
Southeast Asia that is not yet fully understood.
2.2.2.3 Tropical cyclones
Tropical cyclones are non-frontal low pressure systems of tropical origin with organised
convection (thunderstorm activity) and definite surface cyclonic wind circulation
(AOML 2003). They are significant weather systems in the tropics (AOML 2003). In
latitudes between 9°-20° N or S, tropical cyclones form over warm ocean water greater
than 26.5 ° C, and develop from existing cloud clusters (Puotinen et al. 1998). In the
northwestern Pacific, the cyclone season is from May to November, while in the
southwest Pacific it is from November to April.

Physical environment
18
These weather systems are significant for the Philippines. This country receives an
average of 21 cyclones (typhoons) a year. Cyclones cause substantial reef damage and
massive freshwater runoff (Puotinen et al. 1998).
2.3 ARE PRESENT CLIMATE AND OCEANOGRAPHIC PATTERNS
SIMILAR TO THOSE OF THE PAST?
Oceanographic and climatic conditions in the past may help to explain the high species-
richness and distribution of marine biota in the western Pacific. Knowledge of past and
present climate and oceanography is important to an understanding of the biogeography
and dynamics of extinction and colonisation rates of the Pacific islands. Little
information is available on past wind and current patterns in the Southeast Asian region.
The limited evidence suggests that similar patterns to that of today occurred during the
past 30 million years (Houle 1998).

Physical environment
19
Physical environment
20
2.4 DISCUSSION
2.4.1 The Role of Islands in the Biogeography of the IWP
An understanding of the tectonic history of Southeast Asia is necessary to understand
the biogeography of the IWP. The ranges and patterns of distribution of terrestrial
plants and animals in the region suggest that biotic exchanges between Australia and
Asia were relatively recent. Such exchanges likely resulted from the collision of
Australian and Eurasian landmasses in the Miocene to mid-Pliocene. This brought two
distinct biotas into contact. This boundary between these two distinct biotas is called
Wallace’s Line, a boundary essentially determined by plate tectonics (Audley-Charles
1981). While the collision may have allowed filtered dispersal of terrestrial biota
between Asia and Australia, the islands in Southeast Asia may have been barriers to
dispersal of marine biota between the Indian and Pacific Oceans (Marsh and Marshall
1983; Wallace 1997). The Southeast Asian islands prevent the free exchange of Pacific
and Indian Ocean water. Pacific and Indian Ocean water can only exchange through the
Sulu Sea and the Makassar Trough. Genetic structure of populations of the asteroid
Linckia laevigata suggests that present day ocean currents do not facilitate long-
distance dispersal through the Indonesian Archipelago (Williams and Benzie 1998;
Barber et al. 2000). In mantis shrimps, the geography of genetic differentiation is
coincident with Wallace’s Line, thus suggesting genetic isolation of populations in
Indonesia ( Barber et al. 2000).
The presence of Australian biota in the Philippines (e.g. the plants Eucalyptus,
Casuarina, Agathis and the parrots Cacatua and Loriculus) is consistent with tectonic
history (Hall 1998). Australian biotic affinities in the Philippines are strongest in eastern
Mindanao, but also extend to the Visayas and southeastern Luzon. Australian floral
affinities are absent in Palawan. Dickerson (1927) hypothesized the diffusion of
Australian biota into the Philippines from Sulawesi via New Guinea. However, the
absence of recent or ancient land bridge connections from Australia, New Guinea and
Sulawesi to southern Philippines does not support this theory. The present distribution
of Australian biota in the Philippines is easily accounted for by Hall’s tectonic model.

Physical environment
21
On the other hand, islands may act as stepping-stones for the dispersal of marine species
(Williams and Benzie 1998) or act as refuges during sea level changes (Paulay 1990;
Leal 1991). This repeated historical isolation of marginal ocean basins may have
contributed to the high species-richness of reef corals and molluscs (McManus 1985;
Pandolfi 1992). Williams (1998) suggests that the genetic similarity between Western
Australian and Philippine Linckia populations is due to wide-scale genetic exchange
during the Pleistocene, or due to a continuing genetic exchange between the two regions
facilitated by island hopping through Indonesia. This suggestion is supported by
patterns of distribution of echinoderms in Western Australia (Marsh and Marshall
1983).
The role of islands in biogeography is clearer in terrestrial than marine biotas. There are
a number of different views on the role of islands in marine biogeography. These views
propose that islands are stepping stones (Williams and Benzie 1998; Zapata and Herrón
2002) or barriers to further dispersal, and thus promote population isolation even in
widely dispersive species (Endriga 2001; Taylor and Hellberg 2003). A potentially
fruitful approach would be to apply identical analyses to different marine taxa. Genetic
data suggests that populations on islands often experience strong variations in
population size. This reduces genetic variation (e.g. heterozygosity) and increases
susceptibility to extinction (Palumbi 1997; Benzie 1998). Thus, remote islands often
have lower species-richness. However, life history and ecological characteristics of the
marine taxon must also be considered, in addition to the location, origin and physical
conditions of the islands themselves.
2.4.2 The Role of Physical Oceanography in the Biogeography of the IWP
The island system in Southeast Asia favours the development of strong surface
circulation, as some straits and passages are aligned with the prevailing northeast and
southwest monsoons (Wyrtki 1961). Furthermore, since the wind systems are relatively
constant, surface circulation is strongly coupled with the monsoons . Monsoon systems
are also rain-bearing systems. High rainfall and river runoff causes surface salinity to be
less than 34 ppm in wide stretches of inter-island water. The configuration of islands in
the region prevents dispersal of low salinity water. This results in extremely variable

Physical environment
22
physical conditions of surface waters. In areas where tidal amplitudes and currents are
low, these low salinity conditions may persist until the next monsoon.
2.4.3 The role of The Monsoons in the Biogeography of the IWP
The monsoon is the major climatic factor of ecological significance in the region (Sharp
1996). Monsoons are a major influence on the distribution and community structure of
corals and other benthic life (Uychiaoco et al. 1992). The reversing wind and current
systems generally are a greater influence on biota than ENSO events (Roy 1996).
2.4.4 Arcuate distributions, tectonics, paleooceanography and paleoclimate.
The Philippines is at the centre of taxonomic richness in the Indo-Pacific. Was this
caused by oceanographic patterns in the past, tectonic history, or both?
Both are responsible for the pattern (Hall 1998). The importance of tectonics is far
from clear, however (Hall 1998). A more important question is why this pattern has
been maintained, since modern conditions seem suitable for species to extend their
ranges to the west, beyond the IWP. Habitat availiablity may maintain the pattern
(McManus 1985). However, further biogeographic evidence may improve understanding
of what maintains the high species richness in the IWP. This thesis attempts to provide
such evidence.
2.5 CONCLUSION
The factors maintaining high species richness of marine biota in Southeast Asia have
been reviewed many times (Endean et al. 1956a; 1956b; Vermeij 1978; Pielou 1979;
Radovsky, Raven et al. 1984; McManus 1985; Briggs 1987; Rosen 1988; Heads 1990;
Hengeveld 1990; Kay 1990; Kohn 1990; Wallace 1991; Briggs 1992; Pandolfi 1992;
Kohn and Perron 1994; Veron 1995; Stevens 1996; Palumbi 1997; Johansson 1998;
Williams and Benzie 1998). A variety of historical and ecological hypotheses have
been proposed to account for present distributions of marine taxa. None of these
hypotheses are mutually exclusive. Topography and the unique archipelagic

Physical environment
23
configuration of the region have provided an environment that allows for rapid species
diversification and persistence. Habitat heterogeneity, resulting from complex
topography, geological history and climate is likely to be a major factor maintaining
high species richness in the IWP.

Materials and methods
24
CHAPTER 3
Materials and Methods of Biogeographical Analyses
This chapter presents materials and methods applicable to range and distributional
analyses in Chapters 4 to 7.
3.1 MATERIAL
3.1.1 NATURE OF BIOGEOGRAPHICAL DATA
This study uses two kinds of data. Primary data refers to original field observations,
collections and studies by the author, and information from museum material that I
consulted. This data is used primarily for taxonomic and biogeographic analyses.
This data permits direct and detailed comparisons of species assemblages between
geographic regions. The data is recorded as presence/ absence or frequency of
occurrence. This permits statistical analyses of distributions, assemblages and ranges.
Secondary or reference data are from studies by other systematicists and taxonomists
on taxa under study in the Indo-Pacific. These are in the published literature, in
printed or electronic form, and are cited. These studies are used to determine species
distributions, ecological characteristics, and presence/absence, if the study had this
kind of information. If the information concerning occurrence can be referenced to
actual material in a publicly accessible museum collection, the presence or absence
information was included for statistical analyses.
3.1.2 Primary Material
The distributions of recent Nerita, Clypeomorus, Littorinidae, rapanine and
ergalataxine Muricidae in the Philippines were determined by consulting records and
lots deposited at the Philippine National Museum (PNM) in Manila, and the
University of the Philippines (UP). In addition, field collections were made between
December 1997 and June 1998. Philippine National Museum records for the taxa

Materials and methods
25
under investigation consisted of 2595 lots. These lots were collected between 1947
and 1998 from 250 sampling locations. The location of these collection sites ranged
from 21° to 4° N and 117° to 126° E. This effectively covers the length and breadth of
the Philippine archipelago (Figure 3.1).
Private collections belonging to the Pontifical University of Santo Tomas in Manila
were consulted to validate distribution records collected during the Spanish colonial
period from 1758-1896.
Conus Seven hundred and sixty two records of occurrence of shallow water Conus
belonging to 180 species, were obtained from the collections of the Philippine
National Museum (PNM), the University of Santo Tomas (UST) and the University of
the Philippines (UP). Secondary material consisting of 363 records was obtained from
Cabrera (1984), Springsteen and Leobrera (1986) and Kohn and Perron (1994). These
records were collected from 1898-1998. The locations where the specimens were
collected were plotted on a map.
Oliva
Only primary material deposited at the Delaware Museum of Natural History,
Wilmington, DE USA was used. Five hundred ninety seven (597) lots of Philippine
Oliva, belonging to 29 species, were examined for this study.
3.1.3 Secondary Material
Secondary data sources were used to create a more detailed picture of general
distribution and range. While published shell catalogues were initially consulted for
distribution analysis, their utility was limited in most cases, since the authors often did
not state explicitly the collection site for the figured types in the catalogues. At best
these catalogues gave a general regional distribution of the gastropod species. Other
more useful sources of secondary data were published taxonomic monographs and
Materials and methods
26
Ph.D. theses that included ecological and field descriptions of the species under
investigation.
Secondary data sources assisted in estimates of geographical range. Knowledge of the
species composition of molluscan assemblages in the archipelago is due largely to
extensive collection during the first 20 years (1898-1918) of United States sovereignty
in the country. Types were deposited in the United States National Museum of
Natural History and the PNM. The PNM collection was destroyed in World War II.
Most of the types were lost. This study therefore, derives primary and secondary
material from 100 years of sampling effort.
3.1.4 Maps
Published distribution maps, that used occurrence information, were used to help
confirm data from primary and secondary material.
3.2 METHODS
3.2.1 General Assumptions about Sampling Effort
A major assumption of this thesis is that effort made collecting primary and secondary
material in the Philippines is comparable among the different geographical units.
However, analysis of sampling effort reveals that the eastern Philippine (Figure 3.1)
and southern Mindanao bioregions have been poorly sampled. Operating
geographical units (OGU), or bioregions, with less than 5 collection sites were not
included in analyses.
3.2.2. Definition of species richness
Species richness is defined as the number of species in a given region (Lincoln et al.
1998).
3.2.3 Definition of Operating Geographical Units and their properties

Materials and methods
27
Operating geographical units (OGU) were defined as coastlines between 100 to 300
kilometres in length for the large Philippine islands, and between 60 to 99 kilometres
in length for the smaller Philippine islands. Each OGU had 5 or more sampling
locations. Appendix 2.1 details the characteristics of each OGU.

Materials and methods
28

Materials and methods
29
3.2.4 Properties of OGU assemblages
Each OGU had records of species occurrences. The composition of these occurrences
was defined as an assemblage.
3.2.5 Frequency of occurrence
The frequency of occurrence of each species records the number of times the species
was collected or recorded from an OGU. This is not a measure of abundance.
Occurrence frequency may partially reflect abundance. Species with large ranges tend
to have higher abundances, and thus higher frequencies of occurrence (Brown 1995),
if it is assumed that species have equal access to resources (Maurer 1999).
Frequencies of occurrence are important in subsequent ordination methods. It is
highly probable that sites will have different occurrence frequencies, due to varying
ecological conditions. Suitable environments that enhance species persistence can
vary over a geographic range of a species (Maurer 1999).
3.2.6 Relational Databases
Occurrence records were entered into a relational database. The database Range was
used for Philippine upper and mid intertidal taxa. The databases were used to organise
information for biogeographic analyses.
The database PhilCone was created to organise information for biogeographical
analyses of Philippine Conus species. A printed copy of the database is provided in
the thesis in Appendix 5.
3.2.7 Areography: range shape, size and characteristics
This study focuses on the geometry and areal extent of a species range. The study of
geometry and size of the species range with respect to ecological factors is

Materials and methods
30
areography (Rapoport 1982) Species occurrences from primary and secondary
sources were mapped. These were queried from records in the relational databases.
3.2.7.1 Total Area of the Philippines
The total area of the Philippine archipelago was defined by its political boundaries,
omitting the Kalayaan Islands. The Kalayaan Islands were not included for the
following reasons
1. From 1900-1965, when most of the primary and secondary data used in this thesis
were collected, the Kalayaan Islands were not formally considered part of the
Philippines. They were thus not sampled by United States surveys, and the
surveys of the Philippine National Museum.
2. The Kalayaan Islands are a geographic unit distinct from the main Philippine
archipelago, and are not high islands.
3.2.7.2 Measurement of range area (Figure 3.3)
Occurrence records were plotted on maps to estimate range within the Philippines. A
range is defined as a shape determined by at least 2 occurrences. Thus in the most
simple case, a range is a line. In other cases, the range is a complex polygon. Since a
line has no second dimension, a linear range is defined as the number of grids (0.5
cm2, 1:5,563,432) it intersects on a map, expressed in square kilometres. It may be
considered as a narrow polygon of one grid width. For disjunct distributions, each
range is treated as a separate range for analysis. To determine the shape and size of
the range, the mean maximum north-south and east-west axes were measured in
kilometres. These values were then log transformed and plotted.
A shape index for each range was defined. This was:
SI = E/N Equation 3.1

Materials and methods
31
where SI is the shape index, E is the mean maximum east-west axis length, and N is
the mean maximum north-south axis length. An index of less than 1 indicates a
primarily north-south orientation of the range. An index of greater than 1 indicates a
primarily E-W orientation

Materials and methods
32

Materials and methods
33
3.2.7 Measures of landscape topography:
3.2.7.1 Coastal length, area and index of coastal complexity
The coastline was quantified in terms of both length and complexity. Coastal length
(km) was measured from digitised equal area projection maps. Coastal complexity is a
function of coastal length and the number of embayments along the coastline. An
embayment is an indentation of the coastline defined by two headlands. This is an
important property of each OGU, as it likely relates to habitat complexity. The
number of embayments along a coast was quantified from published maps. The
complexity index is given by the equation:
C = E/L Equation 3.2
where C is complexity, L is coastal length based on an equal area map projection
(1:5,562,432) and E = number of embayments. An embayment is defined as an
indention the coastline, defined by at least two headlands.
One major limitation of defining coastal area of the Philippine coastline is the lack of
information from digitised maps. Digitised maps provided by the Philippine National
Mapping and Resource Information Authority (NAMRIA 1998) measure only coastal
length. Calculations of coastal area were not available. Since there is no coastal area
estimates for Philippine OGU based on digitised maps, an assumption was made. The
coastal length multiplied by 1 km as measured from the shore was used to represent
coastal area. In the very few cases where coastal area estimates were available, these
were used. This assumption is a major limitation since 1) areal coverage of intertidal
environments was not available 2) it is safe to assume that in most cases, rocky
intertidal environments do not extend more than 1 km from shore. Thus, this may
overestimate coastal area.
3.2.7.2 Island topography
Estimates of island areas and coastal length in kilometres were gathered from the
National Mapping Resource Agency and the Philippine Coast and Geodetic Survey.

Materials and methods
34
Where area estimates are given in Imperial measures, these were converted into
square kilometres. Additional information on islands was collected from the United
States Coast Pilot, and charts of the Philippine Navy
.3.2.7.3 Distribution of coral reefs
In view of the lack of detailed estimates of coral reef area in any country (ReefBase
1998), linear estimates of coral reef area were made from published maps in the
Philippines, provided by the World Conservation Monitoring Centre (WCMC) (Burke
et al. 2002). These maps are one of the utilities in the ReefBase 3.0 database.
Estimates are presented as a percent of the OGU coastline.
3.2.8 Ecological relationships: ordination and correlation analyses
Principal components analysis (PCA) was used to examine distribution patterns in
ordination space. PCA allows for capturing the general pattern of groupings based on
frequency of occurrence without the assumption of a priori groups. Correlation
analysis was also used to examine the significance of ecological factors (see below)
on species-richness. The PCA measured the properties of sites (OGU). Each site has
an assemblage of species with differing occurrence frequencies.
The geographical and ecological factors used in the ordinations and correlations were
latitude (degrees), longitude (degrees), annual rainfall (mm), island and mainland
landform, cyclone frequency (number/year), dry season (presence or absence), wet
season (presence or absence) coastal length (km), coral reef area (percent of OGU
coastal length), coastal complexity index, tidal amplitude (m) and sea surface
temperature (°C). These data were collected from publicly accessible databases and
published material of the Philippine National Mapping and Resource Information
Authority (NAMRIA 1998), Philippine Atmospheric and Geophysical, Astronomical
Sciences Authority (PAGASA 1992; PAGASA 1998), the Philippine Navy, the
World Conservation and Monitoring Centre (WCMC) and ReefBase (ReefBase
1998). All data were transformed as z scores to remove the effects of scale. Z-scores
normalize each observation with reference to the population mean. Thus the effects of
scale are removed.

Materials and methods
35
3.2.9 Species-area analysis: provinciality and homogeneity
Species-area relationships can be used to infer a variety of biogeographical processes
(Rosenzweig 1995) at different temporal or spatial scales. In this study, species-area
relationships were used to infer present isolation of marginal oceanic basins. The
partitioning of a biotic area into two or more isolated regions consequently results in a
smaller area. Isolation promotes speciation. Since the basin isolation hypothesis
predicts increased rates of speciation, reconnection of the basins may result in species
loss (McKinney 1998). This species loss will be observed as biotic homogenisation
and consequent loss of provinciality. Rosenzweig (1995) suggests that geographical
isolation can be predicted from the parameters of the species-area curve
S= cAz Equation 3.4
where S is the measured species richness, A is area occupied by the species, c is a
constant and z the exponent of the curve The parameters of the species-area curve
were estimated using the power function routine in Microsoft Excel.
Using parameters estimated from the species-area curve, Rosenzweig’s provinciality
or geographic index of isolation (McKinney 1998) was used to measure differences in
gastropod assemblages in the Philippine marginal oceanic basins. The index is:
P = (Az + Bz)/Dz Equation 3.5
where A and B are the coastal areas of adjacent OGU, and D is the total coastal area
of the regions sampled within the Philippines. Z is the exponent of the inter-oceanic
basin species-area curves. It is also possible to calculate basin provinciality by
comparing the SPAR properties of a basin with that of the whole Philippines:
Pb = Bz/Dz Equation 3.6
where Bz is the basin area and D is the total coastal area of the regions sampled within
the Philippines. In comparing basin provinciality, Equation 3.6 was used.

Materials and methods
36
To get a measure of biotic homogenisation (H), the inverse of P (in eqn 3.6) was
calculated. If biotic isolation is observed, then the resulting biotic homogeneity
indices will be low. P estimates greater than 1 suggest provinciality.
The species-area curves in each oceanic basin incorporate evolutionary isolation,
diversification, or the presence of relict species. Thus z differences between basins
suggest that the basins have been isolated. This is tested by ANCOVA, with basin
effect as the fixed factor, and coastal area as the covariate. ANCOVA tests the
homogeneity of regressions and determines if there are significant differences in
slopes (z) and intercepts of regressions.
3.3 INTRODUCTION TO THE GASTROPOD TAXA INVESTIGATED
3.3.1 Herbivorous Taxa
3.3.1.1 The Nerites – Nerita (Neritidae)
The Neritidae is a family of intertidal, marine, mainly tropical, neritopsoid gastropods.
They are characterised by a globose, porcellaneous shell, with a moderately elevated
to flat spire. Sculpturing varies from heavy cords to none. The columellar deck is flat
and strongly to weakly dentate. It may be pustulose to smooth. The lip may be strong
to weakly dentate. The operculum is calcareous, granulate in all subgenera except
Linnerita, and has a distinct appendage or peg that enables the animal to close its
aperture to prevent desiccation and thermal stress.
The taxonomic unity of the Neritidae is well established (Vermeij, 1984). However,
the present subgeneric classification is not widely accepted (Krijnen 1997). Vermeij
(1984) reviewed the taxonomy to the subgeneric level, and erected a new subgenus,
Linnerita, characterised by a smooth operculum and the absence of a heavy
sculpturing on the shell. Vermeij proposed that this subgenus was a specialised clade
that had a short fossil record and unusual behavioural characteristics (Vermeij 1984).

Materials and methods
37
Partitioning of resources in space and in time enable sympatric species of nerites to
co-occur on rocky shores. Clustering, a common behaviour, reduces emersion stress
and mortality rates (Vanini and Chellazi 1978; Garrity 1984; Blasini 1968) Clustering
thus reduces energetic costs over a tidal cycle (Chellazzi et al. 1985). Size selective
feeding and differential movement patterns allow different size classes to minimise
competition. Space is often partitioned with respect to exposure and tides, with
several species occupying distinct shore positions. Vertical distributions can vary
seasonally. Such temporal variation is called “dynamic zonation” and is particularly
obvious on tropical shores with strong monsoonal influences (Ruwa and Jaccarini
1986).
Scott (1998) reviewed the reproductive anatomy of the Neritidae. Reproduction in
nerites is poorly known. Early studies focused on reproductive anatomy (Govindan
1974; Miskiewicz 1980). Indo-west Pacific species are planktotrophic, with one
lecithotrophic species (Knudsen 1997). Some Atlantic species may have
lecithotrophic development (Leal 1991).
Gradients of exposure and habitat heterogeneity can influence species distribution on
a local scale. Some species can occupy sheltered shores with mangroves. Mangrove
areas and protected shores have the greatest species richness of neritids. These
environments are heterogeneous, with varying salinity. These habitats may have
provided greater resources for nerites to undergo adaptive radiation, and to colonise
vacant niches in adjacent freshwater environments. Neritina, Neritodryas , Septaria
and Clithon are representative genera of the family in these environments
(Springsteen and Leobrera 1986).
The Neritidae is an ancient family, with a fossil record dating back to the Triassic
(Scott 1998). However, since the rocky intertidal is not a depositional environment,
the fossil record is unclear. There is fossil evidence that the modern subgenera Ritena
and Amphinerita have existed from the Cretaceous, and that their ecological
characteristics are similar to that of today. The existence of nerites in paleontological
facies is thought to indicate the presence of tropical climates (Saul and Squires
1997).

Materials and methods
38
3.3.1.2 Rock-creepers – Clypeomorus (Cerithiidae)
The rock-creepers are an endemic Indo-Pacific genus within the family Cerithiidae.
Houbrick (1985) reviewed the taxonomic status, distribution and general ecology of
these gastropods. He identified 12 extant species, with 3 subspecies. The external
shell features of Clypeomorus resemble the features of other cerithiid genera. The
diagnostic character is the operculum.
Many present day rock-creepers stem from a major Miocene-Pliocene adaptive
radiation of the cerithiid family to a rocky intertidal habitat. The ancestral stock was
likely to be Cerithium, an extant genus dating back to the Cretaceous and found in
sandy to muddy intertidal substrates. Clypeomorus is found in the mid or high
intertidal, where it is a microphagous herbivore (Houbrick 1985).
3.3.1.3 Tropical Periwinkles – Littoraria, Nodilittorina, Echininus and Tectarius
(Littornidae)
Littorinidae are found worldwide on rocky shores of all exposures. Shells are small to
medium, turbinate or trochoidal, spirally grooved and variable in colour (Reid 1989;
1996) Because of their abundance and ease of collection, the ecology, behaviour,
vertical distribution and genetics of the family, especially of the temperate species,
has been well studied. Reid (1986) revised the L. scabra complex in Littoraria. All
littorinids are herbivores.
Common tropical genera include Littoraria, Nodilittorina and Tectarius. Littoraria
and Tectarius are found on shores of all exposures, and are particularly common on
mangrove and sheltered shores. Littoraria has achieved substantial evolutionary
radiation in mangroves, with twenty species recorded (Reid 1986). These genera have
varied life histories, with both planktotrophy and non-planktotrophy observed in
Littoraria. Planktotrophy and non-planktotrophy are also likely in Tectarius and
Nodilittorina (Rosewater 1970a; Rosewater 1970b). Shell morphology is relatively
constant in both oviparous and ovoviviparous Littoraria. There is no correlation
between size of geographic range and life history strategy (Reid 1986). However even

Materials and methods
39
for widely distributed species, considerable character differences can be observed,
thus suggesting population isolation due with distance.
3.4.2 Carnivorous Taxa (Caenogastropoda)
3.4.2.1 Rock-shells and whelks – Morula, Cronia, Ergalatax, Muricodrupa, Thais,
Manicinella, Purpura, Drupa (Muricoidea: Muricidae subfam. Rapaninae and
Ergalataxinae)
The Muricidae, and members of its superfamily Muricoidea, are the dominant group
of carnivorous molluscs on rocky shores. A large and diverse marine group, the
muricoideans are typically elongate, fusiform to ovate, with an elongate spire and an
anterior siphonal canal (Ponder 1998). The larval phase is variable, ranging from
planktonic to intracapsular development. Consequently the protoconch structure is
diverse.
The intertida taxa of Rapaninae (=Thaidinae or Thaidididae) are treated in this study
as a subfamily (Kool 1993; Ponder 1998). Earlier authors have given this group full
family status. Ponder (1998) considers the group to differ from the rest of the muricids
in only minor ways.
The ecological positions of the Rapaninae and Ergalataxinae are similar in all
environments. As obligate carnivores, they feed on bivalve molluscs, gastropods,
barnacles, limpets, polychaetes, and in the case of Drupella, scleractinian coral tissue.
Some species, such as Drupella cornus, are specialist feeders. However many
intertidal genera are generalists, feeding on the dominant food resource available.
3.4.2.2 Cone shells - Conus (Caenogastropoda: Conidae)
Conus is an obligate carnivorous taxon of lower tropical rocky shores. It is often
related closely to the presence of coral reefs. The majority of the estimated 200
species of tropical Indo-Pacific Conus range from intertidal to 30 m depth, and are
associated with coral reefs. Species distributions within the genus range from island
endemism to Indo-Pacific. Information is available on the life history characteristics

Materials and methods
40
of the wide ranging and common coral reef associated species (Kohn and Perron.
1994).
3.4.2.3 Olive shells - Oliva (Caenogastropoda: Olividae)
The Olive shell genus Oliva has 74 recognized species. 35 are found in the Philippines
(Tursch and Greifeneder 2001). Oliva is exclusively carnivorous and sand dwelling. A
majority of species live from 0 to 30 meters depth (Tursch and Greifeneder 2001) and
are associated with coral reefs. Tursch and Greifeneder (2001) report that number of
species generally decreases with distance from the Philippine archipelago.
Observations on the occurrences of Oliva in the Philippines suggest localised
distributions, possibly associated with ocean basins (Springsteen and Leobrera 1986).
More studies on how their distribution, local ecology, and life histories influence
shell shape may help to explain this observation. Intrapopulation variability in shell
shape, colour and general physiognomy has resulted in a confused taxonomy (Tursch
1994; Tursch 1998; Tursch and Greifeneder 2001).

Philippine rocky shore gastropods
41
CHAPTER 4.
Range and Distribution of Rocky Shore Gastropods in the Philippines
“Despite formidable obstacles, much has been gleaned over the years, and slowly but surely, a clearer picture of the distribution characteristics and the biological habitats of molluscs is starting to emerge” – F.J. Springsteen and F.M Leobrera (1986) “Shells of the Philippines”
This chapter describes the range and distribution of some mid to high intertidal rocky
shore gastropod taxa. These taxa are the Neritidae: Nerita, the Cerithiidae:
Clypeomorus, the Littorinidae: Littoraria, Echininus and Tectarius and the Muricidae:
Rapaninae and Erglataxinae, in the Philippines. The species ranges are described and
correlated with ecological factors. These distributions and ranges are examined with
reference to the McManus (1985) basin isolation hypothesis.
4.1 INTRODUCTION
4.1.1 The nature of species ranges
The central aim of biogeography is to understand the causes of patterns of distribution
in space and historical time. Geographical ranges are determined by the response of
species to environmental conditions. This is known as ecological tolerance (Maurer
1999). Range size and shape are relatively easy to measure.
Ranges can be viewed as response surfaces (Hengeveld 1993), reflecting responses to
varying environmental conditions. The risk of extinction, and thus absence, is
greatest at the edges of the range, and much less at the centre. Highest abundance is
often near the centre of a range. Thus, susceptibility to extinction is a function of
range size (Maurer 1999). Changes in abiotic or biotic factors across the range may
result in a gradient in the frequency distribution of occurrences or abundance.

Philippine rocky shore gastropods
42
Analyses of these gradients on a biogeographic scale may allow for the generation of
hypotheses that help explain species presence or absence, and perhaps resistance to
extinction.
4.1.2 Basin isolation
Basin isolation (McManus 1985) is a biogeographical hypothesis that seeks to explain
high marine species richness in Southeast Asia. This hypothesis suggests that repeated
isolation and reconnection of oceanic basins in Southeast Asia, as a result of changes
in sea level, favoured rapid speciation in shallow water marine biota.
An aspect of the hypothesis relates to the nature and patterns of species distributions
and ranges in Southeast Asia, which McManus (1985) described as arcuate (arc-
shaped) and overlapping. These distributions are particularly unique to the region.
McManus lists several factors potentially causing such distributions. These include
geological history, habitat heterogeneity, landform configuration, and the prevailing
climate system. An examination of species distributions and ranges in the Philippines
may help evaluate the hypothesis.
4.1.3 The Philippines as a geographic unit in which to test biogeographic
hypotheses
The Philippines, the centre of terrestrial and marine biotic species diversity, is a
unique environment in which to test biogeographic and evolutionary hypotheses. The
country is the only archipelago with a N-S orientation in the Southeast Asian region.
The country is shaped like a triangle. The geologic evolution of the Philipiines,
especially the different ages of the islands and the different degrees of isolation of the
oceanic basins in the arhipelago (see Chapter 2), are unique properties. These
properties have been used to assess species diversification in terrestrial mammals
across islands of different geological ages (Heaney 1986).
The major climatic and oceanographic systems, the monsoon and its consequent
reversing current systems, are believed to be major factors affecting the distribution of
shallow water marine biota. The monsoons and reversing current systems are further

Philippine rocky shore gastropods
43
complicated by the presence of topographically complex islands and coastlines.
These factors are investigated in detail, using a primarily exploratory approach, to
determine patterns of species occurrence and occurrence frequencies in different
intertidal rocky shore gastropod assemblages.
In the past, researchers have treated the Philippines as one geographic unit in
biogeographical investigations of a larger region (e.g. Indo-West Pacific). This study
describes patterns of distribution of gastropods within the island and regional groups
of the Philippines. This approach hopefully will enable a clearer understanding of the
nature of marine species richness in the Philippines.
4.2 MATERIAL
The selection of primary and secondary material, including maps of the location of
collection sites used in this biogeographic analysis is described in Chapter 3. The
material is based on museum record collections and secondary material in published
papers, books and monographs. Each record makes up an occurrence. A geographical
region may have several occurrences of a species and this is defined as a frequency of
occurrence.
4.3 METHODS
The methods for this chapter are described in Chapter 3. These include methods of
determining the size and shape of species ranges, description of ecological factors
correlated to range sizes and shapes, analyses of species–area relationships, and
provinciality. The main method of data analysis was principal components analysis
ordination
In general, the geographic range of each species was defined on an equal-area map
from frequency of occurrence information. The size and shape of the range was
determined using areographical methods (Rapoport 1982) Species-area relationships
of the various taxa were plotted by fitting the data using the power function in

Philippine rocky shore gastropods
44
Microsoft Excel. The species-area parameters were used to calculate provinciality,
that is, a measure of faunal uniqueness. Principal components analysis was used to
determine if there are patterns and relationships in the frequency of occurrences and
geographical ecological factors.
4.4 RESULTS 4.4.1 Ranges Figures 4.1a-h show the ranges of representative taxa within the Philippines. The
ranges generally follow the shape of the archipelago. There are species that are found
only along the western side of the Philippines (Clypeomorus nympha (Figure 4.1a) C.
irrorata (Figure 4.1b) Nerita picea (Figure 4.1c), Cronia auriantiaca (Figure 4.1f)
and Echininus cumingi spinulosus (Figure 4.1h)
There are species that are restricted to the central Philippines. (Clypeomorus adunca,
Nerita antiquata, Nerita n. sp. Morula musiva and Thais armigera). Other species
have disjunct distributions (Nerita exuvia, Nodilittorina leucosticta biangulata and
the two subspecies of Echininus cumingi) With the exception of N. exuvia, these
species are not found the central Philippines. The other species investigated have pan-
Philippine distributions.
Most of these ranges are triangular and follow the general orientation of the
archipelago. The ranges that are restricted to the central Philippines follow the
coastline of the islands or embayments where they have been recorded. Species that
have mainly western Philippines distribution show a curved range that also follows
the general orientation of the islands.

Philippine rocky shore gastropods
45

Philippine rocky shore gastropods
46

Philippine rocky shore gastropods
47

Philippine rocky shore gastropods
48

Philippine rocky shore gastropods
49

Philippine rocky shore gastropods
50

Philippine rocky shore gastropods
51

Philippine rocky shore gastropods
52

Philippine rocky shore gastropods
53
4.4.2. Ecological corrrelates of ranges
4.4.2.1 Ordination analysis Tables 4.1 a-d show results of the principal component analyses for 5 taxa. Many of
the principal axes account for relatively small amounts of variance in the data (eg 27-
35% for axis 1). Table 4.1e shows the Pearson and Kendall correlations of OGU
assemblages with ecological factors. For the Littorinidae, latitude is the main
ecological correlate with frequency of occurrence (Figure 4.2). Nerita frequency of
occurrence is correlated with longitude and on the 3rd and 2nd principal components,
with dry and wet seasons (Figure 4.3 a-c). Clypeomorus has reef distribution, tidal
amplitude and latitude as major correlates of frequency of occurrence (Figure 4.4).
The upper and mid-intertidal Muricidae has sea temperature and tidal amplitude as
major correlates (Figure 4.5).
Latitude, cyclones and SST differences correlate best with frequency of occurrence of
Littorinidae. In Clypeomorus, reefs may provide a habitat that determines the species
composition of assemblages. Tidal amplitude is also an important correlate that
determines frequency of occurrence, but this is strong only in PC axis 2 where its
correlation is -0.544 (Table 4.1e). In Nerita, tidal amplitude is not an important
correlate with frequency of occurrence. Rather, the length and duration of the
monsoons, as reflected in the dry and wet season variables and longitude do correlate
well with frequency of occurrence. The effects of monsoons in the Philippines are
correlated with island landform and tend to be attenuated by longitude. In general, the
western coastlines experience the strongest monsoon influence in the summer and the
eastern coastlines experience strong monsoons in the winter. The central islands have
varying exposures to the winter and summer monsoons.
The PCA axes in the analyses do not account for a large fraction of the variance. The
main reason for this is that the ecological correlates represent a mean value for the
region (OGU) concerned. There were no ecological data for sites within an OGU. If
these were available, then a large part of the variance may have been accounted for,
and a more robust PCA would result. This is an unavoidable limitation. However, the
main objective of the study was to demonstrate a gradient in species composition, and
occurrence frequency in the ordination.
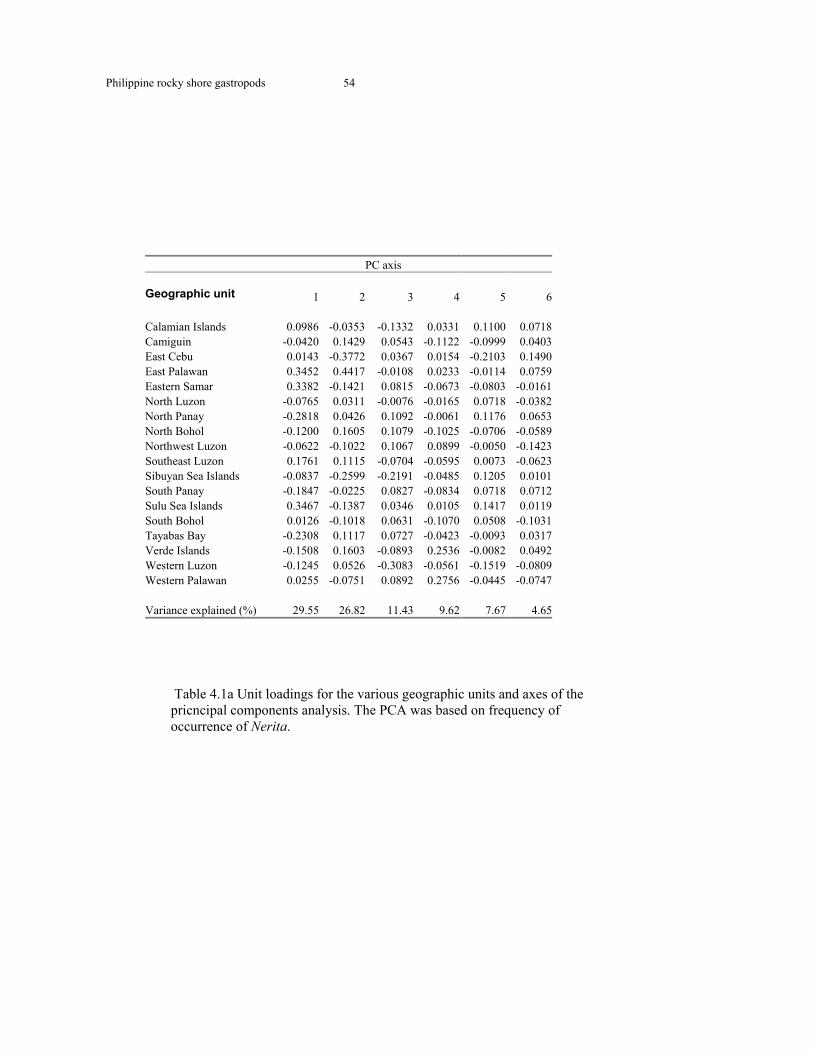
Philippine rocky shore gastropods
54
PC axis
Geographic unit 1 2 3 4 5 6 Calamian Islands 0.0986 -0.0353 -0.1332 0.0331 0.1100 0.0718Camiguin -0.0420 0.1429 0.0543 -0.1122 -0.0999 0.0403East Cebu 0.0143 -0.3772 0.0367 0.0154 -0.2103 0.1490East Palawan 0.3452 0.4417 -0.0108 0.0233 -0.0114 0.0759Eastern Samar 0.3382 -0.1421 0.0815 -0.0673 -0.0803 -0.0161North Luzon -0.0765 0.0311 -0.0076 -0.0165 0.0718 -0.0382North Panay -0.2818 0.0426 0.1092 -0.0061 0.1176 0.0653North Bohol -0.1200 0.1605 0.1079 -0.1025 -0.0706 -0.0589Northwest Luzon -0.0622 -0.1022 0.1067 0.0899 -0.0050 -0.1423Southeast Luzon 0.1761 0.1115 -0.0704 -0.0595 0.0073 -0.0623Sibuyan Sea Islands -0.0837 -0.2599 -0.2191 -0.0485 0.1205 0.0101South Panay -0.1847 -0.0225 0.0827 -0.0834 0.0718 0.0712Sulu Sea Islands 0.3467 -0.1387 0.0346 0.0105 0.1417 0.0119South Bohol 0.0126 -0.1018 0.0631 -0.1070 0.0508 -0.1031Tayabas Bay -0.2308 0.1117 0.0727 -0.0423 -0.0093 0.0317Verde Islands -0.1508 0.1603 -0.0893 0.2536 -0.0082 0.0492Western Luzon -0.1245 0.0526 -0.3083 -0.0561 -0.1519 -0.0809Western Palawan 0.0255 -0.0751 0.0892 0.2756 -0.0445 -0.0747 Variance explained (%) 29.55 26.82 11.43 9.62 7.67 4.65
Table 4.1a Unit loadings for the various geographic units and axes of the pricncipal components analysis. The PCA was based on frequency of occurrence of Nerita.

Philippine rocky shore gastropods
55
PC Axis
Geographical unit 1 2 3 4 5 6 Batanes Islands 0.3026 0.3518 -0.0173 -0.2438 0.0165 -0.0846Calamian Islands -0.0760 -0.1433 -0.0267 -0.1181 0.0417 0.1542East Cebu -0.1191 -0.0514 0.0701 0.0505 -0.0887 0.0587West Cebu 0.2695 -0.5152 0.0450 -0.1365 0.2367 -0.0186Davao 0.2488 -0.1468 -0.3105 0.1076 0.0013 -0.0018East Luzon 0.0145 -0.1760 -0.1058 0.0543 0.1199 -0.1731Eastern Samar -0.4698 0.1224 0.2431 0.1107 -0.0164 0.0354Masbate -0.1657 0.1287 -0.0537 -0.2009 0.0388 0.0434North Luzon 0.2293 0.0097 0.2880 0.2003 -0.0034 -0.0165Northwest Luzon 0.3511 0.3740 0.1837 0.0604 0.0633 -0.0015Ragay Gulf 0.2534 -0.2421 -0.0403 -0.0012 -0.4370 0.0504Southeast Luzon 0.0582 0.0784 -0.1573 0.1865 0.1465 0.1260Southern Mindanao -0.0423 0.0833 -0.0933 0.0547 -0.0390 -0.0157Southern Palawan -0.3831 -0.1006 0.1145 -0.0188 -0.0589 -0.1814South Panay -0.2480 0.0492 -0.0932 0.0004 -0.0599 -0.0748Sulu Sea Islands -0.1944 0.1366 -0.2921 0.1369 0.0255 -0.0251Southwest Luzon 0.0721 0.0827 0.0788 -0.2651 -0.0451 -0.0065Southwest Mindanao -0.2772 -0.0261 -0.0886 0.0193 0.0746 0.1121Verde Islands 0.1582 0.1664 -0.2603 0.0184 -0.0675 -0.0613Western Luzon 0.1087 0.0792 0.1798 0.0789 0.0753 0.0056Western Negros 0.2386 -0.1318 0.2151 0.1286 -0.0244 0.0036Western Palawan -0.0521 0.0348 0.0264 -0.1628 -0.0028 0.1169Samar -0.2774 -0.1638 0.0944 -0.0603 0.0027 -0.0453 Variance explained (%) 34.02 22.63 16.61 10.58 8.93 4.32
Table 4.1b Unit loadings for the various geographic units and axes of the principal components analysis. The PCA was based on frequency of occurrence of Clypeomorus.

Philippine rocky shore gastropods
56
PC Axis
Geographical unit 1 2 3 4 5 6 Calamian Islands 0.0744 -0.0018 0.1567 -0.1297 0.0950 -0.0334East Cebu -0.0188 -0.1845 -0.0364 -0.0790 0.0190 0.0056East Luzon 0.8900 -0.0080 -0.1072 0.0323 -0.0083 -0.0451East Palawan 0.0413 0.1140 -0.0430 0.0683 0.1727 0.3501Eastern Samar 0.0235 -0.3116 0.2086 0.0967 -0.0325 0.0165North Luzon -0.1289 0.2636 -0.0184 0.0881 -0.1576 -0.0321Northwest Luzon -0.1339 0.3712 -0.0791 0.1861 0.0028 -0.0185Southeast Luzon 0.0168 0.0219 -0.2083 0.0639 -0.1331 -0.0683South Panay -0.1160 0.1212 0.0902 -0.1938 0.1130 0.0105Sulu Sea Islands -0.2235 -0.3479 0.0091 0.2593 -0.0634 0.0514Southwest Bohol -0.2038 -0.0844 -0.1775 0.0407 0.2829 -0.2258Tayabas Bay -0.1256 0.1411 0.2131 -0.0448 -0.0883 -0.0532Verde Islands -0.1770 -0.1325 -0.2867 -0.3067 -0.1495 0.0814Western Luzon 0.0817 0.0379 0.2789 -0.0815 -0.0528 -0.039 Variance explained (%) 35.11 18.85 13.35 10.38 7.51 6.95
Table 4.1c Unit loadings for the various geographic units and axes of the principal components analysis. The PCA was based on frequency of occurrence of selected species of Muricidae.

Philippine rocky shore gastropods
57
PC Axis
Geographical unit 1 2 3 4 5 6 Batanes Islands -1.5154 0.0893 0.0250 0.0621 0.0384 0.0423Calamian Islands 0.1045 -0.1336 -0.0543 -0.0424 0.0694 -0.2325Camiguin 0.0955 0.1602 -0.0166 0.0200 -0.0138 -0.1423East Cebu 0.0534 0.3328 -0.7569 -0.4196 -0.0062 0.3133Davao 0.1598 0.4203 0.5430 -0.3530 0.5479 0.2496East Luzon 0.1194 0.0576 0.1395 -0.0197 -0.3183 0.1647East Mindanao 0.1211 0.1042 0.1227 -0.0309 -0.2919 0.1312East Palawan 0.0955 0.1602 -0.0166 0.0200 -0.0138 -0.1423East Samar 0.1210 0.1577 -0.0185 0.2093 0.0148 0.0230Masbate 0.1330 0.0578 -0.1090 0.3212 0.1702 0.0271North Luzon -0.0213 -0.7400 -0.1850 -0.2524 0.3848 -0.2527North Panay -0.0482 0.1427 0.0139 0.0220 -0.0457 -0.1218Northwest Luzon -0.0328 -0.0421 0.0725 -0.1013 -0.1065 -0.1714Southeast Luzon 0.0996 0.1436 0.0249 -0.0160 -0.0713 -0.1311Sibuyan Sea Islands 0.0940 0.1530 0.0361 0.0244 -0.0967 -0.0774Southern Palawan -0.0515 0.0890 0.0835 0.0376 -0.1550 -0.0234South Panay 0.1030 -0.1407 -0.0016 -0.0380 -0.0135 -0.1676Sulu Sea Islands 0.1670 -0.1377 -0.1676 0.6448 0.3013 0.2633Southwest Mindanao 0.0955 0.1602 -0.0166 0.0200 -0.0138 -0.1423Verde Islands 0.0124 -0.8890 0.1669 -0.1193 -0.1757 0.3746Western Luzon 0.0946 -0.1455 0.1149 0.0110 -0.2046 0.0158 Variance explained (%) 27.77 21.18 11.52 10.72 9.85 7.01
Table 4.1d Unit loadings for the various geographic units and axes of the principal components analysis. The PCA was based on frequency of occurrence of selected species of Littorinidae.

Philippine rocky shore gastropods
58
Table 4.1e Pearson (r) and Kendall (tau) correlations of Philippine rocky shore gastropod assemblages found in OGUs. Figures in bold represent significant correlations that are shown as vectors in PCA plots.
Taxon Axis 1 2 3 r r-sq tau r r-sq tau r r-sq tauOGU: N = 23
Clypeomorus Wet season 0.107 0.011 0.046 0.368 0.135 0.312 0.128 0.016 0.138Island -0.379 0.144 -0.291 -0.197 0.039 -0.090 -0.049 0.002 0.011Cyclones -0.022 0 0.088 -0.058 0.003 -0.026 0.439 0.193 0.403Rainfall -0.318 0.101 -0.207 0.148 0.022 0.016 0.103 0.011 -0.024Tide -0.193 0.037 -0.119 -0.544 0.296 -0.334 -0.118 0.014 -0.111Latitude 0.494 0.244 0.301 0.402 0.162 0.222 0.417 0.174 0.214Reef -0.493 0.243 -0.362 -0.067 0.004 0.069 -0.094 0.009 -0.028Embayment -0.422 0.178 -0.436 0.172 0.030 0.097 -0.096 0.009 -0.024Complexity -0.332 0.11 -0.328 0.080 0.006 0.162 -0.295 0.087 -0.138 OGU: N = 21 Littorinidae Cyclones -0.349 0.122 0.226 0.085 0.007 0.105 0.293 0.086 0.017SST 0.336 0.113 -0.102 0.004 0 0.082 -0.012 0 -0.073Latitude -0.451 0.204 0.140 -0.370 0.137 -0.072 0.186 0.035 -0.092 OGU: N = 14 Muricidae SST 0.220 0.048 0.179 0.559 0.312 0.380 -0.261 0.068 -0.201Tide 0.493 0.243 0.221 0.167 0.028 0.088 -0.073 0.005 -0.177 OGU: N = 18
Nerita Island 0.107 0.011 0.120 -0.409 0.168 -0.322 0.135 0.018 0.083Rainfall 0.396 0.157 0.112 -0.334 0.112 -0.401 0.167 0.028 0.151Dry season -0.233 0.054 -0.201 0.298 0.089 0.330 -0.543 0.295 -0.410Wet season -0.347 0.120 -0.296 0.003 0 0.031 -0.455 0.207 -0.187Longitude 0.122 0.015 0.144 -0.600 0.360 -0.420 0.400 0.160 0.289

Philippine rocky shore gastropods
59

Philippine rocky shore gastropods
60

Philippine rocky shore gastropods
61

Philippine rocky shore gastropods
62

Philippine rocky shore gastropods
63

Philippine rocky shore gastropods
64

Philippine rocky shore gastropods
65
4.4.2.2 Correlation of species richness and ecological factors (Table 4.1f)
Correlation analysis suggests that area, tides, cyclone frequency and rainfall are
significant correlates (P<0.05) of species richness of Littorinidae and Clypeomorus.
In Nerita, significant correlates of species richness are area (P <0.01), coastal
complexity and coral reef distribution (P<0.05). In Muricidae, only area has a
significant correlation with species richness (P<0.05).
Table 4.1f. Pearson correlation co-efficients of ecological factors with species richness of Philippine rocky shore gastropods.
*significant at (P<0.05) ** significant at (P<0.01)
Eecological factor
Taxon Area Lat Long Tide Temperature Cyclones Rainfall Dry season Wet season Island Reef Embayment Complexity
Clypeomorus *0.586 0.113 -0.384 -0.448 -0.221 -0.023 *-0.503 0.429 0.479 -0.432 -0.261 -0.212 -0.110
Littorinidae *0.555 0.370 0.080 -0.363 -0.457 *0.497 0.278 -0.218 0.069 0.183 0.066 -0.106 -0.106
Muricidae **0.576 0.387 -0.330 0.339 -0.339 0.350 -0.255 0.341 0.241 0.265 0.324 0.241 0.354
Nerita **0.590 *0.523 0.243 -0.081 -0.319 0.188 -0.383 0.050 0.050 -0.095 *-0.588 *-0.520 *-0.567

Philippine rocky shore gastropods
66
Group Linear Polygonal Percent linear By trophic class
Herbivores 2 29 6.45Carnivores 14 34 29.1 By taxon
Clypeomorus 0 8 0Littorinidae 0 8 0
Nerita 2 13 13Muricidae 3 12 20 Group E-W N-S Percent E-W By trophic class
Herbivores 2 29 6.45Carnivores 5 40 11.1 By taxon
Clypeomorus 0 8 0Littorinidae 0 8 0
Nerita 2 13 13Muricidae 2 13 13 Total 8 69
Table 4.2 Summary of range shape and orientation of Philippine rocky shore gastropods.

Philippine rocky shore gastropods
67
Taxon Number of observations R square P value
Clypeomorus 11 0.86 0.0007*** Littorinidae 11 0.79 0.0175* Muricidae 15 0.63 0.0003***
Nerita 14 0.53 0.0030**
Table 4.3 Results of linear regression analysis of frequency of occurrence versus range size in Philippine rocky shore gastropods.
***significant at (P<0.001)
** significant at (P<0.01)
* significant at (P<0.05)

Philippine rocky shore gastropods
68
Clypeomorus Basin Area SR C z P H SitesPhilippine Sea 1294.08 7 0.15 0.56 1.08 0.93 42Visayan Sea 868.22 8 0.002 1.76 3.80 0.26 48Sibuyan Sea 751.12 7 0.13 0.69 1.18 0.85 49Sulu Sea 550.05 6 2.36 0.14 0.66 1.52 70South China Sea 418.38 8 1.51 0.80 1.23 0.81 61Philippines 3812.91 13 0.40 0.44 1.00 1.00 270 Littorinidae Area SD C Z P H SitesPhilippine Sea 561.92 15 0.38 0.11 0.70 1.42 19Visayan Sea 443.10 3 0.38 1.14 1.89 0.53 91Sibuyan Sea 693.73 15 1.81 0.60 1.19 0.84 64Sulu Sea 524.67 11 0.18 0.15 0.73 1.38 47South China Sea 692.83 7 0.18 0.63 1.24 0.81 31Philippines 2916.25 15 0.74 0.37 1.00 1.00 252 Nerita Area SD C Z P H SitesPhilippine Sea 1203.43 8 0.30 0.46 1.00 1.00 35Visayan Sea 671.33 5 0.29 0.54 1.05 0.95 25Sibuyan Sea 912.18 7 0.26 0.61 1.16 0.86 25Sulu Sea 560.32 9 1.06 0.26 0.78 1.28 61South China Sea 723.48 7 0.08 0.75 1.32 0.76 54Philippines 4070.74 13 0.55 0.40 1.00 1.00 200 Muricidae Area SD C Z P H SitesPhilippine Sea 877.08 9 0.01 1.12 1.83 0.55 27Visayan Sea 404.52 6 0.31 1.07 1.52 0.66 15Sibuyan Sea 268.56 4 0.51 1.47 2.02 0.50 20Sulu Sea 442.05 8 0.19 0.82 1.21 0.82 48South China Sea 767.8 10 1.97 0.17 0.66 1.52 28Philippines 2684.67 15 0.29 0.49 1.00 1.00 138
Table 4.4 Area (km2), number of sites, species richness (SR), c and z parameters and provinciality (P) and homogeneity (H) estimates for four rocky shore gastropod taxa in the Philippine oceanic basins.

Philippine rocky shore gastropods
69
4.4.3 Shape, size and characteristics of ranges
Figure 4.7 shows the shape, size and characteristics of the ranges of gastropods
studied. Ranges can be characterised as linear or polygonal. The graph has four
quadrants. Reading the graph clockwise from 12:00, distributions with a primarily N-
S distribution are plotted above the diagonal in the 4th quadrant. Species with narrow
and short ranges are linear, while those with long and wide ranges are polygonal in
the Philippines case, usually triangular.
Carnivorous taxa tend to have a greater percentage of linear ranges than herbivorous
taxa (Table 4.2) Twenty-nine percent of the intertidal rapanine muricid ranges are
linear. Herbivorous taxa are characterised by large polygonal ranges with a north-
south orientation. The majority of the ranges whether linear or polygonal have a
typical N-S axis as a result of the geographical orientation of the islands. There are
curved ranges with an E-W axis for Muricidae.
Regression analyses indicate a highly significant relationship between frequency of
occurrence and range size in all taxa (Table 4.3). The distribution of range size and
species number is skewed to the left (Figure 4.8).

Philippine rocky shore gastropods
70
0
2
4
0 2 4
Log km E-W
Log
km N
-S ClypeomorusNeritaLittorinidaeMuricidae
4 1
2 3
Figure 4.7. Shape of geographical ranges of rocky shore gastropods in the Philippines. A majority of distributions have a polygonal (triangular) N-S orientation. Points above the diagonal in the 4th quadrant are curved shaped with an N-S distribution.

Philippine rocky shore gastropods
71
4.4.5 Species-area Relationship: provinciality and homogeneity
Figures 4.9a-d and Table 4.4 show the results of the provinciality (geographic index
of isolation and consequent faunal uniqueness) analyses, and the parameters of the
species-area curves for the 4 taxa in each oceanic basin. Table 4.5 shows the results of
the ANCOVA on basin species richness.
4.4.5.1 Clypeomorus: Figure 4.9a
Clypeomorus in the Visayas Sea, Sibuyan Sea and South China Sea have high levels
(>1) of provinciality. Provinciality is an index of faunal uniqueness as a possible
result of geographic isolation. A provinciality index of greater than 1 implies that the
fauna is unique The Basin isolation effect on the z parameter of the species-area
function and the covariate area are significant (P<0.05)
4.4.5.2 Littorinidae: Figure 4.9b
Littorinidae in the Visayas Sea, Sibuyan Sea and South China Sea show reasonably
high levels of provinciality. The Basin isolation effect on the z parameter of the
species-area function and the covariate area are significant (P<0.05)
4.4.5.3 Rapanine and ergalataxine Muricidae: Figure 4.9c
Muricidae in all the basins had high levels of provinciality, with the exception of the
South China Sea. The Basin isolation effect on the z parameter of the species-area
function and the covariate area are highly significant (P<0.001)
4.4.5.4 Nerita: Figure 4.9d
Nerita assemblages in the Sibuyan Sea, South China Sea and the Visayas Basin had
lower levels of provinciality compared with the other taxa investigated. The Basin
isolation effect on the z parameter of the species-area function and the covariate area
are highly significant (P<0.001)

Philippine rocky shore gastropods
72
Taxon Factor P from ANCOVA
Clypeomorus Area 0.012*
Basin 0.050* Littorinidae Area 0.030* Basin 0.020*
Muricidae Area 0.001***
Basin 0.019*
Nerita Area 0.000***
Basin 0.130
Table 4.5 Comparisons of the effects of basin isolation and coastal area of the basins on species richness of Philippine rocky intertidal gastropod taxa. Coastal area is used as a covariate.
*significant at (P<0.05) ***significant at (P<0.001)

Philippine rocky shore gastropods
73
a) b) Figure 4.8. Range size frequency distribution and species number of Philippine rocky shore gastropods. a) all range size classes, b) range size classes less than 100,000 sq. km.
0
2
4
6
8
10
12
0 to10
11to20
21to30
31to40
41to50
51to60
61to70
71to80
81to90
91to
100
Range size (thousand sq. km)
Spec
ies
dive
rsity
05
10152025303540
0 to 5
0
51 to
100
101 t
o 150
151 t
o 200
201 t
o 250
251 t
o 300
301 t
o 350
351 t
o 400
401 t
o 450
451 t
o 500
Range size (thousand sq. km)
Spec
ies
dive
rsity

Philippine rocky shore gastropods
74
a) b) c) d)
P
0
1
2
3
4
PS VIS SIB SS SCS PH
Ros
enzw
eig'
s in
dex
P
P
0
1
2
3
4
PS VIS SIB SS SCS PH
Ros
enzw
eig'
s in
dex
P
P
0
1
2
3
4
PS VIS SIB SS SCS PH
Ros
enzw
eig'
s in
dex
P
P
0
1
2
3
4
PS VIS SIB SS SCS PH
Ros
enzw
eig'
s in
dex
P
Figure 4.9. Provinciality (P) graphs for a) Clypeomorus, b) Littornidae, c) Muricidae and d) Nerita from the Philippine marginal ocean basins.

Philippine rocky shore gastropods
75
4.6 DISCUSSION
4.6.1 The modern pattern of distribution: ecological correlates and species richness
The archipelagic setting of the Philippines presents special challenges for interpreting
distribution of shallow water marine biota. As a physical geographic unit, the
archipelago is shaped like a triangle, with a predominantly N-S axis. The similarly
complex and larger archipelago, Indonesia, has an E-W axis, and straddles the
equator. Thus, while the Philippines lies wholly in the tropics, great climate variability
on a local scale is often observed, and is the basis for climate-based classification.
This variability in climate is a result of the orientation of the islands towards the
prevailing climate system, the rain-bearing monsoon.
Rainfall and the presence of a wet season are major correlates of species occurrence
and occurrence frequencies of Nerita. Rainfall is determined by the longitudinal
distribution of the island landforms that determine local climate types (DENR and
UNEP 1997). Clypeomorus species occurrences are significantly negatively correlated
with rainfall. Clypeomorus occurrences are also negatively correlated with reef
presence, embayment, coastal complexity, island, sea surface temperature and
longitude. Thus, the whole suite of assemblages in this taxon may have similar habitat
requirements to upper shore dwelling Nerita and Littorinidae. The presence of reefs,
embayments and high coastal complexity equate to heterogenous habitats that may not
favour the occurrence of Clypeomorus. Perhaps competition from other species may
exclude them from such areas. The distribution of the intertidal Muricidae may be
related to the presence of its prey items, such as oysters and bivalves. The distribution
of these prey items may be correlated to sea surface temperature (Vermeij 1990). The
presence of coral reefs is an important determinant of gastropod occurrence in the
intertidal. Coral reefs are common in the central Philippines. These islands provide a
large number of habitats suited for colonisation of intertidal taxa.
In this study, the geographical distribution of tidal amplitudes was an important
correlate of the distribution of the Muricidae and Clypeomorus. Higher tidal
amplitudes correlate positively with occurrence and occurrence frequencies of

Philippine rocky shore gastropods
76
Muricidae. Higher tidal amplitudes correlate negatively with Clypeomorus occurrence
and occurrence frequencies (Table 4.1f) This result was not expected for the
Philippines, where tidal amplitude is small (< 1 m). Exposure to prevailing winds and
cyclones were expected to be major correlates of gastropod occurrence. It is likely
that the tidal regime is a significant factor in determining local zonation. This has
been observed in similar oceanic island environments in Bermuda (Thomas 1985). It
is possible that the distribution of prey items of Muricidae may be determined in large
part by tidal amplitudes. For the herbivorous, rock and sandy-rock substrate dwelling,
Clypeomorus, tidal amplitude may not be significant in determining the distribution of
its food items.
Latitudinal correlates of distribution have not been given much attention by earlier
Philippine biogeographers. Dickerson (1927) and Springsteen and Leobrera (1986)
state that the Philippines is “climatically insulated”. Thus the low variation in sea
surface temperatures were thought to preclude the existence of climatically defined
marine faunal and floristic assemblages. The whole country can be classified as
tropical, with very little variation in species assemblages. However, Cordero (1977),
based on a study of the geographic ranges of red algae, proposed that a temperate
and subtropical marine floristic province occurs in northern Luzon. It is of interest
that in the intertidal taxa in this study, Clypeomorus, Nerita, Cypraea, and Muricidae,
have endemics mainly found in the central Philippines.
Environmental correlates of species richness show a consistent pattern. Coastal area is
the major correlate of occurrence of each taxon. This is consistent with the hypothesis
that larger coastal areas support larger populations. These populations in turn have
lower extinction probability (Macarthur and Wilson 1967). Other significant
ecological correlates are monsoon climates, cyclones, and rainfall. Coastal complexity
and coral reef distributions show significant negative correlations with distribution of
Nerita. A majority of rocky shore Nerita, with the exception of members of the
Linnerita clade and one member of the N. chamaeleon clade, avoid reefal
environments. The positive correlation between cyclone frequency and species
richness of Littorinidae suggests that shore exposure and rainfall favour this taxon. In
Clypeomorus, the significant negative correlation of frequency of occurrence with
rainfall suggests that the taxon does not tolerate changes in salinities caused by the

Philippine rocky shore gastropods
77
monsoon climate. The fact that distibution of Muricidae does not correlate
significantly with any ecological factors investigated suggests that other factors such
as the distribution of prey or life history adaptations may be better predictors of
species richness.
Further research is necessary to determine if there are distinct biogeographic breaks in
the Philippines, determined by latitude and climate. Increased sampling and surveys in
northern Luzon may determine disjunct distributions. Longitudinal correlates of
distribution are however well known. These correlates allow for the division of the
country into two major marine biotic provinces, the South China Sea and the
Philippine Sea provinces. Analysis of seagrass assemblages and distributions support
this delineation (Fortes 1986). This biogeographical division is due to the longitudinal
distribution of tides, rainfall and the prevailing monsoon driven current system
(DENR and UNEP 1997). This is further evidenced by the significant negative
correlations of climate factors with longitude (Table 4.5)
4.6.2 Distribution and ranges
Basin isolation predicts that the high species richness in the Philippines is due to the
overlapping of narrow species ranges. A characteristic narrow distribution range is the
“curved” distribution (Figures 4.1a-h). This distribution is common near the western
edges of oceanic basins. Such distributions are often associated with boundary
currents such as the Kuroshio and the Gulf Stream in the northern hemisphere, and the
eastern Australian current in the southern hemisphere. These boundary currents
originate from tropical waters, and are thus warm. This enables the range extensions
of warm-water taxa such as butterfly fish into regions in which otherwise they would
not exist (Allen et al. 1998).
Curved distributions are a property of the geographical orientation of the Philippine
archipelago. The majority of the 50 distribution ranges examined in this study had a
characteristic N-S axis, co-incident with the orientation of the islands and ocean
currents. A few had a polygonal E-W axis, while none had a curved E-W axis. A
curved distribution with an E-W axis is usually limited by temperature, and is most

Philippine rocky shore gastropods
78
apparent when one approaches the Polar Regions. In the tropics, where temperature
differences are minimal, this kind of distribution is rare, and the common case is a
curved N-S axis, a range coincident with the ocean’s western margin and strong
boundary currents.
This study has shown that curved distributions occur in the Philippines. These
distributions are likely to be determined and maintained by regional oceanographic,
climatic or ecological factors and geologic history. Among these factors are the
strong monsoon seasons that affected the ordination analyses (Uychiaoco et al. 1992).
The monsoon, which is known to force reversing current systems in Southeast Asia
and the Indian Ocean, is believed to be an important determinant of the structure of
shallow water marine assemblages important to fisheries (Sharp 1996). While
Philippine regional oceanography is poorly described, it is likely that at the
archipelagic scale, regional oceanographic factors are the main determinants of
species distribution, at least in species with weak to moderate capacity for planktonic
dispersal.
In an ecological context, the carnivorous intertidal taxa tend to have a greater
percentage of narrow linear and curved distributions. The rapanine and ergalataxine
muricids are the dominant molluscan carnivorous taxa on the mid to high intertidal of
rocky shores. Their life history strategy favours rapid dispersal in the plankton, with
long planktonic stages (Middlefart 1997a). Thus it may be inferred that their potential
to occupy the widest possible range of habitats in the Philippines is great. However,
only three of the 15 species of intertidal muricids in this study have wide ranging
polygonal distributions. The distributions imply ecological limitations that may reflect
the distribution of favoured prey items.
The hypothesis that prey items may be a major determinant of the distribution of
carnivorous gastropods is supported by the observation that the principal prey items of
most rapanine and ergalataxine muricids are suspension feeding bivalves
characteristic of continental and high island rocky shores. The distribution of these
bivalves is correlated with primary productivity (Vermeij 1990) and estuarine
conditions that are affected by the monsoons (Wyrtki 1961). Thus, it may be
hypothesised that the distribution of these bivalves will show a north-south orientated

Philippine rocky shore gastropods
79
and curved distribution, since the islands are situated along this geographical axis.
This hypothesis may be tested in the future, by plotting the distribution of bivalves in
the Philippines.
Generally, herbivorous taxa, the Littorinidae, Nerita and Clypeomorus, have large,
wide polygonal (triangular) distributions, with only a few curved linear ranges
belonging to ecologically specialised species. This possibly implies a larger capacity
of herbivorous taxa to disperse and occupy suitable habitats. Such taxa may only be
limited by their tolerance to ecological factors. However, several members of these
taxa have small curved or polygonal ranges. These may represent relict distributions,
e.g. Nerita exuvia, that has a disjunct northern and southern range. Nerita antiquata is
part of the Linnerita clade (Vermeij 1984). Its phylogenetic relationship with the type
species Nerita (Linnerita) polita is not fully known. However its restricted
distribution, and rather primitive shell and aperture features, would suggest that this
species is a relict. Clypeomorus adunca is a Philippine endemic and may represent an
adaptive radiation to coralline substrates, rather than it being a relict (Houbrick 1985).
The high-shore Littorinidae, such as Echininus, are found only in a few islands in the
central Philippines, and very rarely on the shores of large islands. These littorinids are
ovoviviparous. This may account for their historical and present rarity (Reid and
Geller 1997). Their apparent ecological specialisation on uplifted coral atolls and
karstic limestones may explain their absence on the volcanic high islands of the
Philippines. In the central Pacific, ovoviviparity has not precluded colonisation over a
6300 km distance (Reid and Geller 1997). It is likely that the species island hopped
over coral atolls now submerged, rather than drifted to these widely separated atolls
by chance. Another littorinid, Littoraria coccinea is widely distributed throughout the
Pacific, but is an ecological specialist, being found only on uplifted, highly exposed
coral islands.
Curved ranges are a common pattern in shallow water marine biota in the western
Indo-Pacific. These distributions closely follow the direction of western boundary
ocean currents. In the Philippines, such distributions may follow the margins of
oceanic basins and the distribution of the islands within the basins. However the
direction of this curvature is opposite to the curve direction of the IWP arcuate
distribution that McManus described. The causes of this difference are unclear.

Philippine rocky shore gastropods
80
However, curved ranges within the Philippines may demonstrate that geographical
ecological factors are significant in determining the distributional limits of marine
species within the country, even though these species have otherwise large ranges in
the IWP. Ecologically specialised taxa tend to exhibit curved ranges. The
maintenance and persistence of these ranges need to be further examined.
4.6.4 Species-area relationships: provinciality and homogeneity
The aim here was to infer similarities of faunal assemblages in the marginal oceanic
basins. Such similarities (or differences) are a function of the species ranges. The
usefulness of this approach is apparent when comparing species diversities over
geographic regions. The major limitation of the approach is that it often does not take
into account the effect of habitat heterogeneity on distribution, but is based simply on
total area occupied by the species. This approach is an ecological approximation,
since it is highly difficult to factor out the effects of range area on habitat. The former
is auto-correlated with the latter (Rosenzweig 1995).
Z describes the rate of increase in the number of species that occur as the area of the
OGU sampled increases. If species are randomly distributed, and all occur in each
site, then z will be zero, since there is no net accumulation of species as the OGU is
sampled. If an area is devoid of species, then z will approach infinity. Species pools
are dynamic and changing with speciation, extinction and the persistence of relicts.
While it is difficult to experiment with species pools, natural events that result in
isolation and re-connection of faunas change the nature of species pools and
consequently the z parameter (McKinney 1998).
The varied species-area curves imply that the total species pool of the taxa in this
study in the Philippines is not well mixed. That is, species do not have equal
probabilities of being found in suitable communities (Maurer 1999). While truly well
mixed species pools rarely occur in nature, well-mixed pools would imply that lottery-
type community dynamics is responsible for geographic distributions, and this would
therefore be random. This may account for the less tight SPAR predictions that were
observed (Rosenzweig 1995).

Philippine rocky shore gastropods
81
The importance of this approach is emphasized when the individual species-area
relationships of the basins are compared to the species-area relationship of the total
Philippine fauna for any particular taxon. This approach is a conceptual experiment in
which all the biogeographical barriers to distribution are removed.
If the fauna of a particular basin is homogenous with the total fauna, the z of the
particular basin is similar to the z of the total fauna (Rosenzweig 1995). This implies
that in terms of the species-area relationship, the basin is not a distinct unit isolated
from the total area of the Philippines, but is a subset of that total area (Patterson
1986). If the basin fauna is provincial (that is, has a high index of geographic
isolation and faunal uniqueness) relative to the rest of the Philippine fauna, this
implies that the z estimate of the basin is different from the z of the total species-area
relationship of the Philippines. The more the basins are evolutionarily independent,
the higher the z of the total fauna. Evolutionary independence implies that faunal
elements have minimal exchange (Rosenzweig 1995).
Rosenzweig’s (1995) statement on evolutionary independence in provincial
geographical units needs to be taken with a caveat. It is philosophically impossible
(from the standpoint of earth history and modern oceanography) to consider the
oceanic basins of the world to be completely isolated from each other. Rosenzweig
(1995) states that marine provinces are inherently “leaky” because certain ocean
currents (e.g. Antarctic circumpolar) to a large extent connect the provinces. Floral
and faunal species can theoretically disperse if they have long pelagic larval stages.
This caveat supports my position in the succeeding paragraph.
A comparison of species-area patterns in terrestrial ecological systems suggests that
areas with high z and high provinciality values have been isolated in the past.
However, in the context of the marine system, this isolation is confounded by genetic
and recruitment connectivity, and thus the oceanic basins are not true analogues of
terrestrial islands in the sense of the Theory of Island Biogeography (Macarthur and
Wilson 1967). In this theory, islands derive their species purely from immigration. In
terrestrial islands recruitment or immigration is mainly a function of distance from the
source of recruits. This selects against organisms with low dispersal ability. In the

Philippine rocky shore gastropods
82
marine system, connectivity may be largely a function of time that selects against
species with short planktonic stages. Thus in many marine molluscs, natural selection
has favoured those with long planktonic stages to have large ranges (Kohn and Perron
1994).
Basin isolation predicts that during sea level regressions, speciation will be enhanced.
However, constant re-connection at different time scales may account for the low
endemism of the total Philippine molluscan fauna, estimated at 3 to 5 percent
(Springsteen and Leobrera 1986). Endemic species are largely recorded only from the
central Philippines. Near endemics are recorded from adjacent ocean basins. Because
the present isolation of marine provinces is mainly a function of the time of
planktonic pre-competency and competency, the distances between the Philippine
islands are not large enough to prevent dispersal for most planktotrophs. Hawaii is
typical of a biotic province isolated by distance. Its fauna is derived from the western
Pacific via the north equatorial current that moves eastward past Hawaii. Thus, a high
degree of molluscan endemism is observed there among taxa with short planktonic
pre-competency. Similarly, the Northern Mariana Islands have a significant degree of
endemism in rocky shore molluscs (Vermeij 1987). The Philippines has a prevailing
monsoon system. Thus the shore fauna tends to show a gradient in assemblages, with
windward sides showing distinct assemblages from the leeward sides. Monsoonal
effects are not constant throughout the archipelago. Some areas tend to be more
exposed to the winter or summer monsoons (Dickerson, 1927).
Philippine rocky intertidal gastropods have low levels of endemism. Yet the
Philippines has the highest species richness of gastropods of any tropical rocky shore
assemblage in the world. What accounts for the high species richness of the Philippine
shallow water marine biota? Is it that the archipelago “collects” species rather than
generates them? Do the different oceanic basins serve as extinction refuges? If the
archipelago collects species by serving as an extinction refuge, then this will be
reflected in a low gastropod:bivalve ratio, since bivalves are believed to be less
resistant to extinction than gastropods (Vermeij 1987). If the archipelago is a truly
isolated biota, then the gastropod:bivalve ratio will be high, since there will be a
higher extinction risk for the bivalve fauna (Paulay 1990). Paulay does not make
inferences on gastropod extinction rates. The Philippines has a gastropod:bivalve ratio

Philippine rocky shore gastropods
83
of 2:1, which is considered very low (Springsteen and Leobrera 1986). On the other
hand, the two million-year-old, distance-isolated Hawaiian Archipelago, has a
gastropod:bivalve ratio of 6:1 (Kay and Palumbi 1987). The Philippine ratio suggests
that bivalves persisted through major extinction events that decimated species
assemblages elsewhere. Extinction in bivalves during periods of low sea level is often
due to habitat loss (Paulay 1990) associated with the regression of coral reef habitats.
Only regions with suitable geomorphology provided refuges against such extinctions.
Paulay (1990) argues that the western Pacific archipelagos were the refuges against
extinction, and that the present Holocene bivalve fauna on Pacific islands is derived
from the western Pacific.
While species accretion and speciation are not mutually exclusive phenomena, there is
no evidence to suggest that under tropical conditions speciation rate is enhanced
(Maurer 1999). However there is evidence that species survival and persistence are
enhanced (Eldredge 1999). Archipelagos typically have overlapping distributions of
marine taxa. This observation is supported by evidence from modelling studies
(Patterson 1986) of extinction dynamics in areas that are geographically fragmented.
These overlapping distributions, under a random assumption of equal extinction risk,
imply that selective extinction and persistence of species may be responsible for the
distribution patterns observed. Extinction risk in small islands is greater. While
available habitat-area is the main correlate for these patterns, other ecological
correlates may be responsible for maintenance of populations that eventually leads to
extinction or persistence (Patterson 1986).
The oceanic basins of the Philippines may be viewed as an archipelago of “seas”. If
geographic complexity is the insurance policy that covers for qualitative habitat loss
and prevents mass extinction in this system during low sea levels, then the Philippines
is an area where this hypothesis may be evaluated. The Pliocene to Pleistocene
distribution of coral reefs in the country argues against complete loss of reef
structures, with many reefs from this period uplifted as modern day coral islands
(Romero and Zacher 1981) or submerged as marine terraces in the present
interglacial. Areas in southern Cebu and Negros such as Sumilon Island were
tectonically uplifted during the Pleistocene, and show evidence of reef development
during low sea levels (White 1987). Pleistocene reef development is also observed in

Philippine rocky shore gastropods
84
the Sulu Sea (Romero and Zacher 1981). Thus it can be argued that similar
environments were present during low sea levels that may have served as refuges
when extinction happened elsewhere in the Pacific.
Basin isolation predicts rapid speciation. However the evidence from the present
ranges of gastropods suggests that the oceanic basins may have served more as
extinction refuges than centres of speciation, due to the lack of endemism. This is not
to discount totally the role of rapid speciation, for this is likely to happen under
isolating conditions. McManus proposed his hypothesis on the basis of numerous
species of deepwater fishes in the Sulu Sea basin, and the presence of endemic corals,
that suggest that under lowered sea levels, rapid speciation occurred.
The paradoxical low endemism and high species richness has made tests of speciation
hypotheses in the IWP problematic. The possible key to unravelling such hypotheses
is to determine the phylogenetic histories of the endemics and the near endemics. If
the endemic species have pleisomorphic characters, then these species are likely to be
relicts. If these species have apomorphic or derived characters, then they are possibly
new species. A correlation of these phylogenetic traits and geographical ranges would
provide insights into speciation in the region.
Evidence suggests that gradients in allele diversity occur throughout the range of
widely distributed taxa such as sea urchins and butterflyfish (Palumbi 1996; Palumbi
1997). These gradients may parallel species or genetic gradients, but both can serve as
response variables to test the centre of origin and accumulation hypotheses in Pacific
marine biogeography. Benzie (1998) argues that present day genetic evidence
suggests peripheral Pacific basin speciation is most likely, rather than speciation in
Southeast Asia. Speciation processes and genetic diversification operate at two
different time scales. The influence of genetic changes and speciation on a wide
geographical area is not fully understood (Palumbi 1994). The key to further
examination of this lies in the mapping of calibrated molecular phylogenies over
existing geographical range information.
Thus there are two models to account for the high species richness in the IWP region.
I present two avenues for further research to test the centre of origin and collection

Philippine rocky shore gastropods
85
(accumulation) hypotheses. Comparing phylogenetic histories of various taxa from
within and bordering the basins could test the nature of speciation. A test of
geographic heterochrony, wherein relict assemblages co-exist with modern
assemblages occurring within the basins, tests the collection and persistence
hypothesis (Petuch 1987). Unlike the centre of origin model, extinction is an integral
element of this hypothesis. Geographical heterochrony is in line with Rosenzweig’s
(1995) predictions that at larger time scale, sink species in a high diversity system do
not become extinct due to the presence of refugia where they can persist. Sink species
are derived from other areas. Although not explicitly tested in this study, the presence
of numerous disjunct occurrences of deepwater Conus within the Indo-Pacific centre
of species diversity (Röckel et al 1995) suggest that relict assemblages have survived
in this distribution centre.
Thus is the modern pattern of gastropod distribution, the high provinciality and high z
values in the central Philippine basins may be due to differential extinction, survival
and speciation as a result of basin isolation. These processes may also be brought
upon by ecological factors that allow species to persist. A test of this, using the highly
diverse coral shore neo-gastropod Conus, is presented in Chapter 5.
4.7 CONCLUSIONS 1. The major ecological correlates of frequency of occurrence are taxon-specific, with
high intertidal assemblages affected primarily by the monsoon and its effects on
climate and oceanography. Lower intertidal taxa (eg Clypeomorus ) are correlated
with presence of coastal habitats such as coral reefs. These observations tend to
support the longitudinal or “East-West” separation of Philippine marine provinces.
2. Latitudinal correlates of frequency of occurrence of species suggest that temperate
influences may affect the northern area of the Philippines. The degree of this
influence needs to be further assessed through similar studies with other subtidal taxa.
3. Curved and overlapping distributions of gastropods may be observed. Members of
the carnivorous taxon Muricidae often have curved distributions.

Philippine rocky shore gastropods
86
4. Species-area analysis suggests that gastropods in basins are isolated and show
reasonably high levels of Rosenzweig’s provinciality. However, the low endemism of
gastropod taxa suggests that the provincial characteristics of the ocean basins in the
archipelago are a result not of rapid speciation in the past, but of differential
extinction and survival of many species.

Conus biogeography
87
CHAPTER 5
The biogeography of intertidal and shallow-water Conus: environmental heterogeneity and the basin isolation hypothesis “McManus’ patterns stand in their own right, regardless of whether a suitable geological theory has been found to explain them.”- B.R. Rosen (1988) “However, available evidence from the Paleogene and especially Neogene radiations suggest that the strongly and stylishly shelled, Conus is a young, upwardly mobile and progressional genus, albeit at a snail’s pace” – A.J. Kohn (1990) This chapter describes the modern biogeography of Indo-West Pacific Conus in the
Philippines. As the most species-rich coral reef gastropod genus, the taxon is used as a
model to evaluate the basin isolation hypothesis. Modern ranges are examined to
estimate potential influences of basin isolation in the Philippines.
5.1 INTRODUCTION
McManus (1985) proposed the basin isolation hypothesis to account for historical
patterns of species diversity in Southeast Asia and the western Pacific. This
hypothesis predicts that repeated isolation and reconnection of marginal oceanic
basins in archipelagic environments as a result of sea level changes favoured rapid
diversification and speciation in shallow water (0-30 m) marine biota.
Biogeographic evidence that supports this hypothesis has been both qualitative and
phylogenetic. Phylogenetic patterns of species divergence in scleractinian corals and
the possible presence of regional endemic species with restricted distribution support
the hypothesis (Pandolfi 1992; Wallace 1997). Cluster analysis of presence and
absence data has demonstrated dissimilarities in coral composition consistent with the
geographical location of major oceanic basins in the Philippines. Cluster analysis,
while intuitive and useful in detecting differences in faunal assemblages, does not

Conus biogeography
88

Conus biogeography
89
usually account for ecological effects on a geographical scale (Hengeveld 1990).
As a result of its geological evolution, the Philippines is bordered by several oceanic
basins, and encloses the Sulu Sea basin (Figure 5.1). These basins are bordered by
regional island groups. With the exception of northern Palawan, the islands of the
archipelago are of oceanic crustal origin, and have different geological ages. The
oldest island is Luzon, where the northern terrane has evidence of Cretaceous to
Paleocene volcanic activity (Karig 1983). Other islands dating back from this time
include Marinduque and Cebu. The youngest island group is the Sulu Archipelago,
which is likely of Tertiary origin (McCabe and Cole 1989).
The species-area curve, a fundamental construct of biogeography (McKinney 1998),
is used to examine the nature of basin isolation in the Philippines. Species-area
patterns can infer a variety of ecological processes across time and space, and are
useful in comparing diversities between geographical regions or between taxa.
Furthermore, species-area curves can be used to account for the effects of area on
species richness, and thus enable inferences about the effects of other ecological
factors on species number (Connor and McCoy 1979). This study uses the concept of
biotic homogenisation (Rosenzweig, 1995) in quantitatively testing possible basin
isolation in the Philippines. Biotic homogenisation is defined as the mixing of
previously isolated biotas that often results in extinction of certain taxa. It is assumed
that in an archipelagic environment without barriers to dispersion, or which did not
experience historical basin isolation, the homogenisation index will be high, and
species with wide ranging distributions are likely to colonise suitable environments
over a wide area. Consequently regional endemics will be rare.
The neogastropod genus Conus is used here as the study taxon. The genus has an
estimated 500 extant species, with 300 species of Indo-Pacific distribution. The
Philippines has an estimated 172 species of shallow water Conus based on the
primary and secondary material consulted in this thesis (Appendices 4, 5, 8). About
45% of the 300 Indo-Pacific species are found in coral reef associated intertidal
environments. Many Conus species have a wide distributional range, and occupy
distinct niches based on their prey items. Habitat characteristics are summarised in

Conus biogeography
90
Table 5.1a. The spatial patterns of species diversity observed in the genus are related
to reproduction and development, and resource and habitat utilisation (Kohn 1997).
In this study, ranges of Conus are examined to examine predictions of the basin
isolation hypothesis.
5.2 MATERIAL
The selection of primary and secondary material, including maps, used in the
biogeographic analysis was subject to criteria given in Chapter 1 of this thesis. The
nature of material, sources and their locations are described in Chapter 3. For PC
analyses for Philippine data, eighteen OGUs had Conus records (Appendices 2, 4),
however only 14 OGUs had useful ecological information. These were the only ones
used in PC analyses (Table 5.1a).
5.2.1 Data limitations
As Conus is a species-rich neogastropod genus, there is a possibility that the species
number recorded here is an overestimate. Some species have been recorded only once,
and their taxonomic validity may be in question. This may overestimate species
number in each basin. Species that have been recorded only once, and whose
taxonomic validity is in question, were thus not included in the analysis. Species
identifications were validated using Röckel et al (1995) to increase taxonomic
certainty (Table 5.1b).
Code Geographical Regions Physical features CEBE Eastern Cebu and Mactan
(includes Olango island) The coast is composed of low-lying coral limestone islands with an average elevation of 10 metres
EPAL Eastern Palawan (From Calamianes to Balabac)
Embayed coastline. Extensive reef and mangrove development.
ESAM Eastern Samar (Philippine Sea coast of Samar Island)
Narrow insular shelves and steep underwater drop-offs characterize coral reef shorelines
NPANAY Northern Panay (Antique coastline including Sapian Bay)
Heavily embayed with extensive reef and mangrove areas.
NWLUZ Northwest Luzon (Ilocos) (From Lingayen Gulf to Pagudpud, Ilocos Norte)
Embayed coastline fringed by narrow reefs with wide sandy beaches. Northernmost shorelines

Conus biogeography
91
have little reef development SAM Samar (Visayan Sea
coastline of Samar Island) Embayed coastline with numerous reefs. Some reefs have steep drop-offs
SELUZ Southeast Luzon (Bicol) (Includes Albay, Camarines Norte, Sorsogon and Catanduanes)
Tectonically active coastline with many bays. The coast is bordered by fringing reefs
SIBIS Sibuyan Sea Islands (Boracay, Romblon, Sibuyan, Marinduque)
Volcanic islands that have been isolated from major Philippine islands. Narrow reefs in Sibuyan. Extensive reefs near Boracay
SPANAY Southern Panay (Guimaras and Southeast Iloilo and smaller islands)
Guimaras and eastern Iloilo islands are bordered almost wholly by fringing reefs. Panay Gulf subject to strong tidal flows
SSIS Sulu Sea Islands (Sulu, Tawi Tawi, Tubbataha Atoll, Cuyo and Cagayan de Sulu islands)
Most Sulu islands are volcanic. Submerged platforms support extensive reef development. True atoll development observed in Tubbataha and Cuyo islands.
SWBOH Southwest Bohol (Maribojoc, Loay, Panglao and Pamilacan islands)
Shore is generally sand and rubble with intertidal benches fringed with coral reefs
SWLUZ Southwestern Luzon (Nasugbu to San Juan Batangas including minor islands)
Embayed coastline, tectonically active, narrow reef flats affected by strong tidal flows
TB Tayabas Bay (Laiya Batangas to Bondoc Peninsula)
Diverse coastal features. Wide sandy beaches in eastern part, reef and mangrove development towards Bondoc Peninsula
WLUZ Western Luzon (From Subic Bay, Zambales to Cape Bolinao)
Embayed coastline in the south, extensive reef development in the north. Zambales coastline extensively modified by lahar flows following 1991 Pinatubo eruption
Table 5.1a Attributes of the geographical regions where Conus assemblages and their frequency of occurrences were recorded.

Conus biogeography
92
Cone ID Genus Species OGU 34 Conus capitaneus Eastern Cebu 36 Conus mustelinus Eastern Cebu 49 Conus nussatella Eastern Cebu 53 Conus muriculatus Eastern Cebu 54 Conus sulcatus Eastern Cebu 57 Conus mucronatus Eastern Cebu 59 Conus acutangulus Eastern Cebu 60 Conus floridulus Eastern Cebu 67 Conus articulatus Eastern Cebu 76 Conus grangeri Eastern Cebu 78 Conus sulcatus Eastern Cebu 93 Conus circumcisus Eastern Cebu 96 Conus neptunus Eastern Cebu 97 Conus comatosa Eastern Cebu
102 Conus aculeiformis Eastern Cebu 104 Conus dusaveli Eastern Cebu 109 Conus eximius Eastern Cebu 114 Conus generalis Eastern Cebu 117 Conus gloriamaris Eastern Cebu 121 Conus ichinoseana Eastern Cebu 122 Conus ione Eastern Cebu 123 Conus kimioi Eastern Cebu 125 Conus kintoki Eastern Cebu 127 Conus eugrammatus Eastern Cebu 130 Conus lenavati Eastern Cebu 132 Conus leopardus Eastern Cebu 134 Conus luteus Eastern Cebu 142 Conus pertusus Eastern Cebu 143 Conus sulcocastaneus Eastern Cebu 148 Conus viola Eastern Cebu 151 Conus proximus Eastern Cebu 153 Conus molluccensis Eastern Cebu 177 Conus omaria Eastern Cebu 178 Conus praecellens Eastern Cebu 180 Conus memiae Eastern Cebu 183 Conus pseudorbignyi Eastern Cebu 185 Conus vimineus Eastern Cebu 187 Conus scalptus Eastern Cebu 189 Conus polongimaruma
i Eastern Cebu
190 Conus saecularis Eastern Cebu 192 Conus saecularis Eastern Cebu 216 Conus crocatus Eastern Cebu 140 Conus thomae Davao Gulf 191 Conus sazanka Davao Gulf
17 Conus arenatus Eastern Palawan 24 Conus planorbis Eastern Palawan 25 Conus furvus Eastern Palawan 26 Conus magus Eastern Palawan 41 Conus frigidus Eastern Palawan 43 Conus textile Eastern Palawan 44 Conus telatus Eastern Palawan
101 Conus dayriti Eastern Palawan

Conus biogeography
93
102 Conus achatinus Eastern Palawan 154 Conus spectrum Eastern Palawan 159 Conus thalassiarchus Eastern Palawan 166 Conus nobilis Eastern Palawan 186 Conus montillai Eastern Palawan
7 Conus chaldeus Eastern Samar 13 Conus lividus Eastern Samar 30 Conus australis Eastern Samar 35 Conus rattus Eastern Samar 37 Conus miles Eastern Samar 40 Conus flavidus Eastern Samar 50 Conus terebra Eastern Samar 69 Conus aulicus Eastern Samar 70 Conus auratinus Eastern Samar 72 Conus auricomus Eastern Samar
106 Conus episcopatus Eastern Samar 129 Conus legatus Eastern Samar 136 Conus tulipa Eastern Samar 137 Conus obscurus Eastern Samar 147 Conus tenuistriatus Eastern Samar 163 Conus sanguinolentus Eastern Samar 165 Conus retifer Eastern Samar 176 Conus magnificus Eastern Samar 209 Conus zapatosensis Sibuyan Sea Islands
2 Conus imperialis Northern Panay 3 Conus litteratus Northern Panay 5 Conus eburneus Northern Panay 7 Conus chaldeus Northern Panay 8 Conus ebraeus Northern Panay
11 Conus musicus Northern Panay 12 Conus sponsalis Northern Panay 13 Conus lividus Northern Panay 15 Conus distans Northern Panay 17 Conus arenatus Northern Panay 21 Conus catus Northern Panay 24 Conus planorbis Northern Panay 26 Conus magus Northern Panay 28 Conus stramineus Northern Panay 31 Conus radiatus Northern Panay 34 Conus capitaneus Northern Panay 35 Conus rattus Northern Panay 36 Conus mustelinus Northern Panay 37 Conus miles Northern Panay 39 Conus emaciatus Northern Panay 47 Conus striatus Northern Panay 51 Conus glans Northern Panay
112 Conus miliaris Northern Panay 114 Conus generalis Northern Panay 132 Conus leopardus Northern Panay 193 Conus pulicarius Northern Panay
2 Conus imperialis Northwest Luzon (Ilocos)
11 Conus musicus Northwest Luzon (Ilocos)

Conus biogeography
94
12 Conus sponsalis Northwest Luzon (Ilocos)
13 Conus lividus Northwest Luzon (Ilocos)
14 Conus moreleti Northwest Luzon (Ilocos)
16 Conus biliosus Northwest Luzon (Ilocos)
19 Conus varius Northwest Luzon (Ilocos)
21 Conus catus Northwest Luzon (Ilocos)
23 Conus planorbis Northwest Luzon (Ilocos)
24 Conus planorbis Northwest Luzon (Ilocos)
26 Conus magus Northwest Luzon (Ilocos)
31 Conus radiatus Northwest Luzon (Ilocos)
35 Conus rattus Northwest Luzon (Ilocos)
36 Conus mustelinus Northwest Luzon (Ilocos)
37 Conus miles Northwest Luzon (Ilocos)
44 Conus telatus Northwest Luzon (Ilocos)
46 Conus quercinus Northwest Luzon (Ilocos)
47 Conus striatus Northwest Luzon (Ilocos)
50 Conus terebra Northwest Luzon (Ilocos)
53 Conus muriculatus Northwest Luzon (Ilocos)
112 Conus miliaris Northwest Luzon (Ilocos)
145 Conus ochroleucus Northwest Luzon (Ilocos)
151 Conus proximus Northwest Luzon (Ilocos)
193 Conus pulicarius Northwest Luzon (Ilocos)
194 Conus litoglyphus Northwest Luzon (Ilocos)
197 Conus vexillum Northwest Luzon (Ilocos)
198 Conus obscurus Northwest Luzon (Ilocos)
200 Conus tulipa Northwest Luzon (Ilocos)
201 Conus suratensis Northwest Luzon (Ilocos)
5 Conus eburneus Samar 8 Conus ebraeus Samar 9 Conus coronatus Samar
18 Conus stercusmuscarum
Samar
21 Conus catus Samar

Conus biogeography
95
22 Conus striatellus Samar 23 Conus planorbis Samar 29 Conus consors Samar 33 Conus vexillum Samar 47 Conus striatus Samar 51 Conus glans Samar 52 Conus scabriusculus Samar 62 Conus furvus Samar 75 Conus balteatus Samar 79 Conus boeticus Samar 82 Conus bullatus Samar 83 Conus canonicus Samar 94 Conus coccineus Samar
100 Conus cylindraceus Samar 110 Conus fischoederi Samar 112 Conus miliaris Samar 133 Conus litoglyphus Samar 150 Conus mitratus Samar 193 Conus pulicarius Samar 216 Conus crocatus Samar 214 Conus darkini Sarangani
1 Conus marmoreus Southeast Luzon (Bicol)
5 Conus eburneus Southeast Luzon (Bicol)
26 Conus magus Southeast Luzon (Bicol)
57 Conus mucronatus Southeast Luzon (Bicol)
69 Conus aulicus Southeast Luzon (Bicol)
115 Conus geographus Southeast Luzon (Bicol)
14 Conus moreleti Sibuyan Sea Islands 16 Conus biliosus Sibuyan Sea Islands 19 Conus varius Sibuyan Sea Islands 20 Conus achatinus Sibuyan Sea Islands 28 Conus stramineus Sibuyan Sea Islands 53 Conus muriculatus Sibuyan Sea Islands 91 Conus cinereus Sibuyan Sea Islands 95 Conus collisus Sibuyan Sea Islands
149 Conus monachus Sibuyan Sea Islands 89 Conus cervus Southern Mindanao
108 Conus excelsus Southern Mindanao 119 Conus hirasei Southern Mindanao 157 Conus samiae Southern Mindanao
2 Conus imperialis Southern Panay 3 Conus litteratus Southern Panay 7 Conus chaldeus Southern Panay 8 Conus ebraeus Southern Panay
11 Conus musicus Southern Panay 12 Conus sponsalis Southern Panay 13 Conus lividus Southern Panay 14 Conus moreleti Southern Panay 17 Conus arenatus Southern Panay

Conus biogeography
96
20 Conus achatinus Southern Panay 21 Conus catus Southern Panay 24 Conus planorbis Southern Panay 26 Conus magus Southern Panay 28 Conus stramineus Southern Panay 31 Conus radiatus Southern Panay 34 Conus capitaneus Southern Panay 35 Conus rattus Southern Panay 36 Conus mustelinus Southern Panay 37 Conus miles Southern Panay 40 Conus flavidus Southern Panay 45 Conus figulinus Southern Panay 47 Conus striatus Southern Panay 51 Conus glans Southern Panay 53 Conus muriculatus Southern Panay 79 Conus boeticus Southern Panay 95 Conus collisus Southern Panay
132 Conus leopardus Southern Panay 151 Conus proximus Southern Panay 177 Conus omaria Southern Panay 193 Conus pulicarius Southern Panay
63 Conus ammiralis Sulu Sea Islands 66 Conus armadillo Sulu Sea Islands 73 Conus aurisiacus Sulu Sea Islands 81 Conus broderippi Sulu Sea Islands 91 Conus cinereus Sulu Sea Islands 92 Conus circumactus Sulu Sea Islands 98 Conus corallinus Sulu Sea Islands
111 Conus floccatus Sulu Sea Islands 126 Conus kuroharai Sulu Sea Islands 173 Conus voluminalis Sulu Sea Islands 211 Conus cordigera Sulu Sea Islands
2 Conus imperialis Southwest Bohol 3 Conus litteratus Southwest Bohol
15 Conus distans Southwest Bohol 39 Conus emaciatus Southwest Bohol 64 Conus aphrodite Southwest Bohol 74 Conus baileyi Southwest Bohol 80 Conus boholensis Southwest Bohol 90 Conus chiangi Southwest Bohol 96 Conus neptunus Southwest Bohol
103 Conus dondani Southwest Bohol 124 Conus kinoshitai Southwest Bohol 170 Conus sugimotonis Southwest Bohol
4 Conus tessulatus Southwest Luzon 11 Conus musicus Southwest Luzon 12 Conus sponsalis Southwest Luzon 32 Conus parius Southwest Luzon 46 Conus quercinus Southwest Luzon
112 Conus miliaris Southwest Luzon 145 Conus ochroleucus Southwest Luzon
1 Conus marmoreus Tayabas Bay 2 Conus imperialis Tayabas Bay 3 Conus litteratus Tayabas Bay

Conus biogeography
97
4 Conus tesullatus Tayabas Bay 5 Conus eburneus Tayabas Bay 6 Conus caracteriscus Tayabas Bay 7 Conus chaldeus Tayabas Bay 8 Conus ebreaus Tayabas Bay 9 Conus coronatus Tayabas Bay
11 Conus musicus Tayabas Bay 12 Conus sponsalis Tayabas Bay 13 Conus lividus Tayabas Bay 14 Conus moreleti Tayabas Bay 15 Conus distans Tayabas Bay 16 Conus biliosus Tayabas Bay 17 Conus arenatus Tayabas Bay 18 Conus stercusmuscar
um Tayabas Bay
19 Conus varius Tayabas Bay 20 Conus achatinus Tayabas Bay 21 Conus catus Tayabas Bay 22 Conus striatellus Tayabas Bay 23 Conus planorbis Tayabas Bay 24 Conus planorbis Tayabas Bay 25 Conus furvus Tayabas Bay 26 Conus magus Tayabas Bay 27 Conus subulatus Tayabas Bay 28 Conus stramineus Tayabas Bay 29 Conus consors Tayabas Bay 30 Conus australis Tayabas Bay 31 Conus radiatus Tayabas Bay 32 Conus parius Tayabas Bay 33 Conus vexillum Tayabas Bay 34 Conus capitaneus Tayabas Bay 35 Conus rattus Tayabas Bay 36 Conus mustelinus Tayabas Bay 37 Conus miles Tayabas Bay 38 Conus virgo Tayabas Bay 39 Conus emaciatus Tayabas Bay 40 Conus flavidus Tayabas Bay 41 Conus frigidus Tayabas Bay 42 Conus pennaceus Tayabas Bay 43 Conus textile Tayabas Bay 44 Conus telatus Tayabas Bay 45 Conus figulinus Tayabas Bay 46 Conus quercinus Tayabas Bay 47 Conus striatus Tayabas Bay 48 Conus anemone Tayabas Bay 49 Conus nussatella Tayabas Bay 50 Conus terebra Tayabas Bay 51 Conus glans Tayabas Bay 52 Conus scabriusculus Tayabas Bay 53 Conus muriculatus Tayabas Bay 54 Conus sulcatus Tayabas Bay 55 Conus moluccensis Tayabas Bay 56 Conus insculptus Tayabas Bay 57 Conus mucronatus Tayabas Bay

Conus biogeography
98
59 Conus acutangulus Tayabas Bay 60 Conus floridulus Tayabas Bay 61 Conus alabaster Tayabas Bay 68 Conus asiaticus Tayabas Bay
112 Conus miliaris Tayabas Bay 128 Conus laterculatus Tayabas Bay 158 Conus pagodus Tayabas Bay 169 Conus tribblei Tayabas Bay 172 Conus recluzianus Tayabas Bay 174 Conus voluminalis Tayabas Bay 178 Conus praecellens Tayabas Bay 184 Conus orbignyi Tayabas Bay 197 Conus vexillum Tayabas Bay
31 Conus radiatus Western Luzon 45 Conus figulinus Western Luzon 77 Conus betulinus Western Luzon 85 Conus caracteristicus Western Luzon
135 Conus lynceus Western Luzon 139 Conus suratensis Western Luzon
Table 5.1b Conus species recorded from each OGU in this study.

Conus biogeography
99
5.3 METHODS
In this chapter I perform range analyses, areographic and ecological analyses, species-
area relationship analyses, faunal provinciality analyses and ordination methods. All
of these methods are described in Chapter 3. Sites in Mindanao, Philippines were not
included in all the analyses due to the lack of sufficient numbers of collection sites.
Additional methods are presented to further evaluate the basin isolation hypothesis.
Endemism was determined from distributional information in the following references
Cabrera (1984), Röckel et al (1995), Springsteen and Leobrera (1986) Kohn and
Perron (1994) and Wilson (1993).
5.3.1 Physical and historical measures of basin isolation
McManus (1985) suggested that basin isolation was a result of the unique
geographical configuration of the Philippines and Indonesia, in which an island arc
borders marginal oceanic basins. During the Plio-Pleistocene sea level regressions, the
Sibuyan Sea, Sulu Sea, Bohol Sea and Camotes Sea (Fig. 5.1) were physically
isolated from the Pacific Ocean and South China Sea due to the closing or narrowing
of passages when the islands bordering them increased in area. Thus it is possible to
get a measure of isolation of the basins by counting the number of modern passages
connecting the basins with the Philippine Sea or South China Sea. It is also possible to
estimate the width of the passages during the maximum sea level regression -150 m.
The level of potential isolation was estimated by the equation
I Basin = N/W Equation 5.1
Where I Basin is the isolation index, N is the number of passages into and out of the
basin, and W is the width of all passages, summed during the last maximum sea level
regression, 18,000 YBP (Heaney (1986).
5.3.2 Estimation of species extinction (species loss) rate
Basin isolation predicts higher rates of accumulation of species in an ocean basin
relative to a larger area, such as the entire Pacific Ocean. This is due to speciation or
species persistence, resulting in the high species diversity in the Southeast Asian

Conus biogeography
100
region. In this study, species extinction rate is deduced from the Pacific Ocean
species-area relationship, assuming that the Pliocene-Pleistocene species-area
relationship is similar to that of today. Using the species-area parameters estimated for
the habitable areas in the Philippines where the cone snails were recorded or
collected, and the parameters of the Pacific Ocean species-area relationship, species
loss and gain is estimated according to Rosenzweig’s (1995) equation
Eb = (Sm – Sb )/ Sm Equation 5.2
Where Eb is the extinction rate over the last 18,000 years (number extinct/18,000
years), Sm is the number of species in an area of the Pacific Ocean of the same size as
that of the basin in question, and Sb is the number of species observed in the
geographic basin surveyed. It was assumed that the area of the Pacific Ocean has an
equal distribution of species richness following that of Schoft (Schopf 1979). Note that
a negative extinction rate means an accumulation of species over time.
The species-area relationship for tropical shallow water Conus in the Pacific Ocean
was determined from my preliminary analysis as
S Pacific = 5.4649 A 0.2038 Equation 5.3
Area represents the total area of the tropical Pacific. The Pacific Ocean represents the
largest geographical unit in which the Pacific Conus species are found. The SPAR
was plotted based on the occurrences of cone snails in six representative areas with a
significant number of Conus records. These areas are 1) The Philippines, 2) Japan
(Ryukyu Islands) 3) Great Barrier Reef Region, 4) Hawaii, 5) Guam and 6)
Galapagos. The S was determined by plotting total coastal area by GIS applications
from a world map [ 1:205,019,526 ] and the species number of Conus in the
geographic areas.
Equation 5.3 is substituted for Sm of equation 5.2 to estimate extinction rate in each
basin.

Conus biogeography
101
5.3.3 Analysis of range size, life history and habitat in Conus From data on the habitat types available to Conus in the Philippines, published
information on life history characteristics of Conus, and range sizes for the genus in
the Philippines, a biogeographic analysis of range size was conducted.
This study aims to test the hypothesis that the dispersal potential, measured as length
of observed and calculated (Kohn and Perron 1994) pre-competent planktonic stage
(PS) of Conus is positively correlated with range size (RS) in the Philippines. This
observation is known from Pacific and Indian Ocean comparisons of Conus
distribution and range size (Kohn and Perron 1994). Another hypothesis that will be
examined is whether the number of available habitats (HA) in each OGU is an
important factor in determining the present range of Conus in the Philippines.
Frequency of occurrence in a basin (O) is factored out by designating it as a covariate,
since I assume that it results from local-scale processes affecting abundance. HA are
the habitat types (Kohn 1967) that may be colonised by Conus that exist in a specific
microhabitat assuming that these habitats are within the range of ecological tolerances
of Conus. Not all Conus species that favour a certain habitat will be found in the
geographical range of that habitat. Habitat types and their geographical distribution
were collected from Cabrera (1984), Elera (1896) and from the author’s field surveys.
In the intertidal and shallow water Conus, occurrences are determined largely by local
environmental complexity and spatial heterogeneity (Kohn 1997). Since range size is
positively related to increasing occurrence, Conus that live in habitats that are
common in geographic space should have larger ranges than those that live in habitats
that are uncommon. Thus it is hypothesised that habitat availability in geographical
space is a significant factor in determining range size in the Philippines.
Only 27 intertidal and shallow water Conus species with known life history, and
which were relatively common, were used in this analysis (Kohn and Perron 1994)
(Table 5.2). This introduces an unavoidable sampling bias since past work on Conus

Conus biogeography
102
biology has focussed on common species. The reproductive biology of other species
is largely unknown due to their rarity.
Table 5.2. The 27 shallow water Conus species used in analysis of range size and
habitat availability and analysis of range size and life history.
Cone ID Genus Species Life history Length of precompetent larval stage in days
1 Conus marmoreus non-planktotrophic
3
2 Conus imperialis planktotrophic 20 3 Conus litteratus planktotrophic 22 9 Conus coronatus planktotrophic 27
10 Conus miliaris planktotrophic 25 13 Conus lividus planktotrophic 29 14 Conus moreleti planktotrophic 28 15 Conus distans planktotrophic 28 17 Conus arenatus planktotrophic 0 19 Conus varius planktotrophic 25 20 Conus achatinus non-
planktotrophic 0
22 Conus striatellus planktotrophic 24 23 Conus vitulinus planktotrophic 20 24 Conus planorbis planktotrophic 22 25 Conus furvus non-
planktotrophic 0
26 Conus magus non-planktotrophic
0
28 Conus stramineus non-planktotrophic
0
34 Conus capitaneus planktotrophic 28 35 Conus rattus planktotrophic 27 37 Conus miles planktotrophic 21 38 Conus virgo planktotrophic 24 42 Conus pennaceus non-
planktotrophic 3
43 Conus textile planktotrophic 16 45 Conus figulinus planktotrophic 23 46 Conus quercinus planktotrophic 25 47 Conus striatus planktotrophic 19 51 Conus glans non-
planktotrophic 6
Conus biogeography
103
An ANCOVA with the following model was used to investigate effects of frequency
of occurrence (O), length of pre-competent larval stage (PS), and number of available
habitats (HA) on the Range size (RS) of these 27 species of Conus:
RS = O+PS+HA+ (PS x HA) + Error
All factors were transformed as log (x+1) before analysis to ensure homogeneity of
variances and to meet the assumptions of normality.
5.3.4 Habitat type and species richness
The effects on the geographical distribution of species richness of the different Conus
habitats, as defined by Kohn (1967) and modified to include other environments, are
examined using stepwise multiple regression. Collection records contained field
observations and habitat descriptions of the areas where Conus were collected. The
habitat characteristics observed were counted per OGU.
In theory, all available habitats that are suited for a Conus species will be occupied if
they experience no hindrance in colonising these habitats. In nature, the potential to
occupy these habitats is constrained by barriers to dispersal, competition and
decreasing ecological tolerances. Thus different Conus species assemblages with
varying species number may occupy a single habitat type in different places in
geographical space. This study evaluates what habitat type contributes most to
species diversity in space. The habitat that is most variable in species diversity is
hypothesised to contribute the most to geographical species diversity. There are 8
habitat classes based on substrate and geomorphologic characteristics, with some of
these representing intermediate habitats (Table 5.3). Habitat type frequencies (counted
as the number of recorded habitats in different collection sites in an OGU) and area of
the OGU were log (x+1) transformed before analysis to assure homogeneity of
variance.
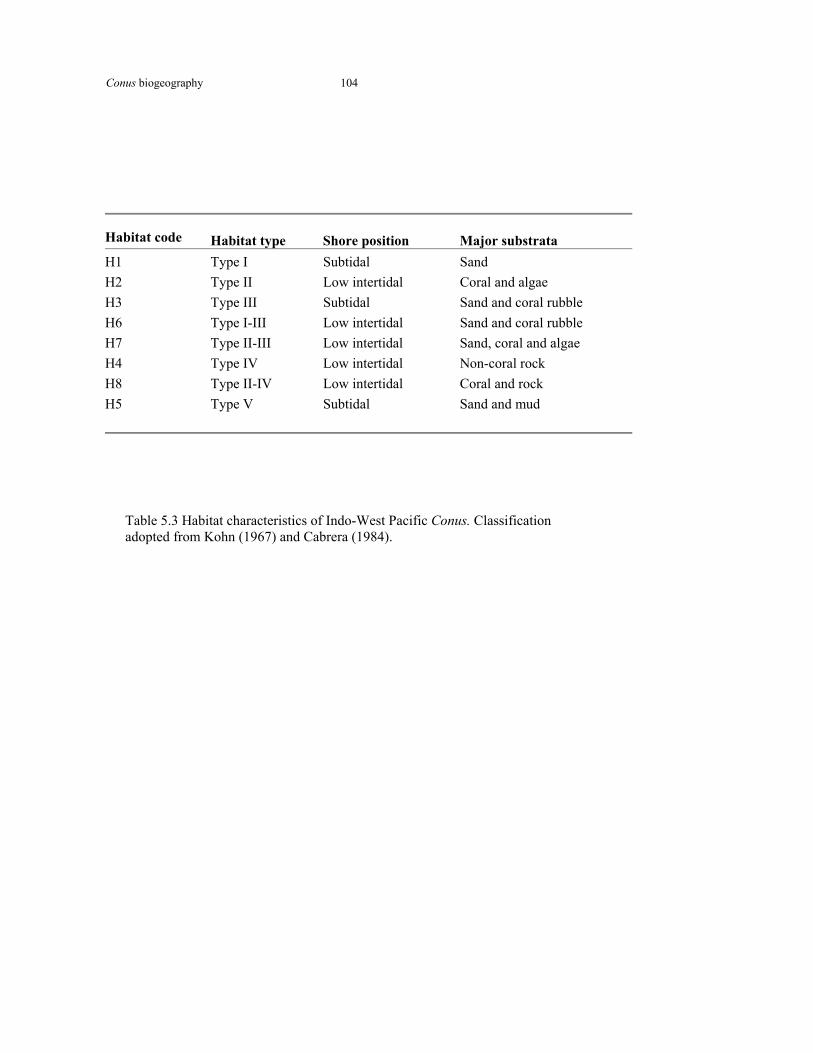
Conus biogeography
104
Habitat code Habitat type Shore position Major substrata H1 Type I Subtidal Sand H2 Type II Low intertidal Coral and algae H3 Type III Subtidal Sand and coral rubble H6 Type I-III Low intertidal Sand and coral rubble H7 Type II-III Low intertidal Sand, coral and algae H4 Type IV Low intertidal Non-coral rock H8 Type II-IV Low intertidal Coral and rock H5 Type V Subtidal Sand and mud
Table 5.3 Habitat characteristics of Indo-West Pacific Conus. Classification adopted from Kohn (1967) and Cabrera (1984).

Conus biogeography
105
5.4 RESULTS
Material
Seven hundred and sixty two records of shallow water Conus occurrences belonging
to 188 species were obtained from the collections of the Philippine National Museum
(PNM), the University of Santo Tomas (UST) and the University of the Philippines
(UP). Secondary material consisting of 363 records was obtained from Cabrera
(1984), Springsteen and Leobrera (1986) and (Kohn and Perron 1994). These records
represent a collection effort from 1898-1998. Of the 188 species recorded, only 160
species were used in ordination and range analyses since these species have locality
information.
5.4.1 Endemism estimates
The Philippine Conus endemics are Conus telatus, C. zapatosensis, C. scalptus, C.
thalassiarchus, C. thomae, C. kintoki, C. montillai, C. lenavati, C. neptunus and C.
dondani (Röckel et al. 1995). These species have all been recorded from the Sibuyan,
Sulu and Visayas Seas (Figure 5.1). None has been recorded outside these basins.
With the exception of C. telatus, C. montillai and C. thalassiarchus, all species are
from deep water (> 100 m depth). There is a species that is possibly an endemic but
was recorded and identified by de Elera (1896) and Cabrera (1986) as C. anemone.
The distribution of C. anemone is restricted to Australia. The species status of these
records that are deposited at the Pontifical University of Santo Tomas and the
Philippine National Museum remain in question. The other species are most
appropriately termed near endemics because they have been recorded outside the
Philippines only from adjacent oceanic basins (e.g. Celebes Sea, South China Sea,
Banda Sea) and the narrow distribution that McManus described. C. asiaticus, C.
aurasiaticus, C. australis, C. axelrodi, C. blandifordianus, C. broderippi, C.
cernohorskyi, C. cordigera, C. darkini, and C. excelsus, C. fischoederi, C. hirasei, C.
ichinoseana, C. ione, C. kuroharai, C. laterculatus, C. lynceus, C. polongimarumai,
C. pseudokimioi, C. pseudoorbignyi, C. recluziamus, C. rolani, C. shikamai, C. stupa
and C. subulatus are near endemics and have mainly been recorded from the Sibuyan,

Conus biogeography
106
Viasyas and Sulu Seas. With the sole exception of C. lynceus, all are recorded only
from deepwater habitats.
Endemics make up 5.7 % of the total recorded Philippine Conus fauna of 173 shallow
and deepwater species. Near endemics make up 14.4 % of this total. There are only 3
endemic shallow water species and one near endemic.
5.4.2 Ecological correlates of frequencies of occurrence
Figures 5.2a-b show the PCA plots of frequency of occurrence of Conus at sites in the
Philippines. The Philippine assemblages of the 175 species examined are correlated
primarily with cyclone frequency and coastal complexity on the PC 1 and PC 2 axes.
On the PC 1 and PC 3 axes, island and latitude factors are significant (Table 5.4a).
The variances accounted for by the PCA on the first and second axes are relatively
low. This suggests that local ecological factors are important (e.g. the distribution of
habitats) in determining diversity on a large scale. Such local factors were not
measured in this study.

Conus biogeography
107
PC Axis
1 2 3
r r-sq tau r r-sq tau r r-sq tauNumber of
OGU N = 14
Philippines
Complexity 0.285 0.081 0.077 -0.576 0.332 -0.143 0.344 0.118 0.231
Cyclones -0.025 0.001 0.129 0.674 0.454 0.439 -0.136 0.018 -0.052
Tide -0.355 0.126 -0.268 -0.366 0.134 -0.402 0.310 0.096 0.223
Latitude -0.395 0.156 0.420 -0.068 0.005 0.066 -0.501 0.251 -0.530
Island -0.356 0.127 -0.545 0.119 0.014 -0.061 0.568 0.322 0.484
Table 5.4a. Results of a PCA analysis of frequency of occurrence of 175 species of Philippine Conus. Table shows Pearson (r) and Kendall (tau) correlations with significant ecological factors. The numbers in bold represent factors with strongest correlations to frequency of occurrence.

Conus biogeography
108

Conus biogeography
109

Conus biogeography
110
Table 5.4b Pearson correlations of macroecological factors with Conus species richness in OGUs in the Philippines.
** significant at (P<0.01)
Macroecological factor
Area Cyclones Islands Embayment Temperature Rainfall Reef Tides Lat Long
Philippines N=14 0.659** 0.261 -0.049 0.359 0.115 -0.081 -0.137 -0.193 -0.049 0.021

Conus biogeography
111
Species richness is significantly correlated with area in all bioregions in the
Philippines. (Table 5.4b).
5.4.3 Species-area analysis
Figure 5.3 and Table 5.5 illustrate the species-area curve in the Philippines. The
parameters of the species-area curves vary for each basin (Table 5.5). The Philippine
basins of the Sibuyan Sea and Visayas Seas have the highest species richness (n= 73,
52 respectively). These regions are in the centre of the archipelago, and have the
highest coastal complexity; percent of reef fringed coastline, and numbers of islands.
They are also bathymetrically complex.
The Sulu Sea has a z value of 0.43. One z value from the Visayas basin shows an
anomalously high z value of 1.30.

Conus biogeography
112
Table 5.5 Area (km2), number of collection sites, Conus species number, and C and z estimates (see Chapter 3 for how this was calculated) of the Philippine oceanic basins.
Geographic unit Surveyed area Survey
sitesSpecies
number
C Z
Basin
Philippine Sea 381.39 10 27 0.26 0.73Visayas-Camotes 644.22 12 52 0.02 1.30Sibuyan Sea 419.64 53 73 0.63 0.59Sulu Sea 353.86 12 31 1.22 0.43South China Sea 711.76 63 39 0.35 0.75Philippines 2510.87 150 160 0.19 0.86

Conus biogeography
113
Table 5.6 ANOVA of basin and bioregion effects on the total species richness of Philippine Conus. NS- not significant
Factor MS DF F Sig.
Philippines
Area 1.090 1 18.79 0.004Basin 0.089 4 0.488 0.673Error 0.581 9 0.005 Levene’s Test NS
Factor MS DF F Sig.
Philippines
Area 1.090 1 18.79 0.004Basin 0.089 4 0.488 0.673Error 0.581 9 0.005 Levene’s Test NS
Factor MS DF F
Philippines
Area 1.090 1 18.79 0.004Basin 0.089 4 0.488 0.673Error 0.581 9 0.005 Levene’s Test NS

Conus biogeography
114
y = 0.1918x0.8657
R2 = 0.6803
01020304050607080
0 100 200 300 400
Area surveyed (sq. km)
Spec
ies
richn
ess
Figure 5.3. Species-area curve for Philippine Conus. Surveys in the Philippines were done on stretches of fringing reef coastline that form a significant physical feature of geographic regions (see Table 5.1a OGU attributes).

Conus biogeography
115
Area is statistically significant as a covariate of species richness (P<0.001), thereby
implying that area effects are important in predicting basin species richness. (Table
5.6). However, the effect of Basin on species richness is not significant (p = 0.67).
5.4.5 Provinciality and Homogeneity
5.4.5.1 Oceanic basins of the Philippines
The provinciality indices of Philippine Conus in the oceanic basins are shown in
Figure 5.4. These indices suggest that faunal similarities between oceanic basins are
low and are reflected in low percentages of homogenisation (χ2 test, P <0.001)
The high provinciality indices of the Sibuyan and Visayas basins are directly related
to the nature of the species-area curve in these regions. The high provinciality is a
consequence of high species richness in geographic regions in these basins. The
basins therefore exhibit the properties of separate biogeographical provinces, and may
imply that the evolutionary history of each basin is somewhat separate from that of
the others. However, a possible area independence effect, or the de-coupling of
species richness with area may also contribute to this provinciality. This is a possible
consequence of a large number of heterogenous habitats in a small area in a basin,
differences in productivity in regions of a basin, or variability in recolonisation
dynamics.

Conus biogeography
116
P
0
0.5
1
1.5
PS VIS SIB SS SCS PH
Oceanic basins
Ros
enzw
eig'
s in
dex
P
Figure 5.4. Provinciality (P) plot of Philippine Conus in the marginal oceanic basins. PS – Philippine Sea, VIS – Visayas, SIB – Sibuyan Sea, SS – Sulu Sea, SCS – South China Sea, PH –whole Philippines.

Conus biogeography
117
y = -0.0274x + 1.6958R2 = 0.8601
0
0.5
1
1.5
2
0 10 20 30 40 50 60
number of islands in each basin
z
y = -0.0247x + 2.4437R2 = 0.5982
0
0.5
1
1.5
2
0 20 40 60 80
percent reef fringed coast in each basin
z
y = -10.609x + 1.533R2 = 0.4003
0
0.5
1
1.5
2
0 0.02 0.04 0.06 0.08 0.1
complexity index
z
Figure 5.5a-c. Linear trends of basin z parameter with a) basin
islands, b) coral reef distribution and c) coastal complexity.
a)
b)
c)
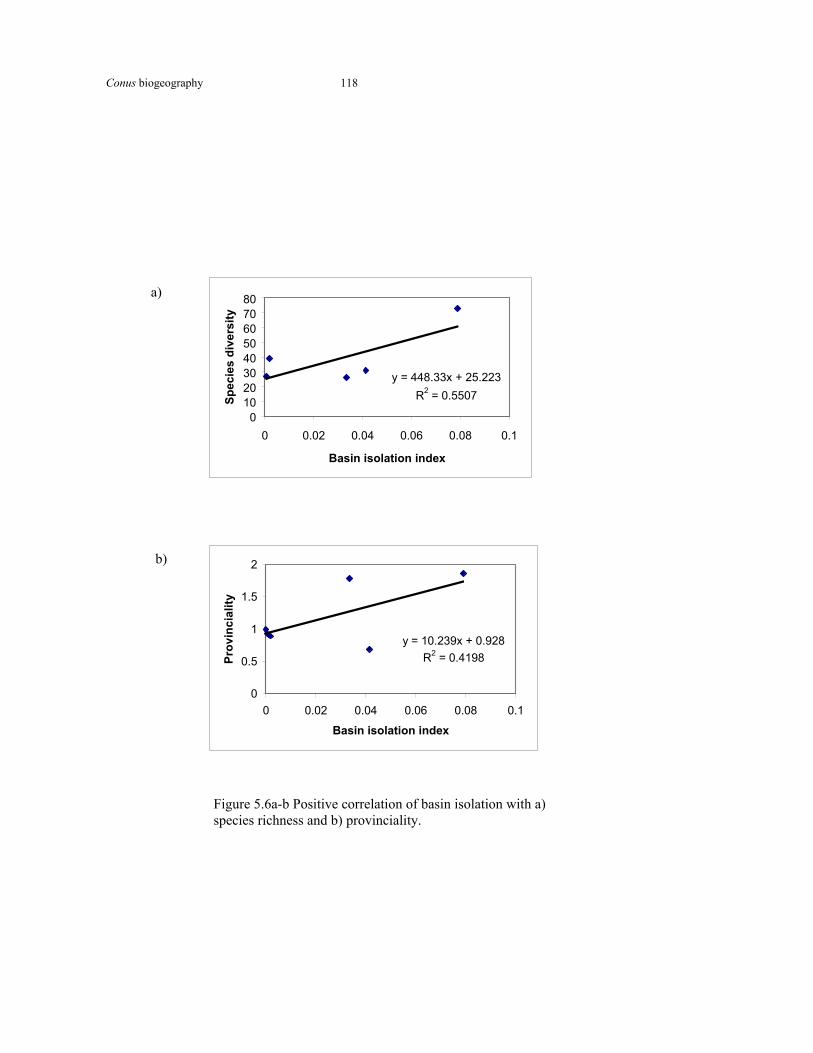
Conus biogeography
118
y = 448.33x + 25.223R2 = 0.5507
01020304050607080
0 0.02 0.04 0.06 0.08 0.1
Basin isolation index
Spec
ies
dive
rsity
y = 10.239x + 0.928R2 = 0.4198
0
0.5
1
1.5
2
0 0.02 0.04 0.06 0.08 0.1
Basin isolation index
Prov
inci
ality
Figure 5.6a-b Positive correlation of basin isolation with a) species richness and b) provinciality.
a)
b)

Conus biogeography
119
5.4.6 Historical basin isolation, ecological factors and z estimates
In the Philippine oceanic basins, z has a negative relationship with number of islands,
amount of reef fringed coast, and coastal complexity (Figure 5.5 a-c). This is related
to the increase in species richness per unit area as habitats increase. It is presumed that
an increasing area will have a wider suite of habitats (Rosenzweig 1995). However
only the number of islands in each basin has a statistically significant negative
relationship (P<0.05) with z. However, the sample size is low since there are only 5
basins in the Philippines.
Basin isolation measured as a physical geographic index is positively, but not
significantly, correlated with species richness (Figure 5.6a) and faunal provinciality
(Figure 5.6b).
5.4.7 Estimation of species loss (extinction) rate
Figure 5.8 shows the estimated species loss rates in various parts of the Indo-West
Pacific and in the highly isolated regions of Hawaii and the Galapagos. This plot is
based on the parameters estimated for the Pacific Ocean Conus species-area curve.
If isolation, whether by distance, time or physical dispersal barriers, has subdivided
the fauna, these divisions would have resulted in separate evolutionary histories for
the areas. These histories will be reflected in the distribution and ranges of the modern
fauna. Basin isolation, and similar hypotheses, predicts higher species richness in the
isolated, compared with the non-isolated, oceanic basins.
The estimates presented here suggest that the Philippine basins have a negative
species loss rate (species are accumulating over the period) compared with areas of
similar size in most of the rest of the Pacific. This suggests that these basins are either
centres of speciation or species persistence. In contrast, the highly isolated Hawaiian

Conus biogeography
120
and Galapagos archipelagos show a positive extinction rate, which suggest that the
faunas here are losing species.
When species loss is plotted against and index of basin isolation, there is a negative,
but non-significant, correlation (Figure 5.7) Increasing basin isolation may result in
increased species persistence or species accumulation. Isolation patterns may have
been masked by reconnection of the basins as a result of recent sea level stabilisation,
thus the non-significant correlation.

Conus biogeography
121
Figure 5.7 The negative relationship of an index of basin isolation and an index of species loss.
y = -29.221x + 0.018R2 = 0.4536
-3.5
-3-2.5
-2
-1.5
-1-0.5
00 0.02 0.04 0.06 0.08
Basin Isolation
Spec
ies
loss
inde
x

Conus biogeography
122
-3.5-3
-2.5-2
-1.5-1
-0.50
0.5
PS VIS
SIB SS
SCS
PH HI
GAL JAP
wtc
mcn
GBR
Geographical unit
Spec
ies
loss
inde
x
Figure 5.8 Potential Conus extinction rates (species loss index) in geographical regions of the Indo-West Pacific. The very isolated Galapagos and Hawaiian Archipelagos are included for contrast. PS –Philippine Sea, VIS –Visayas, SIB- Sibuyan Sea, SS –Sulu Sea, SCS-South China Sea, PH –Philippines, HI –Hawaii, GAL –Galapagos, JAP- Ryukyu Islands, Wet Tropics Coast –Wet Tropics bioregion (GBR), Mackay Capricorn Coast –Mackay Capricorn bioregion (GBR) and GBR –Great Barrier Reef.

Conus biogeography
123
5.4.8 Analysis of range size, larval duration and habitat of Conus
The length of the pre-competent planktonic larval stage is not a statistically significant
factor (p = 0.064) in determining the range size of Conus at the scale of the
Philippine archipelago (Table 5.7). Frequency of occurrence is highly significant
(P=0.005) as a covariate. Habitat availability, and the interaction of planktonic
duration and habitat availability, affect range size significantly (P<0.05). These results
suggest that at this geographical scale, the effect of dispersal capability in determining
geographical range interacts with smaller-scale ecological determinants of species
richness.
5.4.9 Habitat and species richness
In the Philippines, the frequency of shallow subtidal sandy habitats (H1) is the most
significant predictor of species richness (P<0.001) in each geographic unit (Table 5.8)
The H1 (shallow subtidal sandy habitats), H2 (intertidal coral-algae intertidal) and H8
(muddy sand) habitats are the most numerous in the Philippine archipelago. The H2
habitat accounts for 30% of the total habitats noted in this study. H2, H8 and H7
(intertidal sand-coral-algae) habitats are predominantly low intertidal environments
associated with coral reefs. H2 habitats have more species than H1 habitats. H1
habitats are often present even when there are no recorded H2 habitats in an OGU.
The low number of species, but variable occurrence, in H1 habitats, contributes
significantly to patterns of species richness in the whole Philippines (Figure 5.9).

Conus biogeography
124
0
10
20
30
40
50
60
70
80
East Cebu EastPalawan
EastSamar
NorthernPanay
NW Luzon Samar SouthernPanay
SibuyanSea
Islands
Sulu SeaIslands
SW Bohol SW Luzon TayabasBay
WesternLuzon
OGU
Spe
cies
ric
hnes
s
H1H2
Figure 5.9 Species richness in H1 (subtidal sandy habitats) and H2 (low intertidal coral and algal bench) habitats in Philippine geographical units.

Conus biogeography
125
Source df MS F Sig PowerModel 27 0.1560 8.42 0.025 0.831Intercept 1 4.3390 234.56 0 1.000Frequency 1 0.6060 32.74 0.005 0.985Planktonic duration 14 0.0094 5.08 0.064 0.601Habitat availability 7 0.1190 6.43 0.046 0.675Plankton x Habitat 5 0.1730 9.33 0.025 0.809Error 4 0.0180Total 32 Levene's Test of Equality NS
Table 5.7. ANCOVA investigating factors affecting range size of Conus in the Philippines. On the scale of the Philippine archipelago, habitat availability predicts range size better than the length of the planktonic stage of a species. However, there is a significant interaction between planktonic larval duration and habitat availability.
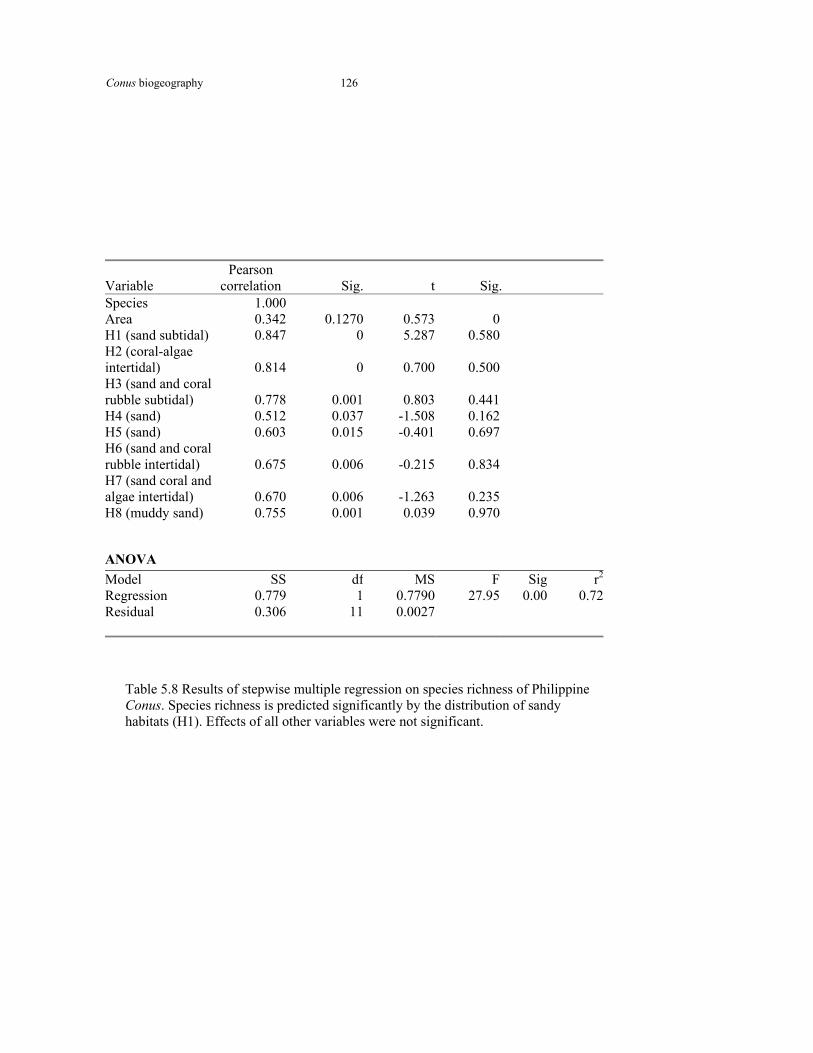
Conus biogeography
126
Variable Pearson
correlation Sig. t Sig. Species 1.000 Area 0.342 0.1270 0.573 0 H1 (sand subtidal) 0.847 0 5.287 0.580 H2 (coral-algae intertidal) 0.814 0 0.700 0.500 H3 (sand and coral rubble subtidal) 0.778 0.001 0.803 0.441 H4 (sand) 0.512 0.037 -1.508 0.162 H5 (sand) 0.603 0.015 -0.401 0.697 H6 (sand and coral rubble intertidal) 0.675 0.006 -0.215 0.834 H7 (sand coral and algae intertidal) 0.670 0.006 -1.263 0.235 H8 (muddy sand) 0.755 0.001 0.039 0.970
ANOVA Model SS df MS F Sig r2
Regression 0.779 1 0.7790 27.95 0.00 0.72Residual 0.306 11 0.0027
Table 5.8 Results of stepwise multiple regression on species richness of Philippine Conus. Species richness is predicted significantly by the distribution of sandy habitats (H1). Effects of all other variables were not significant.

Conus biogeography
127
5.4.10 Areography
In Conus, 60% of the Philippine ranges can be considered triangular (Figures 5.10 and
5.11). With the sole exception of C. ebraeus, Conus species have ranges less than
100,000 km2 (Figure 5.12) When plotted against species richness, range size
distributions in the Philippines show a strong skew to the right. (Figure 5.12)

Conus biogeography
128
0
2
4
0 2 4
Log km E-W
Log
km N
-S
Figure 5.10 Conus range shapes in the Philippines
1
2
4
3

Conus biogeography
129

Conus biogeography
130
0
2
4
6
8
10
0 to10
10 to20
20 to30
30 to40
40 to50
50 to60
60 to70
70 to80
80 to90
90 to100
Range size class in thousand sq. km
Spec
ies
richn
ess
Figure 5.12. Number of species of Philippine Conus plotted against range size.

Conus biogeography
131
5.5 DISCUSSION
5.5.1 Species-area relationships and ecological correlates
The results presented are an indirect test of basin isolation as a possible mechanism to
account for high marine species richness in the Philippines. McManus (1985)
hypothesised that high species richness in Southeast Asia is attributable to 1) range
overlap of independently evolved species 2) high rates of local speciation and 3)
differentially high survival rates of species among temporally and spatially
heterogeneous habitats. This chapter examined species-area curves of Conus in the
Philippines to make inferences about Basin Isolation.
Amount of area was a significant predictor of species richness. This is consistent with
observations on similar highly diverse faunal assemblages (Rosenzweig 1992;
Rosenzweig 1995).
However, when one views some areas at a smaller spatial scale in these highly
species-rich regions, the SPAR estimates do not predict the observed species richness
well. This is a possible area-independence effect, first observed in the richness of
terrestrial plant communities. This effect suggests that below a certain area size,
species richness becomes independent of available habitable area (Rosenzweig 1995).
Possible explanations for this include 1) the existence of a large number of
heterogenous habitats in a very small area (Rosenzweig 1995) and 2) the effects of
recolonization and extinction over a short time frame (Atmar and Patterson 1995).
The second of these has been observed in species that have wide dispersal abilities,
such as birds. Thus the area-independence effect, or the de-coupling of area with
species richness, is likely dependent on the characteristics of the taxon being studied.
Since the aim of this thesis is to describe distribution, I cannot hypothesise on the
possible causes of this area-independence effect based on the available data. However,
one may suggest that the wide dispersal ability of many marine invertebrates supports
the second explanation. However, the first explanation may also hold for Conus, since
it is capable of existing in a wide range of habitats. Examination of SPARs of other

Conus biogeography
132
marine taxa occupying the same regions may help in explaning current distributions.
The use of species-area relationships to estimate faunal isolation assumes that lack of
past isolation results in lower z values. This has been demonstrated in similar analyses
of marine fossil taxa (McKinney 1998). Isolation of faunal assemblages resulting
from the Pliocene emergence of the Isthmus of Panama resulted in higher estimates of
z (0.25 < z < 0.45) between the now isolated Panama and Caribbean provinces. Z
estimates of regions within these provinces are generally much lower (z = 0.15).
Z values observed in the Philippine Conus are comparable to those observed in
tropical taxa, such as corals (z = 0.45) (Veron 1995), tropical marine biota (z = 0.53)
(Briggs 1986), Caribbean echinoderms (z = 0.30), and Strombidae from the Panama
region (z = 0.46) (McKinney 1998).
However, there is one fundamental difference between the past situation in the
Philippines and the closure of the Panama Isthmus. The oceanic basins of the
Philippines were physically isolated in the past, but are now partly connected. Any
isolation event in the Plio-Pleistocene may have resulted in possible species
endemism, and higher z values. The positive (but not significant) correlation of z with
the index of basin isolation supports the hypothesis that geographical isolation in the
past has contributed to increased z estimates and provinciality. These patterns may be
further confirmed by looking at endemism patterns within the basins. Basin endemics
in Conus are found only in the central basins of the Philippines.
A high z estimate for the Visayas Basin suggests that this area was possibly isolated
by low sea level for longer periods than other basins. The results of this study support
this hypothesis. It is possible that rapid species divergence occurred here, and with
the higher habitat heterogeneity provided by numerous islands, rapid speciation was
favoured. It is also possible that relict fauna more related to fossil assemblages may
co-exist with more modern fauna (Petuch 1987). The estimates of extinction rates
suggest that these areas are accumulating species. The endemism estimate of Conus in
the Philippines is around 7% of the total fauna. This is more than that estimated for
other Philippine molluscan taxa (including bivalves) at 4-5% (Springsteen and
Leobrera 1986).

Conus biogeography
133
This high estimate of z for the Visayas Basin should usually occur only in highly
diverse tropical systems. In addition high z values also imply that geographical
regions within the basins have high species diversity. The regions within the basins
therefore, show the properties of provinces, where z values approach unity. However,
the SPAR estimates in the Visayas and Sibuyan Sea basin do not predict species
richness well. This is due to the fact that species richness on a locality level in these
regions is very variable. Some sites have high species richness and some low. This
results in possible area independence or a small island effect (Macarthur and Wilson
1967) that may be a consequence of a large environmental variability in a small area
(Rosenzweig 1995).
The basins with the most number of islands are the largest basins of Sulu Sea, South
China Sea and the Philippine Sea. Islands along these coastlines are on the edges of
the ocean basins. Z variability here is lower likely due to “tighter” SPARs. This is
likely due to the greater area and nearness of the main coastal islands. This is unlike
the central Philippines, where islands may be found in the centre of the basins (e.g.
Marinduque, Masbate, Camotes, Romblon, Cuyo). While the central basins may have
coral islands and cays, these islands are likely to support variable numbers of Conus.
Some islands will have very low species richness. Because of this widespread
variability between islands, which is reflected in the SPAR estimates, a high
provinciality is observed in these basins. The consequence of this high variability is a
less “tight” SPAR.
The high z estimates for the Philippine basins are consistent with what is known
about high diversity tropical systems such as rainforests (Rosenzweig 1995). In these
high diversity systems, the species-area curves of various biotas are linear, with a z
value approaching unity. Inter-provincial curves have typically higher slopes than
those of intra-provincial curves. This is due to the relative isolation of biotic
provinces that reduces exchange of species with extensive dispersal abilities, and thus
encourages species diversification. Low z estimates are indicative of the presence of
sink species or species that are constantly under threat of local extinction. On small
islands, where habitat-richness is theoretically less than on mainland and larger
islands, sink species on average do not persist, but are replaced either by immigration

Conus biogeography
134
or local speciation. If the central Philippines basins had experienced long periods of
isolation, the molluscan fauna in these basins should have higher species richness
than the coasts bordering the South China Sea and Philippine Sea basins.
The Rosenzweig (1995) and McKinney (1998) hypotheses say that increasing
geographical isolation results in higher z values and hence provinciality. The patterns
observed here partially support the two hypotheses. The isolation observed here is a
consequence of islands with varying SPAR parameters separating the basins.
However this isolation is not due to distance isolation or isolation presupposed by the
fragmentation of habitat.
This study suggests that coastal features such as reefs, islands and features such as
cyclones, are major factors affecting the modern distribution of Conus. Cyclones have
been known to reduce Conus densities and diversities on shallow reef flats (Kohn
1980). Furthermore, cyclones are believed to be major factors maintaining diversity
of coral reefs (Connell 1978). An examination of the distribution of cyclones with
respect to patterns of diversity of marine organisms observed in the Indo-Pacific could
be a fruitful area of future research.
5.5.2 Areography of range size of Conus
Properties of range sizes may give insights into the nature of speciation and the
maintenance of biological diversity (Brown 1996). In Philippine Conus, the frequency
distribution of range sizes is similar to that observed for diverse terrestrial taxa
(Kolasa 1996).
Narrow and small species ranges may be limited by habitat availability and dispersal
capabilities (Gaston 1996). In addition, ecological tolerances and history affect
species range size (Brown 1996). However how history, which includes speciation,
affects range size is unclear. Firstly, species with large ranges may be prone to give
rise to new species with restricted ranges through range fragmentation by vicariance.
This is often sugested to explain nested and overlapping distributions in high
diversity regions (Kolasa 1996). Secondly, species with small ranges may speciate
more through sympatry. Distinguishing between these two hypotheses will require

Conus biogeography
135
studies of temporal dynamics of species ranges, detailed molecular studies and a
geographic approach to community structure (Kolasa 1996; Maurer 1999).
Ecological and historical factors probably can explain the frequency distribution of
Conus ranges in the Philippines. The Philippines, with its potential historical isolation,
is an ideal place to investigate the occurrence of narrow species ranges. The
Philippines is likely to contain co-evolved species with narrower ecological
tolerances, due to its isolation and the peculiarity of geography and climate.
5.5.3 Analysis of range size of Conus: effects of larval duration and habitat
availability
Marine provinces do not fit the strict definition proposed by Rosenzweig (1995). He
states that provinces derive their species largely by speciation. By this definition the
Indo-Pacific would be the only province in the region. Recognised marine provinces,
however, are more inter-connected, due to the planktonic larvae of most marine
animals. Marine provinces are therefore inherently “leaky” (Rosenzweig 1995). While
distributions of marine organisms tend to be large, factors such as life history and
habitat selectivity may determine the realized extent of these distributions.
As the most species-rich of intertidal gastropod taxa, Conus has been the focus of
many studies of the factors that may determine species richness and distribution
(Kohn 1997). At inter-oceanic scales, life history strategies such as a long pre-
competent planktonic larval stage correlate significantly with range size (Kohn and
Perron 1994). Like the fauna of most Indo-Pacific archipelagos, shallow water Conus
of the Philippines have almost exclusively planktonic larval stages and wide
geographical ranges (Kohn and Perron 1994). Thus sixty-three of the 100 relatively
common shallow water species in the Philippines have representatives in the central
Pacific. A major aspect of range size in Indo-Pacific Conus is thus probably
determined by life history strategies that include long planktonic stages, and egg sizes
and egg capsules susceptible to rafting.
Since 22 of the 27 shallow water Philippine Conus in this study have excellent larval
dispersal potential, it can be assumed that if suitable ecological conditions are

Conus biogeography
136
available, the various species will be able to colonise the whole archipelago. The
distributions of Conus in the country, with the exception of the ubiquitous C. ebraeus,
are normally narrow and triangular.
In a high diversity system, co-evolution can produce species with narrow habitat
ranges (Rosenzweig 1995). This is less likely to occur in less diverse systems. Thus,
a given species may occupy more habitat types in a low than a high diversity system.
For example, in Easter Island there is only one species of Conus, C. miliaris that
expanded its diet considerably in the absence of competitors (Kohn, 1979). However
the lack of suitable habitats prevents it from expanding its range (Kohn, 1979).
5.5.4 Habitat type and species richness
The distribution of sandy habitats (H1) contributed significantly to patterns of species
richness of Conus in the Philippines. H1 habitats have the least species richness of
Conus on a local scale, but species richness in these habitats is extremely variable
geographically (Kohn 1997). The distribution of H1 habitats with variable species
richness contributes significantly to the overall species richness in the Philippines.
This is perhaps due to the fact that H2 habitats (that have high species richness) are
not recorded in some areas where H1 habitats are observed. Even if these H1 habitats
have low species richness, they still contribute overall to the total species richness of
Philippine Conus.
H1 habitats are typical of coral reef lagoon environments. The extreme variability in
species richness in these habitats suggests that species with wide habitat requirements
may tend to use unoccupied H1 habitats, if conditions are favourable. As other
habitats have similar and less variable species composition per unit area, variability in
species richness in H1 habitats will contribute significantly to species richness at
geographic scales.
Other habitat types consisting of mixed sand and coral rubble (H2 and H3), have the
highest species richness per unit area of intertidal Conus, with an average of 8 co-
occurring species (Kohn 1997). However, species composition in these assemblages is
less variable than in H1 habitats, or in the more species rich subtidal reef platform
habitats H6 and H8.

Conus biogeography
137
These results support Kohn’s (1997) hypothesis proposed to account for the high
species richness of Conus.
5.5.5 Extinction, persistence and endemism of Philippine Conus
It is hypothesised that the high z estimates for the central Philippines basins are
related to the presence of island complexes and their associated habitat heterogeneity.
These central Philippine basins are smaller than the Philippine Sea and South China
Sea basins. Large island coastlines bordering these central basins have a higher
diversity of habitats, and have more species. In smaller islands mainly found near the
centre of the basins, there are fewer species. In the isolated Hawaiian archipelago,
faunal instability can be inferred from the fossil record. In Hawaii, modern
assemblages have replaced suites of Pleistocene gastropod assemblages (Kay and
Palumbi 1987). This includes the extinct Conus kahiko, now replaced by the widely
distributed C. chaldaeus. This suggests that island habitats do not favour the
dominance and persistence of a single, or a few, species, possibly as a result of faunal
instability.
Extinction rate estimates calculated from species-area parameters suggest that the
Philippine oceanic basins are regions of species accumulation and speciation. This is
supported by ecological and evolutionary studies (Vermeij 1987), for example the
range contraction of many marine molluscs during the Pliocene and Pleistocene. The
level of endemism in the Conus of the Philippines (7%), which is less than the level
of endemism in isolated archipelagos like Hawaii (10%) (Kay and Palumbi 1987),
does not give any inference about the mechanisms that may have led to this
endemism. However, it may give insights into the evolutionary constraints on Conus
endemism.
Assuming that endemism suggests rapid speciation, the endemism estimates of
Philippine molluscs (5%) suggests that the Philippines is not a centre of rapid
speciation at present, but of species accumulation. In contrast, the isolated Hawaiian
and Galapagos archipelagos have positive extinction rates. Hawaii and the Galapagos

Conus biogeography
138
are not accumulating species. Intermittent gene flow to these isolated islands has
allowed the evolution of new species, thus accounting for high levels of endemism.
On the other hand, endemism may not suggest rapid speciation in the marine
environment. Wallace (1997) has determined that in Indonesian Acropora corals,
endemics have pleisomorphic characters, thus making them likely Tethys Sea relicts.
The presumably younger species with apomorphic characters have typically wide
IWP distributions. Thus evolution has allowed for new species to rapidly disperse
throughout the region. A similar process may have affected modern Conus. The last
major radiation of Conus in the IWP occurred in the Pliocene to Pleistocene (Kohn
1990). This radiation has contributed substantially to the wide-ranging modern fauna.
Thus the Philippines shares a large percentage of the Pacific Ocean fauna that were
derived from the pan-Pacific Tethyan biota (Poore 2000).
Vermeij (1987) tested the species accumulation model for central and eastern Pacific
molluscs. In Conus, and sand dwelling taxa such as Oliva (Tursch and Greifeneder
2001), seperation by large distances selects against sand dwelling species, because it
is possible that sand dwelling caenogastropods have shorter larval stages. It is also
possible that the decline in space of species diversity in these gastropods is associated
with the decline in numbers of suitable habitats or by declining primary productivity
(Vermeij 1987; Vermeij 1990). These species have narrow ranges and consequently a
higher extinction probability. Such species do not form a large part of the Central
Pacific Conus assemblages, and probably became extinct on oceanic atolls due to sea
level regressions. Fifty-four percent of Indo-Pacific Type I (sand dwelling) Conus
species (Röckel, Korn et al. 1995) occur in the IWP island arc.
Rosenzweig (1995) also predicts the fate of global marine species diversity, using
species-area analysis. Since global marine provinces have an inter-provincial z value
of 0.3, biotic isolation is predicted to result in a 62% increase in species diversity.
Using this model with the Philippine estimate of z (0.86), the predicted accumulation
of Conus diversity in the Philippines due to basin isolation is 25%, a value similar to
the effects of biotic isolation (33.5%) on terrestrial high diversity systems in the
tropics (Rosenzweig 1995). McKinney (1998), used the provinciality model to

Conus biogeography
139
evaluate the effects of the closure of the Panama Isthmus on species diversity of the
Caribbean and Pacific faunas. He predicted a 45-60% increase in diversity due to the
closure.
5.5.6 Marine biogeographic characterisation of the Philippines
Earlier marine biogeographic characterisation of the Philippines has suggested that the
country could be divided into two marine provinces (DENR and UNEP 1997). The
main oceanic basins bordering the country, the Philippine Sea and the South China
Sea, define these provinces. Based on studies on scleractinian coral diversity, Aliño et
al (1993) further subdivided these provinces into bioregions coincident with the
marginal oceanic basins.
The results of this study support the hypothesis that the marginal oceanic basins of the
Philippines are distinct biogeographical units that may have had separate evolutionary
histories. This is supported by the differing SPAR and provinciality properties of the
basins.
5.5.7 Further tests of the Basin Isolation Hypothesis
McManus’ proposed basin isolation hypothesis has been examined here using the
species-area-time relationship first proposed by Rosenzweig (1995). The results of
this study tend to support the role of diverse habitats in accounting for the high
species diversity observed. This habitat heterogeneity is likely an eco-geographical
property of the oceanic basins of the Philippines.
Isolating factors that have operated in the past may be tested by phylogenetic analysis
of representative taxa with wide-ranging and localised distributions (Duda and
Palumbi 1999; Duda et al. 2001). This will provide insight into the possibility of
endemic and plesiomorphic relicts coexisting with the modern and younger fauna
(Duda and Palumbi 1999). An important area of interest here is the occurrence of
sibling species with east-west distributions (Duda et al. 2001). It is important to
determine the sympatric or allopatric character of such distributions. Also an

Conus biogeography
140
evaluation of genetic connectivity of species assemblages between and within basins
may test modern basin isolation (Barber et al. 2000). Such studies will test the
speciation aspect of the hypothesis.
The confirmatory test of basin isolation is to examine the paleontological record,
where Conus has been recorded from fossil sequences in Panay (Dickerson 1927), and
thus directly measure speciation and extinction rates. The genus Conus is an excellent
taxon to test this. The basic conical form of the shell has been constant throughout
most of its evolutionary history, and thus is easily recognised. Rapid evolutionary
divergence in the genus is coincident with the rapid development of coral reefs in the
Cainozoic (Kohn and Perron 1994). Uplifted coral islands, such as eastern Cebu and
Bohol, may provide interpretable paleontological sequences to test the hypothesis.
The Miocene and the latest Pleistocene radiation of the genus may be examined
within the Philippines from fossil records.
The narrow distributions of Conus in the Philippines imply a local-scale,
environmentally determined distribution, likely due to the distribution of suitable
microhabitat (Kohn 1997) and the distribution of potential prey items (Kohn 1969).
Co-occurring Conus species are known to use different foods, microhabitats or both
(Kohn and Nybakken 1975). Dispersal, while an important determinant on inter-
oceanic scales, does not appear to be a highly significant determinant of range size
and shape at the scale of the Philippines.
5.6 CONCLUSIONS 1. The high species richness of the Indo-West Pacific was examined using the
caenogastropod Conus. The Philippines has a high level of species richness.
2. In the Philippines, 10 endemic species are recorded only from the central Philippine
basins. Seven of these species are recorded from deepwater habitats. Near endemics
are recorded only from adjacent oceanic basins.

Conus biogeography
141
3. Cyclone frequency, coastal complexity, presence of islands and latitude correlate
with distribution patterns of Philippine Conus.
4. The nature of the species-area relationship in Conus provides some evidence for
basin isolation. The z parameter for each ocean basin is positively correlated with a
basin isolation index. The provinciality index of oceanic basins correlates positively
with the basin isolation index. However a possible explanation of high provinciality is
related to the varying diversities of OGU and sites. This may suggest a de-coupling of
species diversity with area. This is an area-independence effect, possibly arising from
the large number of heterogenous habitats in a single area.
5. Triangular, overlapping and nested distributions within the Philippines, as predicted
by McManus, are observed in Conus. These distributions are correlated with the
presence of factors like islands, reefs, and embayments.
6. The frequency distribution of range size of Conus versus species richness of Conus
for Philippine basins is right (positive) skewed.
7. Larval duration does not affect range size of Conus significantly in the Philippines.
The interaction of this life history characteristic with habitat does, however, affect
range size significantly.
8. Predominantly sandy habitats (H1) contribute significantly to patterns of species
richness of Conus in the Philippines. This habitat is extremely variable in species
richness at a local scale. The predominantly low intertidal coral reef associated
habitats (H2, H7 and H8) are numerous in the areas sampled, but they are not
significant contributors to species richness.
9. Extinction rates estimated from the species-area properties of tropical Pacific
Conus suggest that the Philippines and the IWP are centres of species accumulation or
speciation. The isolated Hawaiian and Galapagos archipelagos have positive
extinction rates. These observations need to be tested by paleontological,
phylogenetic and genetic studies of comparable marine taxa.

Oliva biogeography
142
CHAPTER 6
The biogeography of a sand dwelling coral reef gastropod, Oliva, in the Philippines There is so much to do: unanswered questions lurk in every page Bernard Tursch (2001) in “Oliva Shells “ This chapter examines distributions and morphological diversity in the gastropod
genus Oliva in the Philippines. Some representatives of the genus in the Philippines
have distributions which are localised in ocean basins. Some species are found only in
certain basins, even though they have a wider IWP distribution. The morphological
diversity of polytopic (species that live in a many kinds of substrates) and monotopic
(species that live in a single kind of substrate) species are examined. I investigate
1. If Oliva have similar distributions to Conus
2. If morphological diversity in Oliva varies with oceanic basin
3. The possible origins of IWP species in the genus.
6.1 INTRODUCTION
The genus Oliva has 74 species. These are found only in tropical regions of the
Atlantic, Indian and Pacific oceans (Tursch and Greifeneder 2001). The genus is
exclusively found on soft substrates, mainly sand, from the intertidal to 100 m depth,
with a majority of species found between 0-30 m. The genus is considered a shallow
water (0-60 m) genus (see Chapter 4). The highest species diversity in the IWP
representatives of the genus is found at approximately 5 m depth (Tursch and
Greifeneder 2001).
There are 59 species in the IWP. Thirty-five species occur in the Philippines (Tursch
and Greifeneder 2001). The Philippines has one endemic species, O. vicdani. O.
vicdani has been recorded from the Sulu Archipelago only, and its ecology is
unknown. It was trawled from deepwater. In terms of shell morhology it resembles O.
multiplicata, a species found only within the IWP intertidal.
Oliva biogeography
143
The Philippines is the centre of species richness of the genus. Most species are found
in the central Philippine oceanic basin of the Sulu Sea (Springsteen and Leobrera
1986). The genus has the highest richness in the IWP island arc. This decreases
eastwards or westwards from the central IWP. The region near Panama contains
representatives that are derived from the Atlantic.
Oliva has variable feeding habits, anatomy,and shell characteristics (colour, pattern
and shapes) (Tursch 1994; Tursch 1998; Tursch and Greifeneder 2001). This
variability has contributed to difficulties in species identification in the genus. The
almost total absence of meristic characters of the shell has contributed to this
uncertainty. Tursch and co-researchers have separated species by shape (Tursch
1994; Tursch 1998; Tursch and Greifeneder 2001) and defined morphospecies. This
approach reduced the number of species from 176 (Petuch and Sargent 1986) to 74
(Tursch 1994; Tursch 1998; Tursch and Greifeneder 2001).
Little is known about the ecology of Oliva species. Oliva species assemblages
correlate with depth and sediment characteristics (Van Osselaer and Tursch 1993).
The genus may cause significant bioturbation of sandy habitats. O. tigridella prefers
sandy substrata, but has no specific food preferences (Malijan 2003). In O. reticulata,
there is no correlation between shell patterning and substrate characteristics (Tan
2003). Oliva are probably opportunistic predators and scavengers, feeding on
crustaceans and other gastropods (Tursch and Greifeneder 2001).
(Tursch and Greifeneder 2001) summarised habitat characteristics of IWP Oliva.
(Table 6.1) Several species are monotopic, living only in a single type of substrate.
Others are polytopic, living in several substrate types. The colour of the shell is often
used for camouflage, and thus is related to the colour of the substrate. Tursch and
Greifeneder (2001) hypothesised that predation pressure on Oliva may be the factor
affecting shell colour. Co-occurrences of different species, but not different colour
forms of the same species, of Oliva are observed (Tursch 1994; Tursch and
Greifeneder 2001).

Oliva biogeography
144
Habitat code Description 1 sand 2 coarse sand 3 coral sand 4 coral-volcanic sand 5 fine sand 6 muddy sand 7 mud 8 gravelly sand 9 multisubstrate 10 sand and rubble 11 Volcanic sand
Table 6.1 Habitat codes of Indo-west Pacific Oliva used in the text.
The life history characteristics of Oliva are not well known. Aquarium observations
by Ziegler (1969) of O. sayana from Florida suggest a short larval duration (1 week)
and that larvae may be benthopelagic. It is possible that chemical cues from the
substrate initiate settlement. Settlement may be restricted by the availability of
suitable sand habitats (Tursch 1994). The population genetics of Oliva has not been
studied in detail in the IWP. Some structure has been observed in the population
genetics of O. amethystina and O. reticulata in the Visayas region of the Philippines
(Chua and Panlilio 2002). Aldana and Dizon (2003) reported genetic structure in
populations of O. reticulata in a 2 sq km bay in Batangas, Philippines (Aldana and
Dizon 2003).
The evolutionary history of Oliva has been reviewed (Petuch and Sargent 1986,
Tursch and Greifeneder 2001). Oliva probably originated in the Miocene, 30 MYBP,
from Cretaceous volutes. The earliest Oliva has been recorded from the Eocene. Two
radiations are hypothesised to have occurred in the Miocene. One was in the future
IWP island arc, and the other in what became the Southern USA. However no
phylogeny of the genus has been published.
Oliva provides a potentially informative comparison with Conus (Chapter 5). Both
genera are carnivorous, but each occupies a completely different habitat. Habitats of
Conus are three dimensional (intertidal benches, sand patches etc). Habitats of Oliva
are less structurally complex, and differentiated by the characteristics of the sandy
Oliva biogeography
145
substrate. Spatial patterns of species diversity of Conus are predicted mainly by the
presence of sandy habitats (Chapter 5). This chapter examines the distribution and
biogeography of a sand dwelling coral reef gastropod Oliva.
6.2 MATERIAL
This study used material deposited at the Delaware Museum of Natural History
(DMNH). The DMNH has one of the most extensive collections of Philippine
molluscs in the world. These were collected during the period of American
sovereignty (1898- 1946) in the Philippines and in the two decades after independence
(1950-1970). Ten percent of the mollusc collection is Philippine material.
6.3 METHODS
From the DMNH collection, I initially consulted the museum’s database for
taxonomic, distribution and ecological information on Oliva. There were 3065
museum records for Oliva. Six hundred and fifty records pertain to the Philippines.
Only records with province, locality, and municipality collection information were
used in the study. Taxonomic identifications and ecological data were verified and
revised when needed using Tursch and Greifeneder (2001) Five hundred and ninety
six (596) specimens of Oliva in 29 species, were examined. The geographical
locations of collection sites of the specimens were plotted on a map
Methods of data analysis used in this chapter (range analysis, areographic analysis,
species-area analysis, faunal provinciality analyses and ordination methods) were
described in Chapter 3. Sites in southern Mindanao, Philippines, were not included in
analyses due to the lack of data. Ecological information was not available from many
of the sites where Oliva were recorded. Thus correlations of ecological data with
results from the PCA were not possible. Methods of analysis of spatial patterns of
species richness are the same as those performed on Conus in Chapter 5.

Oliva biogeography
146
6.3.1 Species Identification and Endemism estimates
In the DMNH collection, taxonomic identification followed that of earlier authors. I
revised these identifications, using the revision by Tursch and Greifeneder (2001).
Endemism was assessed from distributions reported by Tursch and Greifeneder
(2001). This is the most reliable distribution information available to date.
6.3.2 Morphometric analysis
Oliva reticulata and O. amethystina were used to test if certain morphological
attributes (shell length, shell width, flare length) can be grouped to the Sulu Sea,
South China Sea, Philippine Sea, Sibuyan Sea and Davao Gulf, and if such patterns
were related to the general ecology of each species. O. reticulata is a polytopic
species found in various substrates in seagrass beds and on reef flats. O. amethystina
is a monotopic species preferring coral sand, often near Acropora colonies. Both
species are widely distributed in the central Philippines.
The following metrics (Figure 6.1) following that of Tursch (1998) were used: Shell
Height from spire to base (H), Shell length from shoulder to base (L), Shell Width or
Diameter (D), and Flare or Lip length (LW). These were measured using a vernier
calliper (mm to 0.01). Fifty-three (53) shells of O. amethystina and 92 shells of O.
reticulata were measured. Morphometric differences within species in geographical
regions were investigated using multiple discriminant analysis (SPSS 10.0 for
Windows). The predictive power of this analysis was assessed by an a posteriori test,
in which individuals were classified into the prior group based solely on the shell
morphometry,

Oliva biogeography
147
Figure 6.1 Metrics used in morphometrics analysis of shell shape in Oliva. See text
for details
LW
D
H
L

Oliva biogeography
148
6.4 RESULTS
6.4.1 Endemism and species number in basins
The number of species of Oliva from each of the oceanic basins of the Philippines is
given number in Table 6.2. Tursch and Greifeneder (2001) reported 35 species in the
Philippines. However, the DMNH material had only 29 species. I used 29 species as
the Philippine total, based on the DMNH material. Twenty-seven of the 29 species
occurred in shallow water. O. lacanientai and O. pacifica were trawled off Panglao,
Bohol at 300 m depth.
Basin Species richness
Celebes Sea
11
Philippine Sea
13
South China Sea
25
Sibuyan Sea
22
Sulu Sea 15 Visayas-Camotes Sea
19
Table 6.2 Number of species of Oliva in the Philippine Oceanic Basins (see Figure.
2.1 for locations of basins).
Tursch and Greifeneder (2001) reported one endemic species O. vicdani. This is not
in the DMNH collection.
Earlier assessments of species richness suggest that the Sulu Sea basin is the centre of
Oliva diversity in the Philippines (Cabrera 1986; Springsteen and Leobrera 1986;
Cabrera 1999; Vallejo 2001). This is revised by findings in this study.

Oliva biogeography
149
6.4.2 Ranges
Figure 6.2 shows 4 general distributions of Oliva in the Philippines/. These are 1)
central Philippine basins, 2) the edges of basins 3) Central basins with a northward
extension, 4) the Eastern Philippines (Figure. 6.2). Some species have been recorded
only from one locality (e.g. O. lacanientai). A range cannot be defined in these cases.
Full range information on the species investigated is given in Appendix 7. The
distributions were determined by plotting the occurrences of the 29 reported species
on an equal-area map.

Oliva biogeography
150
Figure 6.2. Four general distributions of Oliva in the Philippines. 1) Central basins, 2)
Central basins with northward extension, 3) Sibuyan Sea basin edge, 4) Eastern
Philippines

Oliva biogeography
151
6.4.3 Species-area patterns and provinciality
The Species-area (SPAR) curve for Philippine Oliva is shown in Figure 6.3. Table 6.3
show SPAR parameters for the oceanic basins. The relationship is statistically
significant (P<0.001) (Table 6.4). The Philippines z value is 0.38. The basin with the
steepest slope is the Sibuyan Sea with a z value of 0.63. This z value is not near the
0.8 observed for Conus (Chapter 5), and that characterises extremely species-rich
biogeographical regions. This is probably due to the fact that the species pool in Oliva
is less than that of Conus.
y = 1.0647x0.3898
R2 = 0.3902
02468
101214161820
0 100 200 300 400 500 600
Area in sq km
Spec
ies
num
ber
Figure 6.3. SPAR plot for Philippine Oliva
=

Oliva biogeography
152
Basin C Area Z Species number
Philippine Sea 1.37 1119.25 0.27 13
South China Sea
4.97 894.8 0.21 25
Sibuyan Sea 0.34 1461.66 0.63 22
Sulu Sea 1.23 821.11 0.26 15Visayas-Camotes
2.13 765.89 0.31 19
Philippines 1.06 5102.71 0.38 29
Table 6.3 SPAR estimates of Oliva species richness in the oceanic basins
Regression Statistics Multiple R 0.622588 R Square 0.387616 Adjusted R Square
0.3665
Standard Error
4.065492
Observations 31 ANOVA
df SS MS F Significance F
Regression 1 303.3911 303.3911
18.35594
0.000184
Residual 29 479.3186 16.52823
Total 30 782.7097
Table 6.4 Species-area regression statistics. There are 31 observations representing
the geographical regions used in this study (see Table 6.2).

Oliva biogeography
153
00.5
11.5
22.5
33.5
44.5
PS SCS SIB SS VIS-CAM Philippines
Basin
Rose
nzw
eig'
s In
dex
Figure 6.4 Provinciality estimates for Oliva in the Philippine oceanic basins
PS-Philippine Sea, SCS-South China Sea, SIB –Sibuyan Sea, SS- Sulu Sea, VIS-
CAM- Visayas- Camotes Seas

Oliva biogeography
154
The provinciality index for each basin is shown in Figure 6.4. The most provincial
basin is the Sibuyan Sea. The z estimate for the Sibuyan Sea is well within the
predicted z values (0.3-0.8) of marine inter-provincial SPAR curves.
GEOGRAPHICAL UNIT Species number
Frequency of Occurrence
BOHOL 2 3CALAMIAN 3 11CEBU EAST (MACTAN) 16 42CUYO 4 7DAVAO 11 30EAST LUZON 2 2EAST PANAY 4 5EAST SAMAR 5 5LEYTE 13 18MARINDUQUE 10 14MASBATE 9 14MINDORO ORIENTAL 18 64MINDORO OCCIDENTAL 12 19NEGROS ORIENTAL 7 13NORTH LUZON 5 5NORTH PANAY 3 3PALAWAN 4 9WEST QUEZON (BONDOC) 17 41SAMAR 10 23SOUTHEAST LUZON (BICOL) 8 14SORSOGON 6 10SOUTHERN PALAWAN (BALABAC)
3 6
SOUTH PANAY 3 6SULU 13 48SURIGAO DEL NORTE 6 12SURIGAO DEL SUR 4 7SOUTHWEST LUZON 13 28WESTERN LUZON (ILOCOS) 18 61ZAMBALES 12 19ZAMBOANGA AND BASILAN 9 19ZAMBOANGA DEL NORTE 1 1
Table 6.5 Species number and frequency of occurrence from DMNH records of Oliva
in the geographical regions studied. The numbers suggest that larger geographical
regions have more recorded species and more frequencies of occurrences.

Oliva biogeography
155
6.4.4 Geometry of Species Ranges: Areography
The frequency distribution of range sizes of Oliva in the Philippines is shown in
Figure 6.5. The distribution is skewed to the right. This is typical of species-rich
biogeographic regions.
0
2
4
6
8
10
12
14
0-500 501-999 1000-1499 1500-1999 2000-2499 2500-3000
Range size in 1000 sq km
Spec
ies
num
ber
Figure 6.5 Range size frequency distribution in Philippine Oliva.
The frequency distribution of range sizes of Oliva is partially bi-modal. A majority of
species have a range size less than 500,000 sq km. These species have narrow ranges
almost all confined to the central Philippines oceanic basins. A second mode occurs at
a range size of 1-1.5 million sq km.

Oliva biogeography
156
6.4.5 Range shape
The majority of geographic ranges of species of Oliva are polygonal (Figure 6.6).
Since they mostly lie below the diagonal of Figure 6.6, these ranges are not orientated
north to south. These distributions cover the central oceanic basins (Quadrant 1 in
Figure. 6.6). A few ranges are narrow and orientated east to west (Quadrant 2). These
ranges are limited to the edges of oceanic basins. The results show that Philippine
Oliva species are mainly found in the central Philippines.

Oliva biogeography
157
0
2
4
0 2 4
Log km E-W
Log
km N
-S
Figure 6.6. Range shape in Philippine Oliva species (see Figure 3.3 for diagrams of
the 4 range shapes).
1
2 3
4

Oliva biogeography
158
6.4.6 Principal Components Analysis of species richness and occurrence
The plot of the PCA ordination is shown in Figure 6.7. Table 6.6 shows the OGU
loadings on the PC axes. The first PC axis (43.52 % of variation) is associated with
high frequency of occurrences in the geographical regions studied. As discussed in
Chapter 4, frequency of occurrence is the number of times a species has been
recorded from an OGU. It is not a direct measure of abundance but may reflect
general trends in abundance. The regions that are negatively associated with PC 1 are
highly diverse with numerous frequencies of occurrences of species recorded in these
regions. PC 2 accounts for 14.77 % of the variation and is associated with variable
species richness and lower frequencies of occurrence on island coastlines. The PC1
axis separates high species-rich regions (found on the coastlines of the larger
Philippine islands) from less species-rich regions found on smaller islands.
Consequently, these smaller islands have less frequencies of occurrence of species
recorded. The relationship of species number and frequency of occurrence is shown in
Figure 6.8. As species number increases in a geographical region, the frequency of
occurrence increases. The PCA suggests that Oliva species richness is affected by
island area.

Oliva biogeography
159
Axis Component GEOGRAPHICAL REGION CODE 1 2 3 BOHOL BOHOL 2.2246 0.3924 -0.6776 CALAMIAN CAL 3.4159 1.1903 -0.8021 CEBU EAST (MACTAN) CEBE -6.1805 0.3973 3.0731 CUYO CUYO 2.5644 -1.134 0.9658 DAVAO DAV -5.4675 5.4057 0.4826 EAST LUZON ELUZ 3.3187 1.0209 -0.1765 EAST PANAY EPANAY 2.8889 0.345 -0.5696 EAST SAMAR ESAM 1.9393 0.2101 -0.2472 LEYTE LEYTE -0.4978 1.6105 -0.5592 MARINDUQUE MARIN 0.1817 1.44 -0.1457 MASBATE MASBATE 1.6557 0.6343 -2.1049 MINDORO ORIENTAL MINW -9.9638 -5.334 -7.2325 MINDORO OCCIDENTAL MINE 2.0386 -0.6408 -0.0461 NEGROS ORIENTAL NEGOR 2.554 -1.6249 1.6232 NORTH LUZON NLUZ 3.1011 0.313 0.0373 NORTH PANAY NAPANAY 3.215 0.8128 -0.0605 PALAWAN PAL 2.4351 -0.8703 1.6499 WEST QUEZON (RAGAY) QUEZONW -4.8981 -2.1837 0.9824 SAMAR SAM 1.0772 -3.3549 4.423 SOUTHEAST LUZON (BICOL) SELUZ 2.9115 -0.405 1.1418 SORSOGON SORS 2.8597 -0.2361 1.4141 SOUTHERN PALAWAN (BALABAC)
SPAL 2.1413 0.2256 -1.085
SOUTH PANAY SPANAY 3.3078 0.4333 -0.3324
SULU SULU -
10.2832 8.5105 1.2018 SURIGAO DEL NORTE SURIN 1.6765 0.553 -2.3027 SURIGAO DEL SUR SURIS 2.4528 0.8113 -0.9534 SOUTHWEST LUZON SWLUZ -4.2882 1.2927 -2.6911 WESTERN LUZON (ILOCOS) WLUZ -12.105 -5.2612 3.8768 ZAMBALES ZAMBA 1.3826 -3.1268 1.2742 ZAMBOANGA AND BASILAN ZAMBO 1.2737 -1.9694 -2.342 ZAMBOANGA DEL NORTE ZAMBON 3.068 0.5426 0.1828
Table 6.6 PC loading of geographical units on the first three PC axes.

Oliva biogeography
160
Figure 6.7. PCA ordination of species richness and occurrences of Oliva in the
Philippines. See Table 6.6 for geographical region codes.

Oliva biogeography
161
y = 3.0074x - 6.3178R2 = 0.8254
-10
0
10
20
30
40
50
60
70
0 5 10 15 20
Species number
Freq
uenc
y of
occ
urre
nce
Figure 6.8. Species number increases with frequency of occurrence.

Oliva biogeography
162
6.4.7 Geographical distribution of species richness: What habitat type predicts
geographical species richness?
All types of sandy habitats (see Table 6.1) were significant predictors of geographical
species richness of Oliva. Regression statistics are shown in Table 6.7. Since all
predictors are significant, all have been retained in the regression.
Model R R Square Adjusted R
Square Std. Error of the Estimate
1 .903(a) .816 .810 6.4902 .943(b) .889 .881 5.1373 .965(c) .931 .924 4.1134 .981(d) .962 .956 3.1265 .992(e) .984 .981 2.0626 1.000(f) 1.000 1.000 .000
a Predictors: (Constant), CORAL b Predictors: (Constant), CORAL, MUD c Predictors: (Constant), CORAL, MUD, SAND d Predictors: (Constant), CORAL, MUD, SAND, MUDDY e Predictors: (Constant), CORAL, MUD, SAND, MUDDY, MULTISUB f Predictors: (Constant), CORAL, MUD, SAND, MUDDY, MULTISUB, COARSE
Table 6.7: Summary of stepwise regression statistics of habitat and species richness.

Oliva biogeography
163
6.4.8 Morphometric analysis
Discriminant analysis suggests that the monotopic O. amythesitina species has shell
morphologies that are distinct between at least 2 major groups of ocean basins (Figure
6.9). This is not observed in the polytopic species O. reticulata. Classification
statistics are given in Tables 6.8.
Both O. amethystina and O. reticulata occur in the central Philippines basins of
Sibuyan, Sulu and Visayas-Camotes. However O. amethystina can be classified to the
correct basin 66% of the time. O. amethystina can be correctly classified to the Sulu
Sea and Sibuyan Sea basins 80-88.9 % of the time. O. reticulata can be classified
only to the correct basin 44% of the time. O. reticulata in the Sibuyan Sea have high
rates of correct classification (78%).

Oliva biogeography
164
Classification Results O. amethystina CODE Basins Total PS SS SIB VIS-CAM SCS DAV Count of individual classified
PS Philippine Sea 5 4 0 0 0 3 12
SS Sulu Sea 1 8 0 0 0 1 10 ? SIB Sibuyan Sea 0 0 8 0 0 1 9 VIS-
CAM Visayan-Camotes
0 1 2 1 1 1 6
SCS South China Sea 0 0 1 0 10 1 12 DAV Davao (Celebes
Sea) 0 1 0 0 0 3 4
% classified
PS Philippine Sea 41.7 33.3 .0 .0 .0 25.0 100.0
SS Sulu Sea 10.0 80.0 .0 .0 .0 10.0 100.0 ? SIB Sibuyan Sea .0 .0 88.9 .0 .0 11.1 100.0 VIS-
CAM Visayan-
Camotes Sea .0 16.7 33.3 16.7 16.7 16.7 100.0
SCS South China Sea .0 .0 8.3 .0 83.3 8.3 100.0 DAV Davao (Celebes
Sea) .0 25.0 .0 .0 .0 75.0 100.0
a 66.0% of original grouped cases correctly classified.

Oliva biogeography
165
Classification Results( O. reticulata) CODE Basins Total PS SS SIB VIS-CAM SCS DAV Count of individual classified
PS Philippine Sea 8 4 11 5 3 2 33
SS Sulu Sea 0 2 0 0 0 0 2 SIB Sibuyan Sea 1 0 11 0 1 1 14 VIS-
CAM Visayan-Camotes
3 1 5 7 4 1 21
SCS South China Sea 0 3 1 2 10 0 16 DAV Davao (Celebes
Sea) 1 0 0 1 1 3 6
% classified
PS Philippine Sea 24.2 12.1 33.3 15.2 9.1 6.1 100.0
SS Sulu Sea .0 100.0 .0 .0 .0 .0 100.0 SIB Sibuyan Sea 7.1 .0 78.6 .0 7.1 7.1 100.0 VIS-
CAM Visayan-
Camotes Sea 14.3 4.8 23.8 33.3 19.0 4.8 100.0
SCS South China Sea .0 18.8 6.3 12.5 62.5 .0 100.0 DAV Davao (Celebes
Sea) 16.7 .0 .0 16.7 16.7 50.0 100.0
a 44.6% of original grouped cases correctly classified.
Table 6.8 Summary of discriminant analysis classification results for O. amethystina and O. reticulata

Oliva biogeography
166
Figure 6.9 Discriminant plots of O. amethystina and O. reticulata morphometric
measures from samples collected from the different oceanic basins. PS-Philippine
Sea, SS-Sulu Sea, SIB-Sibuyan Sea, VIS-CAM-Visayas Camotes Seas, SCS-South
China Sea and DAV –Celebes Sea (DAVAO COAST)

Oliva biogeography
167
6.5 DISCUSSION
The distributions of Philippine Oliva are similar to those of Conus described in
Chapter 5. The Sibuyan Sea has the highest species richness for Oliva in the
Philippines. This basin has the highest provinciality for much of the Philippine fauna
(Vallejo 2001). There is only one endemic Oliva, based on species identifications of
Tursch and Greifeneder (2001). Springsteen and Leobrera (1986) estimate four
percent (4%) endemic species for the total marine mollusc fauna in the Philippines.
However, these estimates include only macrogastropods.
Range size characteristics in Philippine Oliva are largely similar to those of Conus.
Most Oliva species are found in the central Philippine oceanic basins. Thus most
distributions are polygonal, and cover these basins. In Conus, there are more narrow
ranges that straddle just two basins. In contrast, most Oliva distributions that are
narrow are found on the edges of single oceanic basins.
The frequency distribution of observed range sizes in the Philippines is skewed to the
right, and similar to that observed in Conus. However the Oliva distribution of range
sizes is bimodal. This may be related to the distribution of sandy habitats in the
oceanic basins, or to the fact that Oliva species richness is much less that that of
Conus. Geographical species richness is correlated with habitat. There is a significant
correlation of all habitat classes with species richness in all the geographical regions.
This suggests that Oliva species richness is not as variable in space as that
hypothesised for Conus in Chapter 5. The ecology of Oliva has not been studied as
much as that of Conus (Tursch and Greifeneder 2001). Substrate suitability may be
the most important factor affecting their distribution. There is very little information
on Oliva feeding. The few studies available suggest that Oliva are not trophically
specialised (Ziegler 1969; Tursch and Greifeneder 2001; Malijan 2003). Oliva species
that overlap in distribution may be more likely to utilise different substrates than
different food resources. This contrasts with results for sympatric Conus species, that
often partition food resources (Kohn 1997). Given that sandy habitats may be more
widely distributed in space than the specialised intertidal and subtidal habitats of
Conus, numbers of species of Oliva may not be variable in space, although the species
that compose these assemblages may differ.

Oliva biogeography
168
Principal components analysis suggests that species richness of Oliva differs on large
island coastlines and smaller islands. The large islands have more species than smaller
islands. This agrees with the results of species-area analysis. Since Oliva does not
have the same level of species richness in the Philippines as Conus, I cannot propose
area independence. Since most Oliva occur in shallow water, the extent of their
habitats is a function of the area of the islands themselves. Area is therefore a good
predictor in Oliva species richness (Tursch and Greifeneder 2001).
The frequency of occurrence increases linearly with species richness because of a data
collection artefact. In museum collections, even if these are representative enough, the
standard protocol is to collect at least three specimen lots as a record for a region. If a
region is larger, more lots will be collected as more species are recorded. However,
this data artefact does not affect the general trends in species richness and area.
Analysis of two species of Oliva suggests that habitat specificity may influence spatial
variation in shell morphology. Divergence in isolated monotopic Papua New Guinea
O. amethystina has been observed to be rapid (Tursch and Greifeneder 2001).
Monotopic O. amethystina have shell morphologies that are specific to some ocean
basins. However these groupings cannot be generalised to represent east-west
discontinuities. O. amethystina from the Philippine Sea and the Sulu Sea are grouped
together. In addition, Sibuyan Sea, South China Sea and the Visayas-Camotes Sea
group together. The Sulu Sea is located within the Philippine archipelago. If an east-
west morphological separation occurred, then the South China Sea should group with
the Sulu Sea and the other central basins should group with the Philippine Sea.
Perhaps the Sulu Sea and the coasts of the Philippine Sea group together because they
have similar exposure to the monsoons.
Polytopic O. reticulata had no spatial variation in shell morphology. This suggests a
morphological continuum in populations. Morphological characteristics intergrade in
space. A polytopic species is able to utilise a greater suite of environments. Each
response to a particular environment will be reflected as a particular morphological
adaptation. Since the environments intergrade in geographical space, a morphological
continuum may be observed (Tursch 1994; Tursch 1998; Tursch and Greifeneder

Oliva biogeography
169
2001). Partial genetic isolation along the morphological continuum may occur,
although this has not been verified (Tursch and Greifeneder 2001).
The results of the Oliva investigations support the suggestion that the basins are
somewhat unique biogeographical units. The high provinciality of the Sibuyan Sea
may be related to the numerous habitats and islands in this basin. This has an
historical basis, for the basin is tectonically complex, and was associated with
significant volcanism in the Miocene. The tectonic reconstruction of the IWP island
arc by Hall (1998) shows that the Sibuyan Sea was once a passageway between the
Indian and Pacific Oceans. Closure occurred with the rotation of Luzon to its modern
orientation, beginning in the early Miocene. Subsequent northward movement of the
Visayan islands as a result of Australia’s northward movement, narrowed the
connection of the Sibuyan Sea from Pacific and Indian Oceans in the late Miocene.
Other seas that had similar histories are the Moluccas and Banda Seas. However these
seas were not as landlocked as the Sibuyan. In the Pleistocene, the Sibuyan basin was
almost completely isolated from the Indian and Pacific Oceans (Heaney 1986). An
alternative explanation for the high provinciality of the Sibuyan Sea is its current
small size. Basins of small size, but with large numbers of habitats and thus species,
will invariably give high provinciality estimates (see Equations 3.5 and 3.6).
However, this would suggest that the Visayan basin should also show high
provinciality, but it does not.
The timing of speciation events in Oliva is an important future focus of research.
Tursch and Greifeneder (2001) hypothesise that much of the Oliva speciation
occurred after the closure of the Tethyan Seaway and the modern species ranges
conserve much of the information of this historical event. The evolutionary history of
the genus has been reviewed by Petuch and Sargent (1986). The mid to late Miocene
saw two major species radiations in the genus. One radiation occurred in what became
the IWP island arc and another in what became the south-eastern United States. With
Hall’s tectonic reconstructions, the radiation of Oliva in the IWP may have been
associated with numerous closures of seaways in the Miocene. One of those seaways
was the Sibuyan Sea.

Oliva biogeography
170
In the Pleistocene, a second IWP radiation occurred (Petuch and Sargent 1986). This
is hypothesised to be related to sea level changes as a result of glaciation. That many
IWP species are wholly contained within the IWP island arc supports this hypothesis
(Tursch and Greifeneder 2001).
It is possible that Oliva was prone to basin isolation, and that this promoted speciation
in the IWP. If their hypothesised short larval life is confirmed, and if this has been
conserved in its evolutionary history, then the hypothesis of origin within the IWP
island arc may be testable. This requires a molecular phylogeny
In the next chapter, I examine the nature of speciation within the IWP island arc of
Conus.
6.6 CONCLUSIONS
1. The distributions of most Philippine Oliva are within the central Philippines.
Thirty-five species were reviewed in Tursch and Greifeneder (2001). Twenty
nine (29) species were used in this study.
2. Ranges of Oliva occur in 4 general distributions. The frequency distribution of
range sizes in the Philippines is bi-modal but right skewed.
3. Species richness increases with area sampled. The Sibuyan Sea has a high
degree of provinciality. This agrees with earlier observations on other taxa.
4. All habitat classes correlate positively with species richness of Oliva in all
geographical regions. This suggests that Oliva species richness is not variable
between regions.
5. PC analysis suggests that larger islands have more species than smaller
islands. This agrees with the SPAR analysis.
6. The monotopic O. amethystina fall into two distinct geographic groups based
on shell morphology. This is not clearly observed in the polytopic species O.
reticulata.
7. Oliva may be a useful taxon to test the IWP centre of origin hypothesis. This
will require a detailed phylogeny based on molecular marker techniques.

Inferring speciation
CHAPTER 7.
Inferring the mode of speciation in Indo-West Pacific (IWP)
"Obviously, even if all these assumptions should turn out to be invalid, this would notnecessarily prove that the basic hypothesis is wrong. In any case, a critical evaluation of the various assumptions will lead to a clearer understanding of the problem.
Mayr (1947)
7.1 INTRODUCTION
Several hypotheses have been proposed to account for the origin of high marine
species diversity in the IWP island arc (Rosen 1988; Rosen 1988). They can be
grouped into 1) centre of origin (McManus 1985; Briggs 1987; Briggs 1992; Briggs
1996; Briggs 2000) and 2) center of accumulation hypotheses (Jokiel and Martinelli,
1982). The former is based on the age and area hypothesis of Stehli and Wells
(1968). It assumes that older taxa have wider ranges and are found near the centre of
origin of the lineage. The latter is based on the geometry of modem species
distributions and the occurrence of endemics in the Indian and Pacific Oceans.
The two hypotheses are framed in the context of a complex geology, oceanography
and geography of the island arc (Hall 1998). The isolation of marginal ocean
basins during reduced sea level periods in the Pleistocene may have contributed to
possible speciation within the IWP island arc (McManus 1985; 1985). Recent
studies have focused on the biotic history of the island arc (Pandolfi 1992; Wilson and
Rosen 1998) in order to test either hypothesis.. The molecular biogeography of
widely distributed marine invertebrates in the IWP suggests that there is population
genetic structuring (Palumbi 1997) despite the presence of ocean currents that allows
for genetic connectivity. There is also evidence of a biogeographic break in Linckia
colour between the Indian and Pacific Oceans (Williams and Benzie
1998). The population genetic structuring in Tridacna populations in the IWP are not
coincident with modem ocean current systems (Benzie 1998). This may be a result of
previous dispersal by paleo-currents. The molecular biogeographic evidence
supports either hypothesis, depending on the investigated. The contrasting
molecular evidence may support a third general hypothesis, that successive isolation

Inferring Conus speciation 172
at any place in the IWP may have resulted in speciation rather than speciation just
from the IWP arc itself (Pandolfi 1992).
In Conus, range extents in the IWP suggest that dispersal is an important determinant
of range size in many of the shallow-water coral reef dwelling species (Kohn and
Perron 1994). Many reef species have a distribution encompassing the Indian and
Pacific Ocean (Rockel et al. 1995). The length of the pre-competent planktonic stage
in a species is related to the size of the range (Kohn and Perron 1994).
Distributional ranges can be indicative of niche breadth (Brown 1996; Gaston 1996)
and history of speciation (Berlocher 1998; Maurer and Nott 1998). Ranges can thus
be used to infer the nature of speciation (Berlocher 1998) if there is phylogenetic
information available. The range extents of Conus with widely distributed species are
usually sympatric or overlapping. Some endemic species can occur on the edge of the
known ranges of the most widely distributed members of the genus.
Allopatric speciation is the most common mechanism assumed to account for marine
species diversity. In this mode of speciation, the fragmentation of geographical ranges
has resulted in reproductive isolation, leading to speciation (Mayr 1976). The other
mode of speciation is sympatric , with species arising within the parent geographic
range (Maynard-Smith 1966).
A geographical range may have thus resulted from either allopatric or sympatric
speciation. It is extremely difficult to infer mode of speciation from range size and
geometry alone. It is necessary to determine from historical inference what the likely
origin was. Gaston (1996) suggested that species with larger range sizes are more
likely to speciate than those with smaller ranges. and thus spawn smaller ranges.
Species with large range sizes tend to persist longer in evolutionary time, and thus
have a higher probability of allopatric speciation. Gaston considers two allopatric
speciation modes, the allopatric vicariant mode (geographical fragmentation within
the range) and the peripheral vicariant mode (fragmentation of ranges at the edge of
the parent distribution). Gaston's hypotheses on allopatric speciation can only be
investigated by relating range sizes with phylogenetic information.

Inferring Conus speciation 173
According to Barraclough et a1 (1999), there are four events that could lead to present
day patterns of species diversity (Figure 7.1). In sympatric speciation, two events are
possible. Range sympatry will tend to decrease as node height increases. The other
situation is no change in range sympatry at all. In allopatric speciation, range
sympatry increases with node height as new species arise but since geographical space
is limited, there will be a level of maximum sympatry. The other situation is a no
range change after speciation. In these models new species are formed by allopatric
and sympatric speciation. New ranges are then formed that may either expand or
contract. As ranges expand or contract, natural selection will cause changes in
genotypes and phenotypes. Lastly, range contraction may lead to extinction. The main
premise for the models is that range sympatry is a product of purely range expansion
after speciation.
Range expansion and contraction operates in ecological time. Environmental and
geographical factors affect range extents and the subsequent genotypic and
phenotypic changes. Phylogenetic information at the species level may provide
information on how these factors contributed to this process. However information on
conditions in the past may not be accurately preserved in modern species and their
ranges. In order to get the most information, it is necessary to compare present day
range extents and the hypothesized phylogeny with a null model (Barraclough et al.
1999).
The approach of Barraclough et a1 (1999) is to plot the degree of sympatry (range
overlap) with node height as a measure of evolutionary divergence The degree of
range overlap is measured as sympatry, while node height is a relative distance from
the node to the tips of the phylogeny. Node height is used as a measure of divergence
in the DNA sequences. A low node height for a species suggests that the species had
diverged recently. Under a null model, the size of a geographic range is independent
of phylogeny. As node height increases in the null model, the degree of sympatry
increases (Figure 7.1). Syrnpatry increases as more species are produced. If speciation
had been sympatric, an intercept of greater than 0.5 is expected, since one of the
species' range should be contained within the parent species range. If allopatric
speciation has occurred, the intercept is at 0 since, at the start, the parent and daughter
ranges were separated.

Inferring Conus speciation 174
In allopatric speciation, the range of the daughter species should expand. This would
result in increasing sympatry as geographic space is occupied by an increasing
number of species. In sympatric speciation, assuming that ranges expand, there is a
decrease in sympatry with species diversification. Zero sympatry would suggest a
vicariance event. The approach of Barraclough et a1 (1999) has been used to
distinguish broad geographical speciation patterns in tiger beetles Cicindela,
Madagascar lemurs, auks, warblers, cranes, Xiphophorus platies and swordtails,
fruitflies and leaf hoppers (Barraclough and Vogler 2000)
Berlocher (1998) explores Barracloughs' models by predicting sympatric speciation
with host shift (in parasitic species), habitat shift (in non-parasitic species) and
polyploidy or hybrid speciation. Since Conus is not a parasitic species but a species
with defined habitat preferences (Kohn 1967; Kohn 1969), it is possible to infer the
mode of speciation if this was accompanied by habitat shifts. Sympatric speciation
can only occur with habitat shift in two sister species.
According to the habitat-shift hypothesis, species will be monophyletic if speciation
had been sympatric. This also implies that sympatric species are always sister species.
The assumption is that there are no obvious barriers in the geographic unit in which
the hypothesized speciation occurred. The habitat-shift hypothesis can thus be
investigated with phylogenetic evidence.
In this study, I explore the possible mode of speciation in IWP Conus by relating its
calibrated molecular phylogeny with modern range extents, and habitat information..


Inferring Conus speciation 176
7.2 MATERIALS AND METHODS
7.2.1 Species and Phylogenies
Molecular phylogenetic information on 70 shallow-water species of Conus is based on
Duda and Palumbi (1999). This phylogeny used calmodulin sequences, and clades
were reconstructed from mtDNA analyses (Figure 7.2): Duda and Palumbi calibrated
the rate of sequence evolution using fossil sequences. I used only species that formed
monophyletic clades with a bootstrap support of > 95%. Bootstrapped clades have
been earlier determined by Duda and Palumbi. Bootstrap values > 95% suggests high
precision in reconstructing the most common splits in a tree (Page and Holmes 1998).
Since the Conus phylogenetic tree is a consensus of numerous trees, clades with high
bootstrap values are likely to be robust (Duda and Palumbi 1999). Thirty nine species
from 11 clades of shallow water Conus were used for my analyses (Table 1). I then
measured the length from the base of the node to the tips of the branches (Gaston
1996) from the published phylogeny. The node length is an estimate of evolutionary
divergence. Node height is expressed as a ratio of the length of the 1% scale bar with
the length of the node (Figure 7.2)).


Inferring Conus speciation 178
cylindraceus
marmoreus
us
abbreviatusr- cbaldaeus
" I-- ebraeus
dorreensismilians
eorcnatus
~us
" 83,...jSj au"u' canonicus~ textile legar~4 . , amana
Ril~is<:.opatusmUSlcus
sponsalianux
ebumeus
irtessutates
".~gulinus geographus
tulipaobscurus
.....--- eatusQ~rlL-stercusmuscarumstnatus
striolatus0,<; ,co.
r-r-r- . .. ~~
r-! ctrrUl1UJctu.JJeopardus
emaciatus
- flavidusrnoreleti, virgo
'17~ I . . !Ifbm'- m\l litteratus
91 livldusquercinus
r~sanguino1cntus
pulicanusjJ\~
bal:ffctus9.
CO caelelluistriarus
I 14glans
r- Q~ parvu(usiii ":' miles
,~ mustelinus91 mttus
.vexilturnswaULmm
virulinusmuricuJatus
lrl variusplanorbis
generalis1X brunneus
.r-r--t regius
litoglyphusprinceps
distansimperinlis
1%
Node height = node length/length of 1% scale bar
Figure? .2. Neighbour-joining tree phylogeny constructed from calmodulin intronsequences ofIWP Conus. Bootstrap values are indicated at the nodes. Names in italicsare species where life history characteristics are unknown. Shaded names are specieswith non-planktonic life histories. (From Duda and Palumbi, 1999).

Inferring Conus speciation 179
7.2.2 Determination of range extents
The range extents of the 39 species were determined from Rockel et a1 (1995). Each
published map was appropriately scaled and I estimated range size by counting the
number of scaled grids and multiplying this with a scaling factor.
7.2.3 Sympatry and evolutionary divergence
I plotted the extent of syrnpatry, or the degree of range overlap and node height, in
the 39 Conus species. The resulting relationship was plotted as a linear regression.
7.2.4 Sympatry and length of pelagic stage
I also plotted extent of sympatry against the length of the precompetent pelagic stage
reported in Kohn and Perron (1994)
7.2.5 Sympatry and habitat characteristics
I classified Conus species as "non-specific" if they occupied more than two kinds of
habitat (generalists). Conus species that occupy a single kind of habitat were defined
as "habitat-specific" (specialists). I explore the trends in sympatry and evolutionary
divergence in Conus among habitat-specific and non-specific Conus species, by
plotting sympatry and node height. The resulting relationship was plotted as a linear
regression.
7.3 RESULTS
7.3.1 Sympatry and node height
The relationship between extent of sympatry and node height is shown in Figure 7.3.

Inferring Conus speciation 180
Node height
Figure 7.3. The relationship between syrnpatry and node height in the Conus phylogeny.
The relationship between node height and extent of sympatry is not informative.
Even for species that had diverged recently (low node height), sympatry with other
Conus was near 100%. The regression is not significant (p = 0.77). This pattern
suggests a high degree of sympatric speciation under the Barraclough et a1 (1999)
model.. However, their model also predicts that sympatry will decrease as node height
increases. This is not the case here. The pattern suggests that ranges have retained
little if any information on the location of speciation. The ranges have changed
regardless of the time of speciation. However in a few species with parapatric
distributions, there is an increase in sympatry with node height since these species
have distributions that are smaller and have less sympatry with the wide ranging
species. The fact that many of these species have a node height of less than 0.02
suggests a recent divergence. A species with 3.37% sympatry is C. doreensis that
belongs to the ebreaus clade. This species has a distribution confined to the coastline
of Western Australia. Its low node height suggests a recent divergence due to a
vicariant event. C. abbreviatus, as an outgroup of that clade, has a sympatry of 27%

Inferring Conus speciation 181
and is confined to the Indian Ocean. This also suggests speciation due to vicariance.
The phylogenetic and historical range information have been conserved in these
species.
If sympatric speciation occurs, species with an unusually large sympatry with a low
node height will occur. This is observed in the Conus data. Species with low node
height and 100% sympatry with members of their clade include C. bandanus, C.
consors and C. miles. However in these species, their ranges are large. For example,
C.miles is largely sympatric with C. rattus. If sympatric speciation did occur, the
historical information on where and how this happened has been obscured.
Most members of Clade 1 (ebraeus clade) have wide distributions and a high degree
of sympatry. With the possible exception of the Western Australian endemic C.
doreensis, members of this clade may have speciated sympatrically. This might be the
mode of speciation between the sister species C. ebraeaus and C. chadeaus. These
species overlap in range with C. chaldeaus, occupying a lower intertidal habitat than
C. ebraeus (Rackel et al. 1995). C. chaldaeus has the largest node height, and thus
diverged earlier than other members of the clade.
Members of Clade 1 conform to a prediction of sympatric speciation. In the absence
of obvious geographical barriers to speciation, if species with overlapping ranges are
monophyletic and are habitat specific, then they have likely speciated sympatrically.
Range overlap or sympatry is negatively correlated with node height in sympatric
speciation This prediction is shown by Figure 7.4 and shows a pattern similar to that
predicted by the sympatric speciation model shown in Figure 7.1.

Inferring Conus speciation 182
Figure 7.4. Decrease in sympatry with increasing node height in members of Clade 1 (the ebraeaus clade). This trend is consistent with a prediction of sympatric speciation.. (r2 =0.3, p= 0.56)
Clade 1
7.3.2 Sympatry and habitat characteristics
120 -
100 -
L. 80 -
.c, m g 6 0 - ' 4 0 -
20 -
0
Non habitat-specific species (species that can live in two or more kinds of
microhabitat) exhibit a greater degree of sympatry than habitat-specific species. The
regression lines in both classes are non-significant (p = 0.52 for habitat specific and p
= 0.63 for non habitat-specific). There are habitat-specific low sympatry species with
a low node height. The regressions do show weak positive and negative relationships.
This suggests that there has been range changes after speciation and that the
geographic mode of speciation in the species has been obscured. The lack of a
relationship indicates that one cannot infer either allopatric or sympatric speciation.
-- "- ----------- - -- -
1 ** I
0 0.002 0.004 0.006 0.008 0.01 0.012 0.014 0.016 0.018
Node height

Inferring Conus speciation 183
2 0 t 0 t , I
0 0.02 0.04
Node height
+ specific
r nonspecific
- Linear (nonspecific)
-- Linear (specific)
Figure 7.5. Trends in sympatry and node height among habitat-specific and non- habitat-specific Conus
7.3.3 Pelagic stage and node height
As node height increased, there was an increase in the length of the pelagic larval
stage in Conus species. This relationship is not statistically significant (P=0.22)
(Figure 7.6)

Inferring Conus speciation
0 0.01 0.02 0.03 0.04
Node height
Figure 7.6. Positive relationship between length of pelagic stage and node height. (r2 = 0.14, P=0.22)
7.4 DISCUSSION
The low endemism and high species diversity in the IWP island arc are difficult to
explain. The processes that shape this observed pattern are not fully understood
(Bellwood and Hughes 2001). This contrasts with the terrestrial environment, where
isolation of biotas has promoted rapid species diversification in numerous taxa
(Wallace 1859; Wallace 1880; Heaney 1986; Simberloff and Martin 199 1;
Rosenzweig 1995; Heaney 1998; Heaney and Regalado 1998; McKinney 1998;
Heaney 1999). Species diversification as a result of isolation is demonstrated clearly
in the Philippine archipelago (Oosterzee 1997; Heaney 1998) where the age of each
of the major islands corresponds to the phylogenetic age of the plant and animal taxa
on each island.
The model of species diversification in the terrestrial flora and fauna of the
Philippines has been repeated colonization by chance events and subsequent isolation
due to vicariant events such as Pleistocene sea level changes (Heaney 1986).
Pleistocene sea level changes have been proposed as the main mechanism of
speciation in shallow water coral reef taxa in the Philippines and the marginal
oceanic basins of Indonesia (McManus 1985). The Philippine archipelagic sea of

Inferring Conus speciation 185
Sibuyan remains as the centre of species diversity in Conus (Vallejo 1999) in the
IWP, and other Philippine archipelagic seas are centres of species diversity in other
marine vertebrate and invertebrate taxa (Vallejo 2001; Alifio et al. 2002).
This pattern of high species diversity in different taxa would suggest that speciation
occurred in these archipelagic seas. However this hypothesis may be investigated
only by inferring the mode of speciation.. Conus is an excellent taxon to investigate
the hypothesis of species origin in the IWP island arc. The taxonomy, ecology,
reproductive biology, phylogeny and biogeography of Conus has been described
(Kohn 1967; Kohn 1969; Kohn and Nybakken 1975; Kohn 1980; Kohn 1990; Kohn
1990; Kohn 1994; Kohn and Perron 1994; Rockel, Korn et al. 1995; Kohn 1997;
Duda and Palumbi 1999; Duda et al. 2001). There is abundant information on the
natural history of Conus to infer the direction of its evolutionary history.
The results of this study confirm the hypothesis that planktotrophy in the genus is
probably of ancient origin. This characteristic is lost in a few species that have
recently speciated on the outer edge of IWP. In species with a distribution that
includes the IWP island arc (C. magus, C. cineareus), the distributional ranges do not
extend beyond the western Pacific. Non-planktotrophy has evolved in different clades.
There are no clades that are purely non- planktotrophic (Duda and Palumbi 1999) The
mode of speciation in the genus cannot be ascertained, as the slope of the sympatry
versus node height plots are not significant. If sympatric speciation did occur, the
historical information on these events has been obscured. The possibility of sympatric
speciation is greatest in Clade 1 (the ebraeus clade). Members of the clade fulfil some
of the predictions of sympatric speciation, as most members have wide distributional
ranges and are habitat-specific. This implies that there had not been geographical
barriers to distribution. Diversification in this clade cannot be inferred from the
allopatric model. In other clades, this prediction cannot be investigated since they
have both habitat-specific or non-specific species.
It is easier to detect allopatric than sympatric speciation. Low node height and very
low sympatry suggest allopatric speciation. This is seen in Conus, especially for
species with parapatric ranges. However this is not very informative. Rapid dispersal
as planktonic larvae via ocean currents is a characteristic of many members of the

Inferring Conus speciation 186
genus. This life history strategy has been largely conserved in the evolution of the
genus. This probably contributed to the large degree of sympatry regardless of node
height in the genus. The process of dispersal operates in ecological time.
Non-informative relationships between sympatry and node height have been
demonstrated in the taxa modelled by Barraclough and Vogler (2000). Widely
dispersive birds such as auks, and warblers, insects such as fruitflies and leafhoppers
show non-informative relationships because of increasing sympatry among recently
split clades. In fmitflies that are host-specific, some clades show a sympatric
speciation pattern. If this pattern occurs in higher frequencies, sympatric speciation
may be detected (Barraclough and Vogler 2000). Nevertheless, when the models are
considered together, there is a signal of allopatric speciation. The same study also
presents models that show clear signals of allopatric speciation. In the freshwater fish
Xiphophorus, birds such as cranes and fairy wrens, the models show clear patterns of
vicariant speciation. Platnick and Nelson (1978) earlier examined speciation in platies
and swordtails as a case in vicariance biogeography. With the exception of cranes,
members of the taxa are not dispersive. However cranes require specialised wetland
habitats (Kennedy et al. 2000) that may isolate populations and promote allopatric
speciation.
Barraclough and Vogler (2000) suggest that non-informative relationships are due to
range changes after speciation. If these changes are so great, the model becomes
unreliable. The non-informativeness of the models may be due to differing rates of
speciation, post-speciational range changes that include extinction, ecological
displacement, rapid dispersal at very short timescales (Barraclough and Nee 2001)
and climate and geological factors (Barraclough and Vogler 2000). The accuracy of
the phylogenetic trees may also affect the information content of models especially
for trees that reconstruct relationships in higher taxonomic groups (Barraclough and
Nee 2001). The main problem in reconstructing phylogenetic history is that all
members of a group need to be sampled for maximum accuracy (Barraclough and Nee
Because the modem ranges of Conus are not historically informative, it is not possible
to determine exactly where cladogenesis and consequent speciation occurred in the

Inferring Conus speciation 187
genus. Thus, the hypothesis that speciation occurred in the IWP island arc cannot be
verified nor falsified with this approach. The hypothesis of speciation on the Pacific
plate cannot be supported by this data, since there is no evidence to show that there
are clades composed of endemics with a central Pacific distribution. The probable
solution to the problem of species origins is to apply the principle of parsimony in
order to choose a model that conserves the greatest historical information (Sober
199 1).
This would require a comparative approach among coral reef taxa. The rapid
developments of sequencing techniques in DNA analysis provide the opportunity to
propose species-level phylogenies as historical hypotheses (Barraclough and Nee
2001). When these are properly examined, and if similar evolutionary trajectories are
revealed in various taxa, then a more robust hypothesis to account for the origin and
dimensions of marine biodiversity in the IWP arc, especially in the Philippines, may
be proposed.
This hypothesis will have a specific historical approach. This should take account
of vicariant events in a clade's history and relevant historical events. The relationship
of a modern phenomenon such as a distribution with history needs to be established
(Blalock 1961) in order to derive inferences. Historical biogeography has a genetic
explanation. This can explain a present system by describing how it evolved from an
ancestral one (Anderson 1996). This explanation is probabilistic in nature. Genetic
explanations are appropriate for "what if ' analysis (Shermer 2002). The most
parsimonious "what-if' should be congruent with the present observed pattern. This
then implies an accurate historical reconstruction.
The models presented here have limited explanatory power for inferring the history of
speciation in IWP Conus. However the models provide interesting approaches to
investigate probable modes of speciation in coral reef biota. There will be a limit to
certainty in determining the evolutionary history of a marine taxon. But with a
consideration of phylogeny and patterns in species distribution, an empirical
understanding of how species diversity evolves can be achieved.

General discussion
CHAPTER 8.
General Discussion, Synthesis and Hypotheses
"It has always been easier in biogeography to devise explanations than to test them. There can be few subjects that have offered so much scope for so many people to speculate at such length on so little evidence"- B.R. Rosen, 1988
"Severe criticisms are severe empirical tests" Karl Popper, 19 74
8.1 INTRODUCTION
Numerous hypotheses have been proposed to explain how the arcuate distribution of
some marine taxa in the Indo-West Pacific (IWP) developed, and how such patterns
are maintained in time (Rosen 1988). An understanding of how these patterns are
maintained will give insight into the nature of species diversity in the IWP.
Three general hypotheses have been proposed in the last 40 years to account for the
origin of high species diversity in the IWP. These three hypotheses are the centre of
origin, peripheral speciation models (Rosen 1988) and refuge hypotheses (Wilson
and Rosen 1998; Bellwood and Wainwright 2002). The first postulates that based on
decreasing taxonomic diversity across the Indian and Pacific Oceans, especially in
gastropods and scleractinian corals, the Indo-West Pacific and Southeast Asia are the
centre of speciation (Briggs 1992; Veron 1995; Briggs 1996; Briggs 2000). The major
mechanism for vicariant speciation is through tectonics and sea level changes that
result in the fragmentation of geographical ranges. The second hypothesis is the
peripheral speciation model, in which speciation is greatest on the Pacific Plate (Jokiel
and Martinelli 1992, Springer 1982). The third hypothesis presumes that the
numerous environments in the IWP island arc have provided refuges from extinction
(Wilson and Rosen 1998; Bellwood and Wainwright 2002) Presumably the source
populations of these speciation events are from species with wide geographical
ranges. Tectonic changes and changes in ocean circulation fragment and divide these
geographical ranges. The end result is genetic differentiation that eventually results in
new species. The major difference between the models is in the role of dispersal. The
role of dispersal is more significant in the peripheral speciation model. While the
various hypotheses propose explanations for species origins, some hypotheses

General discussion 189
(McCoy and Kenneth L. Heck 1976; McManus 1985) also have an ecological
timeframe. Changes in environmental conditions that may have resulted in
distributional changes in ecological time are reviewed in Rosen (1988) and
Veron(1995).
Since knowledge of the geology, paleoclimatology and paleooceanography of
Southeast Asia is limited, it is impossible at present to decide which of the competing
hypotheses is more likely correct. Genetic evidence produces contrasting explanations
that either favour the centre of origin or peripheral speciation models (Palumbi 1996).
Unless a larger suite of species is assessed for genetic evidence at a variety of
geographical scales, this approach is unlikely to favour either hypothesis.
This chapter discusses the general issues of the patterns of marine biodiversity in the
IWP. It draws upon the available evidence from modem faunas: patterns of
distribution, patterns of endemism, and the geometry and structure of species ranges,
geology and molecular phylogenies.
8.2 THE HISTORICAL NATURE OF THE IWP AS THE CENTRE OF
MARINE SPECIES DIVERSITY
The Philippines, eastern Indonesia, New Guinea, the eastern coast of tropical
Australia, the Great Barrier Reef and the Solomon Islands form the Indo-Pacific
centre of marine biological diversity. As one goes further eastwards or westwards
from the centre, taxonomic diversity decreases. This arcuate spatial pattern of
distributions of many marine species is somewhat unique to the Indo-West Pacific.
Such distributions are not found in comparable island arcs, such as in the Caribbean.
Several hypotheses have been proposed to explain the maintenance of this spatial
pattern.
The arcuate distribution is a panbiogeographical track that follows the IWP island arc.
It was first recognised by Croizat (1958), and used by McManus (1985) to support an
argument about the existence of barriers to marine fauna in Southeast Asia. The
panbiogeographical track links occurrences of fauna and flora. Such concepts were
first applied to describe distributions of terrestrial plants, birds and mammals (Croizat

General discussion 190
1958). It has been used to interpret the distributions of Australasian flora and fauna
(Craw 1990) and the global distribution of cyprinid fish (Croizat 1958). If two or
more tracks representing endemic species distributions are congruent, this suggests
dispersion. Panbiogeography is a theory proposed before plate tectonics became a
paradigm (Brown and Lomolino 1998; Grehan 2001). It does not account for the
possible mixing of floras and faunas by plate tectonics.
McManus argues that if terrestrial biota have similar arcuate distributions to marine
biota in SE Asia, then dispersion probably occurred via land bridges that then served
as barriers to marine fauna during periods of low sea level. While land bridges did
connect the Philippine island of Palawan with greater Southeast Asia, there remained
significant water barriers that reduced mammal dispersion from Asia into the
Philippines (Heaney 1986). The same is true for Australia and the Maluku islands of
Indonesia.
If incomplete land bridges existed, then the isolation of the region's marginal ocean
basins was not complete. Thus possibilities for biotic exchange between oceanic
basins did exist, but possibly not at levels observed today. While the basins may have
been isolated, this isolation may not have given rise to levels of speciation of marine
fauna expected of truly isolated oceanic archipelagos such as Hawaii, the Galapagos
and the Abrolhos islands of Brazil.
The endemism of marine mollusc species of the Galapagos is estimated at 20-22%
(Kay 1991), Hawaii 20% (Kay and Palumbi 1987) and the 9-16% for the Brazilian
Albrolhos Islands (Leal 1991). In contrast the estimated total marine mollusc
endemism of the Philippines is 4% (Springsteen and Leobrera 1986). A high degree of
genetic connectivity by larval dispersal, as is likely in the Philippines, can lead to
smaller evolutionary divergence (Kay 1991). Endemism could be an index of
speciation rate, since a taxon with higher rates of speciation is more prone to produce
endemics (Stanley 1986). Thus if rapid speciation does not account for much of the
high species diversity in the arcuate "centre of diversity", then what could have?
There is evidence of persistence of relict species in the Indo West Pacific. Wallace
(1997) hypothesises that the predominance of plesiomorphic traits in endemic
General discussion 191
Indonesian Acropora suggests that these species are Tethys Sea relicts. The region
could then have served as refuges (Bellwood and Hughes 2001) during massive
extinction events that are hypothesized to have produced the modern gastropod -
bivalve ratio of 2:l in the Philippines (Springsteen and Leobrera 1986). Paulay
(1990) suggests that oceanic islands suffered massive extirpations of bivalve faunas
because of the loss of lagoon habitats favourable for bivalves. Paulay (1990) did not
suggest that this occurred in the Philippines or in Indonesia, areas with marginal
oceanic basins.
Paulay (1990) concludes that sea level changes were selective in causing extinctions.
Inner reef areas and the sandy intertidal suffered the greatest extinctions, and the
shallow forereef slopes may have served as refuges. The rocky intertidal gastropods
on the other hand are believed to be somewhat resistant to extinction, and susceptible
to founder speciation when changes in oceanic circulation cut gene flow between
populations (Vermeij 1987). Marine biota on atoll islands probably suffered the
greatest extinction rates, having lost their lagoons during periods of low sea level, and
having no significant rocky intertidal zones such as those found on high islands.
Phylogenetic studies of the species-rich genus Conus have confirmed that several
characteristics such as lecithotrophy and piscivory have evolved independently in
several clades (Duda and Palumbi 1999; Duda et al. 2001). Lecithotrophy would
suggest restricted ranges, since larval dispersal would be limited. The modem ranges
of lecithotrophic species of Conus cover the western Pacific. Although this is
considerably less than the ranges of many other Conus species, these lecithotrophic
species are not endemic to the IWP island arc, or to the Philippines. Relating the
molecular phylogeny to modern ranges (Chapter 7) suggests that there is a weak
signal of allopatric speciation that is parapatric in nature. The evidence for this is
however, weak. Nevertheless, the evidence in Chapter 7 does support the peripheral
speciation model. However the hypothesis that evolutionary radiation occurred on the
Pacific plate is questionable, since there are no clades that occur in the central Pacific
alone. At best, the analysis of phylogeny and modern ranges is not very informative.
The most parsimonious explanation for species richness in the IWP island arc is
species persistence from species that originated from either side of the island arc, the
Indian Ocean and the Pacific Ocean. This explanation is supported by Brooks'

General discussion 192
Parsimony Analysis of IWP coral reef biota (Santini and Winterbottom 2002). In this
study, the authors conclude that the lineages of diverse coral reef biota originated
through vicariant events resulting from the break-up of Gondwana. This is also
supported by the Terminal Tethyan Event hypothesis that is reflected in area
cladograms for parrotfishes (Bellwood and Wainwright 2002). It is important to note
that complete Tethyan closure occurred in the Miocene, when Conus and Oliva
radiations were believed to have started (Duda and Palumbi 1999, Tursch and
Greifeneder 2001). This is noteworthy because there was no paleontological record
for reef development before the Miocene (Wilson and Rosen 1998).
Therefore there is no clear evidence that the IWP island arc, that includes the
Philippines, was the site of species diversification that resulted in the present high
species diversity. The IWP has enhanced species persistence due to the availability of
a wide variety of habitats, climatic insulation from the extremes in the Pleistocene,
and the specific pattern of oceanic circulation. The latter may likely have enhanced
species persistence, as suggested by the vortex model of coral biogeography (Jokiel
and Martinelli 1992). The basins also were viable environments for most shallow
water taxa. There were no significant regions of anaerobiosis typical of land locked
seas like the Black Sea (Exon et al. 198 1).
8.3 THE NATURE OF BASIN ISOLATION: GEOGRAPHICAL RANGE AND
MORPHOLOGICAL DIVERSITY OF REEF GASTROPODS
The geographical ranges of gastropods observed in this study, and those documented
by earlier studies of coral reefs, mangroves and seagrasses, indicate narrow
distributions often centred within the Philippines (Fortes 1986). These distributions
are likely a product of geographic constraints, and the effects of macroecological
factors such as rainfall, temperature, current, tides etc. Narrow distributions are more
common in carnivorous than herbivorous taxa, suggesting trophic status may be an
important influence on range shape. This may be correlated with the distribution of
favoured prey items of the carnivores. The correlation of species compositions and
ranges with longitude and monsoon variables suggests that the prevailing climate may
be important in maintaining species distributions. While the paleoclimate of Southeast
Asia is not fully understood, Houle (1998) suggests that the monsoon climate has

General discussion 193
existed since the Tethys Sea closure. However, the intensity of paleomonsoons is not
known.
In Conus, life history is not a significant predictor of range size at the scale of
resolution of this study. Range of habitat types predicts both range size and species
diversity far better than life history in this taxon. In the Philippines, the frequency of
habitat types is a significant predictor of species diversity. The frequency of sandy
habitats, which have variable composition and diversity, is the most significant
predictor of species diversity in Conus.
In Oliva, the morphological diversity of monotopic (occupying on one substrate type)
species is related to the basin in which they occur. Polytopic species (occupying
multisubstrates) have no such patterns. Thus, particular environments in the basins
may be favourable to some species. The monotopic species are usually found in the
central Philippine basins of Sibuyan, Visayas and Sulu Sea. Polytopic species are
found throughout the country. Morphological diversity may be due to local scale
environmental processes (Tursch 1994; Tursch 1998; Tursch and Greifeneder 2001).
The unique geography of the Southeast Asian land masses and ocean basins, and the
prevailing monsoon climate provide a spatially heterogenous environment (Aliiio
1994). This may allow for the maintenance of high species diversity. Reversing
currents, driven by monsoons, should not constrain distributions of marine organisms.
However, historical and ecological factors appear to have constrained many
distributions, and many of these distributions have an arcuate shape. The distribution
of habitats in the Philippine islands may have played a key role in constraining
distributions of marine organisms in this way.
8.4 THE SPECIES-AREA RELATIONSHIP AND CONSTRAINTS TO
DISTRIBUTION
Species-area relationships may suggest how isolation or connectivity has determined
the structure of species assemblages. The z value, or the slope of the species-area
relationship, is a useful indicator of assemblage structure. Biotic isolates tend to have
a low z value. Larger areas composed of such isolates (e.g. archipelagos), or

General discussion 194
continents, tend to have higher z values. Larger, non-isolated, areas tend to have
constant immigration. This pattern of z values is confounded if speciation occurs by
adaptive radiation in isolates.
In the Philippines the high z values observed between provinces suggest that species
pools are not well mixed. This implies that ecological factors operating at local scales
(1 to 100 krn) may be important in determining assemblage structure and even ranges
of species. For example, in stenotopic (species with narrow ecological tolerances or
niches) Conus, habitat, life history and macroecological factors (e.g climate, rainfall,
landscape factors etc) determine diversity. How a species utilises habitat
heterogeneity will be variable in geographic space, due to local scale influences. Thus,
patchiness in diversities will result in the observed high z values. This may also
indicate a de-coupling of species diversity with area, or an area independence effect
(Rosenzweig 1995). This phenomenon was first noted in studies of island
biogeography. Macarthur and Wilson (1967) called it as the "small island effecty'.
Thus, each centre of diversity is a province (Rosenzweig 1995). Larval connectivity
patterns will be critical in maintaining such patterns in ecological time, and affecting
speciation in evolutionary time. The biogeographical regions defined for reef fishes
are defined by peaks of species richness, oceanic currents and basin geography (Aliiio
1994; Aliiio et al. 2002).
The Sibuyan and Visayan marginal basins have high z values relative to the total
fauna of the Philippines. This suggests historical isolation that continues to the
present. The positive correlation of z with the basin isolation index supports this
hypothesis. These basins are the centres of diversity for several of the taxa
investigated in this thesis.
8.5 THE CENTRE OF ORIGIN HYPOTHESIS RE-EXAMINED: THE
POSSIBLE SIGNIFICANCE OF DUAL DISTRIBUTIONS AND ENDEMIC
SPECIES.
The centre of origin hypothesis for the Indo-West Pacific (IWP) is based on speciation
through allopatry. Molecular evidence suggests that both peripheral and "centre of
origin" speciation in the IWP were likely important mechanisms generating biological

General discussion 195
diversity in the region (Palumbi 1994). Centre of origin hypotheses are based on
Pliocene and Pleistocene sea level regressions and associated climate and
oceanographic changes that allowed for allopatric speciation to occur. Dual
distribution refers to the occurrence of morphologically similar, but genetically
distinct, Indian and Pacific Ocean species. Such species pairs have been reported for
fish (Endriga 2001), echinoderms and molluscs(Tursch and Greifeneder 2001).
In Chaetodon, a genus of coral reef fish, capacity for larval dispersal is large. This
genus has several species-pairs with non-overlapping distributions (McMillan and
Palumbi 1995). Furthermore, mtDNA evidence suggests that species differentiation in
this genus in the IWP occurred in the Pliocene and Pleistocene (McMillan and
Palumbi 1995). The lack of endemics, except in peripheral basins and regions such as
the Red Sea and Hawaii, suggests that the IWP was not completely partitioned by
Pliocene and Pleistocene sea level regressions.
Major ocean currents and the monsoon driven regional current systems like those seen
today, were likely present in the Pleistocene (Houle 1998). The western boundary
currents may have been more intense (Houle 1998) and the monsoon was probably
drier and more intense than at present (Rosseau 2001). ENS0 events were probably
less frequent than in the present (Houle 1998). Thus the weak eastward currents could
have been a significant vicariance mechanism (Veron 1995) that allowed for central
and eastern Pacific speciation to occur.
Some distributions of marine gastropod species in the Philippines are not overlapping
and have different spatial orientations. These may have historical explanations. For
example, Echininus and Tectarius are found in the South China Sea, Bashi Channel,
Celebes and the Philippine Sea, but not in the central Philippine basins. Similarly,
some Nerita species have a distribution that largely excludes the central basin islands
of the Philippines. Some of these species may be relicts. The significance of such
distributions to the centre of origin hypothesis is unknown. However, such
distributions were recognised by Wallace (1997) in an analysis of Indonesian
Acropora. This pattern is likely to result from partial isolation of the Pacific and
Indian Oceans, as well as isolation of the marginal oceanic basins of the IWP. This
basin isolation has provided an opportunity for species to survive as relicts, and the

General discussion 196
possible generation of new species in the IWP through allopatry and subsequent
sympatry.
Wallace (1997) provides insight on the nature of endemism of marine species in the
IWP. Endemic species within the high species diversity IWP centre are not likely to
persist over time. The evolutionary constraint of a dispersive larval phase forces new
species to have wide dispersal. Thus the paradoxical low endemism of the IWP
diversity centre may be accounted for. This is the exact opposite of terrestrial models
of speciation, where high endemism is the hallmark of rapid speciation.
The persistence of relict species within the IWP island arc is strong evidence for the
refuge from extinction hypothesis (Bellwood and Wainwright 2002) and may partially
explain East-West isolation type of distributions. McManus (1985) suggests that
marginal basins in the IWP arc allowed species to persist due to the presence of
numerous habitats. Species with arcuate distributions follow the geography of the
island arc. Indian and Pacific Ocean species may overlap on the IWP island arc or
show observable disjunctions.
The capacity for wide dispersal is also a characteristic of IWP intertidal muricids
belonging to the apomorphic ergalataxine and rapanine clades (Shuto 1983;
Middlefart 1997a). The IWP rapanine clade is mainly planktotrophic (Kool 1993)
although some species exhibit non-planktotrophy (Middlefart 1997a). The clades have
diversified without loss of planktotrophy. Loss of planktotrophy may result in limited
distribution. With a few exceptions, none of the IWP tropical species are endemic to a
single region. Even in the habitat-specialised, non-planktotrophs such as Murex
(Shuto 1983), wide distributions and a capacity for dispersal is the norm. Most
muricid Western Pacific endemics occur only as cool water representatives at higher
latitudes (Kool 1993). Thus, the capacity to disperse widely and to reduce endemism
in modern species is likely to be a general characteristic of IWP species.
Planktotrophy has allowed persistence in geological time (Scheltema 1983). With the
Miocene radiation of most IWP mollusc taxa, this capacity for wide spread dispersal
has not been lost. This suggestion is supported by this thesis. Modern ranges and
phylogenetics have confounded the historical patterns attributed to allopatric and
sympatric speciation.

General discussion 197
8.6 PHILIPPINE MARINE BIOGEOGRAPHICAL REGIONS: DEFINED BY
EAST-WEST SEPARATION, OCEANIC BASINS AND
MACROECOLOGICAL FACTORS
The results of this study support the division of the Philippines into marine
biogeographic regions based on faunal similarity, species richness and provinciality
(Gomez et al. 1994; Aliiio et al. 2002). The archipelago can be divided into the
following regions 1) Western Luzon and Palawan, 2) Calamian Islands 3) Sulu Sea, 4)
Visayan and Camotes Sea 5) Sibuyan Sea 6 ) Eastern Philippine Province and 7) North
Luzon and Batanes Province (Figure 8.1). These divisions are based on previous
delimitations by Alifio et a1 (1994). The Eastern Philippine Province may be divided
into two regions defined by the bifbrcation of the North Equatorial Current (Licuanan,
personal communication). Southern Mindanao and Palawan are insufficiently
surveyed to allow for biogeographic classification, although there is evidence that
these are distinct biogeographic regions. The regions are defined mainly by the east-
west separation of gastropod assemblages probably due to the monsoons. These
regions are also largely congruent with the geography of the ocean basins. This
proposed division is similar to those proposed by Gomez et a1 (1994). However, there
is one major difference.
In earlier biogeographical classifications, the central Philippines (Visayas) was
considered one region. However, species diversity and provinciality of gastropods
suggests that the Sibuyan Sea and the Visayan Seas are separate biogeographical
regions. This is more consistent with geography, historical isolation and evidence
from faunal provinciality.


General discussion
8.7 GENERAL CONCLUSIONS
The validity of scientific evidence rests on its capacity to falsify as well as to support
various hypotheses (McManus 1985). The historical sciences can rarely, if ever,
utilise experimental approaches to test hypotheses. Since biogeography is an historical
science, it can suggest a description of the evolution of the present state from an
ancestral one (Andersson 1996). Genetic explanations (e.g. phylogenies) are
probabilistic, with various states possibly evolving from the ancestral state. It is
therefore necessary to determine which explanation is the most likely to explain the
current situation. In this thesis I have attempted to present various approaches to
examine the nature of species diversity in the Philippines, a region in the Indo-West
Pacific centre of species diversity.
The approach taken does not confirm or deny the centre of origin paradigms, of which
McManus' (1985) hypothesis is a part. I present methodological approaches that
would enable readers to propose and test hypotheses. The methodological approaches
help address the following questions and I discuss alternative explanations and
propose other approaches to address these questions
Can modern species distributions and diversity provide historically recoverable
in formation?
The answer to this question is unclear. There are a number of possible explanations of
why the present pattern of distributions of marine species in the Philippines is
observed. Some may have evolutionary significance and some may be explained in
purely ecological time scales. I used the species-area relationship analysis proposed
by Rosenzweig (1995) as a measure of historical biotic isolation that continues into
the present. Species diversity and provinciality estimates suggest high diversity basins
had separate evolutionary histories. However, this provinciality may be due to
patchiness of diversities resulting from a de-coupling of species diversity with area.
This may be a result of the presence of a large number of heterogenous habitats in a
small area. Other explanations involve differences in colonization dynamics and
possibly differences in marine productivity. While it can be inferred that basin
isolation could have resulted in this high diversity, there is low endemism.

General discussion 200
Circumstantial evidence, in the form of distributions of endemics and near-endemics
within Philippine and nearby basins, supports the historical nature of basin isolation.
These factors suggest that evolutionary constraints on speciation in the marine
environment were different from that on land. Furthermore, the role of habitats in
affecting the present biogeography cannot be ignored
There is a need to quantify the modern distribution of diverse taxa of coral reef
gastropods within the Philippines. Distributions of mixed substrate and rock dwelling
Cypraea may be arcuate, overlapping or disjunct, depending on their habitat
preferences. Cypraea is most diverse in the Visayan basins (Springsteen and Leobrera
1986). The larvae of tropical Cypraea are usually planktotrophic. A similar
"constraint" of planktotrophy of larvae was noted as a possible deterrninanant of the
species diversity of Conus in this study. In Cypraea, the planktonic veliger stage is 1.5
to 2 weeks in duration (Kay 1990). Habitat availability may affect the distribution of
this taxon, and may explain why some widespread IWP species are either absent or
have restricted ranges within the Philippines.
Differential extinction rates and degrees of species persistence may account for the
large number of species of coral reef organisms in the IWP. This is supported by
geological evidence that suggests that coral reefs existed during sea level regressions,
and may have provided refuges from extinction. Further evidence for species
persistence may come from studies of geographical heterochrony or the co-existence
of modern species assemblages with relict ones. Geographically heterochronic
assemblages are often associated with coastal upwelling features (Petuch 1987). In the
Philippines, such assemblages may be found in areas where upwelling is driven by
monsoonal winds. These upwelling systems were believed to be more intense in the
Pleistocene, and may have been dispersal barriers (Fleminger 1985).
It is difficult to separate historical and ecological explanations using Rosenzweig's
approach, since biotic isolation cannot be adequately demonstrated. However the
observed patterns of species distribution and diversity warrant further investigation.

General discussion 20 1
Can information on phylogeny and modern distribution provide an alternative
explanation to the McManus hypothesis?
To answer this question, the nature of endemism in the IWP needs to be assessed by
further systematic sampling. How plesiomorphic relicts and derived species may have
contributed to this endemicity and should provide insight into speciation in the region.
An initial approach is to examine the taxonomic structure of biota in the IWP and
compare this with the biota of oceanic islands (Jablonski and Flessa 1986). This may
determine where in the region speciation may have occurred. While genetic and
phylogenetic evidence supports speciation adjacent to Southeast Asia in the Indian
and Pacific Oceans (Fleminger 1985; Benzie 1998), there is no conclusive evidence
on the location of speciation of Conus in the IWP. Allopatric speciation may have
occurred in Indonesia and the Philippines, especially with temperature sensitive
clades, or clades with non-dispersive larvae. However, the most parsimonious
explanation at present is speciation and evolutionary radiation outside the IWP island
arc, possibly related to the Terminal Tethyan Event and the breakup of Gondwana.
This is supported by a number of explanations not consistent with a centre of origin
hypothesis. A general theory of marine biogeography of the IWP is still required.
8.8 RECAPITULATION
McManus (1 985) provided a theoretical framework to examine the nature, dimension,
origin and fate of marine species diversity in the Philippines, and the IWP in general.
McManus provides empirical evidence for the origin and maintenance of species
diversity that were considerations of this thesis
As in all science, these results are preliminary. Additional work will likely change the
inferences presented. There is a need for systematic research into all aspects of marine
biodiversity, from descriptive natural history to the unravelling of complex
evolutionary and ecological patterns. These will be well served by standardised
methods of local-scale ecological research, and will involve integrating processes in
ecological and geological time (Heaney 1999). As knowledge increases, our ability to
determine which hypothesis is most parsimonious will increase. However in order to
achieve this objective, a strong well-funded programme of continuing biological

General discussion 202
surveys, taxonomic and phylogenetic research, and support to natural history
museums, need to be addressed.

203
LITERATURE CITED Aldana, A. and D. Dizon (2003). The use of morphometric analyses and random
amplified polymorphic DNA (RAPD) in the determination of genetic diversity among two populations of Oliva in Lian, Batangas. Biology. Manila, University of the Philippines: 38.
Aliño, P., E. Miclat, et al. (2002). Atlas of Philippine Coral Reefs. Quezon City, Philippines, Goodwill Trading.
Aliño, P. M. (1994). Patterns in the distribution of reef-associated fish communities in the ASEAN region. Third ASEAN Australia Symposium on Living Coral Resources, Bangkok, Thailand, Australian Institute of Marine Science.
Aliño, P. M., J. W. McManus, et al. (1993). Initial parameter estimation of a coral reef flat ecosystem in Bolinao, Pangasinan. Trophic Models of Aquatic Ecosystems, Manila, ICLARM.
Allan, R. J. and J. I. Pariwono (1990). "Ocean-atmosphere interactions in low latitude Australasia." International Journal of Climatology 10: 145-178.
Allen, G. R., R. Steene, et al. (1998). A Guide to Angelfishes & Butterflyfishes. Perth, Odyssea Publishing/Tropical Reef Research.
Andersson, L. (1996). "An ontological dilemma: epistemology and methodology of historical biogeography." Journal of Biogeography 23: 269-277.
AOML (2003). FAQ:Hurricanes, Typhoons and Tropical Cyclones, National Oceanographic Atmospheric Administration. 2003.
Audley-Charles, M. G. (1981). Geological history of the region of Wallace's Line. Wallace's Line and Plate Tectonics. T. C. Whitmore. Oxford, Clarendon Press: 24-35.
Barber, P. H., S. R. Palumbi, et al. (2000). "A marine Wallace's Line." Nature(406): 692-693.
Barraclough, T. G. and S. Nee (2001). "Phylogenetics and speciation." Trends in Ecology and Evolution 16(7): 391-399.
Barraclough, T. G. and A. P. Vogler (2000). "Detecting the geographical pattern of speciation from species level phylogenies." American Naturalist 155(4): 419-434.
Barraclough, T. G., Vogler A.P. and P.H. Harvey (1999). "Revealing the Factors that promote speciation." Evolution of Biological Diversity 202-217.
Bellwood, D. R. and T. P. Hughes (2001). "Regional-scale assembly rules and biodiversity of coral reefs." Science 292: 1532-1534.
Bellwood, D. R. and P. C. Wainwright (2002). The History and Biogeography of Fishes on Coral Reefs. Coral Reef Fishes: Dynamics and Diversity in a Complex Ecosystem. P. F. Sale. San Diego, Academic Press.
Benzie, J. A. H. (1998). Genetic structure of marine organisms and SE Asian biogeography. Biogeography and Evolution of SE Asia. R. Hall and J. D. Holloway. Leiden, Backhuys Publisher: 197-209.
Berlocher, S. H. (1998). Can sympatric speciation via host and habitat shift be proven from phylogenetic and biogeographic evidence? Endless Forms Species and Speciation. D. J. Howard and S. H. Berlocher: 98-113.
Berlocher, S. H. (1998). Origins A brief history of research on speciation. Endless Forms Species and Speciation. D. J. Howard and S. H. Berlocher: 3-15.
Blalock, H. (1961). Causal Inferences in Nonexperimental Research. New York, WW Norton.

204
Blasini, S. A. (1968). Ecological studies on three species of West Indian intertidal snails:zonation and feeding. Mayaguez, University of Puerto Rico.
Briggs, J. C. (1986). "Tropical diversity and conservation." Conserv. Biol. 10: 713-718.
Briggs, J. C. (1987). Biogeography and plate tectonics. Amsterdam ; New York New York, NY, U.S.A., Elsevier ;Distributors for the U.S. and Canada
Elsevier Science Pub. Co. Briggs, J. C. (1992). "The marine East Indies: centre of origin." Global Ecology and
Biogeography Letters 2: 149-156. Briggs, J. C. (1996). Global Biogeography. Amsterdam, Elsevier. Briggs, J. C. (2000). "Centrifugal speciation and centres of origin." Journal of
Biogeography 27: 1183-1188. Brothers, E. and R. Tresher (1985). Pelagic duration, dispersal and the distribution of
Indo-Pacific coral-reef fishes. The Ecology of Coral Reefs, NOAA Symp Ser Undersea Re, Rockville, National Oceanic and Atmosphere Administration.
Brown, J. (1995). Macroecology. Chicago, University of Chicago Press. Brown, J. H. and M. V. Lomolino (1998). Biogeography. Sunderland, MA, Sinauer
Associates. Brown, J. H., Stevens, George C., Kaufman, Dawn M. (1996). "The geographic range:
size, shape, boundaries and internal structure." Ann. Rev. Ecol. Syst. 27: 597-623.
Burke, L., L. Selig, et al. (2002). Reefs at Risk in Southeast Asia. Washington DC, World Resources Institute.
Cabrera, J. J. (1984). The Cone Shells of Tayabas Bay. Manila, National Museum of the Philippines.
Cabrera, J. J. (1986). Taxonomy and Geographic Distribution of Philippine Molluscs. Seminar-Workshop on the Status of Mollusc Resources and Prospects for Development, Cebu City, Philippine Council for Agriculture, Forestry and Natural Resources Research and Development Bureau of Fisheries and Aquatic Resources.
Cabrera, J. J. (1999). Philippine molluscan biodiversity: Threatened by rapid development and negligence. Proceedings of the Symposium on Marine Biodiversity in the Visayas and Mindanao, University of the Philippines in the Visayas, Iloilo, University of the Philippines in the Visayas.
Chellazzi, G., J. L. Deneuborg, et al. (1985). "Cooperative interactions and environmental control in the intertidal clustering of Nerita textilis (Gastropoda: Prosobranchia)." Behaviour 90: 151-166.
Chua, L. and R. Panlilio (2002). The use of random amplified polymorhic DNA (RAPD) to analyze genetic variation among selected Oliva species from the Visayas. Biology. Manila, University of the Philippines: 46.
Connell, J. H. (1961). "Effects on competition, predation by Thais lapillus and other factors on natural populations of the barnacle Balanus balanoides." Ecological Monographs 31: 61-104.
Connell, J. H. (1961). "The influence of intra-specific competition and other factors on the distribution of the barnacle Chthamalus stellata." Ecology 42: 710-723.
Connell, J. H. (1972). "Community interactions on marine rocky intertidal shores." Annual Review of Ecology and Systematics 3: 169-192.
Connell, J. H. (1978). "Diversity in Tropical Rain Forests and Coral Reefs." Science 199: 1302-1310.

205
Connor, E. F. and E. D. McCoy (1979). "The statistics and biology of the species-area relationship." Am. Nat 113(6): 791-833.
Cordero, P. A. (1977). Studies on Philippine Marine Red Algae. Seto Marine Biological Laboratory. Shirahama, University of Tokyo: 258.
Craw, R. (1990). "New Zealand biogeography: a panbiogeographic approach." New Zealand Journal of Zoology 16(527-547).
Croizat, L. (1958). Panbiogeography. Caracas, Privately published. DENR and UNEP (1997). Philippine Biodiversity. An assessment and action plan.
Makati, Bookmark. Dickerson, R. (1927). Distribution of Life in the Philippines. Manila, Bureau of
Science. Duda, T. F., A. J. Kohn, et al. (2001). "Origins of diverse feeding ecologies within
Conus, a genus of venomous marine gastropods." Biological Journal of the Linnaean Society 73: 391-409.
Duda, T. F. and S. R. Palumbi (1999). "Developmental shift and species selection in gastropods." Proc. Natl. Acad. Sci. USA 96: 10272-10277.
Eldredge, N. (1999). The Pattern of Evolution. New York, W.H. Freeman. Elera, C. d. (1896). Catalogo Sistematico de toda la Fauna de Filipinas, Volumen III.
Manila, Imprenta de la Universidad de Santo Tomas. Endriga, M. (2001). Population genetics of two marine fish species in the South China
Sea and Sulu Sea. Marine Science Institute. Quezon City, University of the Philippines: 58.
Exon, N. F., F. W. Haake, et al. (1981). "Morphology , water characteristics and sedimentation in the silled Sulu Sea, Southeast Asia." Marine Geology 39: 165-195.
Fleminger, A. (1985). "The Pleistocene equatorial barrier between the Indian and Pacific Oceans as a likely cause of Wallace's Line." UNESCO Reports in Marine Science 49: 84-97.
Fortes, M. (1986). Taxonomy and Ecology of Philippine Seagrasses. Department of Botany. Quezon City, University of the Philippines.
Garrity, S. D. (1984). "Aggregation in a tropical neritid." The Veliger 27(1): 1-6. Gaston, K. J. (1996). "Species-range-size distributions: patterns, mechanisms and
implications." Trends in Ecology and Evolution 11(5): 197-201. Gomez, E. D., P. M. Aliño, et al. (1994). Status report on coral reefs of the Philippines
1994. Third ASEAN Australia Symposium on Living Coral Resources, Bangkok, Thailand, Australian Institute of Marine Science.
Govindan, K. (1974). Studies in Neritidae (Neritacea: Prosobranchia) from Peninsular India. Faculty of Marine Biology. Chennai, Annamalai University: 496.
Grehan, J. R. (2001). "Panbiogeography from tracks to ocean basins: evolving perspectives." Journal of Biogeography 28(413-428).
Hall, R. (1998). The plate tectonics of Cenozoic SE Asia and the distribution of land and sea. Biogeography and Evolution of SE Asia. R. Hall and J. D. Holloway. Leiden, Backhuys Publisher: 99-131.
Heaney, L. R. (1986). "Biogeography of mammals in SE Asia:estimates of rates of colonization, extinction and speciation." Biological Journal of the Linnean Society 28: 127-165.
Heaney, L. R. (1998). The origins and dimensions of biodiversity in the Philippines. Vanishing Treasures of the Philippine Rainforest. Chicago, Field Museum of Natural History: 12-22.

206
Heaney, L. R. (1999). "Historical biogeography in SE Asia: integrating paradigms and refining the details." Journal of Biogeography 26: 435-437.
Heaney, L. R. and J. C. Regalado (1998). Vanishing Treasures of the Philippine Rainforest. Chicago, The Field Museum of Natural Histiry.
Hengeveld, R. (1990). Dynamic Biogeography. Cambridge, Cambridge University Press.
Hengeveld, R. (1993). "Ecological biogeography." Progress in Physical Geography 17(4): 448-460.
Houbrick, R. S. (1985). "Genus Clypeomorus Josseaume Cerithidae: Prosobranchia." Smithsonian Contributions to Zoology 403: 1-131.
Houle, A. (1998). "Floating islands: a mode of long distance dispersal for small and medium sized terrestrial vertebrates." Diversity and Distributions 4: 201-206.
Hourigan, T. F. and E. S. Reese (1987). "Mid-ocean isolation and the evolution of Hawaiian reef fishes." Trends in Ecology and Evolution 2(7): 187-191.
Hutchinson, C. S. (1989). Displaced terranes of the southwest Pacific. The Evolution of the Pacific Ocean Margins. Z.-B. Avrahim. Oxford, Clarendon Press. 8: 161-175.
Jablonski, D. and K. W. Flessa (1986). "The taxonomic structure of shallow-water marine faunas:implications for Phanerozoic extinctions." Malacologia 27(1): 43-66.
Jokiel, P. and F. J. Martinelli (1992). "The vortex model of coral reef biogeography." Journal of Biogeography 19: 449-458.
Karig, D. E. (1971). "Origin and development of marginal basins in the Western Pacific." Journal of Geophysical Research 76: 2542-2571.
Karig, D. E. (1974). "Origin of arc systems in the Western Pacific." Annual Review of Earth and Planetary Science 2: 51-75.
Karig, D. E. (1983). "Accreted terranes in the northern part of the Philippine Archipelago." Tectonics 2: 211-236.
Kay, A. (1991). The Marine Mollusks of the Galapagos: Determinants of Insular Marine Faunas. Galapagos Marine Invertebrates: Taxonomy,Biogeography and, Evolution in Darwin's Islands. M. J. James. New York, Plenum Press.
Kay, E. A. (1990). "Cypraeidae of the Indo-Pacific: Cenozoic fossil history and biogeography." Bulletin of Marine Science 47(1): 23-34.
Kay, E. A. and S. R. Palumbi (1987). "Endemism and evolution in Hawaiian marine invertebrates." Trends in Ecology and Evolution 2(7): 183-186.
Kennedy, R. S., P. C. Gonzales, et al. (2000). A Guide to the Birds of the Philippines. Oxford, Oxford University Press.
Knudsen, J. (1997). Observations on some intertidal marine prosobranch molluscs from Darwin Harbour, Northern Territory. Proceedings of the Sizth International Marine Biological Workshop. The Marine Flora and Fauna of Darwin Harbour, Northern Territory, Australia, Darwin, Museum and Art Gallery of the Northern Territory.
Kohn, A. J. (1967). "Environmental complexity and species diversity in the gastropod genus Conus on Indo-Pacific reef platforms." American Naturalist 101: 251-259.
Kohn, A. J. (1969). "Diversity, utilization of resources, and adaptive radiation in shallow water marine invertebrates of tropical oceanic islands." Limnology and Oceanography 16: 332-348.
Kohn, A. J. (1980). "Populations of intertidal gastropods before and after a typhoon." Micronesica 16: 215-228.

207
Kohn, A. J. (1990). "Biogeography and evolution of Indo-Pacific marine mollusca: patterns, progress, problems and prospect." Bulletin of Marine Science 4 47(1): 2-9.
Kohn, A. J. (1990). "Tempo and mode of evolution in Conidae." Malacologia 32(1): 55-67.
Kohn, A. J. (1994). Ecological and biogeographic attributes of Conus on the Indian Ocean's southernmost coral reefs. Seventh International Marine Biological Workshop, Beacon Island, Houtman Abrolhos Islands, WA, Australia.
Kohn, A. J. (1997). Why are coral reef communities so diverse? Marine Biodiversity: Patterns and Processes. R. Ormond, F.G., J. D. Gage and M. V. Angel. Cambridge, Cambridge University Press: 201-215.
Kohn, A. J. and J. W. Nybakken (1975). "Ecology of Conus on eastern Indian Ocean fringing reefs: Diversity of species and resource limitations." Marine Biology 29: 211-234.
Kohn, A. J. and F. E. Perron (1994). Life History and Biogeography: Patterns in Conus. Oxford, Clarendon Press.
Kolasa, J. (1996). Nestedness and discontinuities in species-range-size distributions. Trends in Ecology and Evolution. 11: 433.
Kool, S. P. (1993). "Phylogenetic analysis of the Rapaninae." Malacologia 35: 117-132.
Krijnen, C. (1997). "Features of the operculum of Neritidae." Gloria Maris 36(1-2): 1-15.
Leal, J. H. (1991). Marine prosobranch gastropods from the oceanic islands off Brazil. Marine Biology and Fisheries. Miami, University of Miami: 419.
Lincoln, R., G. Boxshall, et al. (1998). A Dictionary of Ecology, Evolution and Systematics. Cambridge, Cambridge University Press.
Malijan, F. (2003). Substrate and Food Preference in Oliva tigridella (Caenogastropoda:Olividae) in Talin Bay, Batangas. Biology. Quezon City, Ateneo de Manila University: 34.
Marsh, L. M. and J. I. Marshall (1983). "Some aspects of the zoogeography of northwestern Australian echinoderms (other than holothurians)." Bulletin of Marine Science 33(3): 671-687.
Maurer, B. A. (1999). Untangling Ecological Complexity. Chicago, University of Chicago press.
Maurer, B. A. and M. P. Nott (1998). Geographic Range Fragmentation and the Evolution of Biological Diversity. Biodiversity Dynamics: Turnover of Populations, Taxa and Communities. M. McKinney and J. A. Drake. New York, Columbia University Press.
Maynard-Smith, J. (1966). "Sympatric speciation." Am. Nat 100: 637-650. Mayr, E. (1976). Species concepts and definitions. Evolution and Diversity of Life.
Cambride MA, Bleknap Press: 493-503. McCabe, R. and J. Cole (1989). Speculations on the late Mesozoic and Cenozoic
evolution of the Southeast Asian margin. The Evolution of the Pacific Ocean Margins. Z.-B. Avrahim. Oxford, Clarendon Press. 8: 143-159.
McCoy, E. D. and J. Kenneth L. Heck (1976). "Biogeography of corals, seagrass and mangroves: an alternative to the center of origin concept." Syst. Zool. 25: 201-210.
McKinney, M. L. (1998). "On predicting biotic homogenization: species-area patterns in marine biota." Global ecology and biogeography letters 7: 297-301.

208
McManus, J. W. (1985). Marine speciation, tectonics and sea level changes in Southeast Asia. 5th International Coral Reef Congress, Tahiti.
McManus, J. W. (1988). "Coral reefs of the ASEAN region: status and management." Ambio 17(3): 189-193.
McMillan, W. O. and S. R. Palumbi (1995). "Concordant evolutionary patterns among Indo-West Pacific Butterflyfishes." Proc. R. Soc. Lond. 260: 229-236.
Middlefart, P. (1997a). Reproduction and early life stages of Muricidae (Gastropoda:Prosobranchia) from Southeast Asia, with notes on their diversity in Thailand. Marine Ecology. Arhus, University of Aarhus.
Miskiewicz, A. G. (1980). A comparative study of the biology of Nerita spp. from the Townsville region, North Queensland. Marine Biology. Townsville, James Cook University: 96.
NAMRIA (1998). Philippine Tide and Current Tables. Manila, Bureau of Coast and Geodetic Survey.
Oosterzee, P. v. (1997). Where Worlds Collide: The Wallace Line. Melbourne, Reed. PAGASA (1992). Climate of the Philippines. Department of Science and Technology. PAGASA (1998). Meteorological Data for the Philippines, Department of Science
and Technology. 1999. Page, R. D. and E. C. Holmes (1998). Molecular Evolution: A Phylogenetic
Approach. Cambridge, Cambridge University Press. Palumbi, S. R. (1994). "Genetic divergence, reproductive isolation and marine
speciation." Annual Review of Ecology and Systematics 25: 547-572. Palumbi, S. R. (1996). "Genetic divergence, reproductive isolation and marine
speciation." J. Exp. Mar. Biol. Ecol. 203: 75-92. Palumbi, S. R. (1997). Molecular Biogeography of the Pacific. 8th International Coral
Reef Symposium, Panama City, Panama, Smithsonian Tropical Research Institute, Balboa.
Pandolfi, J. M. (1992). "Successive isolation rather than evolutionary centres for the origination of Indo-Pacific reef corals." Journal of Biogeography 19: 593-609.
Patterson, B. D. (1986). "Nested subsets and the structure of insular mammalian faunas and archipelagos." Biological Journal of the Linnean Society 28: 65-82.
Paulay, G. (1990). "Effects of late Cenozoic sea-level fluctuations on the bivalve faunas of tropical oceanic islands." Paleobiology 16(4): 415-434.
Petuch, E. J. (1987). New Caribbean Molluscan Faunas. Charlottesville. Petuch, E. J. and D. M. Sargent (1986). Atlas of the living Olive shells of the world.
Charlottesville, VA, CERF. Platnick, N. and G. Nelson (1978). "A method of analysis for historical
biogeography." Systematic Zoology 27: 1-16. Ponder, W. F. (1998). Family Muricidae. Mollusca: The Southern Synthesis. Fauna of
Australia. P. L. Beesley, G. J. B. Ross and A. Wells. Melbourne, CSIRO Publishing. 5: 819-825.
Poore, G. (2000). Biogeography and diversity of Australia's marine biota. The State of the Marine Environment Report for Australia:Technical annex 1. L. P. Zann and P. Kaliola. Canberra, Department of the Environment, Sport and Territories. 1: 75-84.
Postma, H. and W. G. Mook (1988). "The transport of water through the east Indonesian deep-sea basins. A comparison of Snellius I and II results." Neth. J. of Sea Res. 22(4): 373-381.
Potts, D. C. (1985). "Sea -level fluctuations and speciation in Scleractinia." Proc. 5th Intl. Coral Reef Congr. 4: 127-132.
209
Puotinen, M. L., T. J. Done, et al. (1998). An atlas of Tropical Cylones in the Great Barrier Reef Region: 1969-1997. Townsville, Australia, CRC Reef Research Centre: 192.
Rafaelli, D. and S. Hawkins (1996). Intertidal Ecology. London, Chapman and Hall. Rapoport, E. H. (1982). Aerography: geographical strategies of species. Mexico City,
Fundacion Bariloche. ReefBase (1998). ReefBase: a global database on coral reefs and their resources.
Manila, ICLARM. Reid, D. G. (1986). The littorinid molluscs of mangrove forests in the Indo-Pacific
region: The genus Littoraria. London, British Museum (Natural History). Reid, D. G. (1989). "The comparative morphology, phylogeny and evolution of the
gastropod family Littorinidae." Philosphical Transactions of the Royal Society of London, Series B 324: 1-110.
Reid, D. G. (1996). Systematics and Evolution of Littorina. London, Ray Society. Reid, D. G. and J. B. Geller (1997). "A new ovoviviparous species of Tectarius
(Gastropoda: Litttorinidae) from Niue, South Pacific, with a molecular phylogeny of the genus." J. Moll. Stud. 63: 207-233.
Röckel, D., W. Korn, et al. (1995). Manual of the Living Conidae Volume 1. Indo Pacific Region.
Romero, F. and W. Zacher (1981). Sulu Sea reef complexes. The Reef and Man: Proceedings of the Fourth International Coral Reef Symposim, Manila.
Rosen, B. R. (1988). Biogeographic patterns: a perceptual overview. Analytical Biogeography: An integrated approach to the study of animal and plant distributions. A. A. Myers and P. S. Giller. New York, Chapman and Hall: 23-55.
Rosen, B. R. (1988). "Progress, problems and patterns in the biogeography of reef corals and other tropical marine organisms." Helgolander Meeresunters. 42: 269-301.
Rosenzweig, M. L. (1992). "Species diversity gradients: we know more and less than we thought." Journal of Mammalogy 73: 715730.
Rosenzweig, M. L. (1995). Species Diversity in Space and Time. Cambridge, Cambridge University Press.
Rosewater, J. (1970a). The Family Littorinidae in the Indo-Pacific Part I. The Subfamily Littorininae. Indo-Pacific Mollusca. R. T. Abott, Delaware Museum of Natural History. 2.
Rosewater, J. (1970b). The Family Littorinidae in the Indo-Pacific Part II. The Subfamilies Tectariinae and Echininae. Indo-Pacific Mollusca. R. T. Abott, Delaware Museum of Natural History. 2: 507-533.
Rosseau, D. D. (2001). SE Asian monsoon variability during the last 250,000 years in the Louchan loess sequence, China.
Roy, C. (1996). Variability of sea surface features in the Western Indonesian archipelago: Inferences from the COADS dataset. Baseline Studies in Biodiversity: the Fish Resources of Western Indonesia. D. Pauly and P. Martosubroto. Manila, International Center for Living Aquatic Resources Management. 23: 15-23.
Ruwa, R. K. and V. Jaccarini (1986). "Dynamic zonation of Nerita plicata, N. undata and N. textilis (Prosobranchia:Neritacea) populations on a rocky shore in Kenya." Marine Biology 92: 425-430.

210
Santini, F. and R. Winterbottom (2002). "Historical biogeography of Indo-western Pacific coral reef biota: Is the Indonesian region a centre of origin." Journal of Biogeography 29: 189-225.
Saul, L. R. and R. L. Squires (1997). "New species of neritid gastropods from Cretaceous and Lower Cenozoic strata of the Pacific slope of North America." The Veliger 40(2): 131-147.
Schopf, T. (1979). The role of biogeographic provinces in regulating marine faunal diversity through geologic time. Historical Biogeography, Plate Tectonics and Changing Environment. J. Gray and A. Boucot. Corvalllis, Oregon State University Press: 449-57.
Scott, B. (1998). Family Neritidae. Mollusca: The Southern Synthesis. Fauna of Australia. P. L. Beesley, G. J. B. Ross and A. Wells. Melbourne, CSIRO Publishing. 5: 694-700.
Sharp, G. D. (1996). Oceanography of the Indonesian Archipelago and adjacent areas. Baseline Studies in Biodiversity: the Fish Resources of Western Indonesia. D. Pauly and P. Martosubroto. Manila, ICLARM. 23: 7-14.
Shermer, M. (2002). In Darwin's Shadow: The Life and Science of Alfred Russel Wallace. New York, Oxford University Press.
Shuto, T. (1983). "Larval development and geographical distribution of the Indo-West Pacific Murex." Bull. Mar. Sci 33(3): 536-544.
Simberloff , D. and J. L. Martin (1991). "Nestedness of insular avifaunas: simple summary statistics masking complex species patterns." Ornis Fennica 68: 178-192.
Sober, E. (1991). Reconstructing the Past: Parsimony, Evolution and Inference. Cambridge, MA, the MIT Press.
Springer, V. (1982). Pacific plate biogeography, with special reference to shorefishes. Washington DC, Smithsonian Institution.
Springsteen, F. J. and F. M. Leobrera (1986). Shells of the Philippines. Manila, Carfel Seashell Museum.
Stanley, S. M. (1986). "Population size, extinction and speciation: the fission effect in Neogene bivalvia." Paleobiology 12: 89-110.
Stehli, F. and J. W. Wells (1968). "Diversity and age patterns in hermatypic corals." Systematic Zoology 20: 115-126.
Stephenson, T. A. and A. Stephenson (1949). "The universal features of zonation between tidemarks on rocky coasts." J. Ecology 38: 289-305.
Stephenson, T. A. and A. Stephenson (1972). Life Between the Tidemarks on Rocky Shores. San Francisco, W.H. Freeman.
Tan, P. K. (2003). Shell Patterning in Oliva reticulata (Caenogastropoda:Olividae) in Talin Bay, Batangas. Biology. Quezon City, Ateneo de Manila University: 25.
Taylor, M. S. and M. E. Hellberg (2003). "Genetic retention for local retention of pelagic larvae in a Caribbean reef fish." Science 299: 107-109.
Thomas, M. L. H. (1985). "Littoral community structure and zonation on the rocky shores of Bermuda." Bulletin of Marine Science 37(3): 857-870.
Tursch, B. (1994). "The scale of sympatry in the genus Oliva." Apex 9(4): 131-142. Tursch, B. (1998). "Taxonomic problems in the genus Oliva." Phuket Marine
Biological Center Special Publication 18(2): 263-284. Tursch, B. and D. Greifeneder (2001). Oliva Shells The genus Oliva and the Species
Problem. Ancona(Italy), L'Informatore Piceno.

211
Uychiaoco, A. J., P. M. Aliño, et al. (1992). Some structuring forces and distribution patterns of coral and benthic lifeform communities in the Philippines. Seventh International Coral Reef Symposium, Guam.
Vallejo, B. (1999). Distribution and range of rocky shore gastropods in the Philippines: Comparisons between mainland and island coastlines. Symposium on Marine Biodiversity in the Visayas and Mindanao, University of the Philippines in the Visayas, Miag-ao, Iloilo, Philippines, University of the Philippines in the Visayas.
Vallejo, B. (2001). "Biogeography of Philippine Marine Molluscs." Loyola Schools Review: 21-42.
Van Osselaer, C. and B. Tursch (1993). "Studies in Olividae XVII: Data on depth of burrowing, motion and substrate choice of some Oliva species." Apex 8(4): 151-158.
Vanini, M. and G. Chellazi (1978). "Field observations on the rhythmic behaviour of Nerita textilis (Gastropoda: Prosobranchia)." Marine Biology 45: 113-121.
Vermeij, G. (1978). Biogeography and Adaptation: Patterns of Marine Life. Cambridge MA, Harvard University Press.
Vermeij, G. J. (1984). "The systematic position of the neritid prosobranch gastropod Nerita polita and related species." Proceedings of the Biological Society of Washington 97(4): 688-694.
Vermeij, G. J. (1987). "The dispersal barrier in the tropical Pacific:implications for molluscan speciation and extinction." Evolution 41(5): 1046-1098.
Vermeij, G. J. (1990). "Tropical Pacific pelecypods and productivity: a hypothesis." Bulletin of Marine Science 47(1): 62-67.
Veron, J. E. N. (1995). Corals in Time and Space: The Biogeography and Evolution of the Scleractinia. Sydney, UNSW Press.
Wallace, A. R. (1859). "On the zoological geography of the Malay Archipelago." Zoological Proceedings of the Linnaean Society.
Wallace, A. R. (1880). Island Life: The Phenomena and Causes of Insular Faunas and Floras. London, mcMilland and Co.
Wallace, C. C. (1997). The Indo-Pacific centre of coral diversity re-examined at species level. 8th International Coral Reef Symposium, Panama City, Panama, Smithsonian Tropical Research Institute, Balboa.
Weissel, J. K., . (1980). Evidence for Eocene oceanic crust in the Celebes Basin. The Tectonic and Geologic Evolution of Southeast Asian Seas and Islands. Washington D.C., American Geophysical Union. 23: 33-37.
White, A. (1987). Philippine Coral Reefs, A Natural History Guide. Quezon City, New Day Publishers.
Whittow, J. (1984). Dictionary of Physical Geography. London, Penguin Books. Williams, S. T. and J. A. H. Benzie (1998). "Evidence of a biogeographic break
between populations of a high dispersal starfish: congruent regions within the Indo-West Pacific defined by color morphs mtDNA and allozyme data." Evolution 52(1): 87-89.
Wilson, B., C. Wilson, et al. (1993). Australian Marine Shells. Kallaroo, Western Australia, Odyssea.
Wilson, M. and B. R. Rosen (1998). "Implications of paucity of corals in the Paleogene of SE Asia: plate tectonics or Centre of Origin?" Biogeography and Geological evolution of SE Asia: 165-195.

212
Wyrtki, K. (1961). Naga report: scientific results of the marine investigations of the South China Sea and the Gulf of Thailand 1959-1961. La Jolla, California, Scripps Institution of Oceanography.
Zapata, F. A. and P. A. Herrón (2002). "Pelagic larval duration and geographic distribution of tropical eastern Pacific snappers (Pisces: Lutjanidae)." Marine Ecology Progress Series (Abstract only).
Ziegler, R. F. (1969). Olive shells of the world. New York, Rochester Polychrome Press.

APPENDIX 1: DESCRIPTIONS OF FIELD COLLECTING SITES
Philippines
Palaui, Fuga Moro and Escucha Islands, Cagayan Province, northeastern Luzon 18°35’
N; 122°10 E
This is the northernmost extension of the Sierra Madre Mountains of eastern Luzon that
were formed in Paleocene . Palaui and Fuga Moro islands are volcanic and plutonic in
origin with steep cliffs and numerous embayments. These embayments are fringed with
wide coral reefs on the east, the largest of which is Robo Reef. The western side of Palaui
Island has narrow fringing coral reefs and numerous embayments. The shoreline is
composed of basalt boulders, and wide intertidal platforms with a carbonate base. Shore
angle ranges from 5 degrees to 35 degrees.
Pagudpud-Patapat Coast, Ilocos Norte Province, northern Luzon
18°38’ N; 120°49’ E
The coastline forms the edge of the Cordillera Central Mountains of northern Luzon.
Steep cliffs drop to the seacoast. The shoreline is composed of basalt boulders ranging
from 1 metre to 3 metres in diameter. The coast is exposed to swells generated by the
winter monsoon. Little fringing reef development is noted on these exposed shores. Shore
angle is 20 degrees.
Bolinao, Pangasinan Province, northwestern Luzon
16°19’ - 16°28’ N; 119°52’-120°02 E
Bolinao is a limestone cape headland facing the South China Sea at the northwestern
boundary of Lingayen Gulf. Immediately north of the cape is Santiago Island. It is
surrounded by a wide fringing reef system.

Subic Bay, Subic Bay Freeport, western Luzon
14°47’ N; 120°17’ E
Subic Bay sites were on the strict nature preserve on the southwest shore of the bay 30
kilos from the freeport. The area including Miracle Beach is fringed with massive corals,
relatively protected from the summer monsoon. The nearby land area is covered with
primary growth rainforest.
Ligpo Point, Balayan Bay, Batangas Province
13°37’ N; -120°53’ E
The shore is at the edge of an ancient volcano and is composed of lava flows from a
prehistoric eruption of Taal Volcano. A highly embayed coastline, it is fringed by coral
reefs in an incipient stage of development. A narrow veneer reef fringes Ligpo Point,
where the classic fringing reef structure is seen at the southwest edge of the point. . The
shoreline is composed of interspersed limestone blocks and basalt boulders. It is likely
that the limestone blocks are due to reef structures being raised onto the beach during
intense tropical cyclones. The cliff edge is composed of conglomerates embedded in
volcanic ash, a result of the prehistoric catastrophic eruption of Taal. Shore angle is 25
degrees.
Maricaban, Sombrero, Caban Islands, Verde Island Passage, Batangas Province
13°36’ N; 120°56 E
This group of islands is composed of conglomerates embedded in volcanic ash and
represents the edge of a collapsed volcano. Numerous headlands and embayments
characterise the coast. Sombrero Island is the remnants of a volcanic cone. At present the
islands are fringed by non-reef coral communities or reefs at an early stage of
development. The island shorelines are composed of basalt boulders and coral rubble.

Tilted and overturned Porites microatolls suggest the effects of tropical cyclones. This is
likely the source of limestone boulders on the beach.
Bacacay, Albay Province, southeastern Luzon
13°12’ N; 123°47’ E
The island coastlines are composed of volcanic headlands composed of basalt
interspersed with hardened volcanic ash. Bacacay is fringed by coral reefs in a high
sedimentary environment. On sheltered shores, mangroves are present. The area is 35
kilos from the composite cone of Mayon Volcano. The shore angle is 20 degrees.
Rizal Beach, Sorsogon Province, southeastern Luzon
12°40’ N;124°10’ E
A single volcanic headland is adjacent to a wide sandy beach exposed to Pacific Ocean
swells. A wide reef is adjacent the headland and is composed primarily of massive
Porites, Favia and Favites. Thallasia hemprichii and Enhalus seagrass cover the reef flat.
Shore angle is 15 degrees.
Calauit, Dimakya, Walang Lang-aw Islands, Calamian Group, Palawan Province
12°14’ N;-120°11’ E
These islands are geologically distinct from other islands of the Philippines. They
represent a displaced terrane of the Asian continent derived from southeastern China. The
islands are composed of granitic intrusions and marble. All islands are fringed by well-
developed coral reefs and have rocky shores on the exposed sides. Relatively sheltered
sites have sandy beaches or mangrove forests. Rocky shore angle is 30 degrees.

UsUsan, Nagarao, Inampulugan Islands, Panay Gulf, Guimaras Province
10°23’ N;122°39 E
These islands are of volcanic origin and are fringed by coral reefs. UsUsan has two
volcanic headlands on the exposed side and a wide sandy beach on the sheltered side.
Inampulugan has volcanic headlands on the southwestern to western sides and mangroves
on the eastern side facing the larger island of Guimaras. The headlands are exposed to the
south or summer monsoon. The shoreline consists of basaltic blocks and boulders. Shore
angle is 35 degrees.
Southern Bohol and Panglao Island, Bohol Province
09°30’ N; 123°56’ E
Panglao Island and the larger island of Bohol are composed of uplifted coral limestone.
Wide scale uplift occurred in the Pliocene to the Pleistocene. Wide fringing reefs and
sandy beaches surround these islands. On the exposed headlands, wave action has
scoured the base of the limestone cliffs into a characteristic overhang shape. Shore angle
is 20 degrees.
Camiguin Island, Camiguin Province
09°13’ N; 124°42E
Camiguin is a true oceanic island that emerged from the sea within the last 2 million
years. Composed of the volcanoes, Hibok-Hibok, Camiguin and Mambajao that are still
active, the island lies off the coast of northern Mindanao. Its shoreline is composed of
volcanic boulders and basaltic cliffs. Shore angle is 20-45 degrees. Narrow coral reefs
fringe the coastline. It has never been connected to Mindanao.
=
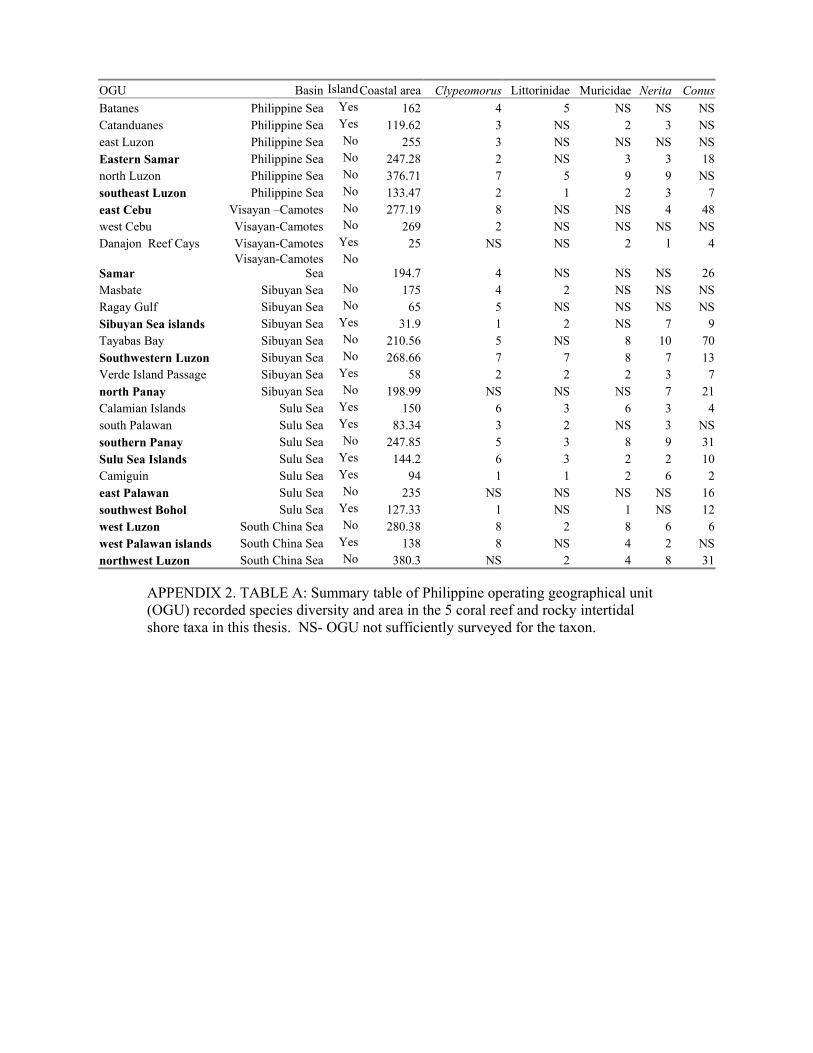
APPENDIX 2. TABLE A: Summary table of Philippine operating geographical unit (OGU) recorded species diversity and area in the 5 coral reef and rocky intertidal shore taxa in this thesis. NS- OGU not sufficiently surveyed for the taxon.
OGU Basin IslandCoastal area Clypeomorus Littorinidae Muricidae Nerita ConusBatanes Philippine Sea Yes 162 4 5 NS NS NSCatanduanes Philippine Sea Yes 119.62 3 NS 2 3 NSeast Luzon Philippine Sea No 255 3 NS NS NS NSEastern Samar Philippine Sea No 247.28 2 NS 3 3 18north Luzon Philippine Sea No 376.71 7 5 9 9 NSsoutheast Luzon Philippine Sea No 133.47 2 1 2 3 7east Cebu Visayan –Camotes No 277.19 8 NS NS 4 48west Cebu Visayan-Camotes No 269 2 NS NS NS NSDanajon Reef Cays Visayan-Camotes Yes 25 NS NS 2 1 4
Samar Visayan-Camotes
Sea No
194.7 4 NS NS NS 26Masbate Sibuyan Sea No 175 4 2 NS NS NSRagay Gulf Sibuyan Sea No 65 5 NS NS NS NSSibuyan Sea islands Sibuyan Sea Yes 31.9 1 2 NS 7 9Tayabas Bay Sibuyan Sea No 210.56 5 NS 8 10 70Southwestern Luzon Sibuyan Sea No 268.66 7 7 8 7 13Verde Island Passage Sibuyan Sea Yes 58 2 2 2 3 7north Panay Sibuyan Sea No 198.99 NS NS NS 7 21Calamian Islands Sulu Sea Yes 150 6 3 6 3 4south Palawan Sulu Sea Yes 83.34 3 2 NS 3 NSsouthern Panay Sulu Sea No 247.85 5 3 8 9 31Sulu Sea Islands Sulu Sea Yes 144.2 6 3 2 2 10Camiguin Sulu Sea Yes 94 1 1 2 6 2east Palawan Sulu Sea No 235 NS NS NS NS 16southwest Bohol Sulu Sea Yes 127.33 1 NS 1 NS 12west Luzon South China Sea No 280.38 8 2 8 6 6west Palawan islands South China Sea Yes 138 8 NS 4 2 NSnorthwest Luzon South China Sea No 380.3 NS 2 4 8 31

Basin OGU area Oliva Species number
Celebes Sea Davao Gulf 40 2 Philippine Sea
Eastern Luzon (Baler)
5 3
Philippine Sea
Surigao del Sur 185 16
Philippine Sea
Eastern Samar 247.78 4
Philippine Sea
Northern Luzon 135 11
Philippine Sea
Surigao del Norte 215 2
Philippine Sea
Sorsogon
158 4
Philippine Sea
Southeastern Luzon (Bicol)
133.47 5
South China Sea
Zambales 62.8 13
South China Sea
Western Luzon (Ilocos)
375 10
South China Sea
Mindoro Occidental
457 9
Sibuyan Sea Northern Panay 54 18 Sibuyan Sea Masbate 175 12 Sibuyan Sea Marinduque 110 7 Sibuyan Sea Mindoro Oriental 514 5 Sibuyan Sea Southewestern
Luzon (Batangas) 268.66 3
Sibuyan Sea Western Quezon (Ragay)
340 4
Sulu Sea Zamboanga del Norte
10 17
Sulu Sea Calamian Islands 74.66 10 Sulu Sea Southern Panay
(Iloilo) 247.85 8
Sulu Sea Southern Palawan (Balabac)
83.4 6
Sulu Sea Cuyo Islands 23 3 Sulu Sea Western Palawan 235 3 Sulu Sea Sulu and Tawi Tawi 44.2 13 Sulu Sea Bohol 13 6 Sulu Sea Zamboanga 90 4 Visayan-Camotes Sea
Eastern Panay 45 13
Visayan-Camotes Sea
Negros Oriental 14 18
Visayan-Camotes Sea
Samar 194.7 12
Visayan-Camotes Sea
Leyte 235 9
Visayan-Camotes Sea
Cebu East (Mactan) 277.19 1
Philippines 5062.71
APPENDIX 2B. B. Summary table of Philippine operating geographical unit (OGU) recorded species diversity and area in Oliva.

Basin Island z Sulu Sea 50 0.4324Sibuyan Sea 17 1.446VIS 13 1.309Philippine Sea 29 0.7339South China Sea 30 0.7521
Z and island plot data
Basin isolation index and z plot data
Coastal complexity and z plot data
Percent reef and z plot data
Basin z plot and Provinciality data
MREEF z Sulu Sea 73.5 0.4324 Sibuyan Sea 43.125 1.446 VIS 58.75 1.309 Philippine Sea 55 0.7339 South China Sea 75 0.7521
BASIN P z Philippine Sea 0.926338 0.733 VIS 1.786655 1.309 Sibuyan Sea 1.864419 1.446 Sulu Sea 0.693009 0.4329 South China Sea 0.893933 0.6294 PH 1 0.6308
Basin index z Sulu Sea 0.041379 0.4324Sibuyan Sea 0.078947 1.446Visayan-Camotes Sea 0.033333 1.309Philippine Sea 0.0005 0.7339South China Sea 0.001724 0.6294
Basin MCOMP Z Sulu Sea 0.09 0.4324 Sibuyan Sea 0.046 1.446 VIS 0.04 1.309 Philippine Sea 0.076 0.7339 South China Sea 0.03 0.7521
Appendix 2C. Data used in evaluating basin isolation in Chapter 6.

APPENDIX 3 Vallejo, B. (1999). Distribution and range of rocky shore gastropods in the Philippines:
Comparisons between mainland and island coastlines. In Symposium on Marine Biodiversity in the Visayas and Mindanao (ed. W. L. Campos), pp. 21-42. University of the Philippines in the Visayas, Miag-ao, Iloilo, Philippines: University of the Philippines in the Visayas.

OGU or Bioregion Species diversity H1 H2 H3 H4 H5 H6 H7 H8
H9 TOTAL
Philippines East Cebu 48 4 1 2 0 1 0 0 3 0 11 East Palawan 16 3 1 0 0 0 0 1 1 0 6 East Samar 18 1 3 0 0 1 0 0 2 0 7 Northern Panay 27 11 23 1 2 3 2 8 9 0 59 NW Luzon 29 14 8 5 0 2 0 13 50 0 92 Samar 26 3 6 0 0 0 1 2 0 0 12 Southern Panay 31 16 19 2 3 6 2 6 13 0 67 Sibuyan Sea Islands 9 1 0 0 1 1 0 1 1 0 5 Sulu Sea Islands 10 1 0 0 0 0 0 0 0 0 1 SW Bohol 12 1 1 0 0 0 0 2 1 0 5 SW Luzon 8 2 0 0 1 0 0 0 0 0 3 Tayabas Bay 69 67 68 3 17 14 6 33 46 0 254 Western Luzon 6 0 0 0 0 2 0 0 0 0 2 Totals 124 130 13 24 30 11 66 126 0 524 APPENDIX 4. Frequencies of Conus habitats in 9 habitat classes in the Philippines.

APPENDIX 5 Cone shells of the Philippines
Cone Shells of the Philippines ConeID GENUS SPECIES AUTHOR DATE Endemic Habitat
1 Conus marmoreus Linné, 1758 No 7 2 Conus imperialis Linné, 1758 No 7 3 Conus litteratus Linné, 1758 No 7 4 Conus tessulatus Born, 1778 No 5 Conus eburneus Hwass, 1792 No 2 7 Conus chaldeus (Röding, 1798) No 1 8 Conus ebraeus Linné, 1758 No 2 9 Conus coronatus (Röding, 1798) No 2
11 Conus musicus Hwass, 1792 No 4 12 Conus sponsalis Hwass, 1792 No 2 13 Conus lividus Hwass, 1792 No 8 14 Conus moreleti Crosse, 1858 No 7 15 Conus distans Hwass, 1792 No 8 17 Conus arenatus Hwass, 1792 No 1 18 Conus stercusmuscarum Linné, 1758 No 7 19 Conus varius Linné, 1758 No 8 20 Conus achatinus Gmelin, 1791 No 4 21 Conus catus Hwass, 1792 No 2 22 Conus striatellus Link, 1807 No 1 24 Conus planorbis Born, 1778 No 8 25 Conus furvus Reeve, 1843 No 1 26 Conus magus Linné, 1758 No 1 27 Conus subulatus Kiener, 1849 No 5 28 Conus stramineus Lamarck, 1810 No 5 29 Conus consors Sowerby, 1833 No 1 30 Conus australis Holten, 1802 No 5 31 Conus radiatus Gmelin, 1791 No 5 32 Conus parius Reeve, 1843 No 1 33 Conus vexillum Gmelin, 1791 No 7 34 Conus capitaneus Linné, 1758 No 2 35 Conus rattus Hwass, 1792 No 8 36 Conus mustelinus Hwass, 1792 No 8 37 Conus miles Linné, 1758 No 2 38 Conus virgo Linné, 1758 No 6 39 Conus emaciatus Reeve, 1849 No 2 40 Conus flavidus Lamarck, 1810 No 2 41 Conus frigidus Reeve, 1848 No 2 42 Conus pennaceus Born, 1778 No 3 43 Conus textile Linné, 1758 No 7 44 Conus telatus Reeve, 1848 Yes 1 45 Conus figulinus Linné, 1758 No 5 46 Conus quercinus (Lightfoot, 1786) No 1 47 Conus striatus Linné, 1758 No 1

Cone Shells of the Philippines ConeID GENUS SPECIES AUTHOR DATE Endemic Habitat
49 Conus nussatella Linné, 1758 No 8 50 Conus terebra Born, 1778 No 2 51 Conus glans Hwass, 1792 No 2 53 Conus muriculatus Sowerby I, 1833 No 8 54 Conus sulcatus Hwass, 1792 No 1 55 Conus moluccensis Küster,1838 No 1 56 Conus insculptus Kiener, 1845 No 5 57 Conus mucronatus Reeve, 1843 No 1 59 Conus acutangulus Lamarck, 1810 No 1 60 Conus floridulus Adams & Reeve, 1849 No 1 61 Conus alabaster Reeve, 1849 No 62 Conus furvus Reeve, 1843 No 63 Conus ammiralis Linné, 1758 No 64 Conus aphrodite Petuch, 1979 No 66 Conus armadillo Shikama,1971 No 67 Conus articulatus Sowerby III,1873 No 68 Conus asiaticus da Motta, 1975 No 69 Conus aulicus Linné, 1758 No 1 70 Conus auratinus da Motta, 1982 No 72 Conus auricomus Hwass, 1792 No 73 Conus aurisiacus Linné, 1758 No 74 Conus baileyi Röckel & DaMotta, 1979 No 75 Conus balteatus Sowerby I, 1833 No 76 Conus grangeri Sowerby III, 1900 No 77 Conus betulinus Linné, 1758 No 78 Conus sulcatus Hwass, 1792 No 79 Conus boeticus Reeve, 1843 No 3 80 Conus boholensis Petuch, 1979 No 81 Conus broderippi Reeve, 1843 No 82 Conus bullatus Linné, 1758 No 83 Conus canonicus Hwass, 1792 No 85 Conus caracteristicus Fischer, 1807 No 89 Conus cervus Lamarck, 1822 No 90 Conus chiangi (Azuma, 1982) No 1 91 Conus cinereus Hwass, 1792 No 3 92 Conus circumactus Iredale, 1929 No 93 Conus circumcisus Born, 1778 No 3 94 Conus coccineus Gmelin, 1791 No 95 Conus collisus Reeve, 1849 No 96 Conus neptunus Reeve, 1843 Yes 97 Conus comatosa Pilsbry, 1904 No 5

Cone Shells of the Philippines ConeID GENUS SPECIES AUTHOR DATE Endemic Habitat
98 Conus corallinus Kiener, 1845 No 100 Conus cylindraceus Broderip & Sowerby, 1833 No 101 Conus dayriti Röckel & da Motta, 1983 No 103 Conus dondani Kosuge, 1981 Yes 104 Conus dusaveli (H. Adams, 1872) No 106 Conus episcopatus da Motta, 1982 No 108 Conus excelsus Sowerby III, 1908 No 109 Conus eximius Reeve, 1849 No 110 Conus fischoederi Röckel & da Motta, 1983 No 111 Conus floccatus Sowerby II, 1839 No 112 Conus miliaris Hwass, 1792 No 2 114 Conus generalis Linné, 1767 No 1 115 Conus geographus Linné, 1758 No 1 116 Conus glaucus Linné, 1758 No 117 Conus gloriamaris Chemnitz, 1777 No 5 119 Conus hirasei (Kuroda, 1956) No 5 121 Conus ichinoseana (Kuroda, 1956) No 122 Conus ione Fulton, 1938 No 123 Conus kimioi (Habe, 1965) No 124 Conus kinoshitai (Kuroda, 1956) No 125 Conus kintoki Habe & Kosuge, 1970 Yes 126 Conus kuroharai (Habe, 1965) No 127 Conus eugrammatus Bartsch & Rehder, 1943 No 128 Conus laterculatus Sowerby III, 1870 No 129 Conus legatus Lamarck, 1810 No 130 Conus lenavati da Motta & Röckel 1982 Yes 131 Conus leobrerai da Motta & Martin, 1982 No 132 Conus leopardus (Röding, 1798) No 3 133 Conus litoglyphus Hwass, 1792 No 134 Conus luteus Sowerby I, 1833 No 135 Conus lynceus Sowerby II, 1858 No 1 136 Conus tulipa Linné, 1758 No 137 Conus obscurus Sowerby, 1833 No 139 Conus suratensis Hwass, 1792 No 140 Conus thomae Gmelin, 1791 Yes 141 Conus teramachii (Kuroda, 1956) No 142 Conus pertusus Hwass, 1792 No 143 Conus sulcocastaneus Kosuge, 1981 No 147 Conus tenuistriatus Sowerby II, 1858 No 148 Conus viola Cernohorskyi, 1977 No

Cone Shells of the Philippines ConeID GENUS SPECIES AUTHOR DATE Endemic Habitat
149 Conus monachus Linné, 1758 No 150 Conus mitratus Hwass,1792 No 1 151 Conus proximus Sowerby II, 1859 No 154 Conus spectrum Linné, 1758 No 157 Conus samiae da Motta, 1982 No 158 Conus pagodus Kiener, 1845 No 159 Conus thalassiarchus Sowerby I, 1834 Yes 163 Conus sanguinolentus Quoy & Gaimard, 1834 No 165 Conus retifer Menke, 1829 No 166 Conus nobilis Linné, 1758 No 169 Conus tribblei Walls, 1977 No 170 Conus sugimotonis Kuroda, 1928 No 171 Conus sp. No 172 Conus recluzianus Bernardi, 1857 No 173 Conus voluminalis Reeve, 1843 No 175 Conus sp. No 176 Conus magnificus Reeve, 1843 No 177 Conus omaria Hwass, 1792 No 3 178 Conus praecellens A. Adams, 1854 No 1 180 Conus memiae (Habe & Kosuge, 1960) No 181 Conus sp. No 182 Conus sp. No 183 Conus pseudorbignyi Röckel & Lan, 1981 No 184 Conus orbignyi Audouin, 1831 No 185 Conus vimineus Reeve, 1849 No 186 Conus montillai Röckel, 1985 Yes 1 187 Conus scalptus Reeve, 1843 Yes 188 Conus wakayamensis (Kuroda, 1956) No 189 Conus polongimarumai Kosuge, 1980 No 190 Conus saecularis Melvill, 1898 No 191 Conus sazanka Shikama, 1972 No 192 Conus saecularis Melvill, 1898 No 193 Conus pulicarius Hwass, 1792 No 3 194 Conus litoglyphus Hwass, 1792 No 197 Conus vexillum Gmelin, 1791 No 7 198 Conus obscurus Sowerby, 1833 No 200 Conus tulipa Linné, 1758 No 201 Conus suratensis Hwass, 1792 No 202 Conus longurionis Kiener, 1845 No 1 203 Conus pseudokimioi da Motta & Martin, 1982 No

Cone Shells of the Philippines ConeID GENUS SPECIES AUTHOR DATE Endemic Habitat
207 Conus rolani Röckel, 1986 No 209 Conus zapatosensis Röckel, 1987 Yes 210 Conus blandifordianus Crosse, 1867 No 211 Conus cordigera Sowerby II, 1866 No 212 Conus shikamai Coomans, Moolenbeck & Wils, 1985 No 213 Conus stupa (Kuroda, 1959) No 214 Conus darkini Röckel, Korn & Richard, 1992 No 215 Conus axelrodi Walls, 1978 No 216 Conus crocatus Lamarck, 1810 No 1

APPENDIX 6. Oliva species recorded from the Philippines based on DMNH material.
Distribution type: 1) Straddle the central Philippines basins, 2) Found on the edges of basins (Sibuyan Sea) 3) Central basins with northward extension to the South China Sea, 4) Eastern Philippines, 5) Recorded from one locality only Habitat code: 1) Sand, 2) Coarse sand, 3) Coral sand, 4) Coral-volcanic sand, 5) Fine sand, 6) Muddy sand, 7) Mud, 8) Gravelly sand, 9) Multisubstrate, 10) Sand and rubble * Oliva “ornata” may resemble O. irisans. However the aperture in the DMNH specimens is white that is diagnostic for O. irisans. All other conchological diagnostics described and Tursch and Greifeneder (2001) and observed in the DMNH material are for the Australian endemic O. ornata.
Oliva SPECIES Range size (sq km) Frequency of occurrence
Habitat Code
Distribution type
1 athenia 480000 9 6 2 2 amethystina 1672000 60 3 1,4 3 bulbiformis 1027200 20 1 3,4 4 caerulea 208000 8 1 5 5 carneola 1952000 44 6 3,4 6 concavospira 320000 6 6 2 7 dactyliola 832000 29 6 3,4 8 dubia 192000 8 7 2 9 elegans 880000 14 9 3 10 hirasei 48000 1 1 5 11 lacanientai 48000 1 6 5 12 mantichora 720000 5 3 1 13 miniacea 2168000 62 3 1,4 14 mustelina 80000 2 1 5 15 oliva 2880000 60 1 3,4 16 "ornata"* 1027200 14 1 3,4 17 reticulata 1096000 66 9 3 18 rufofulgurata 160000 5 1 2 19 rufula 48000 8 7 2 20 sericea 512000 31 3 3,4 21 tigridella 240000 15 3 2 22 tigrina 112000 4 1 2 23 todosina 1344000 7 1 3 24 tricolor 1000000 19 2 1 25 vidua 1988800 59 9 1,4 26 tesselata 1025600 12 3 1 27 lecoquiana 48000 1 1 5 28 irisans 160000 1 1 5 29 Unidentified
species Possibly parkinsoni
160000 1 5

APPENDIX 7. Philippine Oliva species as recorded in Tursch and Greifeneder (2001)
GENUS SPECIES AUTHORDATE 1 Oliva amythestina (Röding,1798) 2 Oliva athenia Duclos, 1835 3 Oliva buelowi Sowerby, 1890 4 Oliva bulbiformis Duclos, 1840 5 Oliva brettinghami Bridgman, 1909 6 Oliva caerulea (Röding, 1798) 7 Oliva carneola (Gmelin, 1791) 8 Oliva chrysoplecta Tursch and Greifeneder, 19899 Oliva concavospira Sowerby, 1914 10 Oliva dactyliola Duclos, 1840 11 Oliva dubia Schepman, 1904 12 Oliva elegans Lamarck, 1811 13 Oliva hirasei Kira, 1959 14 Oliva irisans Lamarck, 1811 15 Oliva lacanientai Greifeneder and Blöcher, 198516 Oliva lecoquiana Duclos de St. Germaine, 185717 Oliva mantichora Duclos,1840 18 Oliva miniacea (Röding, 1798) 19 Oliva multiplicata Reeve, 1850 20 Oliva mustelina Lamarck, 1811 21 Oliva oliva (Linné, 1758) 22 Oliva ornata* Marrat,1867 23 Oliva parkinsoni Prior, 1975 24 Oliva reticulata (Röding, 1798) 25 Oliva rufofulgurata Schepman, 1911 26 Oliva rufula Duclos, 1840 27 Oliva sericea (Röding, 1798) 28 Oliva semmilinki Schepman, 1891 29 Oliva tessellata Lamarck, 1811 30 Oliva tigridella Duclos, 1835 31 Oliva tigrina Lamarck, 1811 32 Oliva todosina Duclos, 1840 33 Oliva tricolor Lamarck, 1811 34 Oliva vicdani** Da Motta, 1982 35 Oliva vidua (Röding, 1798) *possibly O. irisans ** Philippine endemic

All_Cones
ConeID Species KohnHabitaLocality OGU Endemic Near Ende Habitat Remarks115 geographus Albay Gulf SELUZ FALSE FALSE136 tulipa E. Samar ESAM FALSE FALSE137 obscurus E. Samar ESAM FALSE FALSE39 emaciatus 2 Bohol SWBOH FALSE FALSE94 coccineus Samar SAM FALSE FALSE85 caracteristicus Manila WLUZ FALSE FALSE36 mustelinus 8 Cebu CEBE FALSE FALSE34 capitaneus 2 Cebu CEBE FALSE FALSE
116 glaucus Baler ELUZ FALSE FALSE46 quercinus 1 SWLUZ FALSE FALSE4 tessulatus Batangas SWLUZ FALSE FALSE
49 nussatella 8 Cebu CEBE FALSE FALSE77 betulinus Manila BayWLUZ FALSE FALSE
139 suratensis PangasinanWLUZ FALSE FALSE45 figulinus 5 PangasinanWLUZ FALSE FALSE73 aurisiacus Southern MSSIS FALSE TRUE 20-80 m Celebes Se
104 dusaveli Cebu CEBE FALSE FALSE140 thomae Davao DAV TRUE FALSE celebes sea endemic66 armadillo S. MindanaSSIS FALSE FALSE
126 kuroharai S. MindanaSSIS FALSE TRUE135 lynceus 1 Manila WLUZ FALSE TRUE216 crocatus 1 Samar SAM FALSE FALSE141 teramachii Mindoro EMIN FALSE FALSE142 pertusus Cebu CEBE FALSE FALSE143 sulcocastaneus Cebu CEBE FALSE FALSE93 circumcisus 3 Cebu CEBE FALSE FALSE96 neptunus Bohol SWBOH TRUE FALSE 120-240 m89 cervus S. MindanaSMIN FALSE FALSE82 bullatus Samar SAM FALSE FALSE
111 floccatus Sulu ArchipSSIS FALSE FALSE108 excelsus S. MindanaSMIN FALSE TRUE 100-400 m145 ochroleucus Batangas SWLUZ FALSE FALSE145 ochroleucus Batangas SWLUZ FALSE FALSE synonym of19 varius 8 MarinduqueSIBIS FALSE FALSE96 neptunus Cebu CEBE FALSE FALSE57 mucronatus 1 Sorsogon SELUZ FALSE FALSE52 scabriuscu 2 Samar SAM FALSE FALSE51 glans 2 Eastern SaSAM FALSE FALSE
147 tenuistriatus E. Samar ESAM FALSE FALSE148 viola Cebu CEBE FALSE FALSE134 luteus Cebu CEBE FALSE FALSE57 mucronatus 1 Cebu CEBE FALSE FALSE
149 monachus MarinduqueSIBIS FALSE FALSE150 mitratus 1 Samar SAM FALSE FALSE100 cylindraceus Samar SAM FALSE FALSE20 achatinus 4 MarinduqueSIBIS FALSE FALSE32 parius 1 Batangas SWLUZ FALSE FALSE
151 proximus Cebu CEBE FALSE FALSE153 molluccens 1 Cebu CEBE FALSE FALSE114 generalis Samar CEBE FALSE FALSE25 furvus 1 Palawan EPAL FALSE FALSE
Page 1

All_Cones
133 litoglyphus Samar SAM FALSE FALSE31 radiatus 5 Manila BayWLUZ FALSE FALSE
154 spectrum Palawan EPAL FALSE FALSE synonym of79 boeticus Samar SAM FALSE FALSE95 collisus MarinduqueSIBIS FALSE FALSE7 chaldeus 1 E. Samar ESAM FALSE FALSE
81 broderippi Sulu SSIS FALSE TRUE28 stramineus 5 MarinduqueSIBIS FALSE FALSE8 ebraeus 2 Samar SAM FALSE FALSE
35 rattus 8 E. Samar ESAM FALSE FALSE91 cinereus 3 Sulu SSIS FALSE FALSE91 cinereus MarinduqueSIBIS FALSE FALSE17 arenatus 1 Palawan EPAL FALSE FALSE
193 pulicarius 6 Samar SAM FALSE FALSE21 catus 2 Samar SAM FALSE FALSE5 eburneus 2 Samar SAM FALSE FALSE
18 stercusmus 7 Samar SAM FALSE FALSE5 eburneus Camarines SELUZ FALSE FALSE synonym of
37 miles 2 E. Samar ESAM FALSE FALSE15 distans 8 Bohol SWBOH FALSE FALSE2 imperialis 7 Bohol SWBOH FALSE FALSE
33 vexillum 7 Samar SAM FALSE FALSE54 sulcatus 1 Cebu CEBE FALSE FALSE78 sulcatus Cebu CEBE FALSE FALSE
157 samiae S. MindanaSMIN FALSE FALSE47 striatus 1 Samar SAM FALSE FALSE
128 laterculatus Tayabas BaTB FALSE TRUE30 australis 5 E. Samar ESAM FALSE TRUE50 terebra 2 E. Samar ESAM FALSE FALSE68 asiaticus Tayabas BaTB FALSE TRUE76 grangeri Punta EngaCEBE FALSE FALSE
158 pagodus Tayabas BaTB FALSE FALSE109 eximius Cebu CEBE FALSE FALSE159 thalassiarchus Palawan EPAL TRUE FALSE shallow26 magus 1 Albay Gulf SELUZ FALSE FALSE26 magus Albay Gul, SELUZ FALSE FALSE26 magus Palawan EPAL FALSE TRUE29 consors 1 Samar SAM FALSE FALSE14 moreleti 7 MarinduqueSIBIS FALSE FALSE53 muriculatus MarinduqueSIBIS FALSE FALSE synonym of40 flavidus 2 E. Samar ESAM FALSE FALSE13 lividus 8 E Samar. ESAM FALSE FALSE53 muriculatus 8 Cebu CEBE FALSE FALSE
102 achatinus 4 Palawan EPAL FALSE FALSE41 frigidus 2 Palawan EPAL FALSE FALSE22 striatellus 1 Samar SAM FALSE FALSE75 balteatus Samar SAM FALSE FALSE
163 sanguinolentus E. Samar ESAM FALSE FALSE16 biliosus 1 MarinduqueSIBIS FALSE FALSE24 planorbis Palawan EPAL FALSE FALSE24 planorbis 8 Palawan EPAL FALSE FALSE23 planorbis 8 Samar SAM FALSE FALSE
Page 2

All_Cones
92 circumactus Sulu ArchipSSIS FALSE FALSE117 gloriamaris 5 Punta EngaCEBE FALSE FALSE69 aulicus 1 E. Samar ESAM FALSE FALSE72 auricomus E. Samar ESAM FALSE FALSE
165 retifer E. Samar ESAM FALSE FALSE44 telatus 1 Palawan EPAL TRUE FALSE63 ammiralis Sulu ArchipSSIS FALSE FALSE
129 legatus E. Samar ESAM FALSE FALSE43 textile 7 Palawan EPAL FALSE FALSE83 canonicus Samar SAM FALSE FALSE1 marmoreus 7 Albay Gulf, SELUZ FALSE FALSE
166 nobilis Palawan EPAL FALSE FALSE114 generalis Punta EngaCEBE FALSE FALSE61 alabaster Tayabas BaTB FALSE FALSE
168 areonosus Coron Is., PCALAMIAN FALSE FALSE125 kintoki Punta EngaCEBE TRUE FALSE 100-400m122 ione Cebu CEBE FALSE TRUE 200-240
3 litteratus 7 Bohol SWBOH FALSE FALSE132 leopardus Cebu CEBE FALSE FALSE169 tribblei Tayabas BaTB FALSE FALSE130 lenavati Punta EngaCEBE TRUE FALSE 100-240 m170 sugimotonis Bohol SWBOH FALSE FALSE124 kinoshitai Panglao, B SWBOH FALSE FALSE112 miliaris Samar SAM FALSE FALSE112 miliaris 2 Batangas SWLUZ FALSE FALSE171 sp. Cebu CEBE FALSE FALSE172 recluzianus Tayabas BaTB FALSE TRUE 25-240 m173 voluminalis Turtle Is., SSSIS FALSE FALSE174 voluminalis Tayabas BaTB FALSE FALSE175 sp. Cebu CEBE FALSE FALSE69 aulicus 1 Albay Gulf, SELUZ FALSE FALSE
176 magnificus Samar ESAM FALSE FALSE177 omaria 3 Mactan Is., CEBE FALSE FALSE70 auratinus E. Samar ESAM FALSE FALSE
106 episcopatus Samar ESAM FALSE FALSE178 praecellens Tayabas BaTB FALSE FALSE synomym o178 praecellens Punta EngaCEBE FALSE FALSE59 acutangulu 1 Cebu CEBE FALSE FALSE
180 memiae Punta EngaCEBE FALSE FALSE123 kimioi Punta EngaCEBE FALSE FALSE97 comatosa 5 Cebu CEBE FALSE FALSE
102 aculeiformis Punta EngaCEBE FALSE FALSE181 sp. Punta EngaCEBE FALSE FALSE182 sp. Cebu CEBE FALSE FALSE121 ichinoseana Punta EngaCEBE FALSE TRUE183 pseudorbignyi Punta EngaCEBE FALSE TRUE184 orbignyi Tayabas BaTB FALSE FALSE185 vimineus Punta EngaCEBE FALSE FALSE60 floridulus 1 Mactan Is., CEBE FALSE FALSE
186 montillai 1 Palawan EPAL TRUE FALSE187 scalptus Punta EngaCEBE TRUE FALSE11 musicus 4 Batangas SWLUZ FALSE FALSE
Page 3

All_Cones
12 sponsalis 2 Batangas SWLUZ FALSE FALSE9 coronatus Samar SAM FALSE FALSE9 coronatus 2 Samar SAM FALSE FALSE
64 aphrodite Bohol SWBOH FALSE FALSE119 hirasei 5 S. MindanaSMIN FALSE TRUE 100-240 m98 corallinus Sulu ArchipSSIS FALSE FALSE26 magus Palawan EPAL FALSE FALSE
131 leobrerai Visayan SeNWBOH FALSE FALSE127 eugrammatus Punta EngaCEBE FALSE FALSE67 articulatus Punta EngaCEBE FALSE FALSE
101 dayriti Palawan EPAL FALSE FALSE90 chiangi 1 Panglao, B SWBOH FALSE FALSE74 baileyi Panglao, B SWBOH FALSE FALSE80 boholensis Panglao, B SWBOH FALSE FALSE
127 eugrammatus Visayan SeNWBOH FALSE FALSE103 dondani Panglao, B SWBOH TRUE FALSE188 wakayamensis Visayan SeNWBOH FALSE FALSE 30-140 m189 polongimarumai Punta EngaCEBE FALSE FALSE62 furvus Samar SAM FALSE FALSE30 australis Visayan SeNWBOH FALSE FALSE
190 saecularis Punta EngaCEBE FALSE FALSE191 sazanka Davao DAV FALSE FALSE110 fischoederi Samar SAM FALSE TRUE 30 m coral rubble192 saecularis Punta EngaCEBE FALSE FALSE
1 marmoreus 7 Pagbilao TB FALSE FALSE1 marmoreus 7 MatandangTB FALSE FALSE1 marmoreus 7 Unisan TB FALSE FALSE1 marmoreus 7 Agdangan TB FALSE FALSE1 marmoreus 7 Ibabang SuTB FALSE FALSE1 marmoreus 7 Amang CalTB FALSE FALSE1 marmoreus 7 Busdak TB FALSE FALSE1 marmoreus 7 Kawayan TB FALSE FALSE1 marmoreus 7 Gatasan TB FALSE FALSE2 imperialis 7 Hacupan IsTB FALSE FALSE2 imperialis 7 Imelda TB FALSE FALSE2 imperialis 7 Amang CalTB FALSE FALSE3 litteratus 7 Mayao TB FALSE FALSE3 litteratus 7 MatandangTB FALSE FALSE3 litteratus 7 Imelda TB FALSE FALSE3 litteratus 7 Bagong Sil TB FALSE FALSE4 tesullatus 1 Laiya TB FALSE FALSE4 tesullatus 1 Mayao TB FALSE FALSE4 tesullatus 1 S MarinduqTB FALSE FALSE5 eburneus 2 Cabuyo TB FALSE FALSE6 caracterisc 1 Mongpong TB FALSE FALSE7 chaldeus 1 Hacupan IsTB FALSE FALSE
35 rattus 8 Pasaleng BNWLUZ FALSE FALSE35 rattus 8 Darara Poi NWLUZ FALSE FALSE37 miles 2 Cadalian NWLUZ FALSE FALSE37 miles 2 Maglasi NWLUZ FALSE FALSE37 miles 2 Delavis NWLUZ FALSE FALSE37 miles 2 SalomaqueNWLUZ FALSE FALSE
Page 4

All_Cones
11 musicus 7 SalomaqueNWLUZ FALSE FALSE11 musicus 7 Pagatpat NWLUZ FALSE FALSE11 musicus 7 Currimao NWLUZ FALSE FALSE11 musicus 7 Maglasi NWLUZ FALSE FALSE11 musicus 7 Sabang NWLUZ FALSE FALSE37 miles 2 SalomaqueNWLUZ FALSE FALSE11 musicus 7 Pasaleng BNWLUZ FALSE FALSE
112 miliaris 2 Pasaleng BNWLUZ FALSE FALSE14 moreleti 7 Bantoc NWLUZ FALSE FALSE11 musicus 7 PagsanaanNWLUZ FALSE FALSE
112 miliaris 2 Centro NWLUZ FALSE FALSE11 musicus 7 PagsanaanNWLUZ FALSE FALSE53 muriculatus 8 Dardarat NWLUZ FALSE FALSE26 magus Daclapan NWLUZ FALSE FALSE53 muriculatus 8 Gubat Nort NWLUZ FALSE FALSE36 mustelinus 8 Parana PoiNWLUZ FALSE FALSE37 miles 2 Sulvec NWLUZ FALSE FALSE37 miles 2 Surngit NWLUZ FALSE FALSE37 miles 2 Sulvec NWLUZ FALSE FALSE14 moreleti 7 Dirigue BayNWLUZ FALSE FALSE37 miles 2 Bangui BayNWLUZ FALSE FALSE21 catus 1 Liwi NWLUZ FALSE FALSE21 catus 1 Cadalian NWLUZ FALSE FALSE21 catus 1 Maglawi NWLUZ FALSE FALSE21 catus 1 Apatot NWLUZ FALSE FALSE21 catus 1 Sulvec NWLUZ FALSE FALSE21 catus 1 Santiago NWLUZ FALSE FALSE21 catus 1 Maglasi NWLUZ FALSE FALSE21 catus 1 Sabang NWLUZ FALSE FALSE21 catus 1 PagsanaanNWLUZ FALSE FALSE
198 obscurus Saud NWLUZ FALSE FALSE145 ochroleucus Dirigue BayNWLUZ FALSE FALSE24 planorbis 8 Liwis NWLUZ FALSE FALSE
193 pulicarius 3 Cadalian NWLUZ FALSE FALSE193 pulicarius 3 Maglasi NWLUZ FALSE FALSE24 planorbis 8 Bateria NWLUZ FALSE FALSE
193 pulicarius 3 Sulvec NWLUZ FALSE FALSE24 planorbis 8 Badoc IslanNWLUZ FALSE FALSE
193 pulicarius 3 Badoc IslanNWLUZ FALSE FALSE151 proximus Tamunong NWLUZ FALSE FALSE193 pulicarius 3 Bobon NWLUZ FALSE FALSE12 sponsalis 2 SalomaqueNWLUZ FALSE FALSE47 striatus 1 Pasaleng BNWLUZ FALSE FALSE16 biliosus 1 SalomaqueNWLUZ FALSE FALSE
201 suratensis Barangay DNWLUZ FALSE FALSE47 striatus 1 Maglaoi NWLUZ FALSE FALSE12 sponsalis 2 Sulvec NWLUZ FALSE FALSE12 sponsalis 2 SalomaqueNWLUZ FALSE FALSE12 sponsalis 2 Sulvec NWLUZ FALSE FALSE8 ebreaus 2 Hacupan IsTB FALSE FALSE8 ebreaus 2 Hacupan IsTB FALSE FALSE8 ebreaus 2 Maniuaya I TB FALSE FALSE
Page 5

All_Cones
11 musicus 4 Talaotalao TB FALSE FALSE11 musicus 4 Calancan TB FALSE FALSE11 musicus 4 Panambo TB FALSE FALSE11 musicus 4 MancarangTB FALSE FALSE11 musicus 4 Pagbilao GTB FALSE FALSE11 musicus 4 Mongpong TB FALSE FALSE11 musicus 4 Mongpong TB FALSE FALSE11 musicus 4 Kawayan TB FALSE FALSE11 musicus 4 Inabuan TB FALSE FALSE11 musicus 4 Busdak TB FALSE FALSE11 musicus 4 Ajos TB FALSE FALSE11 musicus 4 Santa RosaTB FALSE FALSE11 musicus 4 Ajos TB FALSE FALSE11 musicus 4 Ajos TB FALSE FALSE12 sponsalis 2 Hacupan IsTB FALSE FALSE13 lividus 8 Laiya TB FALSE FALSE14 moreleti 7 Bacong IbaTB FALSE FALSE14 moreleti 7 Imelda TB FALSE FALSE14 moreleti 7 Calancan TB FALSE FALSE15 distans 8 Tuhian Poi TB FALSE FALSE16 biliosus 1 Tigwi TB FALSE FALSE17 arenatus 1 Pulong TB FALSE FALSE17 arenatus 1 Laiya TB FALSE FALSE17 arenatus 1 Calancan TB FALSE FALSE18 stercusmus 7 Subukin TB FALSE FALSE18 stercusmus 7 Patabog TB FALSE FALSE18 stercusmus 7 Hacupan IsTB FALSE FALSE18 stercusmus 7 Cabuyo TB FALSE FALSE18 stercusmus 7 Kawayan TB FALSE FALSE18 stercusmus 7 Busdak TB FALSE FALSE18 stercusmus 7 Ajos TB FALSE FALSE19 varius 8 Tayabas TB FALSE FALSE19 varius 8 Patabog TB FALSE FALSE20 achatinus 4 Cabuyo TB FALSE FALSE20 achatinus 4 Inabuan TB FALSE FALSE20 achatinus 4 Ajos TB FALSE FALSE21 catus 1 Cabuyo TB FALSE FALSE21 catus 1 Cabuyo TB FALSE FALSE22 striatellus 1 Kalutan TB FALSE FALSE23 planorbis 8 Catanauan TB FALSE FALSE23 planorbis 8 Sandoval PTB FALSE FALSE24 planorbis 8 Laiya TB FALSE FALSE24 planorbis 8 Ibabang PuTB FALSE FALSE24 planorbis 8 Panambo TB FALSE FALSE24 planorbis 8 MatandangTB FALSE FALSE24 planorbis 8 Kalutan TB FALSE FALSE24 planorbis 8 Pagbilao GTB FALSE FALSE24 planorbis 8 Sandoval PTB FALSE FALSE24 planorbis 8 Kawayan TB FALSE FALSE24 planorbis 8 Inabuan TB FALSE FALSE25 furvus 1 Punta1 TB FALSE FALSE26 magus 1 Talaotalao TB FALSE FALSE
Page 6

All_Cones
26 magus 1 Pagbilao GTB FALSE FALSE26 magus 1 MatandangTB FALSE FALSE26 magus 1 Bacong IbaTB FALSE FALSE12 sponsalis 2 Bago NWLUZ FALSE FALSE44 telatus 1 DadalaquitaNWLUZ TRUE FALSE50 terebra 2 PagsanaanNWLUZ FALSE FALSE50 terebra 2 Sulvec NWLUZ FALSE FALSE50 terebra 2 CapurpuramNWLUZ FALSE FALSE
200 tulipa Burgos NWLUZ FALSE FALSE200 tulipa Tamunong NWLUZ FALSE FALSE197 vexillum 7 SalomaqueNWLUZ FALSE FALSE23 planorbis 8 Paraoir NWLUZ FALSE FALSE23 planorbis 8 Maglawi NWLUZ FALSE FALSE19 varius 8 Narvacan NWLUZ FALSE FALSE
197 vexillum 7 Bateria NWLUZ FALSE FALSE23 planorbis 8 Bobon NWLUZ FALSE FALSE19 varius 8 Torre NWLUZ FALSE FALSE23 planorbis 8 Dirigue BayNWLUZ FALSE FALSE23 planorbis 8 Maglasi NWLUZ FALSE FALSE13 lividus 8 Dirigue BayNWLUZ FALSE FALSE13 lividus 8 Cabugao NWLUZ FALSE FALSE2 imperialis 7 Sabang NWLUZ FALSE FALSE
13 lividus 8 Sulvec NWLUZ FALSE FALSE13 lividus 8 Pasuquin NWLUZ FALSE FALSE13 lividus 8 San RoqueNWLUZ FALSE FALSE13 lividus 8 Imelda Par NWLUZ FALSE FALSE13 lividus 8 Santiago CNWLUZ FALSE FALSE13 lividus 8 Bobon NWLUZ FALSE FALSE13 lividus 8 Bobon NWLUZ FALSE FALSE13 lividus 8 Bolanos NWLUZ FALSE FALSE13 lividus 8 Sulvec NWLUZ FALSE FALSE13 lividus 8 CarpurpuraNWLUZ FALSE FALSE13 lividus 8 Tamunong NWLUZ FALSE FALSE13 lividus 8 Delavu NWLUZ FALSE FALSE
194 litoglyphus Bulalo NWLUZ FALSE FALSE13 lividus 8 PagnasaanNWLUZ FALSE FALSE13 lividus 8 Tamunong NWLUZ FALSE FALSE13 lividus 8 Batil NWLUZ FALSE FALSE13 lividus 8 Poro Point NWLUZ FALSE FALSE13 lividus 8 Pasaleng BNWLUZ FALSE FALSE13 lividus 8 PadalaquitaNWLUZ FALSE FALSE46 quercinus 1 Tulnaga NWLUZ FALSE FALSE35 rattus 8 Pinget IslanNWLUZ FALSE FALSE35 rattus 8 SalomaqueNWLUZ FALSE FALSE35 rattus 8 Liwis NWLUZ FALSE FALSE35 rattus 8 Pasaleng BNWLUZ FALSE FALSE35 rattus 8 Saud NWLUZ FALSE FALSE35 rattus 8 Badoc IslanNWLUZ FALSE FALSE35 rattus 8 Badoc IslanNWLUZ FALSE FALSE35 rattus 8 CapurpuramNWLUZ FALSE FALSE35 rattus 8 Dalaui NWLUZ FALSE FALSE35 rattus 8 Dalaui NWLUZ FALSE FALSE
Page 7

All_Cones
31 radiatus 5 Marcos Sa NWLUZ FALSE FALSE31 radiatus 5 Lingayen GNWLUZ FALSE FALSE35 rattus 8 Butol NWLUZ FALSE FALSE35 rattus 8 Tamunong NWLUZ FALSE FALSE35 rattus 8 Burgos NWLUZ FALSE FALSE35 rattus 8 Saloge NWLUZ FALSE FALSE35 rattus 8 Torre NWLUZ FALSE FALSE26 magus 1 Pagbilao GTB FALSE FALSE26 magus 1 Pagbilao GTB FALSE FALSE26 magus 1 Abung TB FALSE FALSE26 magus 1 Subukin TB FALSE FALSE26 magus 1 Subukin TB FALSE FALSE26 magus 1 Ibabang SuTB FALSE FALSE26 magus 1 Hacupan IsTB FALSE FALSE26 magus 1 Cabuyo TB FALSE FALSE26 magus 1 MatandangTB FALSE FALSE26 magus 1 Sandoval PTB FALSE FALSE26 magus 1 Punta TB FALSE FALSE26 magus 1 Busdak TB FALSE FALSE26 magus 1 Busdak TB FALSE FALSE26 magus 1 Busdak TB FALSE FALSE26 magus 1 Maalat TB FALSE FALSE26 magus 1 Busdak TB FALSE FALSE26 magus 1 Maalat TB FALSE FALSE26 magus 1 Busdak TB FALSE FALSE26 magus 1 Kawayan TB FALSE FALSE26 magus 1 Ajos TB FALSE FALSE26 magus 1 Ajos TB FALSE FALSE26 magus 1 Ajos TB FALSE FALSE26 magus 1 Gatasan TB FALSE FALSE26 magus 1 Gatasan TB FALSE FALSE26 magus 1 Gatasan TB FALSE FALSE27 subulatus 5 Laiya TB FALSE TRUE27 subulatus 5 Bacong IbaTB FALSE TRUE28 stramineus 5 MatandangTB FALSE FALSE29 consors 1 MatandangTB FALSE FALSE29 consors 1 Catanauan TB FALSE FALSE29 consors 1 Cabuyo TB FALSE FALSE30 australis 5 Tayabas TB FALSE TRUE31 radiatus 5 Talaotalao TB FALSE FALSE31 radiatus 5 MatandangTB FALSE FALSE31 radiatus 5 Punta TB FALSE FALSE31 radiatus 5 Mulanay TB FALSE FALSE31 radiatus 5 Parales TB FALSE FALSE31 radiatus 5 Ibabang SuTB FALSE FALSE31 radiatus 5 MatandangTB FALSE FALSE31 radiatus 5 Bagong Sil TB FALSE FALSE32 parius 1 Cabuyo TB FALSE FALSE33 vexillum 7 Ibabang PuTB FALSE FALSE
197 vexillum 7 Amang CalTB FALSE FALSE34 capitaneus 2 Talaotalao TB FALSE FALSE34 capitaneus 2 Laiya TB FALSE FALSE
Page 8

All_Cones
34 capitaneus 2 MatandangTB FALSE FALSE34 capitaneus 2 Catanauan TB FALSE FALSE34 capitaneus 2 Busdak TB FALSE FALSE34 capitaneus 2 Sandoval PTB FALSE FALSE35 rattus 8 Laiya TB FALSE FALSE35 rattus 8 Maniuaya I TB FALSE FALSE35 rattus 8 Bagong Sil TB FALSE FALSE36 mustelinus 8 Talaotalao TB FALSE FALSE36 mustelinus 8 Laiya TB FALSE FALSE36 mustelinus 8 Ibabang PuTB FALSE FALSE36 mustelinus 8 MatandangTB FALSE FALSE36 mustelinus 8 Punta TB FALSE FALSE36 mustelinus 8 Putting BuhTB FALSE FALSE36 mustelinus 8 Catanauan TB FALSE FALSE36 mustelinus 8 Bacong IbaTB FALSE FALSE36 mustelinus 8 Imelda TB FALSE FALSE36 mustelinus 8 Sandoval PTB FALSE FALSE36 mustelinus 8 Ajos TB FALSE FALSE37 miles 2 Hacupan IsTB FALSE FALSE37 miles 2 Laiya TB FALSE FALSE37 miles 2 San Franci TB FALSE FALSE38 virgo 6 Ibabang PuTB FALSE FALSE38 virgo 6 Pagbilao GTB FALSE FALSE38 virgo 6 MatandangTB FALSE FALSE38 virgo 6 Bacong IbaTB FALSE FALSE38 virgo 6 Silag TB FALSE FALSE38 virgo 6 MatandangTB FALSE FALSE39 emaciatus 2 Hacupan IsTB FALSE FALSE39 emaciatus 2 Panambo TB FALSE FALSE39 emaciatus 2 Hacupan IsTB FALSE FALSE40 flavidus 2 Hacupan IsTB FALSE FALSE41 frigidus 2 Tigwi TB FALSE FALSE42 pennaceus 3 Sta Cruz TB FALSE FALSE42 pennaceus 3 Laiya TB FALSE FALSE42 pennaceus 3 Cabuyo TB FALSE FALSE43 textile 7 Laiya TB FALSE FALSE43 textile 7 Hacupan IsTB FALSE FALSE43 textile 7 Cabuyo TB FALSE FALSE43 textile 7 Cabuyo TB FALSE FALSE43 textile 7 Santa RosaTB FALSE FALSE44 telatus 1 Mongpong TB TRUE FALSE45 figulinus 5 MatandangTB FALSE FALSE46 quercinus 1 Maniuaya I TB FALSE FALSE46 quercinus 1 Silag TB FALSE FALSE47 striatus 1 Banot IslanTB FALSE FALSE47 striatus 1 Putting BuhTB FALSE FALSE47 striatus 1 Catanauan TB FALSE FALSE47 striatus 1 Amang CalTB FALSE FALSE47 striatus 1 Cabuyo TB FALSE FALSE47 striatus 1 Mongpong TB FALSE FALSE47 striatus 1 Gatasan TB FALSE FALSE48 anemone 1 Tayabas TB FALSE FALSE
Page 9

All_Cones
48 anemone 1 Laiya TB FALSE FALSE49 nussatella 8 Maniuaya I TB FALSE FALSE49 nussatella 8 Laiya TB FALSE FALSE50 terebra 2 Laiya TB FALSE FALSE50 terebra 2 Bacong IbaTB FALSE FALSE50 terebra 2 Mongpong TB FALSE FALSE51 glans 2 Mongpong TB FALSE FALSE51 glans 2 Laiya TB FALSE FALSE52 scabriuscu 2 Mongpong TB FALSE FALSE53 muriculatus 8 Talaotalao TB FALSE FALSE53 muriculatus 8 Laiya TB FALSE FALSE53 muriculatus 8 Ibabang PuTB FALSE FALSE53 muriculatus 8 Patabog TB FALSE FALSE53 muriculatus 8 Ibabang PuTB FALSE FALSE53 muriculatus 8 Patabog TB FALSE FALSE53 muriculatus 8 Abung TB FALSE FALSE53 muriculatus 8 Subukin TB FALSE FALSE53 muriculatus 8 Ibabang SuTB FALSE FALSE53 muriculatus 8 Pacatin TB FALSE FALSE53 muriculatus 8 Cabuyo TB FALSE FALSE53 muriculatus 8 MatandangTB FALSE FALSE53 muriculatus 8 Ajos TB FALSE FALSE53 muriculatus 8 Santa RosaTB FALSE FALSE53 muriculatus 8 Cabuyo TB FALSE FALSE54 sulcatus 1 Tayabas TB FALSE FALSE55 moluccens 1 Cabuyo TB FALSE FALSE55 moluccens 1 Tigwi TB FALSE FALSE55 moluccens 1 Tigwi TB FALSE FALSE55 moluccens 1 Tigwi TB FALSE FALSE56 insculptus 5 Tayabas TB FALSE FALSE57 mucronatus 1 Busdak TB FALSE FALSE
178 praecellens 1 Tayabas TB FALSE FALSE59 acutangulu 1 Laiya TB FALSE FALSE60 floridulus 1 Tigwi TB FALSE FALSE20 achatinus 4 Guimaras I SPANAY FALSE FALSE17 arenatus 1 Tangalan NPANAY FALSE FALSE17 arenatus 1 Anini-Y SPANAY FALSE FALSE17 arenatus 1 Tangalan SPANAY FALSE FALSE17 arenatus 1 Pandan NPANAY FALSE FALSE17 arenatus 1 Malay NPANAY FALSE FALSE79 boeticus 3 ConcepcionSPANAY FALSE FALSE34 capitaneus 2 Guimaras SSPANAY FALSE FALSE34 capitaneus 2 Tangalan NPANAY FALSE FALSE34 capitaneus 2 ConcepcionSPANAY FALSE FALSE34 capitaneus 2 Guimaras I SPANAY FALSE FALSE34 capitaneus 2 Malay NPANAY FALSE FALSE34 capitaneus 2 Tangalan NPANAY FALSE FALSE34 capitaneus 2 Tangalan NPANAY FALSE FALSE34 capitaneus 2 Guimaras I SPANAY FALSE FALSE21 catus 2 Nabus NPANAY FALSE FALSE21 catus 2 Tobias Fer SPANAY FALSE FALSE7 chaldeus 1 Caluya SPANAY FALSE FALSE
Page 10

All_Cones
7 chaldeus 1 Anini-Y SPANAY FALSE FALSE7 chaldeus 1 Anini-Y SPANAY FALSE FALSE7 chaldeus 1 Malay NPANAY FALSE FALSE7 chaldeus 1 Anini-Y SPANAY FALSE FALSE
95 collisus Guimaras I SPANAY FALSE FALSE95 collisus Carles SPANAY FALSE FALSE15 distans 8 Tangalan NPANAY FALSE FALSE8 ebraeus 2 Sapian BayNPANAY FALSE FALSE8 ebraeus 2 Culasi NPANAY FALSE FALSE8 ebraeus 2 Tobias Fer NPANAY FALSE FALSE8 ebraeus 2 Guimaras I SPANAY FALSE FALSE8 ebraeus 2 Anini-Y NPANAY FALSE FALSE8 ebraeus 2 Caluya NPANAY FALSE FALSE8 ebraeus 2 Carles SPANAY FALSE FALSE8 ebraeus 2 Malay NPANAY FALSE FALSE8 ebraeus 2 Buruanga NPANAY FALSE FALSE8 ebraeus 2 Guimaras I SPANAY FALSE FALSE8 ebraeus 2 Anini-Y SPANAY FALSE FALSE8 ebraeus 2 Anini-Y SPANAY FALSE FALSE8 ebraeus 2 ConcepcionSPANAY FALSE FALSE8 ebraeus 2 Tangalan NPANAY FALSE FALSE8 ebraeus 2 Tangalan NPANAY FALSE FALSE8 ebreaus 2 Manulao TB FALSE FALSE8 ebreaus 2 Maniuaya I TB FALSE FALSE8 ebreaus 2 Busdak TB FALSE FALSE8 ebreaus 2 Busdak TB FALSE FALSE8 ebreaus 2 Maalat TB FALSE FALSE9 coronatus 2 Talaotalao TB FALSE FALSE9 coronatus 2 Banot IslanTB FALSE FALSE9 coronatus 2 Laiya TB FALSE FALSE9 coronatus 2 MatandangTB FALSE FALSE9 coronatus 2 Patabog TB FALSE FALSE9 coronatus 2 Bacong IbaTB FALSE FALSE9 coronatus 2 Bacong IbaTB FALSE FALSE9 coronatus 2 Subukin TB FALSE FALSE9 coronatus 2 Abung TB FALSE FALSE9 coronatus 2 Subukin TB FALSE FALSE9 coronatus 2 Hacupan IsTB FALSE FALSE9 coronatus 2 Cabuyo TB FALSE FALSE9 coronatus 2 Calancan TB FALSE FALSE9 coronatus 2 MatandangTB FALSE FALSE9 coronatus 2 Tayabas BaTB FALSE FALSE9 coronatus 2 Punta TB FALSE FALSE9 coronatus 2 Busdak TB FALSE FALSE9 coronatus 2 Maalat TB FALSE FALSE9 coronatus 2 Busdak TB FALSE FALSE9 coronatus 2 Kawayan TB FALSE FALSE9 coronatus 2 Inabuan TB FALSE FALSE9 coronatus 2 Inabuan TB FALSE FALSE9 coronatus 2 Ajos TB FALSE FALSE9 coronatus 2 Ajos TB FALSE FALSE9 coronatus 2 Ajos TB FALSE FALSE
Page 11

All_Cones
9 coronatus 2 Ajos TB FALSE FALSE9 coronatus 2 Ajos TB FALSE FALSE9 coronatus 2 Santa RosaTB FALSE FALSE9 coronatus 2 Ajos TB FALSE FALSE9 coronatus 2 Ajos TB FALSE FALSE9 coronatus 2 Ajos TB FALSE FALSE9 coronatus 2 Gatasan TB FALSE FALSE9 coronatus 2 Gatasan TB FALSE FALSE9 coronatus 2 Gatasan TB FALSE FALSE9 coronatus 2 Gatasan TB FALSE FALSE9 coronatus 2 Gatasan TB FALSE FALSE9 coronatus 2 Bagong Sil TB FALSE FALSE
112 miliaris 2 Laiya TB FALSE FALSE8 ebraeus 2 Santander NPANAY FALSE FALSE8 ebraeus 2 Anini-Y SPANAY FALSE FALSE5 eburneus 2 Tangalan NPANAY FALSE FALSE
39 emaciatus 2 Caluya NPANAY FALSE FALSE39 emaciatus 2 Culasi NPANAY FALSE FALSE45 figulinus 5 Tangalan SPANAY FALSE FALSE40 flavidus 2 Anini-Y SPANAY FALSE FALSE40 flavidus 2 Caluya SPANAY FALSE FALSE
112 miliaris Pilar NPANAY FALSE FALSE51 glans 2 Malay NPANAY FALSE FALSE51 glans 2 Anini-Y SPANAY FALSE FALSE51 glans 2 Tobias Fer SPANAY FALSE FALSE51 glans 2 Tangalan NPANAY FALSE FALSE51 glans 2 Anini-Y SPANAY FALSE FALSE51 glans 2 Tangalan NPANAY FALSE FALSE
114 generalis Pilar NPANAY FALSE FALSE114 generalis Tibiao NPANAY FALSE FALSE
8 ebraeus 2 Guimaras I SPANAY FALSE FALSE2 imperialis 7 Anini-Y SPANAY FALSE FALSE2 imperialis 7 Malay NPANAY FALSE FALSE2 imperialis 7 Tangalan NPANAY FALSE FALSE
132 leopardus 3 Malay NPANAY FALSE FALSE132 leopardus 3 Tibiao SPANAY FALSE FALSE
3 litteratus 7 Guimaras I SPANAY FALSE FALSE3 litteratus 7 Tangalan NPANAY FALSE FALSE3 litteratus 7 Malay NPANAY FALSE FALSE
13 lividus 8 Pandan SPANAY FALSE FALSE13 lividus 8 Makato NPANAY FALSE FALSE13 lividus 8 Anini-Y SPANAY FALSE FALSE13 lividus 8 Guimaras I SPANAY FALSE FALSE13 lividus 8 Guimaras I SPANAY FALSE FALSE26 magus 1 Caluya SPANAY FALSE FALSE26 magus 1 ConcepcionSPANAY FALSE FALSE26 magus 1 ConcepcionSPANAY FALSE FALSE26 magus 1 Pilar NPANAY FALSE FALSE26 magus 1 Tangalan NPANAY FALSE FALSE26 magus 1 San Dionis SPANAY FALSE FALSE26 magus 1 Tangalan NPANAY FALSE FALSE26 magus 1 ConcepcionSPANAY FALSE FALSE
Page 12

All_Cones
26 magus 1 Libertad SPANAY FALSE FALSE26 magus 1 Carles SPANAY FALSE FALSE26 magus 1 Tangalan NPANAY FALSE FALSE26 magus 1 Guimaras I SPANAY FALSE FALSE26 magus 1 ConcepcionSPANAY FALSE FALSE26 magus 1 Guimaras I SPANAY FALSE FALSE26 magus 1 Guimaras I SPANAY FALSE FALSE37 miles 2 ConcepcionSPANAY FALSE FALSE37 miles 2 Tangalan NPANAY FALSE FALSE37 miles 2 Nabus NPANAY FALSE FALSE37 miles 2 Pandan SPANAY FALSE FALSE37 miles 2 Malay NPANAY FALSE FALSE37 miles 2 Guimaras I SPANAY FALSE FALSE37 miles 2 Tangalan NPANAY FALSE FALSE37 miles 2 Anini-Y SPANAY FALSE FALSE37 miles 2 Carles SPANAY FALSE FALSE14 moreleti 7 Anini-Y SPANAY FALSE FALSE14 moreleti 7 Anini-Y SPANAY FALSE FALSE53 muriculatus 8 Guimaras I SPANAY FALSE FALSE11 musicus 4 Anini-Y SPANAY FALSE FALSE11 musicus 4 Anini-Y SPANAY FALSE FALSE11 musicus 4 Pandan SPANAY FALSE FALSE11 musicus 4 Tangalan NPANAY FALSE FALSE11 musicus 4 Tangalan NPANAY FALSE FALSE11 musicus 4 Malay NPANAY FALSE FALSE11 musicus 4 Anini-Y SPANAY FALSE FALSE36 mustelinus 8 Ibayang NPANAY FALSE FALSE36 mustelinus 8 Carles SPANAY FALSE FALSE36 mustelinus 8 Tangalan NPANAY FALSE FALSE36 mustelinus 8 ConcepcionSPANAY FALSE FALSE36 mustelinus 8 Guimaras I SPANAY FALSE FALSE36 mustelinus 8 Sapian BayNPANAY FALSE FALSE26 magus 1 ConcepcionSPANAY FALSE FALSE21 catus 1 Culasi SPANAY FALSE FALSE21 catus 1 Anini-Y SPANAY FALSE FALSE21 catus 1 Buruanga NPANAY FALSE FALSE21 catus 1 Malay NPANAY FALSE FALSE
177 omaria 3 Caluya SPANAY FALSE FALSE177 omaria 3 Caluya SPANAY FALSE FALSE24 planorbis 8 Libertad SPANAY FALSE FALSE24 planorbis 8 ConcepcionSPANAY FALSE FALSE24 planorbis 8 ConcepcionSPANAY FALSE FALSE24 planorbis 8 Caluya SPANAY FALSE FALSE24 planorbis 8 Tangalan NPANAY FALSE FALSE24 planorbis 8 Tangalan NPANAY FALSE FALSE24 planorbis 8 Tangalan NPANAY FALSE FALSE24 planorbis 8 Malay NPANAY FALSE FALSE
151 proximus Guimaras I SPANAY FALSE FALSE193 pulicarius 6 Pandan SPANAY FALSE FALSE193 pulicarius 6 Tangalan NPANAY FALSE FALSE31 radiatus 5 Caluya SPANAY FALSE FALSE31 radiatus 5 Guimaras I SPANAY FALSE FALSE
Page 13

All_Cones
31 radiatus 5 Roxas City NPANAY FALSE FALSE31 radiatus 5 Sapian BayNPANAY FALSE FALSE31 radiatus 5 Guimaras I SPANAY FALSE FALSE31 radiatus 5 Guimaras I SPANAY FALSE FALSE35 rattus 8 Ibayang NPANAY FALSE FALSE35 rattus 8 Tobias Fer SPANAY FALSE FALSE35 rattus 8 Caluya SPANAY FALSE FALSE35 rattus 8 Anini-Y SPANAY FALSE FALSE35 rattus 8 Tangalan NPANAY FALSE FALSE12 sponsalis 2 Anini-Y SPANAY FALSE FALSE12 sponsalis 2 Malay NPANAY FALSE FALSE12 sponsalis 2 Buruanga NPANAY FALSE FALSE12 sponsalis 2 Anini-Y SPANAY FALSE FALSE12 sponsalis 2 Guimaras I SPANAY FALSE FALSE12 sponsalis 2 Anini-Y SPANAY FALSE FALSE12 sponsalis 2 Santander NPANAY FALSE FALSE28 stramineus 5 Anini-Y SPANAY FALSE FALSE28 stramineus 5 Anini-Y SPANAY FALSE FALSE28 stramineus 5 Anini-Y SPANAY FALSE FALSE28 stramineus 5 Estancia SPANAY FALSE FALSE28 stramineus 5 na NPANAY FALSE FALSE47 striatus 1 Anini-Y SPANAY FALSE FALSE47 striatus 1 Tangalan NPANAY FALSE FALSE47 striatus 1 Pandan SPANAY FALSE FALSE47 striatus 1 Libertad SPANAY FALSE FALSE
216 crocatus 1 Bantayan CEBE FALSE FALSE Intertidal202 longurionis 1 Philippines NA FALSE FALSE203 pseudokimioi Philippines NA FALSE TRUE189 polongimarumai Philippines NA FALSE TRUE103 dondani Philippines NA TRUE FALSE206 otohimaea Philippines NA FALSE FALSE207 rolani Philippines NA FALSE TRUE208 sculpturatus Philippines NA TRUE TRUE210 blandifordianus Philippines NA FALSE TRUE211 cordigera Philippines SSIS FALSE TRUE mud209 zapatosensis Philippines MASBATE TRUE FALSE212 shikamai Philippines NA FALSE TRUE213 stupa Philippines NA FALSE TRUE 150-430m214 darkini Balut SAR FALSE TRUE 325 m mud215 axelrodi Coron CALAMIAN FALSE TRUE shallow water186 montillai 1 Coron CALAMIAN TRUE FALSE Shallow water
Page 14