bioinformatic analysis and identification of potential ... · bioinformatic analysis and...
TRANSCRIPT
Submitted 9 February 2018Accepted 6 April 2018Published 4 May 2018
Corresponding authorsYan Gong, [email protected] Wu, [email protected]
Academic editorLudmil Alexandrov
Additional Information andDeclarations can be found onpage 13
DOI 10.7717/peerj.4674
Copyright2018 Tang et al.
Distributed underCreative Commons CC-BY 4.0
OPEN ACCESS
Bioinformatic analysis and identificationof potential prognostic microRNAs andmRNAs in thyroid cancerJianing Tang1, Deguang Kong2, Qiuxia Cui1, Kun Wang3, Dan Zhang3,Qianqian Yuan1, Xing Liao1, Yan Gong4 and Gaosong Wu1
1Department of Thyroid and Breast Surgery, Zhongnan Hospital of Wuhan University, Wuhan, China2Department of General Surgery, Zhongnan Hospital of Wuhan University, Wuhan, China3Department of Thyroid and Breast Surgery, Tongji Hospital of Tongji Medical College, Huazhong Universityof Science and Technology, Wuhan, China
4Department of Biological Repositories, Zhongnan Hospital of Wuhan University, Wuhan, China
ABSTRACTThyroid cancer is one of themost common endocrinemalignancies. Multiple evidencesrevealed that a large number of microRNAs and mRNAs were abnormally expressedin thyroid cancer tissues. These microRNAs and mRNAs play important roles intumorigenesis. In the present study, we identified 72 microRNAs and 1,766 mRNAsdifferentially expressed between thyroid cancer tissues and normal thyroid tissuesand evaluated their prognostic values using Kaplan-Meier survival curves by log-rank test. Seven microRNAs (miR-146b, miR-184, miR-767, miR-6730, miR-6860,miR-196a-2 and miR-509-3) were associated with the overall survival. Among them,three microRNAs were linked with six differentially expressed mRNAs (miR-767 waspredicted to target COL10A1, PLAG1 and PPP1R1C; miR-146b was predicted to targetMMP16; miR-196a-2 was predicted to target SYT9). To identify the key genes in theprotein-protein interaction network , we screened out the top 10 hub genes (NPY,NMU, KNG1, LPAR5, CCR3, SST, PPY, GABBR2, ADCY8 and SAA1) with higherdegrees. Only LPAR5 was associated with the overall survival. Multivariate analysisdemonstrated that miR-184, miR-146b, miR-509-3 and LPAR5 were an independentrisk factors for prognosis. Our results of the present study identified a series ofprognostic microRNAs and mRNAs that have the potential to be the targets fortreatment of thyroid cancer.
Subjects BioinformaticsKeywords Meta-analysis, microRNA, Thyroid cancer, mRNA, LPAR5
INTRODUCTIONThyroid cancer is a common endocrine malignancy which has increased rapidly worldwidein the past decades. The analysis of the Surveillance, Epidemiology, and End Result cancerregistry data between 1975 and 2013 revealed that the incidence of thyroid cancer increasedby 211% (Lim et al., 2017). The improvements in diagnosis and treatment for thyroidcancer substantially improve prognosis (Grigsby et al., 2006; Lang, Wong & Wan, 2013).According to the histopathological features, thyroid cancer is classified into three majorcategories: well-differentiated thyroid cancer (WDTC) which includes papillary thyroid
How to cite this article Tang et al. (2018), Bioinformatic analysis and identification of potential prognostic microRNAs and mRNAs inthyroid cancer. PeerJ 6:e4674; DOI 10.7717/peerj.4674
cancer (PTC) and follicular thyroid cancer (FTC); poorly-differentiated thyroid cancer(PDTC) and anaplastic thyroid cancer (ATC) (Zarkesh et al., 2017). WhileWDTC accountsfor the majority part of all cases (Yu et al., 2013), and its mortality rates were controlledto less than 10% for 10 years, the mortality rates of PDTC and ATC were reported to be38–57% and close to 100% respectively (Smallridge et al., 2012; Xu & Ghossein, 2016).
It has been widely accepted that different expression levels of specific genes are associatedwith cancer initiation. During the past few years, molecular cytogenetics studies have beenused to investigate themolecular mechanisms of thyroid cancer. Multiple genes and cellularpathways were reported to participate in the occurrence and development of thyroid cancer.Alterations in the Ras-Raf-mitogen-activated protein kinase (MAPK) pathway are usuallyobserved in WDTC (Hou et al., 2007). BRAF mutations were found in 32.4% of PTC casesand RAS mutations in 20–50% of FTC and 13 % of PTC cases (Nikiforova et al., 2003;Sahpaz et al., 2015). In the ATC, BRAF and RAS alterations were detected in 29% and 23%cases (Xu & Ghossein, 2016). Telomerase reverse transcriptase (TERT) promoter mutationswere detected in 10% of PTC and related to clinically aggressive behaviors. In addition,mutations of both TERT promoter and BRAF/RAS have a tendency for co-occurrence(Landa et al., 2016; Song et al., 2016). TP53 mutation is considered to be a genetic eventdistinguishing WDTC from ATC. Several studies revealed that TP53 mutations weredetected in 59% of ATC cases, compared with in 10%WDTC cases (Kunstman et al., 2015;Sykorova et al., 2015).
With the development of high-throughput technologies, expression profiling of multiplegenes is a useful way to find different expression levels of specific genes between normaland tumor tissues. Altered expression levels usually indicate pathological conditions, andproteins coded by these differentially expressed genes may involve in different molecularpathways, biological process, and cellular behaviors during tumor progression. MicroRNAsare small noncoding RNAs which participate in the post-transcriptional regulation of geneexpression (Chen & Kang, 2015). They function as negative regulators by binding to the3′-untranslated region of candidate mRNAs, and repress the gene expression by inhibitingprotein translation or degrading mRNAs (Wang et al., 2010). Accumulating evidencedemonstrated that microRNAs could function as either oncogenes or tumor suppressorsin various types of malignancies and regulate different carcinogenic processes (Liang, Li& Wang, 2017). In previous bioinformatic studies, a number of microRNAs and mRNAswere identified as predictors for the prognosis of thyroid cancer (Table S1). Due to thesmall sample sizes and different detection platforms, some results were controversial.In the current study, we analyzed the public microRNA and mRNA sequencing datafrom The Cancer Genome Atlas Project (TCGA, https://cancergenome.nih.gov/) andidentified the differentially expressed microRNAs and mRNAs between thyroid cancertissues and matched normal thyroid tissues. We then investigated the prognostic value ofthese differentially expressed microRNAs. In addition, combined with microRNA-mRNAinteraction analysis, we analyzed the functions and pathways and constructed protein-protein interaction (PPI) network of differentially expressed mRNAs to investigate theunderlying mechanisms of thyroid cancer occurrence and development.
Tang et al. (2018), PeerJ, DOI 10.7717/peerj.4674 2/18
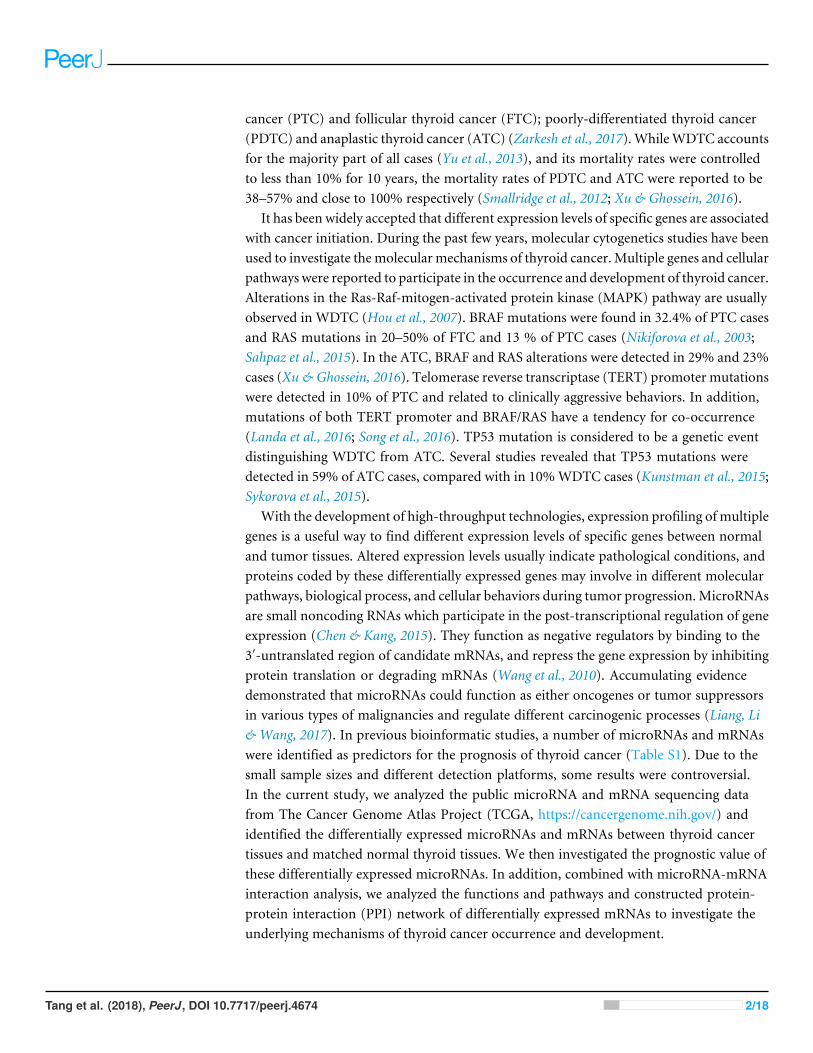
Figure 1 Workflow of the data selection.Full-size DOI: 10.7717/peerj.4674/fig-1
MATERIALS AND METHODSData processingWe obtained the clinical information of thyroid and RNA sequencing data from TCGAdatabase (https://cancergenome.nih.gov/). A workflow of the data selection was shownin Fig. 1. Using edgeR package in R language, we normalized the microRNA and mRNAsequencing data and screened out differentially expressedmicroRNAs andmRNAs betweenthyroid cancer and normal tissues (Robinson, McCarthy & Smyth, 2010). Cut-off criteria ofadjusted p-value< 0.01 and |log2 fold-change (FC)| > 2 were considered to be statisticallysignificant.
Clinical information of thyroid cancer patients included sex (female and male), ageat diagnosis (<45 or ≥45 years), race (White, Black, Asian and other), histological type(classical papillary thyroid cancer, follicular variant of papillary thyroid cancer, tall cellpapillary thyroid cancer and other) and tumor-node-metastasis (TNM) stage. UsingKaplan–Meier survival curves by log-rank test, we evaluated the prognostic value of eachdifferentially expressed microRNA with a threshold of p-value < 0.05. The microRNAssignificantly associated with the overall survival were considered as prognostic microRNAs.A Cox proportion hazards model was used to evaluate the relative risk of these prognosticmicroRNAs on OS. Hazard ratios (HR) with 95% confidence intervals were obtained, anyHR > 1.0 showed an increased risk of death. A P value < 0.05 was considered statisticallysignificant and all tests were two-sided.
Tang et al. (2018), PeerJ, DOI 10.7717/peerj.4674 3/18
Gene ontology and pathway enrichment analysis of differentiallyexpressed mRNAsDAVID (http://david.abcc.ncifcrf.gov/) is a database for annotation, visualization andintegrated discovery (Huang da, Sherman & Lempicki, 2009a; Huang da, Sherman &Lempicki, 2009b). Gene Ontology (GO) and KEGG pathway analysis of differentiallyexpressed mRNAs were carried out using DAVID (version 6.8) online tools: functionalannotation. The ontology contains three categories: biological process (BP), molecularfunction (MF) and cellular component (CC). Enriched GO terms and KEGG pathwayswere identified according to the cut-off criterion of P-value < 0.001.
Gene set enrichment analysisGene set enrichment analysis (GSEA) is a computational method that determines whetherthe members of a gene set S are randomly distributed throughout the entire reference genelist L or are found primarily at the top or bottom of L. We performed GSEA using the JavaGSEA implementation (supported by Java 8) to validate the enrichment analysis. Annotatedgene sets c2.cp.kegg.v6.1.symbols.gmt, c5.bp.v6.1.symbols.gmt, c5.cc.v6.1.symbols.gmt,c5.mf.v6.1.0:0symbols.gmt (Version 6.1 of theMolecular Signatures Database) were chosenas the reference gene sets. FDR < 0.05 was set as the cut-off criteria.
Construction of protein-protein interaction networkIn order to investigate the interactive relationships among the differentially expressedmRNAs, we constructed the physical protein-protein interactions of these genesusing STRING database (version 10.5) (Szklarczyk et al., 2017). PPIs of differentiallyexpressed mRNAs were selected with confidence score >0.7. Cytoscape software(http://www.cytoscape.org/) was used to visualize and analyze the PPI network. Accordingto the degree of importance, significant modules of PPI network were screened out usingMolecular Complex Detection (MCODE) with the degree cutoff = 2, node score cutoff =0.2, k-core = 2 and max depth = 100. CytoHubba was then applied to identify the hubproteins in the PPI network which was widely used explore important nodes in biologicalnetworks (Chin et al., 2014). Kaplan–Meier survival curves by log-rank test was used toevaluate the prognostic value of each hub gene, a p-value < 0.05 was set as the cut-ofcriterion.
The target genes of prognostic microRNAsThe target genes of prognostic microRNAs were predicted using miRTarBase (version6.0) (http://mirtarbase.mbc.nctu.edu.tw/php/index.php), miRDB (version 5.0) (http://www.mirdb.org/miRDB/) and TargetScan (version 7.1) (http://www.targetscan.org/)databases. The overlapping target genes were identified to further enhance the reliability ofbioinformatics analysis. The overlapping target genes with differentially expressed mRNAswere then compared, and the microRNA-mRNA network was visualized by cytoscapesoftware.
Tang et al. (2018), PeerJ, DOI 10.7717/peerj.4674 4/18
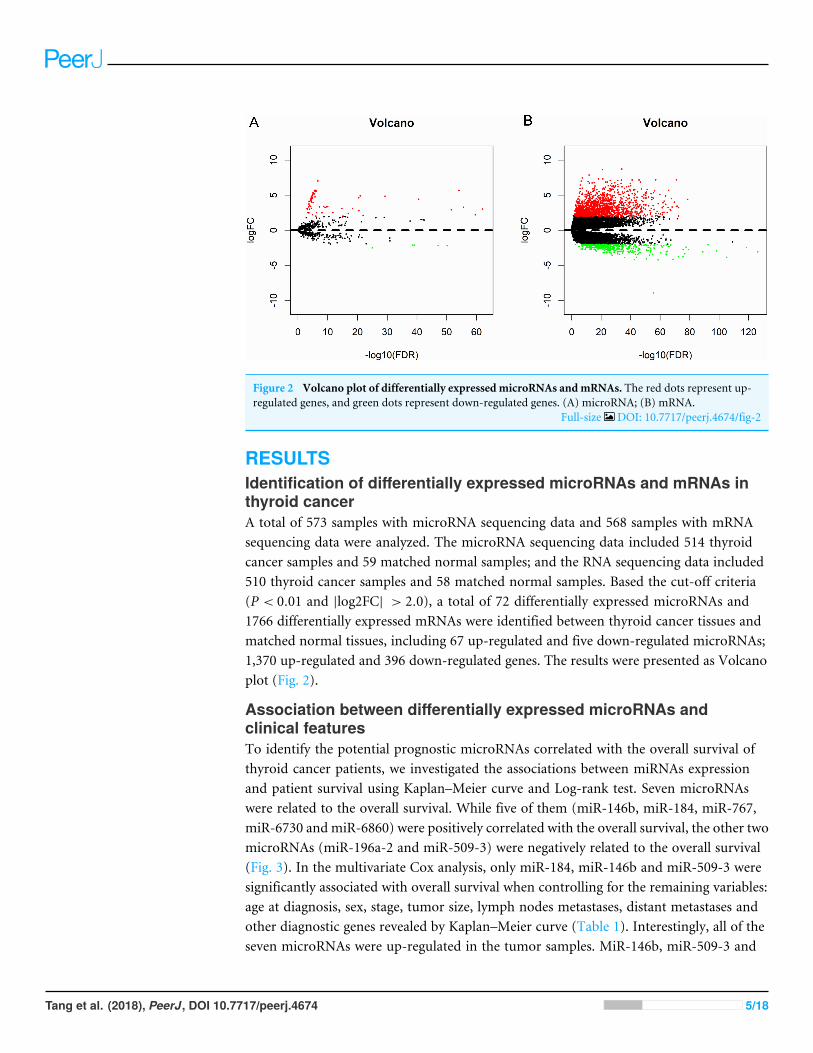
Figure 2 Volcano plot of differentially expressed microRNAs andmRNAs. The red dots represent up-regulated genes, and green dots represent down-regulated genes. (A) microRNA; (B) mRNA.
Full-size DOI: 10.7717/peerj.4674/fig-2
RESULTSIdentification of differentially expressed microRNAs and mRNAs inthyroid cancerA total of 573 samples with microRNA sequencing data and 568 samples with mRNAsequencing data were analyzed. The microRNA sequencing data included 514 thyroidcancer samples and 59 matched normal samples; and the RNA sequencing data included510 thyroid cancer samples and 58 matched normal samples. Based the cut-off criteria(P < 0.01 and |log2FC| > 2.0), a total of 72 differentially expressed microRNAs and1766 differentially expressed mRNAs were identified between thyroid cancer tissues andmatched normal tissues, including 67 up-regulated and five down-regulated microRNAs;1,370 up-regulated and 396 down-regulated genes. The results were presented as Volcanoplot (Fig. 2).
Association between differentially expressed microRNAs andclinical featuresTo identify the potential prognostic microRNAs correlated with the overall survival ofthyroid cancer patients, we investigated the associations between miRNAs expressionand patient survival using Kaplan–Meier curve and Log-rank test. Seven microRNAswere related to the overall survival. While five of them (miR-146b, miR-184, miR-767,miR-6730 and miR-6860) were positively correlated with the overall survival, the other twomicroRNAs (miR-196a-2 and miR-509-3) were negatively related to the overall survival(Fig. 3). In the multivariate Cox analysis, only miR-184, miR-146b and miR-509-3 weresignificantly associated with overall survival when controlling for the remaining variables:age at diagnosis, sex, stage, tumor size, lymph nodes metastases, distant metastases andother diagnostic genes revealed by Kaplan–Meier curve (Table 1). Interestingly, all of theseven microRNAs were up-regulated in the tumor samples. MiR-146b, miR-509-3 and
Tang et al. (2018), PeerJ, DOI 10.7717/peerj.4674 5/18
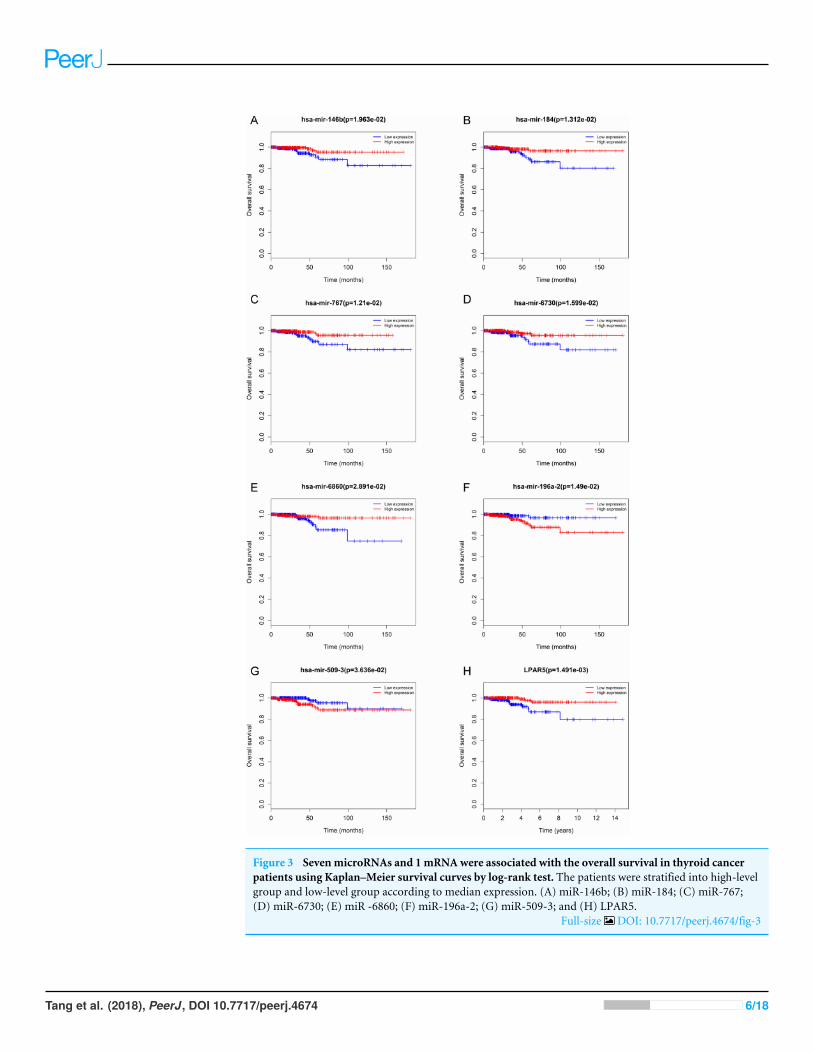
Figure 3 SevenmicroRNAs and 1mRNAwere associated with the overall survival in thyroid cancerpatients using Kaplan–Meier survival curves by log-rank test. The patients were stratified into high-levelgroup and low-level group according to median expression. (A) miR-146b; (B) miR-184; (C) miR-767;(D) miR-6730; (E) miR -6860; (F) miR-196a-2; (G) miR-509-3; and (H) LPAR5.
Full-size DOI: 10.7717/peerj.4674/fig-3
Tang et al. (2018), PeerJ, DOI 10.7717/peerj.4674 6/18
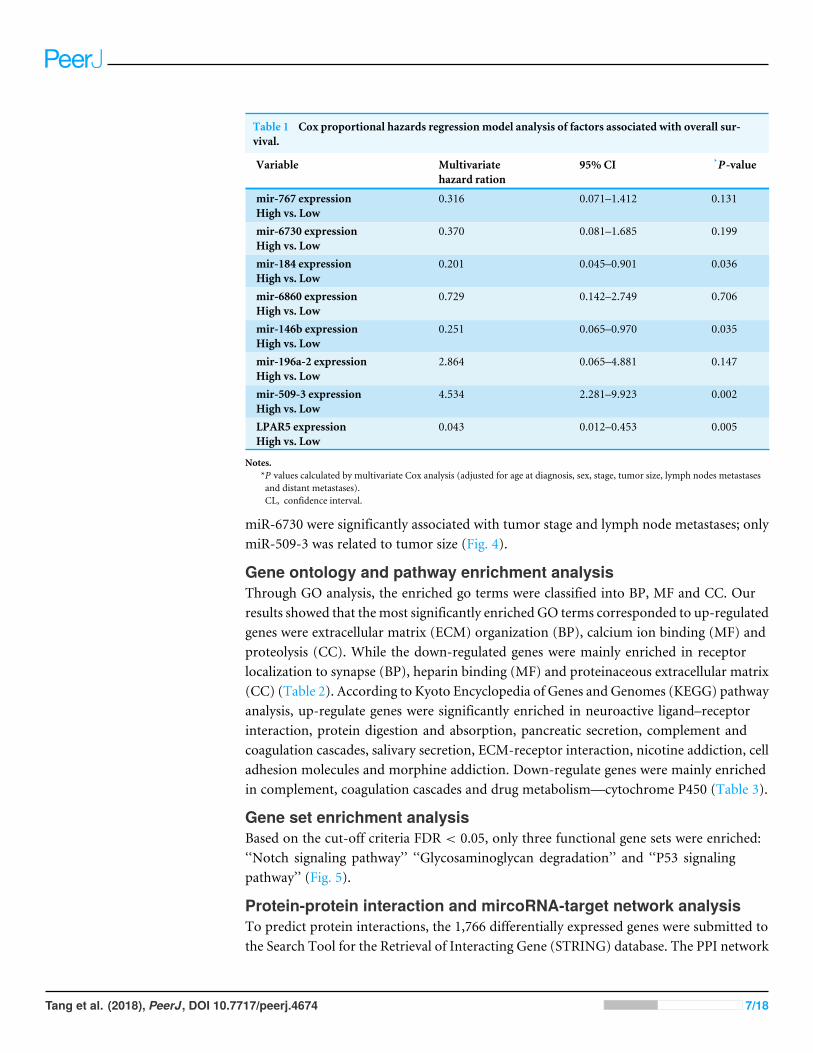
Table 1 Cox proportional hazards regressionmodel analysis of factors associated with overall sur-vival.
Variable Multivariatehazard ration
95%CI *P-value
mir-767 expressionHigh vs. Low
0.316 0.071–1.412 0.131
mir-6730 expressionHigh vs. Low
0.370 0.081–1.685 0.199
mir-184 expressionHigh vs. Low
0.201 0.045–0.901 0.036
mir-6860 expressionHigh vs. Low
0.729 0.142–2.749 0.706
mir-146b expressionHigh vs. Low
0.251 0.065–0.970 0.035
mir-196a-2 expressionHigh vs. Low
2.864 0.065–4.881 0.147
mir-509-3 expressionHigh vs. Low
4.534 2.281–9.923 0.002
LPAR5 expressionHigh vs. Low
0.043 0.012–0.453 0.005
Notes.*P values calculated by multivariate Cox analysis (adjusted for age at diagnosis, sex, stage, tumor size, lymph nodes metastasesand distant metastases).CL, confidence interval.
miR-6730 were significantly associated with tumor stage and lymph node metastases; onlymiR-509-3 was related to tumor size (Fig. 4).
Gene ontology and pathway enrichment analysisThrough GO analysis, the enriched go terms were classified into BP, MF and CC. Ourresults showed that themost significantly enriched GO terms corresponded to up-regulatedgenes were extracellular matrix (ECM) organization (BP), calcium ion binding (MF) andproteolysis (CC). While the down-regulated genes were mainly enriched in receptorlocalization to synapse (BP), heparin binding (MF) and proteinaceous extracellular matrix(CC) (Table 2). According to Kyoto Encyclopedia of Genes and Genomes (KEGG) pathwayanalysis, up-regulate genes were significantly enriched in neuroactive ligand–receptorinteraction, protein digestion and absorption, pancreatic secretion, complement andcoagulation cascades, salivary secretion, ECM-receptor interaction, nicotine addiction, celladhesion molecules and morphine addiction. Down-regulate genes were mainly enrichedin complement, coagulation cascades and drug metabolism—cytochrome P450 (Table 3).
Gene set enrichment analysisBased on the cut-off criteria FDR < 0.05, only three functional gene sets were enriched:‘‘Notch signaling pathway’’ ‘‘Glycosaminoglycan degradation’’ and ‘‘P53 signalingpathway’’ (Fig. 5).
Protein-protein interaction and mircoRNA-target network analysisTo predict protein interactions, the 1,766 differentially expressed genes were submitted tothe Search Tool for the Retrieval of Interacting Gene (STRING) database. The PPI network
Tang et al. (2018), PeerJ, DOI 10.7717/peerj.4674 7/18
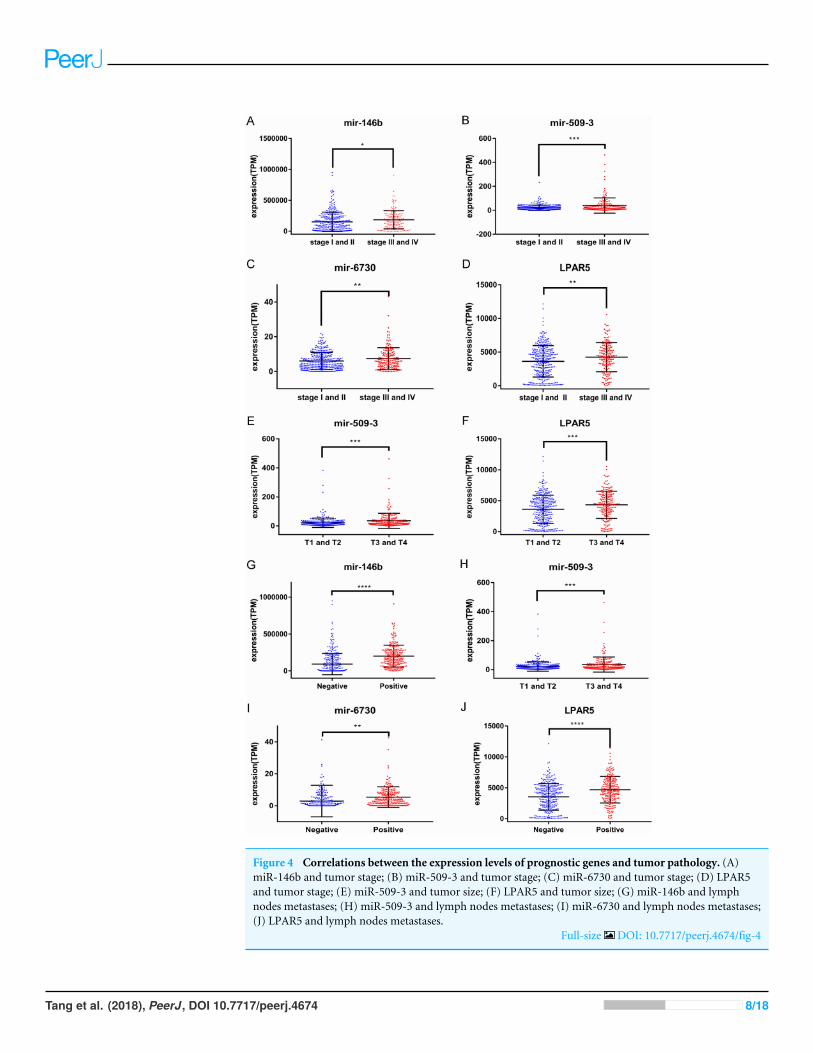
Figure 4 Correlations between the expression levels of prognostic genes and tumor pathology. (A)miR-146b and tumor stage; (B) miR-509-3 and tumor stage; (C) miR-6730 and tumor stage; (D) LPAR5and tumor stage; (E) miR-509-3 and tumor size; (F) LPAR5 and tumor size; (G) miR-146b and lymphnodes metastases; (H) miR-509-3 and lymph nodes metastases; (I) miR-6730 and lymph nodes metastases;(J) LPAR5 and lymph nodes metastases.
Full-size DOI: 10.7717/peerj.4674/fig-4
Tang et al. (2018), PeerJ, DOI 10.7717/peerj.4674 8/18

Table 2 The top 5 enriched gene ontology terms of differentially expressed genes.
Expression Category Term Gene count Adjust P value
;Up-regulated GOTERM_BP GO:0030198∼extracellular matrix organization 38 1.01E−13; GOTERM_BP GO:0030574∼collagen catabolic process 20 2.87E−11; GOTERM_BP GO:0008544∼epidermis development 22 1.23E−10; GOTERM_BP GO:0007155∼cell adhesion 52 2.77E−09; GOTERM_BP GO:0006508∼proteolysis 54 6.99E−09; GOTERM_MF GO:0005509∼calcium ion binding 75 9.53E−12; GOTERM_MF GO:0004252∼serine-type endopeptidase activity 38 2.02E−10; GOTERM_MF GO:0005198∼structural molecule activity 34 1.58E−08; GOTERM_MF GO:0008201∼heparin binding 26 4.01E−08; GOTERM_MF GO:0004869∼cysteine-type endopeptidase inhibitor activity 12 1.39E−07
; GOTERM_CC GO:0006508∼proteolysis 209 5.72E−46; GOTERM_CC GO:0005615∼extracellular space 170 4.03E−35; GOTERM_CC GO:0005578∼proteinaceous extracellular matrix 44 5.86E−13; GOTERM_CC GO:0005887∼integral component of plasma membrane 117 3.75E−10; GOTERM_CC GO:0031012∼extracellular matrix 36 2.73E−07;Down-regulated GOTERM_BP GO:0097120∼receptor localization to synapse 4 1.02E−04; GOTERM_BP GO:0035418∼protein localization to synapse 4 3.36E−04; GOTERM_BP GO:0097114∼NMDA glutamate receptor clustering 3 0.001; GOTERM_BP GO:0023041∼neuronal signal transduction 3 0.002; GOTERM_BP GO:0097119∼postsynaptic density protein 95 clustering 3 0.002; GOTERM_MF GO:0008201∼heparin binding 7 0.006; GOTERM_MF GO:0005509∼calcium ion binding 16 0.007; GOTERM_CC GO:0005578∼proteinaceous extracellular matrix 14 7.32E−06; GOTERM_CC GO:0005615∼extracellular space 34 7.77E−06; GOTERM_CC GO:0005576∼extracellular region 37 2.11E−06; GOTERM_CC GO:0030141∼secretory granule 6 0.001; GOTERM_CC GO:0043025∼neuronal cell body 11 0.002
Notes.BP, biological process; MF, molecular function; CC, cellular component.P value< 0.01 was considered as threshold values of significant difference.
consisted of 483 nodes and 1,437 edges. The target genes of prognostic microRNAs werecompared with these differentially expressed genes, and six target genes regulated by threemicroRNAs were identified in the network (miR-767 was predicted to target COL10A1,PLAG1 and PPP1R1C; miR-146b was predicted to target MMP16; miR-196a-2 waspredicted to target SYT9) (Fig. S1). Moreover, the network complex was further analyzed,and the most significant module was screened out using MCODE, which contained 26nodes and 325 edges (Fig. 6). Then we performed KEGG pathway analysis of these 26 genes,our results demonstrated that they were mainly involved in neuroactive ligand–receptorinteraction, chemokine signaling pathway and cAMP signaling pathway. We screened outthe top 10 hub nodes with higher degrees using the plug-in CytoHubba in Cytoscape.These hub genes included neuropeptide Y (NPY), neuromedin U (NMU), kininogen 1(KNG1), lysophosphatidic acid receptor 5 (LPAR5), C–C motif chemokine receptor 3
Tang et al. (2018), PeerJ, DOI 10.7717/peerj.4674 9/18

Figure 5 Gene set enrichment analysis. (A) Glycosaminoglycan degradation pathway. (B) Notch signaling pathway. (C) P53 signaling pathyway.Full-size DOI: 10.7717/peerj.4674/fig-5
Table 3 KEGG pathway analysis of differentially expressed genes.
Expression Pathway Gene count Adjust P value
;Up-regulated hsa04080: Neuroactive ligand–receptor interaction 33 7.78E−07; hsa04974: Protein digestion and absorption 15 3.53E−05; hsa04972: Pancreatic secretion 15 6.62E−05; hsa04610: Complement and coagulation cascades 11 9.91E−04; hsa04970: Salivary secretion 12 0.002; hsa04512: ECM-receptor interaction 12 0.002; hsa05033: Nicotine addiction 8 0.002; hsa04514: Cell adhesion molecules (CAMs) 15 0.005; hsa05032: Morphine addiction 11 0.008;Down-regulated hsa04610: Complement and coagulation cascades 6 8.62E−04; hsa00982: Drug metabolism—cytochrome P450 5 0.006
Notes.P value< 0.01 was considered as threshold values of significant difference.
(CCR3), somatostatin (SST), pancreatic polypeptide (PPY), gamma-aminobutyric acidtype B receptor subunit 2 (GABBR2), adenylate cyclase 8 (ADCY8) and serum amyloidA1 (SAA1). Survival analysis of the 10 hub genes demonstrated that only LPAR5 wassignificantly correlated with the overall survival (Fig. 3H). Multivariate Cox analysisdemonstrated that LPAR5 was an independent risk factors for overall survival (Table 1).And the expression of LPAR5 was associated with tumor stage, size and lymph nodemetastases (Fig. 4).
Validation using GEO databaseTo validate the results, we screened out the differentially expressed genes using GSE3467and GSE73182. GSE3467 was an expression microarray dataset and GSE73182 was amiRNA expression microarray dataset. Based on the same cut-off criteria, 130 differentially
Tang et al. (2018), PeerJ, DOI 10.7717/peerj.4674 10/18

Figure 6 The significant module consists of 26 nodes and 325 edges. The red nodes represent up-regulated genes, and blue nodes represent down-regulated genes.
Full-size DOI: 10.7717/peerj.4674/fig-6
expressed mRNAs and five differentially expressed miRNAs were identified. Theoverlapping genes (95 mRNAs and four miRNAs) were shown in Fig. S2.
DISCUSSIONAs one of the most common endocrine malignancies, it is important to investigate themolecularmechanisms of thyroid cancer occurrence and development. In the current study,we investigated potential microRNAs and mRNAs correlated with thyroid tumorigenesisusing bioinformatics analysis. A total of 72 differentially expressed microRNAs and 1,766differentially expressed genes were identified from TCGA database, including 67 up-regulated and five down-regulated microRNAs;1370 up-regulated and 396 down-regulatedgenes. MiR-146b, miR-184, miR-767, miR-6730, miR-6860, miR-196a-2, miR-509-3and LPAR5 were correlated with the overall survival of thyroid cancer patients. GSEAanalysis demonstrated that the gene sets ‘‘Notch signaling pathway’’ ‘‘Glycosaminoglycandegradation’’ and ‘‘P53 signaling pathway’’ were significantly enriched in thyroid cancersamples.
In the last decade, microRNAs have been revealed to modulate multiple processesof cancer development, including cancer cell proliferation, differentiation, apoptosis,migration and invasion. However, the studies of microRNAs’ effects on cancer prognosis
Tang et al. (2018), PeerJ, DOI 10.7717/peerj.4674 11/18
was limited due to the small sample size, different detection platforms and the lackof long-term follow-up. To investigate the potential prognostic microRNAs of thyroidcancer, we analyzed the high-throughput data from TCGA database and identified sevenprognostic microRNAs associated with the clinical outcome of thyroid cancer patients.Geraldo et al. stated that miR-146b-5p was highly expressed in papillary thyroid cancer andconsidered as a relevant diagnostic marker for this type of thyroid cancer. MiR-146b-5pwas reported to promote the migration and invasion of papillary thyroid cancer cellsvia downregulating ZNRF3 and upregulating Wnt/catenin signaling pathway, and topromote thyroid follicular cell growth via downregulating TGF- β pathway by binding tothe 3′-untranslated region of SMAD4 (Chou, Liu & Kang, 2017; Deng et al., 2015; Geraldo,Yamashita & Kimura, 2012). Inversely, the expression levels of miR-146b was positivelyrelated to the overall survival of patients with thyroid cancer. The expression levels ofmiR-509-3 were lower in multiple cancers, and miR-509-3-5P downregulation promotedthe migration and invasion of gastric cancer cells by targeting PODXL. Overexpression ofmiR-509-5p markedly inhibited the proliferation, migration and invasion of non-smalllung cancer cells via targeting YWHAG (Peng, Yu & Fu, 2016; Zhang et al., 2017). WhilemiR-509-3 was overexpressed in thyroid cancer and negatively related to the overallsurvival, miR-184 was considered as a potential oncogenic microRNA of squamous cellcarcinoma via promoting cancer cell proliferation. Inversely, miR-184 was down-regulatedin aggressive human glioma and breast cancer cells, and inhibited cancer cell proliferationand invasion (Emdad et al., 2015; Feng & Dong, 2015). In the present study, miR-184 waspositively related to the overall survival of patients with thyroid cancer. MiR-767 wasreported to represses TET1/3 (two tumor suppressor genes) and identified as a hallmark ofcancer (Loriot et al., 2014). The molecular mechanisms are still to be investigated. Previousstudies have identified a number of miRNAs involved in thyroid carcinogenesis (Table S2).MiR-146b, miR-221 and miR-222 were the most three frequent miRNAs reported inthyroid cancer, they appeared to associated with high-risk features such as extrathyroidalextension, lymph node metastasis, distant metastasis and BRAFV600E mutation. While inour present study, the results were partly different from the previous: miR-221, miR-222and some other miRNAs were not identified. This might because of the following reasons:different study types (RT-PCR, array, high throughput sequencing), different platforms,different ways for normalization, different ways for DEG screening, and the cut-off criteria(in our study P < 0.01 and |log2FC| > 2.0). In our validation datasets GSE3467 andGSE73182, 130 differentially expressed mRNAs and five differentially expressed miRNAswere identified, among them, 95 differentially expressed mRNAs and 4 differentiallyexpressed miRNAs were overlapping with TCGA dataset.
Through integrated bioinformatics analysis, we identified the most significant modulewhich contained 26 nodes and 325 edges, and these genes were mainly enriched inneuroactive ligand–receptor interaction, chemokine signaling pathway and cAMP signalingpathway. The top 10 hub genes with higher degrees wereNPY,NMU,KNG1, LPAR5, CCR3,SST, PPY, GABBR2, ADCY8 and SAA1. NPY encodes a neuropeptide which influencesmultiple physiological processes through G protein-coupled receptors (GPCRs) andMAPK. NPY was reported to promote inflammation-induced tumorigenesis via PI3-K/Akt
Tang et al. (2018), PeerJ, DOI 10.7717/peerj.4674 12/18
pathway and miR-375-dependent apoptosis (Jeppsson, Srinivasan & Chandrasekharan,2016). NMU was associated with increased breast cancer aggression (Martinez et al.,2017) and its overexpression induced regional metastasis of head and neck squamouscell carcinoma (Wang et al., 2016). KNG1 was identified as a potential marker of earlycolorectal cancer stages (Quesadacalvo et al., 2017). LPAR5 is a member of the rhodopsinclass GPCRs. In our study, it was positively corrected with the overall survival of thyroidcancer patients. LPAR5 was down-regulated in primary undifferentiated nasopharyngealcarcinoma and promoted the LPA-induced migration of nasopharyngeal carcinoma celllines (Yap et al., 2015). Additionally, LPAR5 negatively regulated cell motile and invasiveactivities of human sarcoma cell lines (Dong et al., 2014). CCR3 belongs to family 1of the GPCRs, which enhance cellular proliferation, invasion, and migration throughERK and JNK signaling pathway (Dong et al., 2014). CCRs was reported to correlatedwith improved distant relapse-free survival in breast cancer (Gong et al., 2016). SST isa neuropeptide which affects neurotransmission, secretion and cell proliferation. Thereceptor of SST was reported to be a predictor of better response to therapy in medullarythyroid carcinoma (Kendler et al., 2017). In radiation-induced papillary thyroid cancerfrom chernobyl pediatric patients, GABBR2 was highly expressed (Stein et al., 2010), andrelated to tumor occurrence. ADCY8 is a membrane bound enzyme which is differentiallyexpressed in endometrial cancer (Orchel et al., 2012). SAA1 is highly expressed in responseto tissue injury and inflammation, and its highly expression is associated with chronicinflammation, lipid metabolism and tumor pathogenesis (Sun & Ye, 2016). SAA1 has beenused as a non-invasive biomarker for the prognosis of many cancers, including stomach,breast, liver and lung neoplasms (Knebel et al., 2017; Upur et al., 2015).
CONCLUSIONIn conclusion, our study identified the crucial microRNAs and mRNAs in thyroid cancer,and constructed the regulatory network between microRNAs and mRNAs throughbioinformatics analysis. A total of 72 differentially expressed microRNAs and 1,766differentially expressed genes were screened out. Among them, seven microRNAs werecorrelated with the overall survival. Among the hub genes identified from PPI network,LPAR5 may play important roles in thyroid cancer. Multivariate analysis demonstratedthat miR-184, miR-146b, miR-509-3 and LPAR5 were an independent risk factors forprognosis, and they have the potential to be the targets for treatment of thyroid cancer.However, further experimental research is still required to confirm the functions ofidentified genes.
ADDITIONAL INFORMATION AND DECLARATIONS
FundingThe authors received no funding for this work.
Competing InterestsThe authors declare there are no competing interests.
Tang et al. (2018), PeerJ, DOI 10.7717/peerj.4674 13/18
Author Contributions• Jianing Tang conceived and designed the experiments, performed the experiments,analyzed the data, prepared figures and/or tables, authored or reviewed drafts of thepaper, approved the final draft.• Deguang Kong, Qiuxia Cui, Dan Zhang and Xing Liao performed the experiments,analyzed the data, prepared figures and/or tables, authored or reviewed drafts of thepaper, approved the final draft.• Kun Wang and Qianqian Yuan performed the experiments, analyzed the data,contributed reagents/materials/analysis tools, prepared figures and/or tables, authoredor reviewed drafts of the paper, approved the final draft.• Yan Gong conceived and designed the experiments, authored or reviewed drafts of thepaper, approved the final draft.• Gaosong Wu conceived and designed the experiments, prepared figures and/or tables,authored or reviewed drafts of the paper, approved the final draft.
Data AvailabilityThe following information was supplied regarding data availability:
The raw data are provided as Supplemental Files.
Supplemental InformationSupplemental information for this article can be found online at http://dx.doi.org/10.7717/peerj.4674#supplemental-information.
REFERENCESChen L, Kang C. 2015.miRNA interventions serve as ‘magic bullets’ in the reversal of
glioblastoma hallmarks. Oncotarget 6:38628–38642 DOI 10.18632/oncotarget.5926.Chin CH, Chen SH,WuHH, Ho CW, KoMT, Lin CY. 2014. cytoHubba: identifying hub
objects and sub-networks from complex interactome. BMC Systems Biology 8(Suppl4):S11 DOI 10.1186/1752-0509-8-s4-s11.
Chou CK, Liu RT, Kang HY. 2017.MicroRNA-146b: a novel biomarker and therapeutictarget for human papillary thyroid cancer. International Journal of Molecular Sciences18:636 DOI 10.3390/ijms18030636.
Deng X,Wu B, Xiao K, Kang J, Xie J, Zhang X, Fan Y. 2015.MiR-146b-5p pro-motes metastasis and induces epithelial-mesenchymal transition in thyroidcancer by targeting ZNRF3. Cellular Physiology and Biochemistry 35:71–82DOI 10.1159/000369676.
Dong Y, HiraneM, Araki M, Fukushima N, Honoki K, Tsujiuchi T. 2014. Lysophos-phatidic acid receptor-5 negatively regulates cell motile and invasive activities ofhuman sarcoma cell lines.Molecular & Cellular Biochemistry 393(1–2):17–22DOI 10.1007/s11010-014-2042-2.
Emdad L, Janjic A, Alzubi MA, Hu B, Santhekadur PK, Menezes ME, Shen XN, DasSK, Sarkar D, Fisher PB. 2015. Suppression of miR-184 in malignant gliomas
Tang et al. (2018), PeerJ, DOI 10.7717/peerj.4674 14/18
upregulates SND1 and promotes tumor aggressiveness. Neuro Oncology 17:419–429DOI 10.1093/neuonc/nou220.
Feng R, Dong L. 2015. Inhibitory effect of miR-184 on the potential of proliferation andinvasion in human glioma and breast cancer cells in vitro. International Journal ofClinical & Experimental Pathology 8:9376–9382.
GeraldoMV, Yamashita AS, Kimura ET. 2012.MicroRNA miR-146b-5p regulatessignal transduction of TGF-beta by repressing SMAD4 in thyroid cancer. Oncogene31:1910–1922 DOI 10.1038/onc.2011.381.
Gong DH, Lei F, Chen HY, Ding KF, Yu KD. 2016. Intratumoral expression of CCR3in breast cancer is associated with improved relapse-free survival in luminal-likedisease. Oncotarget 7:28570–28578.
Grigsby PW, Reddy RM,Moley JF, Hall BL. 2006. Contralateral papillary thyroidcancer at completion thyroidectomy has no impact on recurrence or survival afterradioiodine treatment. Surgery 140:1043–1047 DOI 10.1016/j.surg.2006.08.007.
Hou P, Liu D, Shan Y, Hu S, Studeman K, Condouris S, Wang Y, Trink A, El-NaggarAK, Tallini G, Vasko V, XingM. 2007. Genetic alterations and their relationshipin the phosphatidylinositol 3-kinase/Akt pathway in thyroid cancer. Clinical CancerResearch 13:1161–1170 DOI 10.1158/1078-0432.CCR-06-1125.
Huang daW, Sherman BT, Lempicki RA. 2009a. Bioinformatics enrichment tools:paths toward the comprehensive functional analysis of large gene lists. Nucleic AcidsResearch 37:1–13 DOI 10.1093/nar/gkn923.
Huang daW, Sherman BT, Lempicki RA. 2009b. Systematic and integrative analysis oflarge gene lists using DAVID bioinformatics resources. Nature Protocols 4:44–57DOI 10.1038/nprot.2008.211.
Jeppsson S, Srinivasan S, Chandrasekharan B. 2016. Neuropeptide Y (NPY) pro-motes inflammation-induced tumorigenesis by enhancing epithelial cell pro-liferation. American Journal of Physiology Gastrointestinal & Liver Physiology312(2):G103–G111 DOI 10.1152/ajpgi.00410.2015.
Kendler DB, Araújo JM, Alencar R, DeMSA, Bulzico DA, De CNP, Accioly FA, De TF,Lopes F, Corbo R. 2017. Somatostatin receptor subtype 1 might be a predictor ofbetter response to therapy in medullary thyroid carcinoma. Endocrine 1–7.
Knebel FH, UnoM, Galatro TF, Bellé LP, Obashinjo SM,Marie SK, Campa A. 2017.Serum amyloid A1 is upregulated in human glioblastoma. Journal of Neuro-Oncology58:1–9.
Kunstman JW, Juhlin CC, Goh G, Brown TC, Stenman A, Healy JM, Rubinstein JC,Choi M, Kiss N, Nelson-Williams C, Mane S, RimmDL, PrasadML, Hoog A,Zedenius J, Larsson C, Korah R, Lifton RP, Carling T. 2015. Characterization ofthe mutational landscape of anaplastic thyroid cancer via whole-exome sequencing.Human Molecular Genetics 24:2318–2329 DOI 10.1093/hmg/ddu749.
Landa I, Ibrahimpasic T, Boucai L, Sinha R, Knauf JA, Shah RH, Dogan S, Ricarte-Filho JC, Krishnamoorthy GP, Xu B, Schultz N, Berger MF, Sander C, Taylor BS,Ghossein R, Ganly I, Fagin JA. 2016. Genomic and transcriptomic hallmarks of
Tang et al. (2018), PeerJ, DOI 10.7717/peerj.4674 15/18
poorly differentiated and anaplastic thyroid cancers. Journal of Clinical Investigation126:1052–1066 DOI 10.1172/JCI85271.
Lang BH,Wong KP,Wan KY. 2013. Postablation stimulated thyroglobulin level is animportant predictor of biochemical complete remission after reoperative cervicalneck dissection in persistent/recurrent papillary thyroid carcinoma. Annals ofSurgical Oncology 20:653–659 DOI 10.1245/s10434-012-2624-8.
Liang B, Li Y, Wang T. 2017. A three miRNAs signature predicts survival in cervicalcancer using bioinformatics analysis. Scientific Reports 7:5624DOI 10.1038/s41598-017-06032-2.
LimH, Devesa SS, Sosa JA, Check D, Kitahara CM. 2017. Trends in thyroid cancerincidence and mortality in the United States, 1974–2013. Journal of the AmericanMedical Association 317:1338–1348 DOI 10.1001/jama.2017.2719.
Loriot A, Tongelen AV, Blanco J, Klaessens S, Cannuyer J, Baren NV, DecottigniesA, Smet CD. 2014. A novel cancer-germline transcript carrying pro-metastaticmiR-105 and TET-targeting miR-767 induced by DNA hypomethylation intumors. Epigenetics Official Journal of the Dna Methylation Society 9:1163–1171DOI 10.4161/epi.29628.
Martinez VG, Crown J, Porter RK, O’Driscoll L. 2017. Neuromedin U alters bioener-getics and expands the cancer stem cell phenotype in HER2-positive breast cancer.International Journal of Cancer 140:2771–2784 DOI 10.1002/ijc.30705.
NikiforovaMN, Lynch RA, Biddinger PW, Alexander EK, Dorn 2nd GW, Tallini G,Kroll TG, Nikiforov YE. 2003. RAS point mutations and PAX8-PPAR gammarearrangement in thyroid tumors: evidence for distinct molecular pathways inthyroid follicular carcinoma. Journal of Clinical Endocrinology and Metabolism88:2318–2326 DOI 10.1210/jc.2002-021907.
Orchel J, Witek L, KimsaM, Strzalka-Mrozik B, KimsaM, Olejek A, Mazurek U. 2012.Expression patterns of kinin-dependent genes in endometrial cancer. InternationalJournal of Gynecological Cancer 22:937–944 DOI 10.1097/IGC.0b013e318259d8da.
PengW, Yu D, Fu XN. 2016.MiR-509-5p suppresses the proliferation, migration,and invasion of non-small cell lung cancer by targeting YWHAG. Biochemical &Biophysical Research Communications 482:935–941.
Quesadacalvo F, Massot C, Bertrand V, Longuespée R, Blétard N, Somja J, Mazzuc-chelli G, Smargiasso N, Baiwir D, Pauwgillet MC. 2017. OLFM4, KNG1 and Sec24Cidentified by proteomics and immunohistochemistry as potential markers of earlycolorectal cancer stages. Clinical Proteomics 14:9 DOI 10.1186/s12014-017-9143-3.
RobinsonMD,McCarthy DJ, Smyth GK. 2010. edgeR: a bioconductor package fordifferential expression analysis of digital gene expression data. Bioinformatics26:139–140 DOI 10.1093/bioinformatics/btp616.
Sahpaz A, Onal B, Yesilyurt A, Han U, Delibasi T. 2015. BRAF(V600E) Mutation,RET/PTC1 and PAX8-PPAR gamma rearrangements in follicular epithelium derivedthyroid lesions—institutional experience and literature review. Balkan MedicalJournal 32:156–166 DOI 10.5152/balkanmedj.2015.15101.
Tang et al. (2018), PeerJ, DOI 10.7717/peerj.4674 16/18

Smallridge RC, Ain KB, Asa SL, Bible KC, Brierley JD, Burman KD, Kebebew E, LeeNY, Nikiforov YE, Rosenthal MS, ShahMH, Shaha AR, Tuttle RM. 2012. Americanthyroid association guidelines for management of patients with anaplastic thyroidcancer. Thyroid 22:1104–1139 DOI 10.1089/thy.2012.0302.
Song YS, Lim JA, Choi H,Won JK, Moon JH, Cho SW, Lee KE, Park YJ, Yi KH, ParkDJ, Seo JS. 2016. Prognostic effects of TERT promoter mutations are enhancedby coexistence with BRAF or RAS mutations and strengthen the risk prediction bythe ATA or TNM staging system in differentiated thyroid cancer patients. Cancer122:1370–1379 DOI 10.1002/cncr.29934.
Stein L, Rothschild J, Luce J, Cowell JK, Thomas G, Bogdanova TI, TronkoMD,Hawthorn L. 2010. Copy number and gene expression alterations in radiation-induced papillary thyroid carcinoma from chernobyl pediatric patients. Thyroid20(5):475–487 DOI 10.1089/thy.2009.0008.
Sun L, Ye RD. 2016. Serum amyloid A1: structure, function and gene polymorphism.Gene 583:48–57 DOI 10.1016/j.gene.2016.02.044.
Sykorova V, Dvorakova S, Vcelak J, Vaclavikova E, Halkova T, Kodetova D, LastuvkaP, Betka J, Vlcek P, RebounM, Katra R, Bendlova B. 2015. Search for new geneticbiomarkers in poorly differentiated and anaplastic thyroid carcinomas using nextgeneration sequencing. Anticancer Research 35(4):2029–2036.
Szklarczyk D, Morris JH, Cook H, KuhnM,Wyder S, Simonovic M, Santos A,Doncheva NT, Roth A, Bork P, Jensen LJ, VonMering C. 2017. The STRINGdatabase in 2017: quality-controlled protein-protein association networks, madebroadly accessible. Nucleic Acids Research 45(Database issue):D362–D368DOI 10.1093/nar/gkw937.
Upur H, Chen Y, KamilijiangM, DengW, Sulaiman X, Aizezi R, Wu X, TulakeW, Abudula A. 2015. Identification of plasma protein markers common topatients with malignant tumour and Abnormal Savda in Uighur medicine: aprospective clinical study. BMC Complementary and Alternative Medicine 15:9DOI 10.1186/s12906-015-0526-6.
Wang L, Chen C, Li F, Hua QQ, Chen S, Xiao B, Dai M, Li M, Zheng A, Yu D. 2016.Overexpression of neuromedin U is correlated with regional metastasis of headand neck squamous cell carcinoma.Molecular Medicine Reports 14(2):1075–1082DOI 10.3892/mmr.2016.5347.
Wang D, Qiu C, Zhang H,Wang J, Cui Q, Yin Y. 2010.Human microRNA oncogenesand tumor suppressors show significantly different biological patterns: fromfunctions to targets. PLOS ONE 5(9):e13067 DOI 10.1371/journal.pone.0013067.
Xu B, Ghossein R. 2016. Genomic landscape of poorly differentiated and anaplastic thy-roid carcinoma. Endocrine Pathology 27:205–212 DOI 10.1007/s12022-016-9445-4.
Yap LF, Velapasamy S, Lee HM, Thavaraj S, Rajadurai P, WeiW, Vrzalikova K,IbrahimMH, Khoo AS, Tsao SW. 2015. Down-regulation of LPA receptor 5contributes to aberrant LPA signalling in EBV-associated nasopharyngeal carcinoma.Journal of Pathology 235:456–465 DOI 10.1002/path.4460.
Tang et al. (2018), PeerJ, DOI 10.7717/peerj.4674 17/18

Yu XM, Schneider DF, Leverson G, Chen H, Sippel RS. 2013. Follicular variant ofpapillary thyroid carcinoma is a unique clinical entity: a population-based study of10,740 cases. Thyroid 23:1263–1268 DOI 10.1089/thy.2012.0453.
ZarkeshM, Zadeh-Vakili A, Azizi F, Foroughi F, AkhavanMM, Hedayati M. 2017.Altered epigenetic mechanisms in thyroid cancer subtypes.Molecular Diagnosis &Therapy 22(1):41–56 DOI 10.1007/s40291-017-0303-y.
Zhang J, Zhu Z, Sheng J, Yu Z, Yao B, Huang K, Zhou L, Qiu Z, Huang C. 2017.miR-509-3-5P inhibits the invasion and lymphatic metastasis by targeting PODXL andserves as a novel prognostic indicator for gastric cancer. Oncotarget 8:34867.
Tang et al. (2018), PeerJ, DOI 10.7717/peerj.4674 18/18