bioinformatics approaches to gene expression - … · bioinformatics approaches . to gene...
TRANSCRIPT

Bioinformatics approaches to gene expression
Introduction to BioinformaticsSeptember 18, 2006
J. Pevsner ([email protected])

Copyright notice
Many of the images in this powerpoint presentationare from Bioinformatics and Functional Genomicsby Jonathan Pevsner (ISBN 0-471-21004-8). Copyright © 2003 by John Wiley & Sons, Inc.
These images and materials may not be usedwithout permission from the publisher. We welcomeinstructors to use these powerpoints for educationalpurposes, but please acknowledge the source.
The book has a homepage at http://www.bioinfbook.orgincluding hyperlinks to the book chapters.

Outline of upcoming lectures
The first part of the course covered sequence analysis,including BLAST (Chapters 1-5).
Today we begin the next part of the course: functional genomics (Chapters 6-11).
We will study how DNA is transcribed to RNA (i.e. gene expression), and we will discuss microarrays. Then we will study proteins. We will perform multiple sequence alignments,then visualize those alignments in phylogenetic trees.
A new course (2nd quarter) will cover genomes (Ch. 12-18).


• by region (e.g. brain versus kidney)• in development (e.g. fetal versus adult tissue)• in dynamic response to environmental signals (e.g. immediate-early response genes)
• in disease states• by gene activity
Gene expression is regulated in several basic ways
Page 157

Organism Gene expression changes measured...
virus
bacteria
fungi
invertebrates
rodents
human In m
utan
t or w
ildty
pe c
ells
Dev
elop
men
t
Cel
l typ
es
Dis
ease
In v
irus,
bac
teria
, and
/or h
ost
In re
spon
se to
stim
uli
Fig. 6.1Page 158

DNA RNA
cDNA
phenotypeprotein
Page 159
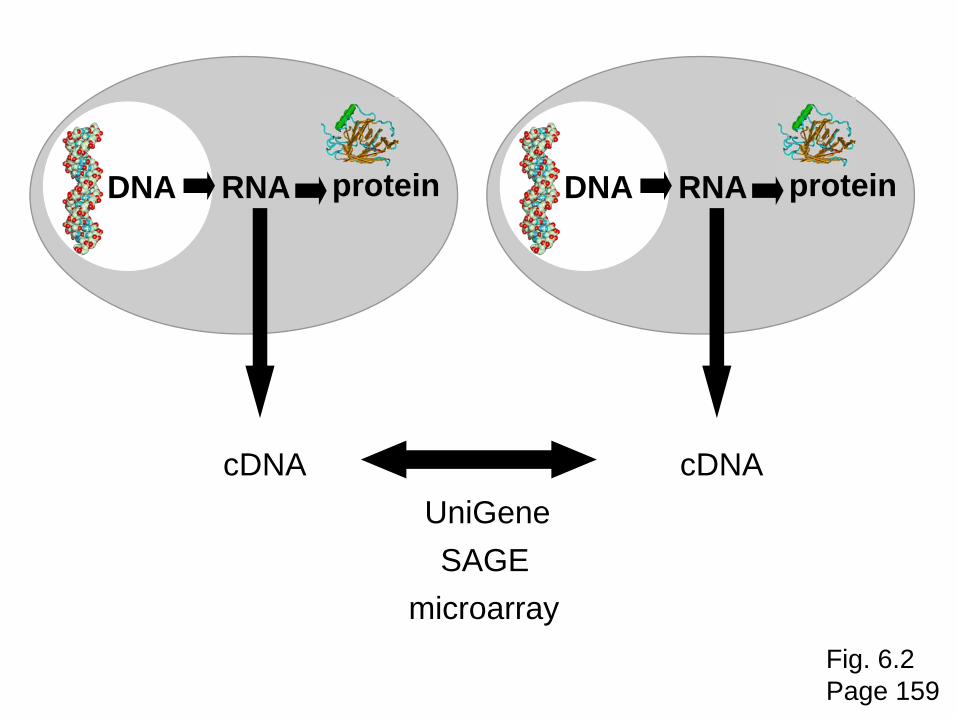
DNA RNA
cDNA
protein DNA RNA
cDNA
protein
UniGeneSAGE
microarrayFig. 6.2Page 159
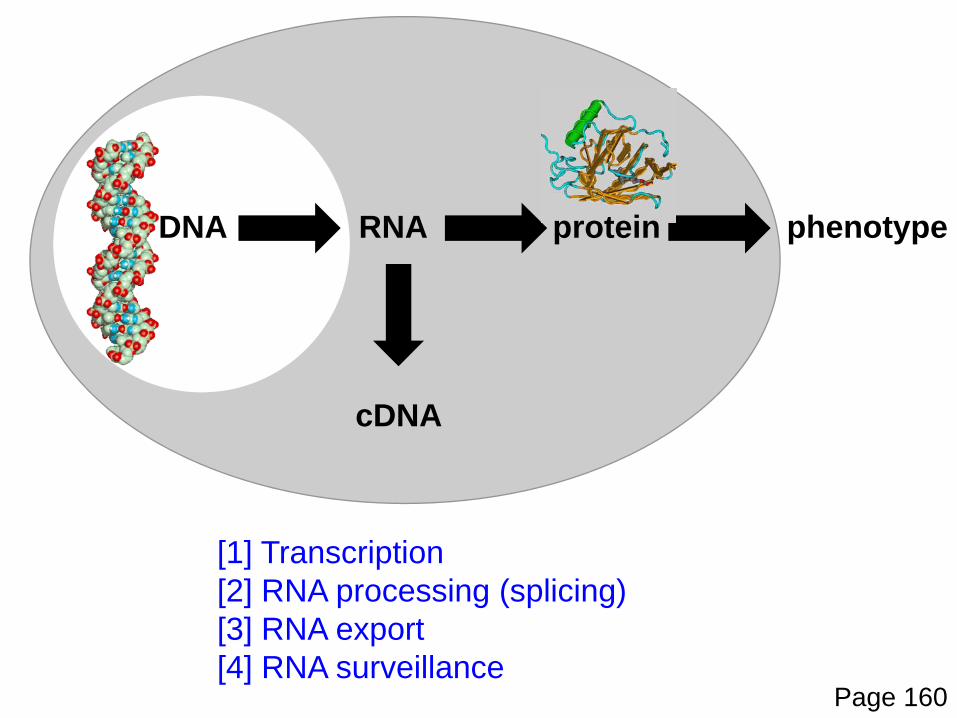
DNA RNA
cDNA
phenotypeprotein
[1] Transcription[2] RNA processing (splicing)[3] RNA export[4] RNA surveillance
Page 160

Fig. 6.3Page 161
exon 1 exon 2 exon 3intron intron
transcription
RNA splicing (remove introns)
polyadenylation
Export to cytoplasm
AAAAA 3’5’
5’
5’
5’ 3’5’3’
3’
3’

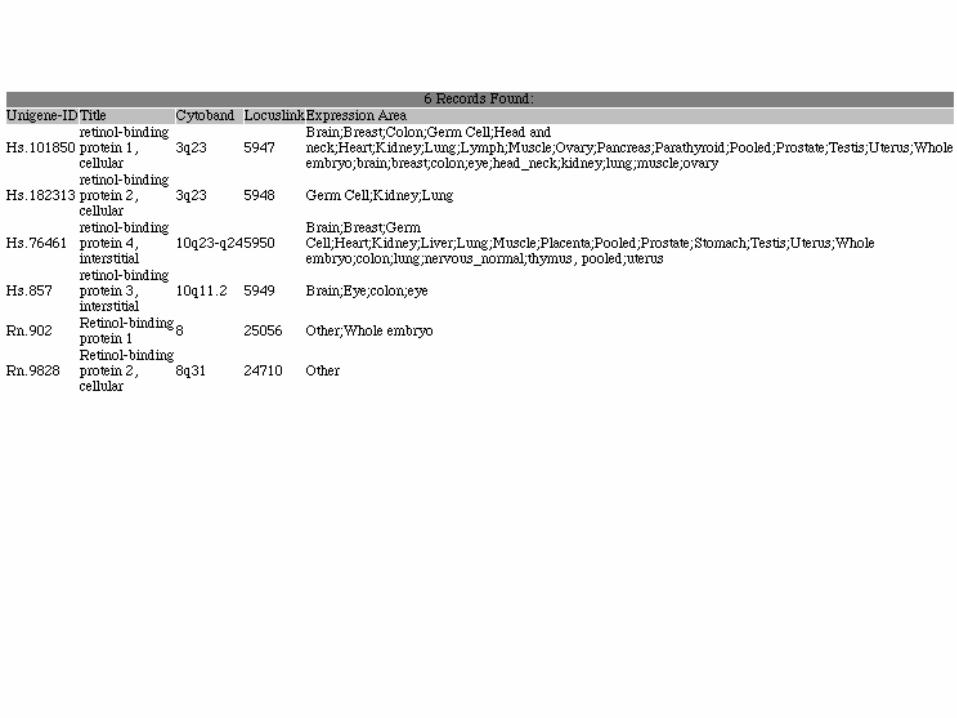
Relationship of mRNA to genomic DNA for RBP4
Fig. 6.4Page 162

Analysis of gene expression in cDNA libraries
A fundamental approach to studying gene expressionis through cDNA libraries.
• Isolate RNA (always from a specificorganism, region, and time point)
• Convert RNA to complementary DNA
• Subclone into a vector
• Sequence the cDNA inserts. These are expressed sequence tags(ESTs)
Page 162-163
vector
insert

UniGene: unique genes via ESTs
• Find UniGene at NCBI: from the home page click All databases (on the top bar) then UniGene, or go to:www.ncbi.nlm.nih.gov/UniGene
• UniGene clusters contain many ESTs
• UniGene data come from many cDNA libraries. Thus, when you look up a gene in UniGene you get information on its abundance and its regional distribution.
Page 164
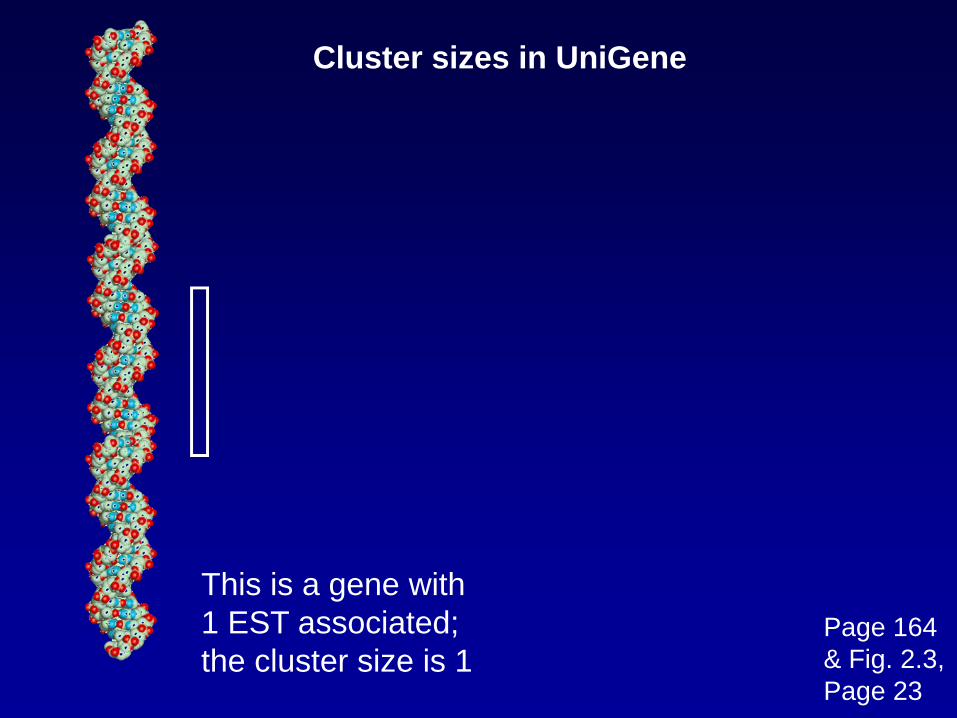
Cluster sizes in UniGene
This is a gene with1 EST associated;the cluster size is 1
Page 164& Fig. 2.3,Page 23

Cluster sizes in UniGene
This is a gene with10 ESTs associated;the cluster size is 10
Page 164

Cluster sizes in UniGene (human)
Cluster size (ESTs) Number of clusters1 ≈ 42,8002 6,5003-4 6,5005-8 5,4009-16 4,10017-32 3,300
≈500-1000 2,128≈2000-4000 233≈8000-16,000 21≈16,000-30,000 8
UniGene build 194, 8/06

Cluster sizes in UniGene (human)
Cluster size Number of clusters1 ≈10,4002 7,1003-4 6,8005-8 5,3009-16 3,80017-32 3,100
≈500-1000 1,500≈2000-4000 130≈8000-16,000 12≈16,000-30,000 3
UniGene build 186, 9/05 Page 164
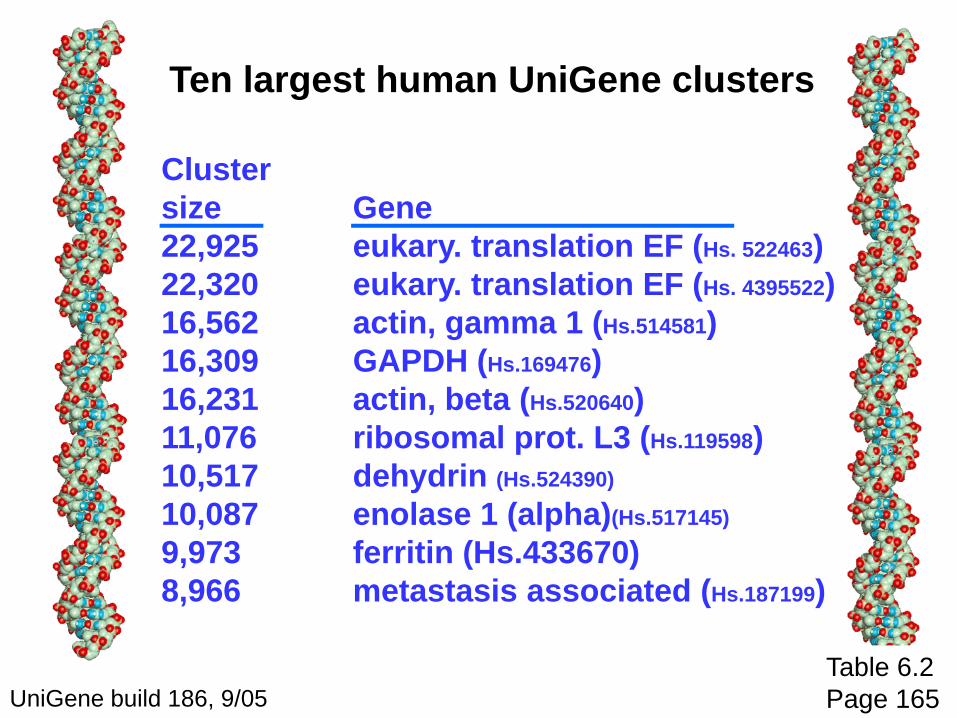
Ten largest human UniGene clusters
Cluster size Gene22,925 eukary. translation EF (Hs. 522463)22,320 eukary. translation EF (Hs. 4395522)16,562 actin, gamma 1 (Hs.514581)16,309 GAPDH (Hs.169476)16,231 actin, beta (Hs.520640)11,076 ribosomal prot. L3 (Hs.119598)10,517 dehydrin (Hs.524390)
10,087 enolase 1 (alpha)(Hs.517145)
9,973 ferritin (Hs.433670)8,966 metastasis associated (Hs.187199)
UniGene build 186, 9/05Table 6.2Page 165

Ten largest human UniGene clusters
Cluster size Gene29,533 eukary. translation EF (Hs.439552)16,837 GAPDH (Hs.169476)15,486 mRNA, placental villi (Hs.406283)15,453 actin, gamma 1 (Hs.14376)12,905 actin, beta (Hs.426930)10,760 ribosomal prot. S2 (Hs.498569)10,680 ribosomal prot. L3 (Hs.119598)10,339 tubulin, alpha (Hs.446608)9,763 ribosomal protein P0 (Hs.443796)9,573 ferritin (Hs.433670)
UniGene build 172, 8/04Table 6.2Page 165

Why ribosomal transcripts are abundantin UniGene
The major types of RNA are:
ribosomal RNA rRNA (~85%)transfer RNA tRNA (~15%)messenger RNA mRNA (~3%)
noncoding RNA ncRNA (<1%)small nuclear RNA snRNAsmall nucleolar RNA snoRNAsmall interfering RNA siRNA

There are three distinctions of similarity in UniGene:
1. "Highly similar to" means >90% in the aligned region.
2. "Moderately Similar to" means 70-90% similar in the aligned region.
3. "Weakly similar to" means <70% similar in the aligned region.
Page 164
UniGene clusters are often “similar to” a known gene

SpeciesCanis familiaris (dog) Helianthus annuus (sunflower)Salmo salar (Atlantic salmon)Bombyx mori (domestic silkworm)Apis mellifera (honey bee)Lotus corniculatus (Birdsfoot trefoil)Physcomitrella patens (physco. moss) Lactuca sativa (garden lettuce) Malus x domestica (Apple)Hydra magnipapillataPopulus tremula x
Populus tremuloides (aspen) Ovis aries (sheep)
UniGene includes 74 species (as of Aug. 2006), all with many ESTs available. Recent entries include:

Identifying protein-coding genes in genomic DNA remains a tremendous challenge. Genes can be predicted “ab initio” (by analyzing genomic DNA for the features of start and stop sites, exons/intron structures, regulatory regions etc.). When EST data are coupled with gene prediction, the accuracy soars.
Thus all ongoing genome sequencing projects include a major component of large-scale EST sequencing. Typically, this is done at different developmental stages (e.g. embryo versus adult), regions (e.g. brain versus gut), and physiological states (e.g. mosquitoes having fed on blood versus sucrose). EST data are deposited in UniGene.
The significance of UniGene’s continued growth

Digital Differential Display (DDD) in UniGene
• UniGene clusters contain many ESTs
• UniGene data come from many cDNA libraries
• Libraries can be compared electronically
Page 165

Fig. 6.6Page 166
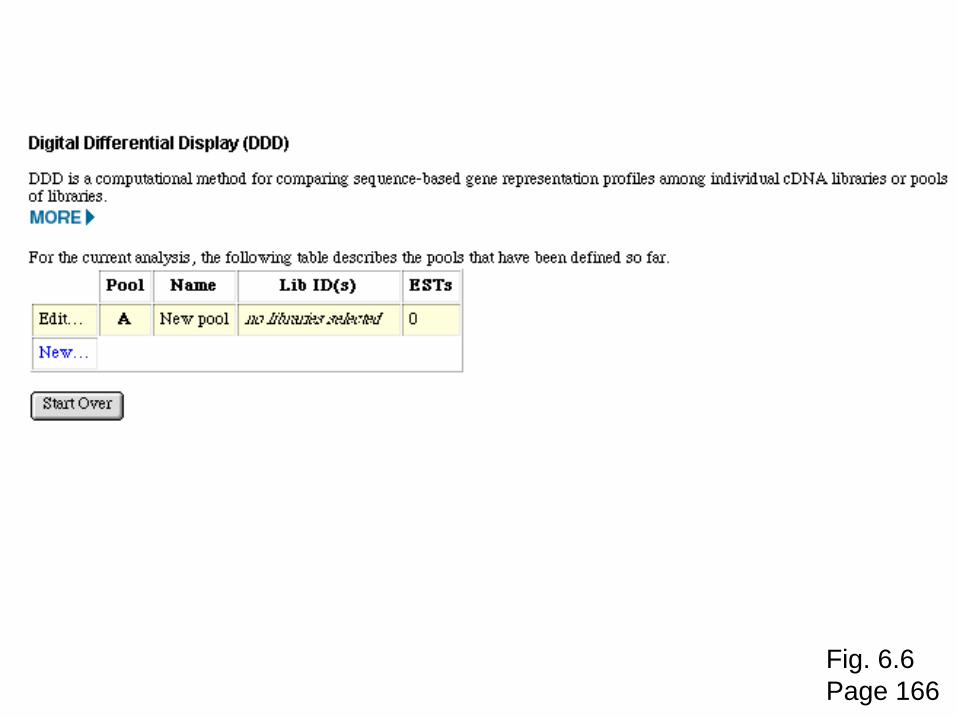
Fig. 6.6Page 166

Fig. 6.6Page 166

UniGene brainlibraries

UniGene lunglibraries

Fig. 6.7Page 167

Fig. 6.7Page 167

n-sec1 up-regulated in brain
CamKII up-regulated
in brain
surfactant up-regulated in lung
Page 167

fraction of sequences within the pool that mapped to the cluster shown

DDD at UniGene
Question: are there individual RNA transcripts that are differentially present in a comparison of EST libraries?
Approach to estimating statistical significance: Fisher’s exact test.
Pages 165

DDD at UniGene
Fisher’s exact test is a nonparametric method.
• It does not assume a normal distribution of the observations• It is easy to calculate• It often has less statistical power than parametric tests (such as a t-test)• For nonparametric methods, observations are typically arranged in an array with ranks assigned from 1 to n.

DDD at UniGene
Fisher’s exact test is related to a chi square (χ2) test, but is appropriate for small sample sizes.
A χ2 test is applied to row x column (rc) contingency tables
Determine whether the observed (O) frequencies of occurrence of a categorical value differ significantly from the expected (E) frequency of occurrence. Is O – E larger than expected by chance?
rcχ2 = Σ
i=1
(Oi – Ei)2
Ei

Fisher’s exact test provides a p value
Digital differential display (DDD) results in UniGeneare assessed for significance using Fisher’s exact testto generate a p value.
p =
The null hypothesis (that gene 1 is not differentiallyregulated in a comparison of two libraries) is rejectedwhen p is < 0.05/G (where G = the number of UniGeneclusters analyzed).
Pages 165
NA! NB! c! C!
(NA + NB)! g1A! g1B! (NA – g1A)!(NB – g1B)!

Pool A
Pool B
total
Gene 1 All other genes total
NA
NB
g1A NA-g1A
c = g1A + g1B
NB-g1Bg1B
C = (NA-g1A) + (NB-g1B)
Fisher’s Exact Test: deriving a p value
Table 6-3Page 167

Pitfalls in interpreting cDNA library data
• bias in library construction• variable depth of sequencing• library normalization• error rate in sequencing• contamination (chimeric sequences)
Pages 166-168

Fig. 6.8p. 168-169
http://mgc.nci.nih.gov
Updated 8/06

Serial analysis of gene expression (SAGE)
• 9 to 11 base “tags” correspond to genes
• measure of gene expression in differentbiological samples
• SAGE tags can be compared electronically
Page 169

Tag 1
Tag 1Tag 2Tag n
Cluster 1Cluster 2Cluster 3
Cluster 1
SAGE tags are mapped to UniGene clusters
Page 169

Fig. 6.10Page 171

Fig. 6.11Page 171

Fig. 6.12Page 171

Fig. 6.13Page 173

Fig. 6.14Page 174

Fig. 6.15Page 175

Fig. 6.15Page 175

Microarrays: tools for gene expression
A microarray is a solid support (such as a membraneor glass microscope slide) on which DNA of knownsequence is deposited in a grid-like array.
The most common form of microarray is used to measure gene expression. RNA is isolated from matched samples of interest. The RNA is typically converted to cDNA, labeled with fluorescence (or radioactivity), then hybridized to microarrays in order to measure the expression levelsof thousands of genes.
Page 173

• Wildtype versus mutant
• Cultured cells +/- drug
• Physiological states (hibernation, cell polarity formation)
• Normal versus diseased tissue (cancer, autism)
Questions addressed using microarrays
Page 173

• metazoans: human, mouse, rat, worm, insect
• fungi: yeast
• plants: Arabidopsis
• many other: e.g. bacteria, viruses
Organisms represented on microarrays

Fast Data on >20,000 genes in several weeks
Comprehensive Entire yeast or mouse genome on a chip
Flexible • As more genomes are sequenced, more arrays can be made.
• Custom arrays can be made to represent genes of interest
Easy Submit RNA samples to a core facility
Cheap? Chip representing 20,000 genes for $350; robotic spotter/scanner cost $100,000
Advantages of microarray experiments
Table 6-4Page 175

Cost Some researchers can’t afford to doappropriate controls, replicates
RNA The final product of gene expression is proteinsignificance (see pages 174-176 for references)
Quality Impossible to assess elements on array surfacecontrol Artifacts with image analysis
Artifacts with data analysis
Disadvantages of microarray experiments
Table 6-5Page 176

purify RNA, label
hybridize,wash, image
Biological insight
Sampleacquisition
Dataacquisition
Data analysis
Data confirmation
data storage
experimentaldesign
Fig. 6.16Page 176

Stage 1: Experimental design
[1] Biological samples: technical and biological replicates
[2] RNA extraction, conversion, labeling, hybridization
[3] Arrangement of array elements on a surface
Page 177

Sample 1 Sample 2 Sample 3
Fig. 6.17Page 177

Samples 1,2 Samples 1,3 Samples 2,3
Sample 1, pool Sample 2, poolSamples 2,1:switch dyes
Fig. 6.17Page 177

Stage 2: RNA and probe preparation
Page 178
For Affymetrix chips, need total RNA (about 10 ug)
Confirm purity by running agarose gel
Measure a260/a280 to confirm purity, quantity

School of Medicine basic sciences Affymetrix corehttp://www.hopkinsmedicine.org/IBBS/HiT/cores.html
Johns Hopkins University NIDDK Gene Profiling Centerhttp://www.hopkinsmedicine.org/nephrology/microarray/
The Hopkins Expressionistshttp://astor.som.jhmi.edu/hex/
Johns Hopkins School of Public Health corehttp://www.jhsph.edu/Dept/EHS/Centers/UrbanEnviroHlth/FacilityB

Stage 3: hybridization to DNA arrays
Page 178-179
The array consists of cDNA or oligonucleotides
Oligonucleotides can be deposited by photolithography
The sample is converted to cRNA or cDNA

Source: Nature Genetics (1999) microarray supplement

Microarrays: array surface
Fig. 6.18Page 179Southern et al. (1999) Nature Genetics, microarray supplement

Microarrays: robotic spotters
See Nature Genetics (1999) microarray supplement

Stage 4: Image analysis
Page 180
RNA expression levels are quantitated
Fluorescence intensity is measured with a scanner,or radioactivity with a phosphorimager

Rett
Control
Differential Gene Expression on a cDNA Microarray
α B Crystallin is over-expressed in Rett Syndrome
Fig. 6.19Page 180

Fig. 6.20Page 181

Fig. 6.20Page 181

Fig. 6.20Page 181

Fig. 6.20Page 181

Stage 5: Microarray data analysis
Page 180
This is the subject of Wednesday’s class
• How can arrays be compared? • Which genes are regulated?• Are differences authentic?• What are the criteria for statistical significance?• Are there meaningful patterns in the data (such as groups)?
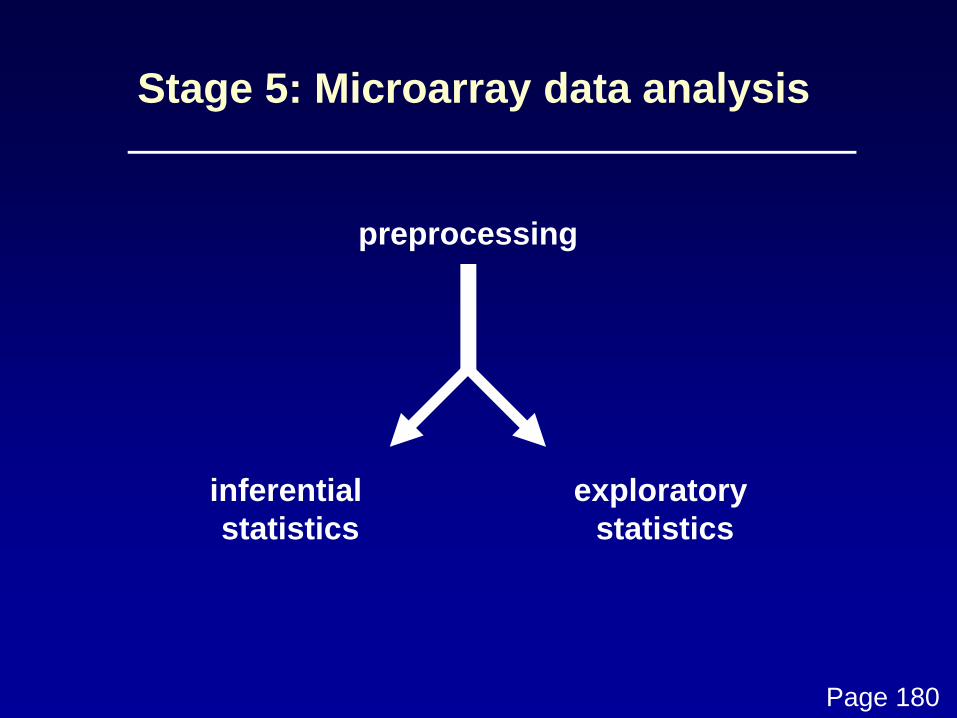
preprocessing
inferential statistics
exploratory statistics
Page 180
Stage 5: Microarray data analysis

preprocessing
inferential statistics
exploratory statistics
t-tests
global normalizationlocal normalizationscatter plots
clustering
Page 180
Stage 5: Microarray data analysis

Matrix of genes versus samples
T-test: • for each gene, calculate the mean expression valuein control (C) and experimental (E) samples
• Null hypothesis: the mean C and E values are the same• Use a t-test to see whether the null hypothesis can berejected with a particular cutoff value (e.g. p < 0.05)
• Correct the p value for multiple comparisons (e.g. if youmeasure expression values in 10,000 genes, then 5%(500 genes) might vary by chance alone).

small p value; ratio large
small p value; ratio unimpressive
Perform a t-test in Excel to compare the mean of two groups,and to compare fold change to probability values

diseasevs normal
Error
t-test to determine statistical significance
difference between mean of disease and normalt statistic =
variation due to error
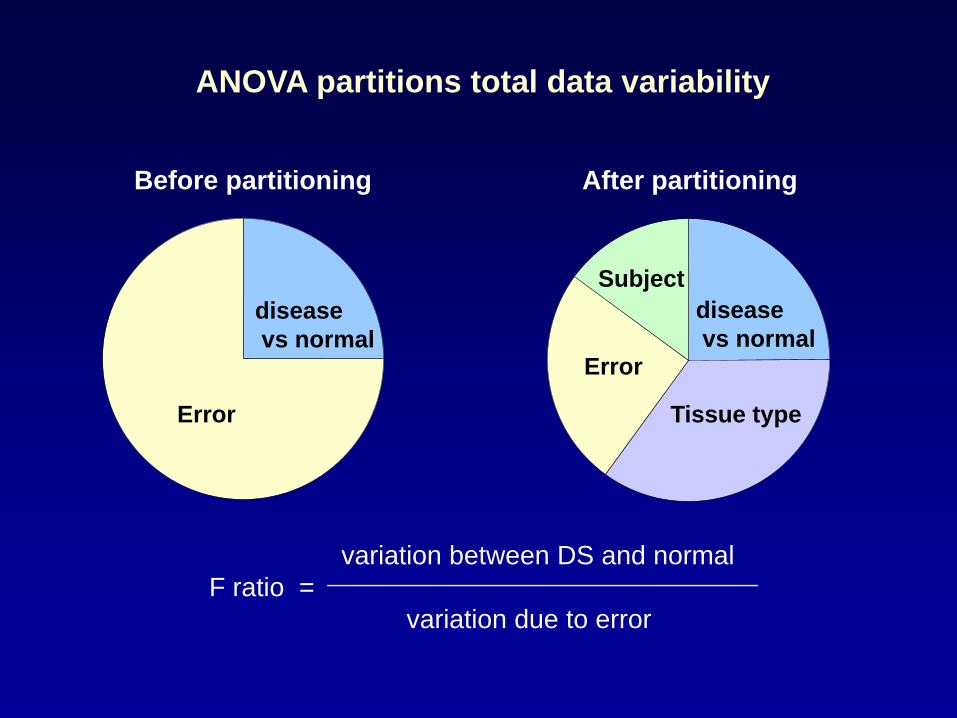
Error
Error
Tissue type
ANOVA partitions total data variability
variation between DS and normalF ratio =
variation due to error
Before partitioning After partitioning
Subjectdiseasevs normal
diseasevs normal

Matrix of genes versus samples
Metric (define distance)
supervised,unsupervised
analyses
clusteringtrees(hierarchical,k-means)
self-organizing
maps
principalcomponentsanalysis
Page 180

Stage 5: MIAME
Page 182
In an effort to standardize microarray data presentationand analysis, Alvis Brazma and colleagues at 17institutions introduced Minimum Information About aMicroarray Experiment (MIAME). The MIAME framework standardizes six areas of information:• experimental design• microarray design• sample preparation• hybridization procedures• image analysis• controls for normalization
Visit http://www.mged.org

Stage 6: Biological confirmation
Page 182
Microarray experiments can be thought of as“hypothesis-generating” experiments.
The differential up- or down-regulation of specificgenes can be measured using independent assayssuch as
-- Northern blots-- polymerase chain reaction (RT-PCR)-- in situ hybridization

Stage 7: Microarray databases
Page 182
There are two main repositories:
Gene expression omnibus (GEO) at NCBI
ArrayExpress at the European Bioinformatics Institute (EBI)
See the URLs on page 184

Gene expression omnibus (GEO)
NCBI repository for gene expression data


http://www.dnachip.org
Fig. 6.21Page 183

• Stanford Microarray Databasehttp://www.dnachip.org
• links at http://pevsnerlab.kennedykrieger.org/
Microarrays: web resources

Database Referencing of Array Genes Online(DRAGON)

Database Referencing of Array Genes Online(DRAGON)
Credit: Christopher BoutonCarlo ColantuoniGeorge Henry


Paste accession numbers into DRAGON here


DRAGON relates genesto KEGG pathways

For Friday’s lab, try UniGene’s digital differential displaytool and try digital SAGE.
Wednesday we will discuss microarray data analysis,and that will be the main focus of Friday’s lab.
Next this week