biological and chemical induction of systemic resistance in the
TRANSCRIPT

UmweltEnvironment
Biological and chemical induction of systemic resistance in the barleypowdery mildew pathosystem
Kate L. Morrissey
�������������� �������������������� �����������
Biological and chemical induction of systemic resistance in the barleypowdery mildew pathosystem
Kate L. Morrissey

Schriften des Forschungszentrums JülichReihe Umwelt / Environment Band / Volume 73

Forschungszentrum Jülich GmbHInstitut für Chemie und Dynamik der Geosphäre (ICG)Phytosphäre (ICG-3)
Biological and chemical induction of systemic resistance in the barleypowdery mildew pathosystem
Kate L. Morrissey
Schriften des Forschungszentrums JülichReihe Umwelt / Environment Band / Volume 73
ISSN 1433-5530 ISBN 978-3-89336-475-6

Bibliographic information published by the Deutsche Nationalbibliothek.The Deutsche Nationalbibliothek lists this publication in the Deutsche Nationalbibliografie; detailed bibliographic data are available in the Internet at http://dnb.d-nb.de.
Publisher and Forschungszentrum Jülich GmbHDistributor: Zentralbibliothek, Verlag
52425 JülichPhone +49 (0)2461 61-5368 · Fax +49 (0)2461 61- 6103e-mail: [email protected]: http://www.fz-juelich.de/zb
Cover Design: Grafische Medien, Forschungszentrum Jülich GmbH
Printer: Grafische Medien, Forschungszentrum Jülich GmbH
Copyright: Forschungszentrum Jülich 2007
Schriften des Forschungszentrums JülichReihe Umwelt / Environment Band / Volume 73
D 61 (Diss., Düsseldorf, Univ., 2007)
ISSN 1433-5530ISBN-13: 978-3-89336-475-6
Neither this book nor any part of it may be reproduced or transmitted in any form or by any means, electronic or mechanical, including photocopying, microfilming, and recording, or by any information storage and retrieval system, without permission in writing from the publisher.
Contents__________________________________________________________________________________________________________________________________________________________________________________________________________________________________
1
Contents
Contents...................................................................................................................................... 1 Abstract ...................................................................................................................................... 3 Zusammenfassung ...................................................................................................................... 5 Abbreviations ............................................................................................................................. 7 1 Introduction ........................................................................................................................... 11
1.1 Induced resistance .......................................................................................................... 11 1.2 Signalling mechanisms................................................................................................... 15 1.3 Chemical activators ........................................................................................................ 171.4 Biological inducers......................................................................................................... 18 1.5 Barley-powdery mildew interaction............................................................................... 19 1.6 Aims ............................................................................................................................... 20
2 Materials and Methods .......................................................................................................... 21 2.1 Biological material ......................................................................................................... 21
2.1.1 Plant......................................................................................................................... 21 2.1.2 Fungus ..................................................................................................................... 21 2.1.3 Bacteria.................................................................................................................... 21 2.1.4 Plasmids................................................................................................................... 22
2.2 Chemicals ....................................................................................................................... 23 2.2.1 Primer information .................................................................................................. 23
2.3 Equipment ...................................................................................................................... 24 2.4 Cultivation of biological material................................................................................... 24
2.4.1 Plant material........................................................................................................... 242.4.2 Fungal material........................................................................................................ 252.4.3 Bacterial material .................................................................................................... 25
2.5 Chemical pre-treatment .................................................................................................. 25 2.6 Bacterial pre-infiltration ................................................................................................. 262.7 Fungal inoculation.......................................................................................................... 26 2.8 Harvesting of plant material ........................................................................................... 27 2.9 Data analysis................................................................................................................... 27 2.10 Molecular biological methods ...................................................................................... 27
2.10.1 RNA isolation........................................................................................................ 27 2.10.2 cDNA synthesis..................................................................................................... 28 2.10.3 PCR amplification of cDNA probes...................................................................... 28 2.10.4 Gel extraction ........................................................................................................ 292.10.5 Cloning and sequencing of PCR Products ............................................................ 29 2.10.6 DIG labelling of probes......................................................................................... 31 2.10.7 Northern analysis and hybridisation...................................................................... 32
2.11 Microarray analysis ...................................................................................................... 332.11.1 DNA array ............................................................................................................. 332.11.2 Microarray preparation.......................................................................................... 34 2.11.3 Fluorescent probes................................................................................................. 34 2.11.4 Hybridisation and scanning ................................................................................... 35
2.12 In situ detection of reactive oxygen species (ROS) ..................................................... 36 2.13 HPLC analysis of soluble phenolics............................................................................. 37 2.14 Intercellular wash fluid (ICWF) ................................................................................... 37 2.15 Protein determination ................................................................................................... 372.16 G6PDH activity assay .................................................................................................. 38 2.17 Protein precipitation ..................................................................................................... 38

Contents__________________________________________________________________________________________________________________________________________________________________________________________________________________________________
2
2.18 SDS-PAGE................................................................................................................... 39 2.19 Coomassie blue staining............................................................................................... 39 2.20 2D electrophoresis........................................................................................................ 39
2.20.1 First dimension ...................................................................................................... 40 2.20.2 Second dimension.................................................................................................. 40 2.20.3 Visualisation.......................................................................................................... 412.20.4 Evaluation and picking of spots ............................................................................ 41 2.20.5 In-gel digest........................................................................................................... 412.20.6 Mass spectrometry analysis of the trypsin fragments ........................................... 42
3 Results ................................................................................................................................... 43 3.1 Testing the system for systemic resistance induction .................................................... 43
3.1.1 Chemical inducers ................................................................................................... 46 3.1.2 Biological inducers.................................................................................................. 48 3.1.3 Comparison of biological and chemical resistance inducers................................... 56
3.2 Investigations of the responsible mechanisms and signalling cascades......................... 60 3.2.1 Oxidative burst ........................................................................................................ 603.2.2 Phenolic accumulation ............................................................................................ 63 3.2.3 Signal transduction .................................................................................................. 69 3.2.4 Chemical induced resistance ................................................................................... 73 3.2.5 Pathogenesis-related proteins .................................................................................. 74 3.2.6 Microarray ............................................................................................................... 793.2.7 Differentially expressed proteins............................................................................. 88
3.3 Summary of important results ........................................................................................ 92 4 Discussion ............................................................................................................................. 95
4.1 Testing the system.......................................................................................................... 95 4.1.1 Biological resistance induction ............................................................................... 95 4.1.2 Chemical resistance induction................................................................................. 99
4.2 Systemic induced resistance: Looking for the responsible mechanisms...................... 100 4.2.1 Pathogenesis-related (PR) Proteins ....................................................................... 101 4.2.2 Reactive oxygen species (ROS) accumulation...................................................... 105 4.2.3 Phenylpropanoid.................................................................................................... 106 4.2.4 Additional defence mechanisms............................................................................ 107
4.3 Role of signalling cascades .......................................................................................... 108 4.3.1 Calcium ................................................................................................................. 1094.3.2 ROS ....................................................................................................................... 109 4.3.3 Salicylic acid (SA)................................................................................................. 110 4.3.4 Jasmonate .............................................................................................................. 1114.3.5 Ethylene/ Polyamine.............................................................................................. 113 4.3.6 Additional signalling events.................................................................................. 114
5 Conclusions ......................................................................................................................... 115 6 References ........................................................................................................................... 117 Acknowledgements ................................................................................................................ 137
Abstract__________________________________________________________________________________________________________________________________________________________________________________________________________________________________
3
Abstract
Systemic acquired resistance (SAR) provides plants with a broad spectrum resistance to a variety of phytopathogens (fungi, bacteria and viruses). In dicotyledons the systemic resistance can be induced by both biological and chemical activators. At present it is unclear whether SAR exists in monocotyledons, however, induced resistance has been well reported. The barley-powdery mildew interaction (Blumeria graminis f.sp. hordei, Bgh) was used as a test system. The effects of various biological (Pseudomonas syringae subspecies and Xanthomonas translucens subspecies) and chemical (Bion®, INA, SA and Paraquat) inducers have been analysed.
Local pre-infiltration with some but not all of the bacterial strains tested led to lower systemic powdery mildew growth. The bacteria which were able to multiply quickly within barley were also able to provide protection against fungal infection. The degree of chemical resistance induced varied depending on the chemical inducer used, Bion® was the most effective of those tested.
By using a combination of metabolite and expression analyses a hypothesis was developed concerning the mechanisms and signalling cascades involved in the development of the systemic resistance. Phenylpropanoid biosynthesis does not appear to be involved in the induced resistance observed in the course of this study. Little influence was found on the accumulation of soluble phenolic compounds following the individual local pre-treatments, whilst alterations were observed after Bgh infection. This was in agreement with the obtained expression data for PAL and CHS. In contrast three different pathogenesis-related (PR) proteins displayed differential regulation. PR-1, PR-2 and PR-3 are commonly used as markers for SAR in dicotyledons, it was shown here that Bion® and a Pseudomonassyringae subspecies resulted in induced PR-gene expression in barley. Paraquat led to primed expression, whilst the remaining bacteria induced local PR transcript accumulation and primed systemic expression.
In some but not all systemic leaves lipoxygenase, as a marker for JA biosynthesis, was primed or induced as well as some JA dependent genes. It was hypothesised that Bion® mediates its systemic effects through JA signalling, whilst another signal is required for local responses possibly SA. The bacterial strains tested appear to involve a variety of signalling mechanisms which respond with differing speed and intensity. Local triggering includes reactive oxygen species (ROS) accumulation, at later time points JA and other signalling molecules induce defence responses. Paraquat pre-treatment sensitised the barley plants to respond quicker and stronger to subsequent pathogen attack without having the cost of pre-emptively producing defence proteins. JA signalling is suggested to be responsible for local events whilst another signalling molecule must contribute to the systemic responses, possibly ROS. Local Paraquat pre-treatment of barley plants had a massive effect by reducing redox genes in systemic leaves as shown by differential gene expression.
The results pointed out, that the systemic induced resistance in monocotyledons involves several different signalling cascades and induces various defence mechanisms. In some parameters it

Abstract__________________________________________________________________________________________________________________________________________________________________________________________________________________________________
4
resembles SAR of dicotyledons but not in others. Thus the systemic induced resistance seems to be of higher complexity in monocotyledons than in dicotyledons and requires further investigation.

Zusammenfassung__________________________________________________________________________________________________________________________________________________________________________________________________________________________________
5
Zusammenfassung
Systemische erworbene Resistenz (SAR) bietet einen Schutz gegen ein breites Spektrum von Phytopathogenen (Pilze, Bakterien und Viren). In Dikotyledonen wird SAR durch sowohl biologische als auch chemische Aktivatoren induziert. Zurzeit ist es noch unklar, ob SAR auch in Monokotyledonen existiert, allerdings konnte bereits häufig induzierte Resistenz beobachtet werden. Zur Untersuchung der systemischen Resistenz in Monokotyledonen diente in dieser Arbeit Gerste und Echter Mehltau (Blumeria graminis f.sp. hordei, Bgh). Die Wirkung von verschiedenen biologischen (Pseudomonas syringae-Unterarten und Xanthomonas translucens-Unterarten) und chemischen (Bion®, INA, SA und Paraquat) Induktoren wurden analysiert.
Lokale Präinfiltration mit einigen, jedoch nicht allen der getesteten Bakterienstämmen führte zu reduziertem systemischen Befall mit Echtem Mehltau. Die Bakterienstämme, die sich in Gerste schnell multiplizieren konnten, führten zu einer verbesserten Resistenz gegenüber einem sekundären Pilzbefall. Der Grad der induzierten Resistenz nach Applikation eines chemischen Aktivators hing stark vom chemischen Aktivator ab. Bion® erwies sich als der effektivste getestete Aktivator.
Mit Hilfe eine Kombination von Metaboliten- und Expressionsanalysen wurde versucht eine Hypothese abzuleiten, welche Mechanismen und Signalkaskaden an der Entwicklung der systemischen Resistenz beteiligt sind. So konnte gezeigt werden, dass die Phenylpropanoidbiosynthese nicht an der induzierten Resistenz beteiligt zu sein scheint. Zwar wurde eine Akkumulation phenolischer Inhaltsstoffe nach Bgh Befall beobachtet, diese war aber kaum von den einzelnen lokalen Vorbehandlungen beeinflusst. Auch in den Expressionsdaten für PAL und CHS spiegelte sich dieses wieder. Dagegen wiesen drei unterschiedliche „pathogenesis-related“ (PR) Proteine differentielle Regulation auf. PR-1, PR-2 und PR-3 sind bekannte molekulare Marker für SAR in Dikotyledonen, zeigten aber auch in der hier untersuchten Gerste klare systemische Induktion durch Bion® und eine Pseudomonas syringae-Unterart. Die anderen Bakterienarten führten dagegen nur lokal zu einer direkten Induktion, in systemischen Blättern aber zu einer verstärkten Expression nach Sekundärbefall. Vorbehandlung mit Paraquat dagegen führte sowohl lokal als auch systemisch nur nach Sekundärbefall zu einer verstärkten Expression der PR-Proteine und hatte keinen direkten Effekt.
Für die Induktion von Lipoxygenase, als Marker für JA-Biosynthese, sowie für einige JA-abhängige Gene konnte gezeigt werden, dass diese nach Vorbehandlung in systemischen Blättern direkt induziert, oder nach einem sekundären Befall mit Bgh schneller induziert wurden. Insbesondere für Bion® ist daher eine Vermittlung der systemischen Wirkung durch JA Signalkaskaden sehr wahrscheinlich. Dagegen ist für die lokalen Reaktionen eher die Beteiligung eines anderen Signalmoleküls, wie etwa SA, anzunehmen. Insgesamt scheinen die untersuchten Bakterienstämme eine Vielzahl von Signalwegen für die Ausbildung der systemischen Resistenz zu nutzen, welche mit unterschiedlicher Geschwindigkeit und Intensität ablaufen. An den lokalen Mechanismen sind etwa die Akkumulation reaktiver Sauerstoffspezies (ROS), sowie JA und andere noch nicht geklärte Signalmoleküle beteiligt. Die bakteriell vermittelte systemische Resistenz scheint, im Gegensatz zur Bion® vermittelten, nicht allein von JA abhängig zu sein. Allerdings spielt wahrscheinlich auch hier die Akkumulation von ROS

Zusammenfassung__________________________________________________________________________________________________________________________________________________________________________________________________________________________________
6
eine zentrale Rolle. Die Wirkung von Paraquat ist eher über Redox-Prozesse vermittelt, da insbesondere Gene der Redoxregulation stark reguliert wurden.
Die Ergebnisse deuten drauf hin, dass die systemische induzierte Resistenz in Monokotyledonen mehrere unterschiedliche Signalkaskaden umfasst und verschiedene Abwehrmechanismen induziert. In einigen Aspekten ähnelt sie SAR in Dikotyledonen aber nicht in allen. Die systemisch induzierte Resistenz scheint daher in Monokotyledonen eine höhere Komplexität aufzuweisen als in Dikotyledonen, die in weiterführenden Untersuchungen näher analysiert werden muss.
Abbreviations__________________________________________________________________________________________________________________________________________________________________________________________________________________________________
7
Abbreviations
aa-dUTP aminoallyl-dUTP ABC ATP-binding cassette transporter ACCO 1-Aminocyclopropane-1-carboxylate oxidase ANOVA Analysis of Variance APX Ascorbate peroxidase avir avirulent strain avr avirulence gene BCCM Belgian co-ordinated collections of micro-organisms BCI Barley chemically induced Bgh Blumeria graminis f. sp. hordeibp Base pair BSA Bovine serum albumin BTH Benzo (1,2,3) thiadiazole-7-carbothioic acid S-methyl ester bZIP basic leucine zipper cDNA complementary DNA cfu Colony-forming units CHAPS 3-[(3-Cholamidopropyl)dimethylammonio]-1-propanesulphonateCHN Chitinase CHS Chalcone synthase CIR Chemical induced resistance cv. Cultivar CV Coefficient of variation dATP deoxyadenosine triphosphate DAB 3,3’ Diaminobenzidine dCTP deoxycytosine triphosphateDIG Digoxigenin dGTP deoxyguanosine triphosphate DNA Deoxyribonucleic acid dNTP deoxynucleoside triphosphate DMF N,N-Dimethylformamide DMSO Dimethyl sulphoxide dpt Days post treatment DSMZ Deutsche Sammlung von Mikroorganismen und Zellkulturen GmbH
(German national resource centre for biological material) dT deoxythymidine DTE 1,4-Dithioerythritol DTT 1,4-Dithiothreitol

Abbreviations__________________________________________________________________________________________________________________________________________________________________________________________________________________________________
8
dTTP deoxythymidine triphosphatedUTP deoxyuridine triphosphate EDTA Ethylenediaminetetraacetic acid ERF Ethylene responsive factor EST Expressed sequence tag FKBP FK506-binding protein f. sp. forma specialis FW Fresh weight G6PDH Glucose-6-phosphate dehydrogenase Glc -1,3-Glucanase H2O2 Hydrogen peroxide HCAA Hydroxycinnamic acid amide HCl Hydrochloric acid hpi Hours post inoculation HPLC High pressure liquid chromatography hpt Hours post treatment HR Hypersensitive response Hv Hordeum vulgareICWF Intercellular wash fluid INA 2,6-dichloroisonicotinic acid IPG Immobilised pH gradient ISR Induced systemic resistance JA Jasmonic acid LAR Local acquired resistance LMG Laboratorium voor Microbiologie, Universiteit Gent
(Laboratory for microbiology, Gent University) LOX Lipoxygenase M-MULV Moloney murine leukaemia virus MDR Multidrug resistance MeJA Methyl jasmonate MES (2-[N-Morpholino]-ethane sulphonic acid) hydrate MOPS Morpholino-3-propansulphonic acid mRNA messenger RNA MRP Multidrug resistance associated protein NADPH Nicotinamide adenine dinucleotide phosphate NBT 4-nitro blue tetrazolium NIM Non-inducible immunity NPR Non-expressor of PR genes N.M. Not measured
Abbreviations__________________________________________________________________________________________________________________________________________________________________________________________________________________________________
9
N.Q. Not quantified n.t. Not tested O2
.- Superoxide anion OD Optical density OH- Hydroxyl ion PAL Phenylalanine ammonium lyase PBS Phosphate buffered saline PCD Programmed cell death PCR Polymerase chain reaction PIN Proteinase inhibitor Pipes Piperazine-1,4-bis(2-ethanesulphonic acid) PR Pathogenesis-related P.s.jap Pseudomonas syringae pv. japonicaPsm Pseudomonas syringae pv. maculicolaP.s.syr Pseudomonas syringae pv. syringaeP.s.tom Pseudomonas syringae pv. tomatopv. Pathovar PVDF Polyvinylidene difluoride R Resistance gene Rboh Respiratory burst oxidase homologue RNA Ribonucleic acid ROS Reactive oxygen species SA Salicylic acid SAG SA glucoside SAMS S-adenosylmethionine synthetase SAR Systemic acquired resistance SDS Sodium dodecyl sulphate SDS-PAGE SDS-polyacrylamide gel electrophoresis SSC Standard saline citrate SOD Superoxide dismutaseTAE Tris acetate EDTA buffer Taq Thermus aquaticusTMV Tobacco mosaic virus TNV Tobacco necrosis virus v/v Volume per volume VIR Virulent strainWG Water-dispersible granules w/v Weight per volume w/w Weight per weight

Abbreviations__________________________________________________________________________________________________________________________________________________________________________________________________________________________________
10
X.t.cer Xanthomonas translucens pv. cerealisX.t.hor Xanthomonas translucens pv. hordeiX.t.tra Xanthomonas translucens pv. translucens

1 Introduction__________________________________________________________________________________________________________________________________________________________________________________________________________________________________
11
1 Introduction
1.1 Induced resistance Plants are continually challenged by phytopathogens, yet these attacks rarely develop into disease. In the majority of these cases, the plant is an unsuitable host and therefore does not provide the necessary requirements for pathogen growth, this is known as non-host resistance (Heath, 2000a; Thordal-Christensen, 2003).
In addition plants possess constitutive defence mechanisms which include preformed barriers (e.g. cuticula) that prevent pathogen penetration as well as preformed antifungal compounds, phytoanticipins (Morrissey and Osbourn, 1999).
When a plant is infected by an avirulent pathogen a variety of plant defence mechanisms are elicited, this is often accompanied by the collapse of the cells at the site of attempted infection as part of the so-called hypersensitive response (HR; Hammond-Kosack and Jones, 1996). This incompatible reaction relies upon the recognition of the pathogens avirulence (avr) gene by the host plants corresponding resistance (R) gene, known as the gene-for-gene resistancehypothesis (Flor 1971). This type of resistance is race-specific for each pathogen isolate (Hunt et al., 1996). After penetration the attacking pathogen is contained within a restricted lesion, this defined area of dead cells prevents the pathogen from spreading into the adjacent healthy tissue (Alvarez, 2000; Heath, 2000b), so depriving biotrophic pathogens from access to the nutrients required for growth and reproduction (Hammond-Kosack and Jones, 2000). The responding cells accumulate high concentrations of antimicrobial compounds (phytoalexins;Hammerschmidt, 1999) and free radicals derived from reactive oxygen species (ROS; Apel and Hirt, 2004).
Among the different types of induced resistance (Figure 1) naturally occurring in plants are salicylic acid (SA)-dependent systemic acquired resistance (SAR; Ross, 1961) and jasmonic acid (JA)-dependent induced systemic resistance (ISR; Pieterse et al., 1996; van Wees et al.,2000). SAR was first described by Ross (1961) using tobacco and tobacco mosaic virus (TMV); it was the first systematic study of SAR. Using TMV on local lesion hosts, Ross demonstrated that infections of TMV were restricted throughout the whole plant by a prior infection. This resistance was shown to be effective not only against TMV but also tobacco necrosis virus (TNV) and certain bacterial pathogens. Ross coined the term “SAR” to refer to the inducible systemic resistance and LAR to describe the resistance induced in inoculated leaves (Ryals et al., 1994). Since then it has been shown that SAR is effective against a broad spectrum of pathogens including fungi, bacteria and viruses, which can last for months (Ryals et al., 1994, 1995).
1 Introduction__________________________________________________________________________________________________________________________________________________________________________________________________________________________________
12
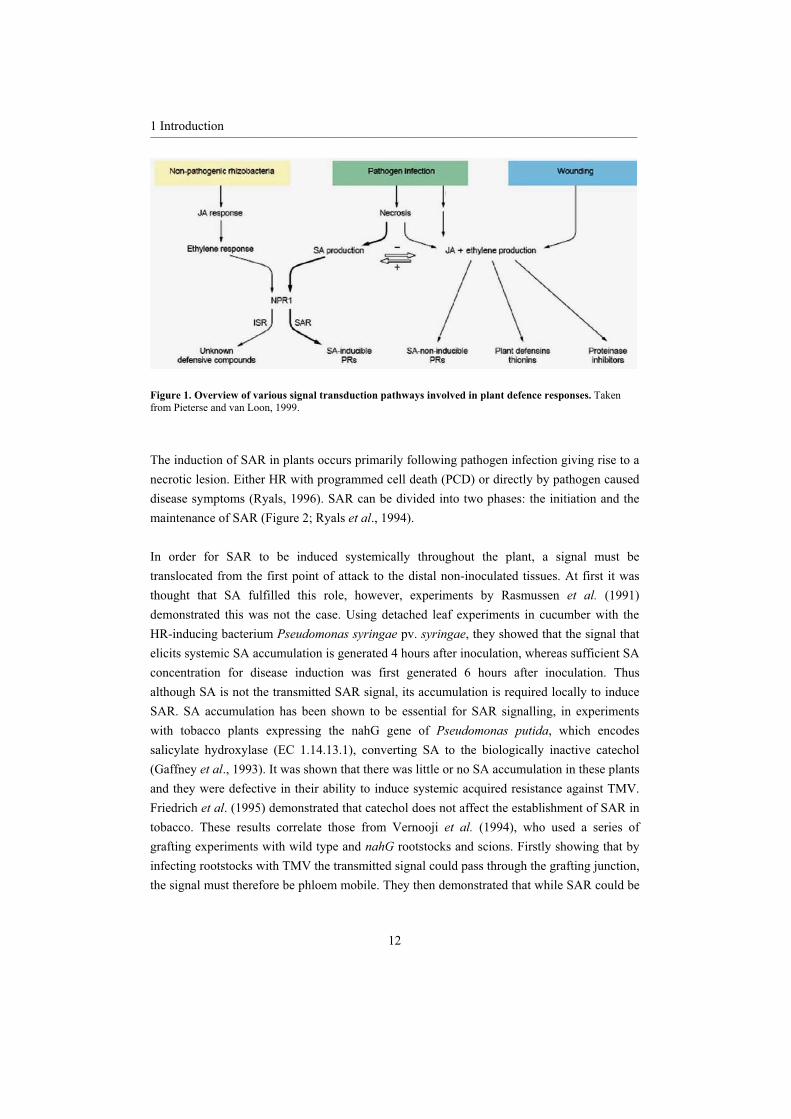
Figure 1. Overview of various signal transduction pathways involved in plant defence responses. Taken from Pieterse and van Loon, 1999.
The induction of SAR in plants occurs primarily following pathogen infection giving rise to a necrotic lesion. Either HR with programmed cell death (PCD) or directly by pathogen caused disease symptoms (Ryals, 1996). SAR can be divided into two phases: the initiation and the maintenance of SAR (Figure 2; Ryals et al., 1994).
In order for SAR to be induced systemically throughout the plant, a signal must be translocated from the first point of attack to the distal non-inoculated tissues. At first it was thought that SA fulfilled this role, however, experiments by Rasmussen et al. (1991) demonstrated this was not the case. Using detached leaf experiments in cucumber with the HR-inducing bacterium Pseudomonas syringae pv. syringae, they showed that the signal that elicits systemic SA accumulation is generated 4 hours after inoculation, whereas sufficient SA concentration for disease induction was first generated 6 hours after inoculation. Thus although SA is not the transmitted SAR signal, its accumulation is required locally to induce SAR. SA accumulation has been shown to be essential for SAR signalling, in experiments with tobacco plants expressing the nahG gene of Pseudomonas putida, which encodes salicylate hydroxylase (EC 1.14.13.1), converting SA to the biologically inactive catechol (Gaffney et al., 1993). It was shown that there was little or no SA accumulation in these plants and they were defective in their ability to induce systemic acquired resistance against TMV. Friedrich et al. (1995) demonstrated that catechol does not affect the establishment of SAR in tobacco. These results correlate those from Vernooji et al. (1994), who used a series of grafting experiments with wild type and nahG rootstocks and scions. Firstly showing that by infecting rootstocks with TMV the transmitted signal could pass through the grafting junction, the signal must therefore be phloem mobile. They then demonstrated that while SAR could be
1 Introduction__________________________________________________________________________________________________________________________________________________________________________________________________________________________________
13
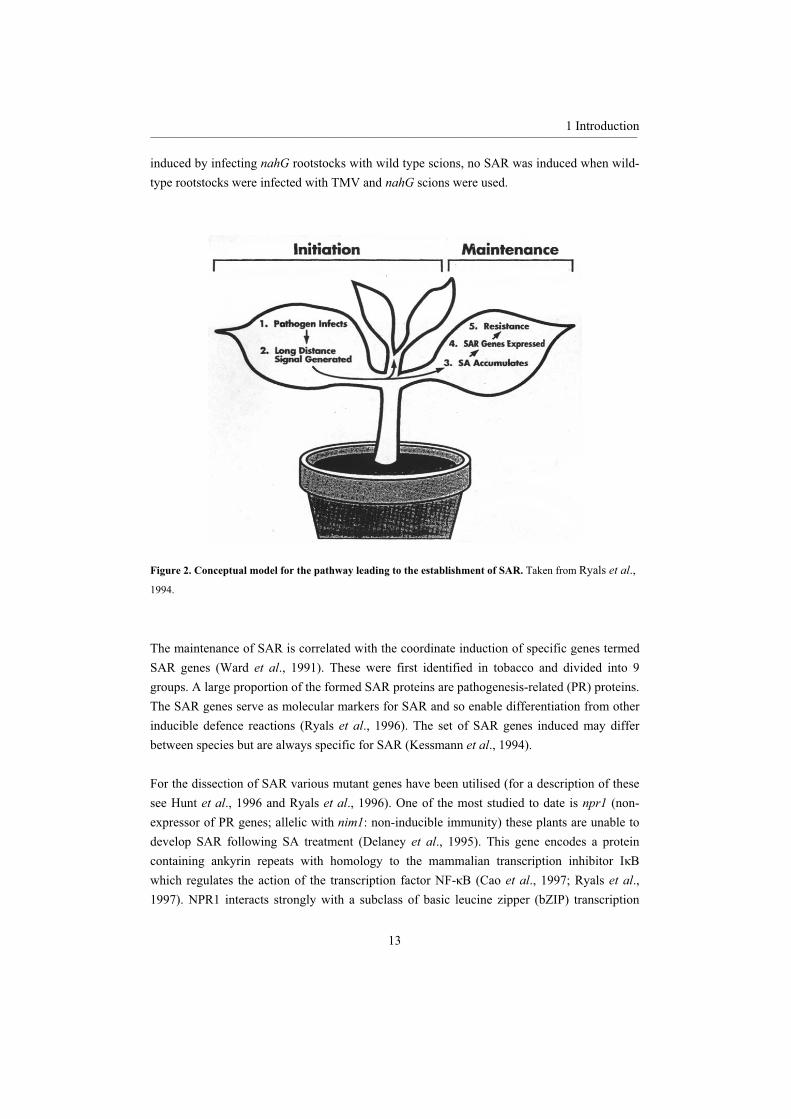
induced by infecting nahG rootstocks with wild type scions, no SAR was induced when wild-type rootstocks were infected with TMV and nahG scions were used.
Figure 2. Conceptual model for the pathway leading to the establishment of SAR. Taken from Ryals et al.,1994.
The maintenance of SAR is correlated with the coordinate induction of specific genes termed SAR genes (Ward et al., 1991). These were first identified in tobacco and divided into 9 groups. A large proportion of the formed SAR proteins are pathogenesis-related (PR) proteins. The SAR genes serve as molecular markers for SAR and so enable differentiation from other inducible defence reactions (Ryals et al., 1996). The set of SAR genes induced may differ between species but are always specific for SAR (Kessmann et al., 1994).
For the dissection of SAR various mutant genes have been utilised (for a description of these see Hunt et al., 1996 and Ryals et al., 1996). One of the most studied to date is npr1 (non-expressor of PR genes; allelic with nim1: non-inducible immunity) these plants are unable to develop SAR following SA treatment (Delaney et al., 1995). This gene encodes a protein containing ankyrin repeats with homology to the mammalian transcription inhibitor I Bwhich regulates the action of the transcription factor NF- B (Cao et al., 1997; Ryals et al.,1997). NPR1 interacts strongly with a subclass of basic leucine zipper (bZIP) transcription
1 Introduction__________________________________________________________________________________________________________________________________________________________________________________________________________________________________
14
factors (TGA; Zhang et al., 1999; van Wees et al., 2000). In an uninduced state the NPR1 protein is present in an oligomer form, the monomers are held together by intermolecular disulphide bridges, in the cytoplasm. Alteration in the redox status leads to reduction of the disulphide bridges releasing monomeric NPR1 which is translocated to the nucleus (Mou etal., 2003). Once in the nucleus NPR1 binds to a TGA, this stimulates DNA binding followed by transcription (Pieterse and van Loon, 2004). Although initially found to be induced by SA signalling with a role as a positive regulator of SAR (Mou et al., 2003). It has since been discovered to also function downstream of JA and ethylene signalling in ISR (Pieterse et al.,1998).
ISR is triggered by non-pathogenic Pseudomonas rhizobacteria interacting with the roots of plants and provides systemic protection against fungi, bacteria and viruses (van Loon et al.,1998). This form of resistance is SA-independent and involves the sequential action of JA and ethylene before activation of NPR1 (Pieterse et al., 1998). However, in comparison to SAR accumulation of the signalling compounds is not necessary, rather the induced plant appears to be sensitized to respond quicker to the action of JA and ethylene (Pieterse and van Loon, 1999). ISR does not induce PR-proteins or defensins, the exact mechanism behind ISR remains unclear (Pieterse et al., 1996; Pieterse et al., 2002).
When plants are wounded yet another systemic pathway network is triggered, in this case systemin, a polypeptide, transduces the systemic signal through the phloem (Pearce et al.,1991), in the systemic tissue JA and ethylene accumulation occurs (Wasternack and Partheir, 1997). A wide range of events follow which include the accumulation of proteinase inhibitors, thionins, plant defensins and basic PR-proteins (Farmer and Ryan, 1992; Doares et al., 1995; Wasternack and Partheir, 1997; Farmer et al., 2003). Also tritropheric interactions can be triggered leading to the emission of volatile compounds which attract predators of the insects feeding on the plants (Weber, 2002). Basal pathogen resistance can be categorised according to the signalling cascades which are generally involved in controlling defence responses. As such certain pathogens, primarily biotrophic, are SA controllable pathogens, e.g. Peronospora parasitica, disease is prevented from spreading by SA triggered responses whilst others, mainly necrotrophic, are combated by JA responses, e.g. Alternaria brassicicola (Penninckx et al., 1996; Thomma et al., 1998; Ton et al., 2002). Resistance against pathogens with mixed lifestyles (part biotroph part necrotroph), e.g. Xanthomonas campestris pv. armoraciae, is provided by SA- and JA or ethylene dependent defences (van Wees et al., 2000; Ton et al., 2002). It has been proposed that induced resistance such as SAR or ISR enhances existent basal resistance (Ton et al.,2002).

1 Introduction__________________________________________________________________________________________________________________________________________________________________________________________________________________________________
15
1.2 Signalling mechanisms
For induced resistance to be initiated in systemic tissues, requires the involvement of signalling mechanisms which transform the original local stimulus into a systemic response. One of the earliest signalling events that occur following pathogen perception is the opening of calcium channels in the plasma membrane allowing an influx into the cytoplasm (Jabs etal., 1997). Under normal circumstances Ca2+ concentrations are relatively low within the cell, in comparison high calcium concentrations are found in the extracellular spaces. This dramatic alteration in cytosolic Ca2+ after pathogen recognition leads to induction of various defence responses via calcium regulated genes such as calmodulin and calmodulin-like protein kinases (Ranjeva et al., 1993; Harmon, 1997) and an induction of reactive oxygen species (ROS).
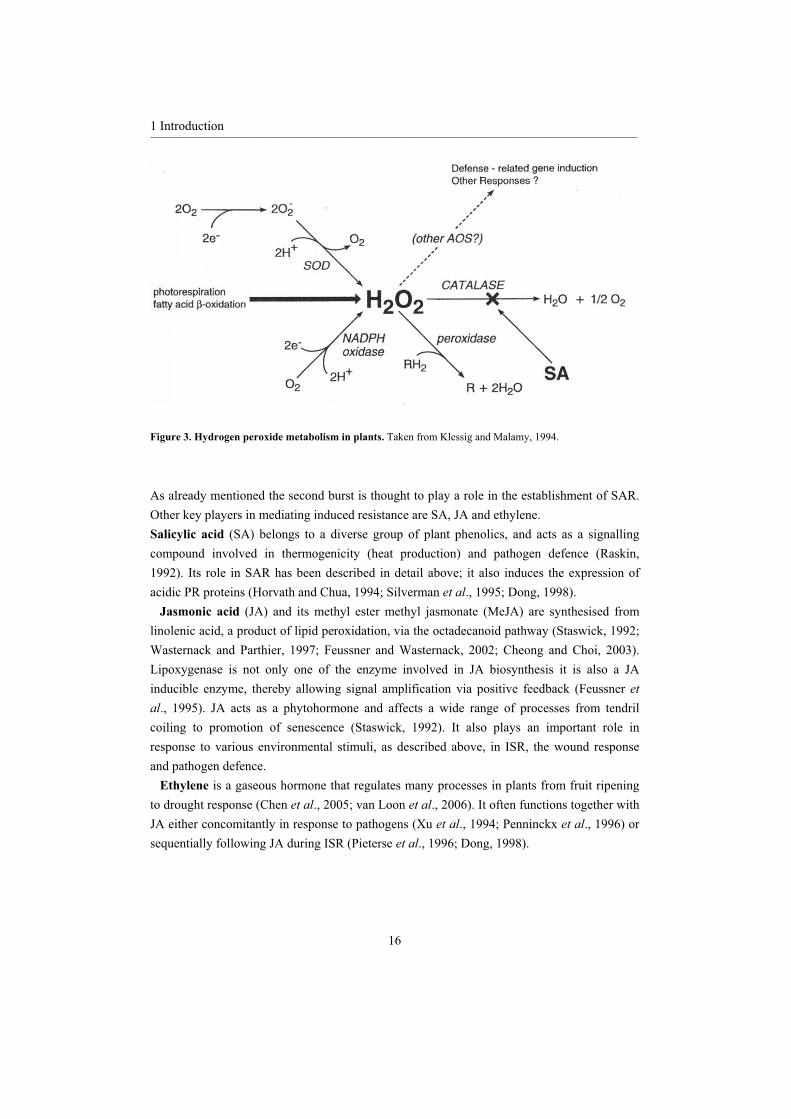
Rapid production of ROS through an oxidative burst is a hallmark of all plant defence responses (Levine et al., 1994). The oxidative burst is biphasic following infection with an avirulent pathogen: a rapid weak transient accumulation of ROS (Phase I); followed by a second, massive prolonged oxidative burst (Phase II; Lamb and Dixon, 1997). Phase I occurs within minutes of infection, both compatible and incompatible, and is regarded to be a biologically non-specific reaction (Lamb and Dixon, 1997). Whereas the later Phase II (3-6 hours later) is thought to correlate with the establishment of disease resistance (Levine et al.,1994). ROS include hydrogen peroxide (H2O2), superoxide anion (O2
.-), and hydroxyl ion (OH-); whereby the latter being the most reactive and the former the most stable. These intermediates are unavoidable by-products of many reactions that take place within the cell, i.e. -oxidation (see Figure 3).
Under normal circumstances a number of detoxifying processes, i.e. antioxidants, catalases, peroxidases, superoxide dismutase (SOD), occur to curtail any possible cellular damage. However, during many incompatible interactions large quantities of ROS are produced extracellularly, either as O2
- (which is then converted into H2O2), or directly as H2O2. As stated above H2O2 is the most stable ROS, it is also able to cross the plasma membrane and so can act as an intracellular signal. This molecule is thought to mediate various responses including: cross-linking of proteins (Bradley et al., 1992; Brisson et al., 1994); cross-linking of hydroxycinnamic alcohols into lignin (Iiyama et al., 1994); lignification (Nicholson and Hammerschmidt, 1992; Olson and Varner, 1993); direct toxicity to pathogens (Chen et al.,1993; Medhy, 1994); altering the redox status of the cell (Hammond-Kosack and Jones, 2000); inducing HR (Tenhaken et al., 1995; Lamb and Dixon, 1997). Further a dual concentration-dependent role for H2O2 has been observed (Levine et al., 1994). At high concentrations, it is responsible for cell death therefore functioning in the containment of pathogens in the HR, while at low concentrations it induces antioxidant gene expression providing protection for the neighbouring cells.
1 Introduction__________________________________________________________________________________________________________________________________________________________________________________________________________________________________
16
Figure 3. Hydrogen peroxide metabolism in plants. Taken from Klessig and Malamy, 1994.
As already mentioned the second burst is thought to play a role in the establishment of SAR. Other key players in mediating induced resistance are SA, JA and ethylene. Salicylic acid (SA) belongs to a diverse group of plant phenolics, and acts as a signalling compound involved in thermogenicity (heat production) and pathogen defence (Raskin, 1992). Its role in SAR has been described in detail above; it also induces the expression of acidic PR proteins (Horvath and Chua, 1994; Silverman et al., 1995; Dong, 1998).
Jasmonic acid (JA) and its methyl ester methyl jasmonate (MeJA) are synthesised from linolenic acid, a product of lipid peroxidation, via the octadecanoid pathway (Staswick, 1992; Wasternack and Parthier, 1997; Feussner and Wasternack, 2002; Cheong and Choi, 2003). Lipoxygenase is not only one of the enzyme involved in JA biosynthesis it is also a JA inducible enzyme, thereby allowing signal amplification via positive feedback (Feussner etal., 1995). JA acts as a phytohormone and affects a wide range of processes from tendril coiling to promotion of senescence (Staswick, 1992). It also plays an important role in response to various environmental stimuli, as described above, in ISR, the wound response and pathogen defence.
Ethylene is a gaseous hormone that regulates many processes in plants from fruit ripening to drought response (Chen et al., 2005; van Loon et al., 2006). It often functions together with JA either concomitantly in response to pathogens (Xu et al., 1994; Penninckx et al., 1996) or sequentially following JA during ISR (Pieterse et al., 1996; Dong, 1998).

1 Introduction__________________________________________________________________________________________________________________________________________________________________________________________________________________________________
17
1.3 Chemical activators
SAR can be induced not only by pathogens, but also by chemical activators. White (1979) first showed that exogenously applied SA induces resistance in tobacco against TMV, since then it has been found to induce SAR in a wide range of plants (Ward et al., 1991). Chemical activation of SAR, and so the plants inherent disease resistance mechanisms, offers a novel method for crop protection.
However, due to the small concentration difference between SAR induction and phytotoxicity of SA, this chemical has not been considered for commercial use (Dietrich et al., 1999), instead biologically active analogues of SA have been developed (Figure 4). Two of these: 2,6-Dichloroisonicotinic acid (INA) (Métraux et al., 1991) and Benzo(1,2,3)thiadiazole-7-carbothioic acid S-methyl ester (BTH), the active ingredient of Bion® developed by Ciba-Geigy (Friedrich et al., 1996; Görlach et al., 1996; Lawton et al., 1996), have shown induction of the same response as SA, e.g. PR protein expression.
Figure 4. SA, INA and BTH. Salicylic acid (SA); 2,6-Dichloroisonicotinic acid (INA); and Benzo(1,2,3) thiadiazole-7-carbothioic acid S-methyl ester (BTH, the active ingredient of Bion®).
Evidence that INA and Bion® act as SA analogues has been attained from various experiments. Application of INA and Bion® can overcome the disease susceptibility displayed in SA deficient nahG plants (Delaney et al., 1994; Lawton et al., 1996), which demonstrates that both compounds act at the point of SA accumulation or downstream of it. Further experiments carried out by Delaney et al. (1995) support the SA analogue theory. Using npr1(allelic with nim) mutants, which are unable to develop SAR following SA treatment, it was found that neither INA (Delaney et al., 1995) nor Bion® (Lawton et al., 1996) treatment could induce SAR. This supports the above evidence that both compounds induce plant defenceresponses via the same signal transduction pathway.

1 Introduction__________________________________________________________________________________________________________________________________________________________________________________________________________________________________
18
Both compounds have been tested under field conditions. As they provide a broad spectrum resistance, there is less chance of field resistance that is commonly the case following prolonged use of certain pesticides. Molina et al. (1998) demonstrated that when Bion®
application was combined with fungicides, greater protection could be provided by smaller application volumes than when either product was used individually. This would make crop protection more environmentally friendly as the amount of chemicals used could be reduced.
Paraquat is a bipyridyl herbicide that acts by accepting electrons from photosystem I thus blocking photosynthesis (Ananieva et al., 2002). This pro-oxidant chemical can also transfer electrons from other compounds, e.g. NADPH, subsequent oxidation results in the production of free radicals often in the form of superoxide anions (Strobel and Ku , 1995; Patra and Panda, 1998; Hauschild and von Schaewen, 2003; Ananieva et al., 2004). Uncontrolled excess superoxide anion formation can alter the redox potential of plant cells and at high doses can eventually result in cell or plant death. In comparison when Paraquat is applied to plants at sub lethal concentrations it was found to induce SAR (Strobel and Ku , 1995).
1.4 Biological inducers
All of the above listed forms of induced resistance (SAR, ISR and wound response) have been described for dicotyledons. The question presents itself whether SAR and/ or other forms of pathogen-mediated induced resistance also occur in monocotyledons. There are indications that differences in induced resistance exist between monocotyledons and dicotyledons. Primary infection of rice with either Pseudomonas syringae pv. syringae (bacterium) or Magnaporthe grisea (fungus) did not alter local or systemic SA accumulation (Silverman etal., 1995). In comparison SA was found to increase more than 20 fold in local TMV infected leaves and 5 - 10 fold in systemic uninoculated leaves of SAR induced tobacco plants (Malamy et al., 1990). In addition PR-1 expression, a commonly used molecular marker for SAR in dicotyledons (Gozzo et al., 2003), was found not to correlate with resistance in wheat (Molina et al., 1999). Therefore if pathogen-mediated SAR does occur in monocotyledons, it would be important to determine how it functions and what mechanisms are involved.
Pathogenic induction of broad spectrum resistance has been shown to be induced in rice, a monocotyledon (Smith and Métraux, 1991). The authors used a primary infection with the HR causing Pseudomonas syringae pv. syringae followed by a systemic challenge inoculation with Magnaporthe grisea. Lower systemic fungal growth was found and increased defence gene activity in local but not systemic leaves. The present study will investigate the pre-infiltration of a variety of bacteria into primary barley leaves (another monocotyledon) and its effects on secondary systemic fungal infection. Powdery mildew was chosen for the secondary infection in this test system as it provides a different type of pathogen. Additionally a great deal is known about the barley-powdery mildew pathosystem.

1 Introduction__________________________________________________________________________________________________________________________________________________________________________________________________________________________________
19
1.5 Barley-powdery mildew interaction
Powdery mildew is a major barley disease in temperate climates resulting in significant crop yield losses, 5-20 % and occasionally as much as 40 % (Chaure et al., 2000). Therefore its control is of economical importance, making it an ideal candidate test system for the investigation of the effect of biological and chemical resistance inducers.
Figure 5. Model for the combined early responses of barley leaf epidermis and mesophyll to penetration attempts by powdery mildew fungus. Taken from Gregersen et al., 1997.
Barley powdery mildew, the ascomycete fungus Blumeria (syn. Erysiphe) graminis f. sp. hordei (Bgh) is an obligate biotroph, such that it requires barley for its life cycle. It exclusively attacks epidermal leaf tissue of barley (Hordeum vulgare L.) plants (Hammond-Kosack and Jones, 1996).
Infection of a susceptible barley cultivar by a virulent fungal isolate results in a compatible reaction (disease). However when resistant barley is attacked by an avirulent fungus, cell wall appositions (papilla) are formed below the germinating hyphae (Figure 5). These papillae contain callose depositions, phenolic compounds and silicon (Wei et al., 1998). A correlation

1 Introduction__________________________________________________________________________________________________________________________________________________________________________________________________________________________________
20
between the absence of H2O2 in papillae and penetration success has been seen for barley powdery mildew fungus (Hückelhoven et al., 1999). In addition PR proteins and phytoalexinsare produced (Gregersen et al., 1997) and SAR is induced (Kessmann et al., 1994).
1.6 Aims
1) Testing the system. The first aim of this thesis was to systematically investigate the effect of local pre-treatment of barley plants with biological or chemical inducers and to determine the impact on systemic powdery mildew growth.
2) Systemic induced resistance: Looking for the responsible mechanisms.The effects of the local treatment in the local and systemic leaves were analysed and compared to that found following the challenge powdery mildew infection. Are there differences between the local and systemic leaves? Which systemically induced mechanisms are responsible for the systemic resistance provided? In particular, I asked: a) Did defence proteins or antimicrobial substances accumulate systemically following pre-treatment alone? Therefore did the pre-treated plant reprogram itself to pre-inducedefence responses in the event of a later pathogen attack? b) Or does enhanced accumulation only become apparent after the secondary powdery mildew infection, thus resembling a mechanism based on priming. Further, did the plant enter a state of enhanced ability to respond more strongly and more rapidly to a challenge pathogen?
3) Role of signalling cascades.Which signalling cascades were triggered in order to mediate the mechanisms described above for the observed systemic induced resistance?
2 Materials and Methods __________________________________________________________________________________________________________________________________________________________________________________________________________________________________
21
2 Materials and Methods
2.1 Biological material
2.1.1 Plant
Barley (Hordeum vulgare cv. Villa) was obtained from Raiffeisen, Monheim.
2.1.2 Fungus
Blumeria (syn. Erysiphe) graminis f. sp. hordei (Bgh) was a gift from Bayer AG, Monheim, Germany.
2.1.3 Bacteria
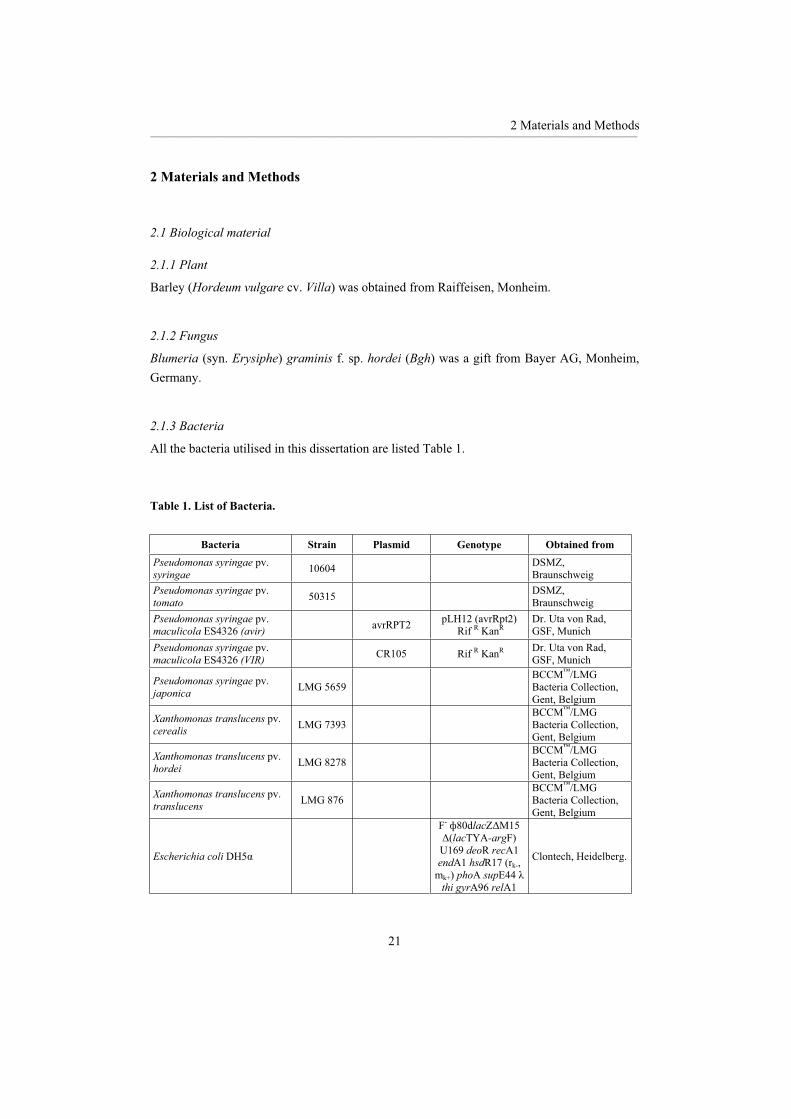
All the bacteria utilised in this dissertation are listed Table 1.
Table 1. List of Bacteria.
Bacteria Strain Plasmid Genotype Obtained from Pseudomonas syringae pv.syringae 10604 DSMZ,
Braunschweig Pseudomonas syringae pv. tomato 50315 DSMZ,
Braunschweig Pseudomonas syringae pv. maculicola ES4326 (avir) avrRPT2 pLH12 (avrRpt2)
Rif R KanRDr. Uta von Rad, GSF, Munich
Pseudomonas syringae pv. maculicola ES4326 (VIR) CR105 Rif R KanR Dr. Uta von Rad,
GSF, Munich
Pseudomonas syringae pv. japonica LMG 5659
BCCM™/LMGBacteria Collection, Gent, Belgium
Xanthomonas translucens pv. cerealis LMG 7393
BCCM™/LMGBacteria Collection, Gent, Belgium
Xanthomonas translucens pv.hordei LMG 8278
BCCM™/LMGBacteria Collection, Gent, Belgium
Xanthomonas translucens pv. translucens LMG 876
BCCM™/LMGBacteria Collection, Gent, Belgium
Escherichia coli DH5
F- 80dlacZ M15 (lacTYA-argF)
U169 deoR recA1 endA1 hsdR17 (rk-,
mk+) phoA supE44thi gyrA96 relA1
Clontech, Heidelberg.

2 Materials and Methods __________________________________________________________________________________________________________________________________________________________________________________________________________________________________
22
In the literature it has been described that P.s. pv. japonica is a synonym for P s. pv. syringaeand that X.t. pv. hordei is a synonym for X.t. pv. translucens (Young et al., 1996). However, in the course of this dissertation it was found that these bacteria displayed differing growth patterns in barley and induced contrasting results. Therefore the names found in Table 1 were used throughout this dissertation.
2.1.4 Plasmids
For a full list of all the plasmids utilised for this dissertation see Table 2.
Table 2. List of Plasmids.
Name Function / Full name In Vector Accession Nr
Original sequence
length (bp)
Probe beginsat bp
number:
Fragmentlength (bp)
Primers used for cloning of
fragment
pGEM-T Cloning vector pBluescript
SK + Cloning vector
Hv239LOX Lipoxygenase fragment pGEM-T U56406 3055 2464 455 5HvLOX and
3HvLOX
Hv322PR-1b Basic pathogenesis-related 1 fragment pGEM-T X74940 760 120 441 5HvPR-1b and
3HvPR-1b
Hv334PAL Phenylalanine
ammonium lyase fragment
pGEM-T Z49145 1671 474 896 5HvPAL and 3HvPAL
Hv337BCI-4 Barley chemically induced 4 fragment pGEM-T AJ250283 1007 233 500 5HvBCI-4 and
3HvBCI-4
Hv383CHS Chalcone synthase fragment pGEM-T X58339 5231 4185 423 5HvCHS and
3HvCHS
Hv385ACCO 1-Aminocyclopropane -1-carboxylate oxidase
fragment pGEM-T AF049889 * 1300 462 303 5HvACCOout
and 3HvACCO
Hv387SAMS S-adenosylmethionine synthetase fragment pGEM-T D63835 1360 742 587 5HvSAMSout
and 3HvSAMS
Hv400CHN Chitinase fragment pGEM-T X78672 1014 222 476 5HvCHN and 3HvCHN
Hv402APX Ascorbate peroxidase fragment pGEM-T AJ006358 1051 478 502 5HvAPX and
3HvAPX
Hv411GLCD -1,3-Glucanase fragment pGEM-T AJ271367 1258 732 324 5HvGLCD and
3HvGLCD
Hv418MRP putative MRP2 / ABC-transporter fragment
pBluescript SK + HM03H07 639 20 600 5HvMRP and
3HvMRP
* Rice accession number listed as no barley accession number available

2 Materials and Methods __________________________________________________________________________________________________________________________________________________________________________________________________________________________________
23
2.2 Chemicals
Chemicals were purchased from Sigma, Fluka, Roth (Karlsruhe) Bio-rad (Munich), Roche (Mannheim) unless otherwise stated in the text.
2.2.1 Primer information
All primers used for this dissertation were obtained from MWG Biotech (Ebersberg) and are listed in Table 3.
Table 3. Primer List.
Primer Sequence 5HvLOX 5' - ATG GCC GGG TAC ATC CCT AA - 3' 3HvLOX 5' - CAC ACA CAC AAG GCA GCT CAA - 3'
5HvPR-1b 5' - CAG CCG CCA TGG TTA ACC TT - 3' 3HvPR-1b 5' - TCT GTC CAA CGA TGT TCC CG - 3' 5HvPAL 5' - AAC TTC CAG GGC ACA CCC AT - 3' 3HvPAL 5' - GTG CTT GCC TTG GTT CAT GG - 3'
5HvBCI-4 5' - CGG TTG CGA GTA TGC ATT TG - 3' 3HvBCI-4 5' - TTC TTC GGG ACA AAC CTT TCC - 3' 5HvCHS 5' - ACT GGA ACT CCG TCT TCT GG - 3' 3HvCHS 5' - ATA CAA ACC ACG CAC GGT AG - 3'
5HvACCOout 5' - ACC TGC TGT GCG AGA ATC T - 3' 3HvACCO 5' - TCT TGT ACC TGC CGT TGG T - 3'
5HvSAMSout 5' - ACC ATC TTC CAC CTG AAC C - 3' 3HvSAMS 5' - CTT CTT ACT TCC GAG GAG CA - 3' 5HvCHN 5' - ACA CGT ACG ACG CCT TCA T - 3' 3HvCHN 5' - CCC GCC GTT GAT GAT ATT - 3'
3HvCHNIN 5' - AGA ACC AAA TGG CCG TTC TG - 3' 5HvAPX 5' - CAA GGG TTC TGA CCA CCT A - 3' 3HvAPX 5' - ACC ACT GAC AGC GTT CAA - 3'
5HvGLCD 5' - TGA CCT ACA CGT CCC TGT T - 3' 3HvGLCD 5' - CAT GCT TGG TTG CAC TCT - 3'
3HvGLCDin 5' - ACT AGA ACT GGA TGT TGT ATG C - 3' 5HvMRP 5' - AGC TTC GTG ACG TCC ATG T - 3' 3HvMRP 5' - TGT CAA GGA CCG AGG TGA T - 3'
T7 5' - TAA TAC GAC TCA CTA TAG GG - 3' SP6 5' - CGA TTT AGG TGA CAC TAT AG - 3'

2 Materials and Methods __________________________________________________________________________________________________________________________________________________________________________________________________________________________________
24
2.3 Equipment
The equipment used for this dissertation is listed in Table 4.
Table 4. Equipment list.
Equipment Type Manufacturer Location Centrifuge Allegra 25R Rotor TS-5.1-500
Beckmann Coulter Unterschliessheim-Lohhof
Centrifuge 5415 C Standardrotor F 45-30-11
Eppendorf Hamburg
Centrifuge 5417 R
Centrifuges
Standardrotor F 45-30-11 Eppendorf Hamburg
Mini Protean® 3 Gel System Bio-Rad Munich Electrophoresis systems Multiphor II Electrophoresis
Unit Amersham Biosciences Freiburg
Fluorescence Imaging System LAS3000 Raytest Straubenhardt
Hybridisation Incubator 7601 GFL Burgwedel Hybrisation ovens
Hybridizer HB-1000 UVP Inc Upland, CA Bühler Shaker: KS 15 CONTROL Johanna Otto GmbH Hechingen
Incubation shaker Bühler Incubator hood: TH 15 Johanna Otto GmbH Hechingen
Isoelectric Focusing System EttanTM IPGphorTM Amersham Biosciences Freiburg
PCR machine Robo-Cycler® Gradient 96 Temperature Cycler Stratagene Heidelberg
Photometer Uvikonxl Bio-Tek Instruments Neufahm Explorer weighing scales OHAUS Giessen Fine weighing scales AE160 Mettler Giessen PG503-S DeltaRange® Mettler Toledo Giessen
Scales
Type 1712 Sartorius GmbH Göttingen Scanner Image Scanner Amersham Biosciences Freiburg Thermoblock Thermomixer Comfort Eppendorf Hamburg UV linker Stratalinker® 1800 Stratagene Heidelberg Vacuum centrifuge Concentrator 5301 Eppendorf Hamburg Water purification system Milli-Q Gradient A10 Millipore Schwalbach
2.4 Cultivation of biological material
2.4.1 Plant material
Barley was grown in 9 x 9 x 10 cm3 pots containing growing medium Einheitserde® ED 73 (Ferdinand Irnich GmbH and Co. KG, Jülich) in controlled environment chambers with a 16 hour photoperiod at 150 - 200 µmol m-2 s-1, at 20 °C day/ 15 °C night, and at a constant 70 % relative humidity.

2 Materials and Methods __________________________________________________________________________________________________________________________________________________________________________________________________________________________________
25
2.4.2 Fungal material
Blumeria graminis f. sp. hordei (Bgh; syn. Erysiphe graminis f. sp. hordei) was maintained on barley cv. Villa plants in a spore-proof controlled environment chambers with a 16 hour photoperiod at 150 - 200 µmol m-2 s-1, at 20 °C day / 15 °C night, and at a constant 70 % relative humidity. Every 7-9 days uninfected 1 week old barley plants were inoculated with Bgh conidia by shaking heavily infected plants over them.
2.4.3 Bacterial material
Pseudomonas syringae pv. syringae and Pseudomonas syringae pv. tomato were grown at 28 °C, 150 rpm in an adapted DSMZ medium 54 (20 g glucose, 10 g yeast extract in 1 l Milli-Q water) in sterile baffled shaker flasks.
Pseudomonas syringae pv. maculicola avir and VIR were grown at 28 °C, 150 rpm in King’s B medium (20 g tryptone, 10 g glycerol, 1.5 g K2HPO4, 1.5 g MgSO4 in 1 l Milli-Q water) containing the appropriate antibiotics (concentrations rifampicin 50 mg l-1, kanamycin 50 mg l-1 ) in sterile baffled shaker flasks.
Pseudomonas syringae pv. japonica, Xanthomonas translucens pv. cerealis, Xanthomonastranslucens pv. hordei and Xanthomonas translucens pv. translucens were grown at 28 °C, 100 rpm in LMG medium 14 (15 g tryptone, 5 g soya peptone, 5 g NaCl in 1 l Milli-Q water, pH 7.3) in sterile baffled shaker flasks (Pseudomonas) or conical flasks (Xanthomonas).
Escherichia coli DH5 were grown at 37 °C, 150-200 rpm in either LB medium (10 g NaCl, 5 g yeast extract, 10 g bacto-tryptone in 1 l Milli-Q water, pH 7.5); 2YT medium (5 g NaCl, 10 g yeast extract, 16 g bacto-tryptone in 1 l Milli-Q water, pH 7.5); SOC medium (2 g bacto-tryptone, 0.5 g yeast extract, 10 mM NaCl, 2.5 mM KCl, 20 mM Mg2+, 20 mM glucose in 100 ml sterile water); or on standard I nutrient agar (37 g in 1 l Milli-Q water, pH 7.5; Merck) plates. When bacterial growth under selective pressure was desired, e.g. to select transformed cells, ampicillin (50 mgl-1) was added to the respective medium.
For the long term storage of bacteria, glycerol stocks were prepared. 1 Vol overnight culture was mixed thoroughly with 1 Vol sterile glycerol and shock frozen in liquid nitrogen before storage at -80 °C.
2.5 Chemical pre-treatment
Bion® (benzo (1,2,3) thiadiazole-7-carbothioic acid S-methyl ester) in WG 50 formulation (Novartis, Frankfurt) was diluted in Milli-Q water to give a final concentration of 100 µM, unless otherwise stated. Paraquat (methyl viologen, Sigma) was first dissolved in water to

2 Materials and Methods __________________________________________________________________________________________________________________________________________________________________________________________________________________________________
26
give a 100 mM stock solution. This stock solution was diluted with Milli-Q water to give a final concentration of 10 µM. Salicylic acid (SA) as sodium salicylate (Merck) was first dissolved in water to prepare a 300 mM stock solution which was diluted to a final concentration of 300 µM. Due to its low water solubility, 2,6-dichloroisonicotinic acid (INA, Sigma) was pre-dissolved in N,N-dimethylformamide (DMF) to give a stock solution of 300 mM, which was then diluted in Milli-Q water to give the desired concentration of 300 µM. All solutions were freshly prepared for each individual experiment.
Six day old seedlings (1 leaf stage) were finely sprayed with one of the diluted chemical solutions described above until imminent run-off, approximately 2-3 ml/ cm2.
2.6 Bacterial pre-infiltration
Overnight log-phase cultures were pelleted, washed twice with 100 mM MgCl2, resuspended, and diluted in 100 mM MgCl2 to the desired concentration [generally 1 x 10⁶, 1 x 10⁸ or 1 x 10¹⁰ colony-forming units (cfu) ml-1]. The bacterial solutions were infiltrated into the abaxial (upper leaf) side of the first leaf at the 1 leaf stage using a 1 ml syringe without a needle. Mock infiltrations were performed with 100 mM MgCl2.
Macroscopic symptoms were documented 3 - 5 days after bacterial infection. Bacterial growth in planta was assessed by homogenising discs (Ø 5 mm) sampled from the infiltrated areas of three different leaves in 1 ml 200 mM sodium phosphate buffer (pH 6). For local samples, discs (Ø 5 mm) were taken at a position 1 cm away from the visible infiltrated area. Systemic samples were taken from systemic non-infiltrated leaves. Appropriate dilutions were plated on either DSMZ medium 54 (P.s.syr and P.s.tom); King’s B medium containing rifampicin and kanamycin (Psm); or LMG medium 14 (P.s.jap, X.t.cer, X.t.hor and X.t.tra) and colony numbers were quantified 2 - 3 days later.
2.7 Fungal inoculation
Five days after plant activator treatment or bacterial pre-infiltration, treated plants were transported at 09:00 (± 30 min) to a spore-proof controlled environment chamber. The barley plants were then inoculated with Bgh conidia by shaking heavily infected plants over them.
The inoculated experimental plants were incubated in the spore-proof controlled environment chamber as described above, for 7 - 9 days to assess the development of disease or until harvesting for biochemical or molecular biological analyses.
Following this incubation period the leaves were macroscopically examined by eye to determine the percentage leaf area infected (Abbott, 1925).

2 Materials and Methods __________________________________________________________________________________________________________________________________________________________________________________________________________________________________
27
2.8 Harvesting of plant material
Harvesting of plant material was carried out at the respective time intervals, using a scalpel. The plants were cut at the branch point; the first leaf (local sample) was separated from the rest of the plant (systemic sample). Thirty plants per treatment and time point were sampled, the leaves for local or systemic sample were pooled respectively, placed in aluminium bags and directly shock frozen in liquid nitrogen and stored at -80 °C until further use.
2.9 Data analysis
The statistical analysis was performed by One-way ANOVA (P = 0.05) using Statistica (Version 6.0, StatSoft Inc., Tulsa, OK, USA). Subsequently Tukey test was applied to the data set of unequal n to test the significance of difference between the treatments (P < 0.05).
2.10 Molecular biological methods
Standard procedures such as nucleic acid photometric quantification, nucleic acid separation by agarose gel electrophoresis and ethidium bromide staining of agarose gels were carried out as described by Sambrook (2001) and Ausubel (2002).
2.10.1 RNA isolation
Total RNA was isolated from 450 mg frozen leaf material using TRIzol®-reagent (Invitrogen, Karlsruhe) following the manufacturer’s guidelines.
Due to RNA degradation problems in local leaf samples from X.t.tra and X.t.hor pre-infiltrated plants, an alternative RNA isolation method was necessary. Total RNA from 500 mg frozen leaf material was isolated according to the “extraction of total RNA” method described by Pawlowski et al. (1994). A 1:1 mixture of RNA extraction buffer (100 mM LiCl, 1 % SDS, 100 mM Tris-HCl pH 9.0, 10 mM EDTA) and TE-saturated phenol (pH 8.0, 0.1 % hydroxyquinoline) was prepared and heated to 90 °C in a water bath under a fume hood. Frozen leaf material (500 mg) was ground to a fine powder, 0.5 ml cold RNA extraction buffer was added and ground well to produce a slurry. This slurry was transferred to a 15 ml conical tube to which 2 ml of the well mixed warmed phenol/ extraction buffer was added. The mixture was vortexed for 5 minutes to obtain a milky foamy suspension. Centrifugation took place for 30 minutes at 3 400 g at room temperature. The supernatant was transferred to a fresh 15 ml conical tube where it was extracted with 1 Vol chloroform, briefly agitated and left to incubate for 3 minutes at room temperature before being centrifuged (10 minutes, 5 300 g, 4 °C). Chloroform extraction was repeated. For RNA precipitation the supernatant was transferred to fresh 1.5 ml reaction tubes and mixed with 8 M LiCl to give a final concentration of 2 M LiCl and incubated for 3 - 4 hours at 4 °C, followed by centrifugation

2 Materials and Methods __________________________________________________________________________________________________________________________________________________________________________________________________________________________________
28
(20 minutes, 12 000 g, 4 °C). The RNA pellet was washed with 75 % ethanol, before being resuspended in 300 µl 0.3 M sodium acetate (pH 5.2), this suspension was extracted with 1 Vol chloroform as described above. A second round of RNA precipitation with 2.5 Vol 100 % ethanol for 15 minutes at room temperature was followed by centrifugation (15 minutes, 12 000 g, 4 °C). The pellet was washed with 75 % ethanol before being air dried for 45 minutes. The pellet was dissolved in 40 µl sterile water and incubated for 10 minutes at 65 °C before being stored at -80 °C until further use.
2.10.2 cDNA synthesis
DNA fragments from the coding region of barley genes were prepared for first strand cDNA synthesis from total RNA isolated from: inoculated (GlcD); ozone treated (PR-1b, BCI-4, PAL, CHN, APX); with Bion® treated (LOX); or with Bion® treated and inoculated (CHS, ACCO, SAMS) barley plants. Prior to cDNA synthesis the RNA templates were heated for 10 minutes at 65 °C to melt secondary structures, then immediately cooled on ice to prevent secondary structure reformation. The sample was collected at the bottom of tube by brief centrifugation then added to one of the reaction mixtures described below.
Generally 10 µl aliquots were prepared freshly before each PCR. cDNA synthesis was carried out with the following reaction mixture and 1 µg total RNA (end concentration: 100 ng/ µl): 1 mM dNTPs, 2.5 µM oligo dT, 1 x appropriate buffer and 200 Units M-MULV reverse transcriptase (Promega, Mannheim). This mixture was incubated for 1 hour at 42 °C before a final denaturation step of 5 minutes at 95 °C. The samples were briefly incubated on ice before further use.
Alternatively iScriptTM (Bio-rad, Munich) was employed to synthesize cDNA, in this case the manufacturer’s recommendations were followed. Here lower RNA concentrations were employed (final RNA concentration: 50 ng/µl). Following preparation the complete mixture was incubated slightly differently to the above described method for 5 minutes at room temperature, 30 minutes at 42 °C with a final 5 minutes at 85 °C. The samples were briefly incubated on ice before further use.
2.10.3 PCR amplification of cDNA probes
cDNA clones were amplified using PCR conditions described in Table 5. All 50 µl reaction mixtures consisted of 1 µM primer (5’ and 3’); 2 mM MgCl2; 10 µl cDNA aliquot (with either 0.5 or 1 µg RNA starting material); 1 x appropriate buffer; 1.25 Units of Taq polymerase (Fermentas, St. Leon-Rot) and sterile water. The amplification reactions were overlaid with mineral oil to prevent evaporation.

2 Materials and Methods __________________________________________________________________________________________________________________________________________________________________________________________________________________________________
29
Table 5. PCR Programme.
Length(minutes)
Temperature (° C)
Denaturation 6 94 Denaturation 1 94 Annealing 1 * 35 x Elongation 1 72 Final Elongation 5 72
* See each individual primer pair in Table 6.
2.10.4 Gel extraction
The PCR products were separated on 1.3 % agarose gel in 1 x TAE buffer (40 mM Tris, 18 mM acetic acid, 1 mM EDTA), GeneRuler™ 100 bp ladder (Fermentas, St. Leon-Rot) allowed size comparison. When a single product of the correct size could be identified, the band was excised from the surrounding gel. DNA was extracted from the gel piece using QIAquick® gel extraction kits (Qiagen, Hilden) according to the manufacturer’s guidelines. The DNA was finally eluted from the column with 30 µl sterile water.
2.10.5 Cloning and sequencing of PCR Products
2.10.5.1 Ligation
The PCR Products were cloned into pGEM®-T Vector (Promega, Mannheim). To ensure that excess insert (PCR Product) was present in the reaction mixture, a ratio of 3:1 insert: vector molecules was used.
10 µl aliquot contained 3 Vol insert, 1 Vol pGEM®-T, 1 x Rapid Ligation Buffer, 3 units T4 DNA ligase. After thorough mixing, the ligation was allowed to incubate for 2 hours at room temperature and then overnight at 4 °C.
2.10.5.2 Preparation of chemically competent E.coli cells
Dimethyl sulphoxide (DMSO) competent E.coli cells were prepared using a modified method from Inoue et al. (1990).
E.coli cells strain DH5 from an overnight culture (1 ml) were used to inoculate 250 ml Medium A (2 % (w/v) tryptone, 0.5 % (w/v) yeast extract, 10 mM NaCl, 2.5 mM KCl, 10 mM MgCl2, 10 mM MgSO4 and Milli-Q water) in a sterile conical flask. The culture was incubated at 30 °C, 100 rpm until the logarithmic growth phase was reached (OD600 = 0.6).
2 Materials and Methods __________________________________________________________________________________________________________________________________________________________________________________________________________________________________
30
The bacteria were transferred to sterile chilled 50 ml conical tubes and incubated on ice for 10 minutes. Following which the cells were sedimented by centrifugation (10 minutes, 2 500 g, 4 °C). After removal of the supernatant, the bacterial cells were carefully resuspended in 20 ml ice cold resuspension buffer (10 mM Pipes, 55 mM MnCl2,15 mM CaCl2, 250 mM KCl, pH 6.7) and incubated on ice for a further 10 minutes. A second centrifugation step (10 minutes, 2 500 g, 4 °C) was performed before each pellet was resuspended in 4 ml ice cold resuspension buffer. Again the bacterial suspension was incubated on ice for 10 minutes, after which the suspensions were mixed together in a sterile beaker. Whilst gently swirling the mixture 1.4 ml DMSO was added drop by drop, followed by 10 minutes incubation on ice. The bacterial suspension was dispensed into 220 µl aliquots and shock frozen in liquid nitrogen before storage at -80 °C until further use.
2.10.5.3 Transformation
Transformation of the ligated plasmids was carried out using DMSO competent bacteria (section 2.10.5.2). Initially 50 µl competent bacterial cells were incubated on ice with 2 µl of the ligation mixture (section 2.10.5.1) for 20 minutes. The actual transformation step took 50 seconds at 42 °C. The reaction mixture was directly transferred to ice for 2 minutes, 950 µl SOC medium was added and the transformed bacteria were cultivated for 1 hour at 37 °C, 150 rpm. Following which 50 µl and 500 µl transformation mix were plated out onto standard I nutrient agar plates containing ampicilin (50 mg l-1), overnight incubation was performed at 37 °C.
2.10.5.4 Colony PCR
Insert presence was checked by colony PCR analysis. Using a sterile toothpick a single colony was picked from a growing culture and transferred to a sterile PCR tube. The same toothpick, which still had been bacteria attached to it, was then used to prepare an overnight culture. A standard PCR reaction mix (50 µl) was pipetted together to give a final concentration: 1 µM primer (T7 and SP6 = vector specific primers); 0.2 mM dNTPs; 2 mM MgCl2; 1 x appropriate buffer; 1.25 Units of Taq polymerase (Fermentas, St. Leon-Rot) and sterile water. The amplification reactions were overlaid with mineral oil to prevent evaporation, PCR was carried out as described in Table 5.
2.10.5.5 Plasmid mini preparation
Overnight cultures were pelleted and the plasmid DNA was isolated by alkali lysis of the bacterial pellet using QIAprep® Spin Miniprep kits (Qiagen, Hilden) according to the manufacturer’s instructions. DNA elution from the column was performed with 50 µl sterile water.
2 Materials and Methods __________________________________________________________________________________________________________________________________________________________________________________________________________________________________
31
2.10.5.6 Sequence analysis
To confirm the nucleotide sequences of the transformed cDNA fragments, 2 µg of purified plasmid was vacuum dried to complete dryness and sent to MWG Biotech (Ebersberg) for sequencing. Analysis of the confirmed sequences was then carried out using DNAMAN software (Version 4.1, Lynnon BioSoft, Quebec, Canada) and Blastn from National Center for Biotechnology Information (http://www.ncbi.nlm.nih.gov/BLAST/).
2.10.6 DIG labelling of probes
Confirmed nucleotide sequence were labelled with digoxygenin (DIG) so that they could be used as probes to detect RNA on Northern blots. With the help of the PCR DIG synthesis kit (Roche, Mannheim) probes were amplified using PCR conditions as described in Table 5. All 50 µl reaction mixtures consisted of 1 µM primer (5’ and 3’, see Table 6); 1 ng plasmid DNA template; DIG-mix (containing DIG labelled dUTPs); 1 x appropriate buffer; enzyme mix and sterile water. The amplification reactions were overlaid with mineral oil to prevent evaporation.
Following completion of the PCR reaction, primers and unincorporated dNTPs were removed from the DIG labelled probes using Microcon PCR filter units (Millipore, Schwalbach) according to the manufacturer’s guidelines. The DIG labelled probes were eluted with 20 µl sterile water. Quality and quantity was checked by separation on a 1.5 % agarose gel in 1 x TAE buffer. MassRuler™ low range ladder (Fermentas, St. Leon-Rot) enabled size comparison and the relative intensity of the bands allowed the quantity of labelled probe to be estimated. DIG labelled probes were stored at -20 °C.
2 Materials and Methods __________________________________________________________________________________________________________________________________________________________________________________________________________________________________
32
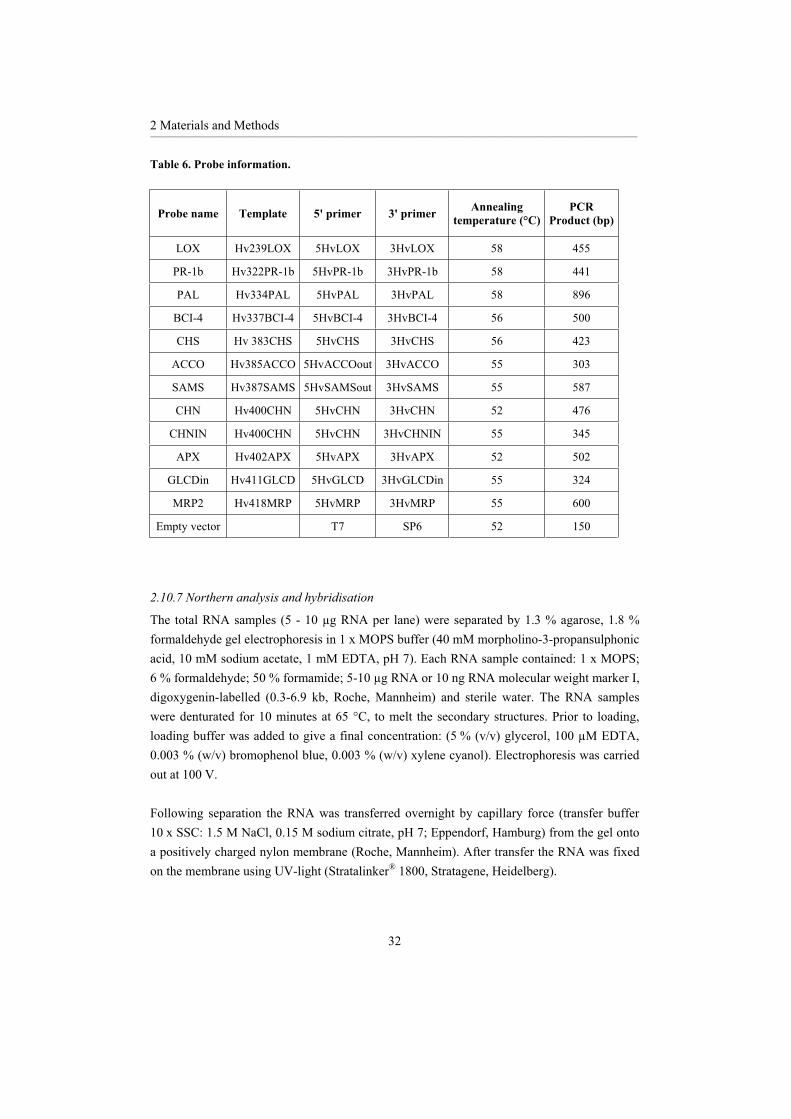
Table 6. Probe information.
Probe name Template 5' primer 3' primer Annealingtemperature (°C)
PCRProduct (bp)
LOX Hv239LOX 5HvLOX 3HvLOX 58 455
PR-1b Hv322PR-1b 5HvPR-1b 3HvPR-1b 58 441
PAL Hv334PAL 5HvPAL 3HvPAL 58 896
BCI-4 Hv337BCI-4 5HvBCI-4 3HvBCI-4 56 500
CHS Hv 383CHS 5HvCHS 3HvCHS 56 423
ACCO Hv385ACCO 5HvACCOout 3HvACCO 55 303
SAMS Hv387SAMS 5HvSAMSout 3HvSAMS 55 587
CHN Hv400CHN 5HvCHN 3HvCHN 52 476
CHNIN Hv400CHN 5HvCHN 3HvCHNIN 55 345
APX Hv402APX 5HvAPX 3HvAPX 52 502
GLCDin Hv411GLCD 5HvGLCD 3HvGLCDin 55 324
MRP2 Hv418MRP 5HvMRP 3HvMRP 55 600
Empty vector T7 SP6 52 150
2.10.7 Northern analysis and hybridisation
The total RNA samples (5 - 10 µg RNA per lane) were separated by 1.3 % agarose, 1.8 % formaldehyde gel electrophoresis in 1 x MOPS buffer (40 mM morpholino-3-propansulphonic acid, 10 mM sodium acetate, 1 mM EDTA, pH 7). Each RNA sample contained: 1 x MOPS; 6 % formaldehyde; 50 % formamide; 5-10 µg RNA or 10 ng RNA molecular weight marker I, digoxygenin-labelled (0.3-6.9 kb, Roche, Mannheim) and sterile water. The RNA samples were denturated for 10 minutes at 65 °C, to melt the secondary structures. Prior to loading, loading buffer was added to give a final concentration: (5 % (v/v) glycerol, 100 µM EDTA, 0.003 % (w/v) bromophenol blue, 0.003 % (w/v) xylene cyanol). Electrophoresis was carried out at 100 V.
Following separation the RNA was transferred overnight by capillary force (transfer buffer 10 x SSC: 1.5 M NaCl, 0.15 M sodium citrate, pH 7; Eppendorf, Hamburg) from the gel onto a positively charged nylon membrane (Roche, Mannheim). After transfer the RNA was fixed on the membrane using UV-light (Stratalinker® 1800, Stratagene, Heidelberg).
2 Materials and Methods __________________________________________________________________________________________________________________________________________________________________________________________________________________________________
33
Equal sample loading was confirmed by staining the membranes before pre-hybridisation with methylene blue (0.03 % methylene blue in 0.3 M sodium acetate, pH 5.2; Herrin and Schmidt, 1988).
Pre-hybridisation (1 hour) und hybridisation (overnight) were carried out at 50°C. DIG labelled probes (section 2.10.6) were denatured for 10 minutes at 95 °C before being added to the hybridisation buffer (40 ng probe / ml DIG Easy Hyb). A rolling hybridisation oven was utilised to perform these experiments.
The hybridisation and immunological detection was performed using DIG Easy Hyb and DIG Wash and Block Buffer Set following the manufacturer’s guidelines (DIG Application Manual 2000, Roche, Mannheim).
The membranes were washed twice with 2 x SSC, 0.1 % SDS for 5 minutes at room temperature, and then washed twice with 0.5 x SSC, 0.1 % SDS for 15 minutes at 50 °C. The following steps were all performed at room temperature. The membranes were washed with 1 x washing buffer (Roche, Mannheim) before being incubated for 45 minutes in 1 x blocking solution. Antibody binding was carried out during a 45 minute incubation step with alkaline phosphatase-conjugated antibody (Anti-DIG-AP, Roche, Mannheim) diluted 1:1000 in 1 x blocking solution. After which the membranes were washed twice with 1 x washing buffer to remove unbound antibody. The membranes were equilibrated in 1 x detection buffer for 5 minutes, following which the membranes were laid on damp Whatman paper in a cut open hybridisation bag. CDP-Star diluted 1:100 in 1 x detection buffer was applied to the membranes and allowed to react for 5 minutes. Prior to exposition, membranes were incubated at 37 °C for 10 minutes. The chemiluminescent alkaline phophatase substrate, CDP-Star, reveals a rapid light signal generation, which was recorded by a luminescent imager. For this purpose membranes were exposed for 10-30 minutes (Fluorescence Imaging System, LAS3000). Data analysis and interpretation were assisted by AIDA software, Version 3.27 (Raytest, Straubenhardt).
2.11 Microarray analysis
Microarray analysis was carried out in co-operation with Dr. Uta von Rad (Institute of Biochemical Plant Pathology, GSF, Munich/Neuherberg).
2.11.1 DNA array
The barley DNA microarray currently being used for examining stress and/ or redox-regulated gene expression involves longer fragments of synthetic or complementary DNA. Sequences are derived from databases, as PCR-amplified partial open reading frames. The array consists
2 Materials and Methods __________________________________________________________________________________________________________________________________________________________________________________________________________________________________
34
of approximately 350 genes involved in or associated with plant defence and various cDNAs associated with primary metabolism and/ or housekeeping. ESTs were ordered from the Crest database in Gatersleben (http://pgrc.ipk-gatersleben.de/est/index.php). Members of these gene families are represented by partial or complete coding sequence (Dr. Uta von Rad, personal communication).
2.11.2 Microarray preparation
Microarrays were prepared as described in von Rad et al. (2005).
Three pairs of treatment were subjected to microarray analysis. Each pair consisted of a control and a treated sample: mock and X.t.hor; mock and P.s.jap; and untreated and Paraquat. Within each pair one sample was labelled with Cy3 and the other with Cy5 (see section 2.11.3). To compensate for the differing binding efficiencies of the two fluorescent dyes, a so-called dye swap was performed. As such one array is hybridised with Cy3-control and Cy5-treated samples, whilst a second array is hybridised with Cy5-control and Cy3-treated samples. The signal intensities obtained from both arrays were then compared.
A total of 200 µl amino-modified PCR products were cleaned using 96-well multiscreen filter plates (Cat # MANU 03050; Millipore, Bedford, MA, USA) and suspended in 20 µl spotting solution (3 x SSC supplemented with 1.5 M betaine) and arrayed from 384-well microarray plates onto silylated microscope slides (CSS-100 silylated Slides; CEL Associates, Houston, TX, USA) using a DNA array robot (model GMS 417 from Genetic Microsystems). Printed arrays were incubated at room temperature over night and rinsed twice in 0.1 % SDS with vigorous agitation for 2 minutes, twice in double distilled water for 2 minutes, and once for 5 minutes in sodium borhydride solution (0.75 g NaBH4 dissolved in 200 ml of PBS and 75 ml 100% ethanol). The arrays were submerged in water for 2 minutes at 95 °C, transferred quickly into 0.1 % SDS for 1 minute, rinsed twice in double distilled water, air dried and stored in the dark at room temperature.
2.11.3 Fluorescent probes
Fluorescent probes were prepared as described in von Rad et al. (2005).
Target RNA was extracted as described in section 2.10.1, the nucleic acid was concentrated either by vacuum drying or using a sodium acetate and isopropanol method. For this purpose, 30 µg total RNA was mixed with 3 M sodium acetate (pH 5.2) to give a final concentration of 0.3 M, to which 0.75 Vol isopropanol was added. After mixing, the sample was allowed to incubate for 15 minutes at room temperature, followed by 15 minutes maximum speed
2 Materials and Methods __________________________________________________________________________________________________________________________________________________________________________________________________________________________________
35
centrifugation in a table centrifuge. The pellet was washed twice with 75 % ethanol before being covered with 75 % ethanol until further use.
Probes were made using an indirect aminoallyl labelling method (described at http://www.tigr.org/tdb/microarray/protocolsTIGR.shtml). Each RNA sample was prepared twice so that it could be labelled once with Cy3 and once with Cy5.
Each RNA (30 µg total RNA) sample was reverse transcribed using oligo (dT) and 400 Units SuperScript™ II reverse transcriptase (Invitrogen, Karlsruhe) in the presence of aminoallyl-dNTP mixture (end concentrations: 250 µM dATP, 250 µM dCTP, 250 µM dGTP, 150 µM dTTP, 100 µM aa-dUTP; Sigma) and allowed to incubate overnight at 42 °C. After which the remaining RNA was hydrolysed using 10 µl 1 M sodium hydroxide and 10 µl 0.5 M EDTA (pH 8) 15 minutes at 65 °C, subsequently neutralisation was performed by the addition of 10 µl 1 M hydrochloric acid.
The mixture was purified using QIAquick® PCR purification kits (Qiagen, Hilden) slightly adapted from the manufacturer’s guideline such that phosphate wash buffer (5 mM KPO4,pH 8.0, 80 % ethanol) and phosphate elution buffer (4 mM KPO4, pH 8.5) were substituted for the Qiagen supplied buffers. Also the final elution step using 30 µl phosphate elution buffer was repeated to give a final eluted volume ~ 60 µl for each sample, this was then vacuum dried to complete dryness.
The sample was resuspended in 0.1 M sodium carbonate buffer (pH 9.0) before addition of either Cy3-dCTP or Cy5-dCTP (Amersham Pharmacia Biotech, Freiburg), which had been dissolved in DMSO according to manufacturer’s guidelines, and incubated in the dark for 1 hour.
Before a final purification 35 µl 100 mM sodium acetate buffer (pH 5.2) was added to the reaction mixture. Excess and unbound label was then removed using QIAquick® PCRpurification kits according to the manufacturer’s guidelines. As described above the final elution step was repeated to give a final eluted ~ 60 µl for each sample.
2.11.4 Hybridisation and scanning
Hybridisation and scanning were preformed as described in von Rad et al. (2005).
Following reverse transcription, labelling and purification steps, Cy3- and Cy5-labelled probes were combined. To which 20 µg salmon sperm DNA and 20 µg Poly(A)-DNA were added, dried in a Speedvac (UniVac 150H, UniEquip, Munich) and dissolved in 50 µlhybridisation buffer (50 % formamide, 6 x SSC, 0.5 % SDS, 5 x Denhardt’s). The probes
2 Materials and Methods __________________________________________________________________________________________________________________________________________________________________________________________________________________________________
36
were denatured at 95 °C for 3 minutes and then cooled on ice. The slides were immersed in pre-hybridisation buffer (6 x SSC, 0.5 % SDS, 1 % BSA and 1 µg ml 1 single stranded DNA) at 42 °C for 45 minutes, thoroughly washed with double distilled water and then air dried.Probes were hybridised overnight to 0.4 cm2 microarrays in 21 mm x 22 mm (internal)Abgene microarray gene frames in hybridisation chambers (Geneworx AG Zinsser Analytic GmbH, Biorobotics Genemachines and Investigator Brand Products, Oberhaching).
Subsequently, the arrays were washed for 10 minutes at low stringency (2 x SSC, 0.1 % SDS), then for 5 minutes in 1 x SSC, 0.1 % SDS, and finally for 5 minutes at high stringency (wash buffer 0.1 x SSC, 0.1 % SDS). After a brief wash in double distilled water, the arrays were air dried and scanned using an AXON GenePix 4000 scanner (Axon Instruments, Union City, CA, USA).
Separate images were acquired for each fluorophore at a resolution of 10 µm per pixel. To identify differentially expressed genes GENEPIX Pro 4.1 software was used. Background fluorescence was calculated as the median fluorescence signal of nontarget pixels around each gene spot. Less than 50 % difference between background and signal resulted in elimination of the corresponding spot. For statistical analyses ACUITY 3.1 software suite (Axon Instruments) was used.
2.12 In situ detection of reactive oxygen species (ROS)
To determine the involvement of the oxidative burst and so the production of ROS following bacterial infiltration both hydrogen peroxide and superoxide anions were analysed. In the presence of hydrogen peroxide and peroxidase activity DAB (3,3’ Diaminobenzidine) polymerises and produces a brown precipitate (Thordal-Christensen et al., 1997). Whilst NBT (4-nitro blue tetrazolium) is reduced in the presence of superoxide anions leading to the accumulation of blue formazan (Doke and Ohashi, 1988).
To prevent auto oxidation 0.1 % (w/v) DAB*4HCl (Sigma)/ NBT (Loewe, Sauerlach) were added to the buffer solution (DAB: 10 mM 2-N-Morpholino-ethane sulphonic acid hydrate (MES), pH 6.5; or NBT: 50 mM potassium phosphate, 10 mM sodium azide, pH 6.4) directly before the experiment was carried out. At the respective time points the locally treated leaves were harvested with a scalpel and placed in a 50 ml syringe without a needle containing either DAB or NBT staining solution. The application and release of pressure to this system allowed the leaves to be vacuum infiltrated. This process was repeated until the infiltrated leaf area was approximately 80-90 %. The leaves were stored in the dye solution for 1 hour in the dark (to prevent auto oxidation) under continuous agitation. After this incubation period the leaves were subjected to a series of ethanol solutions finishing with 100 % at 37 °C, to remove the chlorophyll from the background staining in the leaves.
2 Materials and Methods __________________________________________________________________________________________________________________________________________________________________________________________________________________________________
37
2.13 HPLC analysis of soluble phenolics
Plant extracts were obtained by grinding 100 mg frozen leaf material with 100 mg clean sand and 1 ml extraction solvent (60 % (v/v) methanol, 0.1 % (v/v) phosphoric acid with 2 ‰ (w/v) 3-methylsalicylic acid as an internal standard) for 1 minute. Thereafter the mixture was centrifuged for 1 minute. The supernatant was filtered through a 0.45 µm PVDF filter. 20 µlof this clear solution was immediately injected for HPLC separation.
The soluble phenolics were determined by reverse-phase chromatography using a stainless steel column (250 mm x 4 mm) filled with 3-µm particles of Multospher 120 RP18 HP3 (CSService, Langerwehe). A linear gradient with acetonitrile in 0.1 % (w/w) phosphoric acid in water was used with the following acetonitrile concentrations: 0 minutes: 5 %; 50 minutes: 55 %; 51 minutes: 80 %; 60 minutes: 80 %; 65 minutes: 5 %; flow rate was 0.5 ml/ minute and the run was completed in 90 minutes. Compounds in extracts were identified when the injection of reference compounds (available from Aldrich, Sigma and Lancaster) gave peaks with identical retention times and UV-VIS spectra.
2.14 Intercellular wash fluid (ICWF)
The systemic barley leaves were harvested 5 days after treatment. The leaves were weighed and then vacuum infiltrated with acetate buffer (50 mM sodium acetate, pH 5, 100 mM KCl, 5 mM DTE (or DTT)). Four barley leaves were infiltrated simultaneously using 50 ml syringe as described above (section 2.11). The infiltrated area was approximately 80 - 90 % of the leaf surface area. The leaves were patted dry with tissue paper and weighed for a second time. The leaves were folded in half with the adaxial (lower leaf) side outermost and the cut edge upwards. These leaves were placed in 1 ml tips which were then placed into 15 ml conical tubes and centrifuged for 20 minutes at 1 000 g, 4 °C. The fluid collected from the base of the conical tubes, defined as ICWF, was transferred to fresh 1.5 ml reaction tubes and stored on ice in the dark or at -20 °C until further use. Following centrifugation the leaves were placed in aluminium bags and shock frozen in liquid nitrogen and stored at -80 °C until further use.
2.15 Protein determination
For the determination of the protein content in each sample an adapted method from Bradford (1976) was used. A standard curve from BSA was used.
Appropriate dilutions was chosen to ensure that the measurement at OD595 was between 0.05 and 0.3, the optimal range for this test.
2 Materials and Methods __________________________________________________________________________________________________________________________________________________________________________________________________________________________________
38
2.16 G6PDH activity assay
In order to determine the amount of cytoplasmic contamination in the ICWF samples glucose-6-phosphate dehydrogenase (G6PDH) activity was used as a cytoplasmic marker (Vanacker etal., 1998). Using a method modified from Esposito et al. (2005) G6PDH activity was measured in ICWF samples and compared with that of the leaves from which the ICWF was originally isolated.
For the leaf extract, frozen tissue from section 2.14 (500 mg) was ground to a fine powder in liquid nitrogen, 500 µl extraction buffer (100 mM Tris pH 7.9, 10 mM MgCl2, 5 mM EDTA, 10 % (v/v) glycerol) was added and ground to produce a slurry. This was then centrifuged for 20 minutes at 20 000 g, 4 °C. The resulting supernatant, used as the leaf extract, was transferred to fresh 1.5 ml reaction tubes and stored on ice in the dark or at -20 °C until further use.
G6PDH was assayed in a reaction mixture (1 ml) consisting of 50 mM Tris-HCl pH 8.0, 10 mM MgCl2, 0.15 mM NADP+ and 20 µl of either leaf extract or ICWF sample. The reaction was started by addition of 100 µl glucose-6-phosphate from a 30 mM stock solution with an end concentration of 3 mM in the cuvette. Control rates were obtained in the absence of enzyme extract or sample. Reaction rates were measured by following the increase in absorbance at 340 nm as NADPH was produced. Enzyme activity is given as nmol NADPH min-1 mg protein-1.
2.17 Protein precipitation
Due to the low protein concentration in the ICWF, the samples had to be concentrated before they could be applied to SDS-PAGE or 2D electrophoresis (see sections 2.18 and 2.20, respectively).
For 2D electrophoresis experiments (section 2.20) protein samples were firstly concentrated and desalted using Microcon YM-100 (Millipore, Schwalbach) according to the manufacturer’s instructions.
A methanol/ chloroform method adapted from Wessel and Flügge (1984) was carried out, 20 µg (SDS-PAGE) or 250 µg (2D) protein was brought to a volume of 100 µl with Milli-Q water. Methanol (240 µl) was added together with 80 µl chloroform and vortexed. For phase separation 320 µl Milli-Q water was added and the mixture was again vortexed, followed by 1 minute maximum speed centrifugation in a table centrifuge. The upper phase was carefully removed, 240 µl methanol was added and vortexed before a final 5 minute maximum speed centrifugation step. The samples were then vacuum dried to complete dryness.
2 Materials and Methods __________________________________________________________________________________________________________________________________________________________________________________________________________________________________
39
2.18 SDS-PAGE
Denatured proteins were separated by sodium dodecyl sulphate-polyacrylamide gel electrophoresis (SDS-PAGE) using a method modified from Laemmli (1970) and the Bio-Rad Mini Protean 3 Gel System.
The dry ICWF pellets (section 2.17) were resuspended in sample buffer (100 mM Tris-HCl pH 6.8, 4 % SDS, 20 % (v/v) glycerol, 0.01 % (w/v) bromophenol blue, 5 % mercapto-ethanol) which had been previously diluted 1:1 with Milli-Q water. The resuspended protein samples were denatured for 6 minutes at 95 °C, directly cooled on ice then centrifuged for 5 minutes at maximum speed, 4 °C. ICWF samples (20 µg protein/lane) were separated in a discontinuous buffer system (12 % (w/v) Resolving Gel: 0.375 M Tris-HCl, pH 8.8, 0.1 % SDS; 4.5 % (w/v) Stacking Gel: 0.125 M Tris-HCl, pH 6.8, 0.1 % SDS). SDS-PAGE molecular weight standards, Low Range (Bio-Rad, Munich) were run simultaneously to enable size comparison.
Electrophoresis was performed in a Tris-glycine buffer (0.025 M Tris-HCl pH 8.3, 10 % (w/v) SDS, 192 mM glycine) at 60 V for 10 minutes then at 120 V at room temperature until the bromophenol blue front had just left the gel, generally 90 minutes.
2.19 Coomassie blue staining
To visualise the protein bands the gels were transferred to Coomassie blue staining dye (0.025 % (w/v) Coomassie Brilliant Blue G-250, 45 % (v/v) methanol, 10 % (v/v) acetic acid in Milli-Q water) following separation. The gels were stained for 15-20 minutes, then directly transferred to destaining solution (30 % (v/v) methanol, 10 % (v/v) acetic acid in Milli-Q water), this solution was repeatedly changed until the background colour had been removed. Following destaining the gels were placed in water until digital documentation occurred.
2.20 2D electrophoresis
Two dimensional (2D) electrophoresis allows a far greater resolution of proteins than SDS-PAGE alone. As protein samples are first separated by their isoelectric point and then by their molecular weight by SDS-PAGE. Görg et al. (1985, 1988) developed the current 2D electrophoresis technique using immobilised pH gradient (IPG) strips.

2 Materials and Methods __________________________________________________________________________________________________________________________________________________________________________________________________________________________________
40
2.20.1 First dimension
Dehydrated ICWF protein pellets (section 2.17) were rehydrated with rehdyration buffer (9 M urea, 2.5 % (w/v) CHAPS, 1 % PharmalyteTM IPG-buffer 3-10, 0.5 % (w/v) DTT (all from Amersham Biosciences, Freiburg)) and incubated for 30 minutes at room temperature under constant agitation. The ICWF samples were applied by rehydration loading in strip holders to the IPG strips (Immobiline DryStrip pH 4-7, length 18 cm; Amersham Biosciences, Freiburg), according to the manufacturer’s manual. A screening experiment was carried out with 3-10 IPG strips (pH 3-10), which showed that the majority of the proteins in the ICWF samples were to be found in the pH 4-7 range. The IPG strips were covered with Immobiline DryStrip cover fluid (Amersham Biosciences, Freiburg) to prevent evaporation and urea crystallisation. Isoelectric focusing was carried out using EttanTM IPGphorTM Isoelectric Focusing System as described in Table 7.
Table 7. Focusing Programme.
30 V 6 hours 60 V 6 hours 200 V 1 hour 500 V 1 hour
2 000 V 1 hour 8 000 V 0.5 hours 8 000 V 36 hours
Following the end of the first dimension the IPG strips were stored at -20 °C until further use.
2.20.2 Second dimension
After the first dimension, the IPG strips were prepared for the second dimension as recommended by the manufacturer. The strips were loaded onto ExcelGel® XL SDS 12-14 on a Multiphor II electrophoresis unit following the manufacturer’s guidelines (ExcelGel® XL SDS 12-14 Instructions, Amersham Bioscience, 2004). Molecular weight markers 2-D SDS PAGE Standards (Bio-Rad, Munich) were loaded onto application pieces placed on either side of the IPG strip prior to electrophoresis. The running conditions were 20 mA (45 mA for 2 gels) for 45 minutes, after which the IPG strip and application pieces were removed, followed by 40 mA (80 mA for 2 gels) until the bromophenol blue front reached the anodic buffer strip.

2 Materials and Methods __________________________________________________________________________________________________________________________________________________________________________________________________________________________________
41
2.20.3 Visualisation
After completion of the second dimension, the mineral oil was removed from the plastic support with ethanol, before the gel was incubated in fixation solution (10 % (w/v) ammonium sulphate, 2.4 % (w/v) phosphoric acid, 20 % (v/v) methanol) in an air tight container for 1 hour. After which Coomassie Brilliant Blue G-250 was added to give a 0.1 % (w/v) staining solution. Incubation occurred overnight in an air tight container, the next day the gel was destained with fixation solution and then Milli-Q water, which was changed regularly until the background staining had been reduced. For documentation purposes the stained gels were scanned using Image Scanner (PowerLook 1120, Amersham Biosciences, Freiburg) in the transmitted light mode. The gels were preserved by soaking them in 30 % glycerol.
2.20.4 Evaluation and picking of spots
Scanned gels were carefully analysed, all the spots which were induced in the pre-treated ICWF gels compared to the mock gels were catalogued. These spots were picked from the gel and transferred to fresh 0.5 ml reaction tubes. The gel fragments were centrifuged briefly to collect the spot at the tube base, prior to storage at -20 °C until further use.
2.20.5 In-gel digest
The peptides were extracted from the gel fragments by in-gel digestion with trypsin as described by Jensen et al. (1998).
Each gel fragment was washed twice for 15 minutes in a 1:1 (v/v) Milli-Q water: acetonitrile mixture, and then washed for 5 minutes with 1 Vol acetonitrile. This was removed before the gel fragment was incubated with 1 Vol of 100 mM ammonium bicarbonate for 5 minutes, 1 Vol of acetonitrile was added to this mixture and incubated for a further 15 minutes under continuous agitation. After which the washed gel fragment was vacuum centrifuged to complete dryness.
Trypsin (10 ng/ µl in 50 mM ammonium bicarbonate) was added until the gel had regained its full volume, enzymatic digest was performed overnight at 37 °C.
The digested peptides released by the trypsin digest were transferred to a separate reaction tube, those remaining in the gel were sequentially extracted using 25 mM ammonium bicarbonate and acetonitrile, followed by 5% (v/v) formic acid: acetonitrile (1:1) each step was incubated for 15 minutes under continuous agitation. After each step the liquid was gathered and added to reaction tube described above. Finally the samples were vacuum

2 Materials and Methods __________________________________________________________________________________________________________________________________________________________________________________________________________________________________
42
centrifuged to an approximate volume of 10 - 15 µl at 60 °C, before being stored at -20 °C until further use.
2.20.6 Mass spectrometry analysis of the trypsin fragments
Mass spectrometry analysis was carried out by Dr. Markus Piotrowski (Plant physiology department, Ruhr University Bochum). Peptides generated by in-gel digestion with trypsin were desalted by reverse phase extraction using ZipTip®
C18 (Millipore) according to the manufacturer’s guidelines. The samples were eluted in 1 µl 60 % (v/v) methanol, 0.1 % (v/v) formic acid. Thereafter the peptide mixture was analysed using nanoelectrospray ionisation mass spectrometry with a quadrupole time-of-flight hybrid mass spectrometer (QTOF2, Micromass, Manchester, UK) in positive ion mode. Collection of spectra occurred in MS-mode in a mass range from 400 to 1 200 m/z. For every spectrum the data from 2.4 seconds was added. Double- or triple-charged peptides were selected for collision-induced dissociationin MS/MS mode. Data analysis of the MS/MS spectra was manually processed using MaxEnt3 and ProteinLynx of MassLynx 3.5 Software (Micromass, Manchester, UK).

3 Results __________________________________________________________________________________________________________________________________________________________________________________________________________________________________
43
3 Results
3.1 Testing the system for systemic resistance induction Plants are sessile organisms and as such have had to develop means to survive in their natural habitat. They have evolved many different processes to tolerate, resist or avoid (a)biotic stresses. One of the most common biotic stresses is pathogen attack. For the main part, plants can avoid this stress because they do not provide the correct environment for pathogen growth and are said to be non-hosts. In addition to pre-formed defence mechanisms, those already present, e.g. cuticula and hairs, plants are also capable of inducing defence responses to protect themselves. Plants which survive a local infection are often better equipped to fight a secondary pathogen attack in distal parts of the plant such as systemic leaves. The best characterised form of such an “induced resistance” is systemic acquired resistance (SAR), which can be mediated by chemical or biological inducers, has been extensively investigated in dicotyledons.
The aim of the present study was to identify biological and chemical agents that were capable of inducing resistance against powdery mildew in barley as a monocotyledon plant. Furthermore the mechanisms behind such an identified resistance were to be determined and compared to those described for dicotyledonous plants.
Resistance induction, in terms of less fungal infection, was observed in this study following pre-treatment of barley plants with chemical or biological inducers when compared to control plants. For this purpose plants were treated in the one leaf stage of growth, which allowed a local treatment. After 5 days growth the plants reached the two leaf stage and were inoculated with Blumeria graminis f.sp. hordei (Bgh). The second leaf can be described as systemic because at the time of pre-treatment it was not present, therefore allowing a clear segregation between local pre-treatment and systemic resistance. Once the fungus was fully developed fungal growth was scored on the second leaf.
There was not only a great difference in the effectiveness of the different inducers, but also in some cases dose dependence could be observed (Figure 1). Some strains of Pseudomonas syringae were unable to influence powdery mildew growth, while others led to a decreased systemic fungal infection of ~35 % compared to controls (for details see section 3.1.2.5). All strains of Xanthomonas translucens tested caused lower powdery mildew development. Chemical inducers were found to be even more effective, the best resulted in a reduction to 15 % fungal infection.

3 Results __________________________________________________________________________________________________________________________________________________________________________________________________________________________________
44
Figure 1. Overview of systemic resistance induction following various local chemical or biological pre-treatments. Six days old barley plants were either sprayed with 10 µM Paraquat, 300 µM salicylic acid (SA), 300 µM 2,6-dichloroisonicotinic acid (INA), 100 or 300 µM Bion®; or infiltrated with bacterial suspensions Pseudomonas syringae pv. japonica (P.s.jap), Xanthomonas translucens pv. cerealis (X.t.cer), Xanthomonas translucens pv. hordei (X.t.hor), Xanthomonas translucens pv. translucens (X.t.tra), Pseudomonas syringae pv. maculicola (Psm) carrying either plasmid avrRPT2 (avir) or plasmid CR105 (VIR), Pseudomonas syringae pv. syringae (P.s.syr) or Pseudomonas syringae pv. tomato (P.s.tom) at different concentrations of colony forming units (cfu) per ml: 6 (1 x 10⁶ cfu/ ml) 8 (1 x 10⁸ cfu/ ml) or 10 (1 x 10¹⁰ cfu/ ml). Mock infiltration was performed using 100 mM MgCl2, the buffer used to resuspend the bacteria. Five days later the locally treated plants were inoculated with Blumeria graminis f.sp. hordei (Bgh). Resistance induction is defined as lower systemic fungal infection following local pre-treatment in comparison to water treated control plants, for this purpose the upper half of systemic leaves were scored. The results displayed are the average taken from 10 - 20 plants scored from representative experiments, the error bars show the standard deviation. Bars of the same colour or pattern are from the same experiment. To allow comparison between the individual experiments the average fungal infection observed on control plants was set at 100 % the remaining data were corrected accordingly.
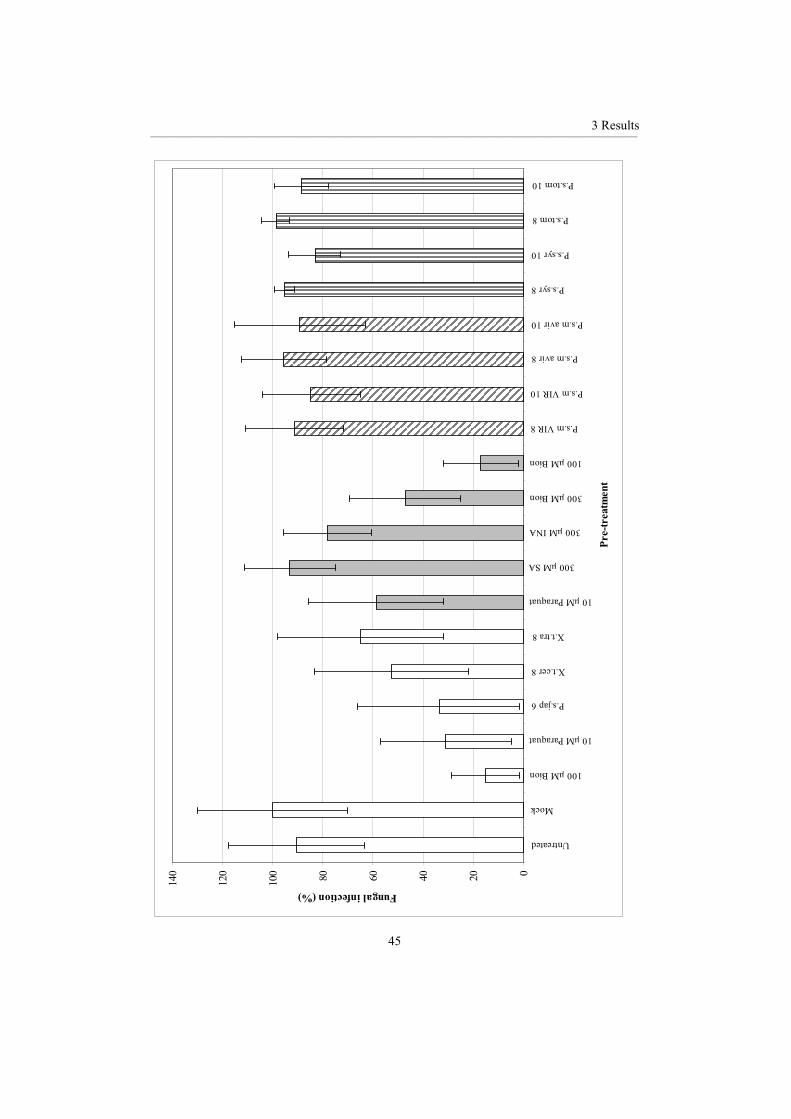
3 Results __________________________________________________________________________________________________________________________________________________________________________________________________________________________________
45
020406080100
120
140
Untreated
Mock
100 µM Bion
10 µM Paraquat
P.s.jap 6
X.t.cer 8
X.t.tra 8
10 µM Paraquat
300 µM SA
300 µM INA
300 µM Bion
100 µM Bion
P.s.m VIR 8
P.s.m VIR 10
P.s.m avir 8
P.s.m avir 10
P.s.syr 8
P.s.syr 10
P.s.tom 8
P.s.tom 10
Pre-
trea
tmen
t
Fungal infection (%)
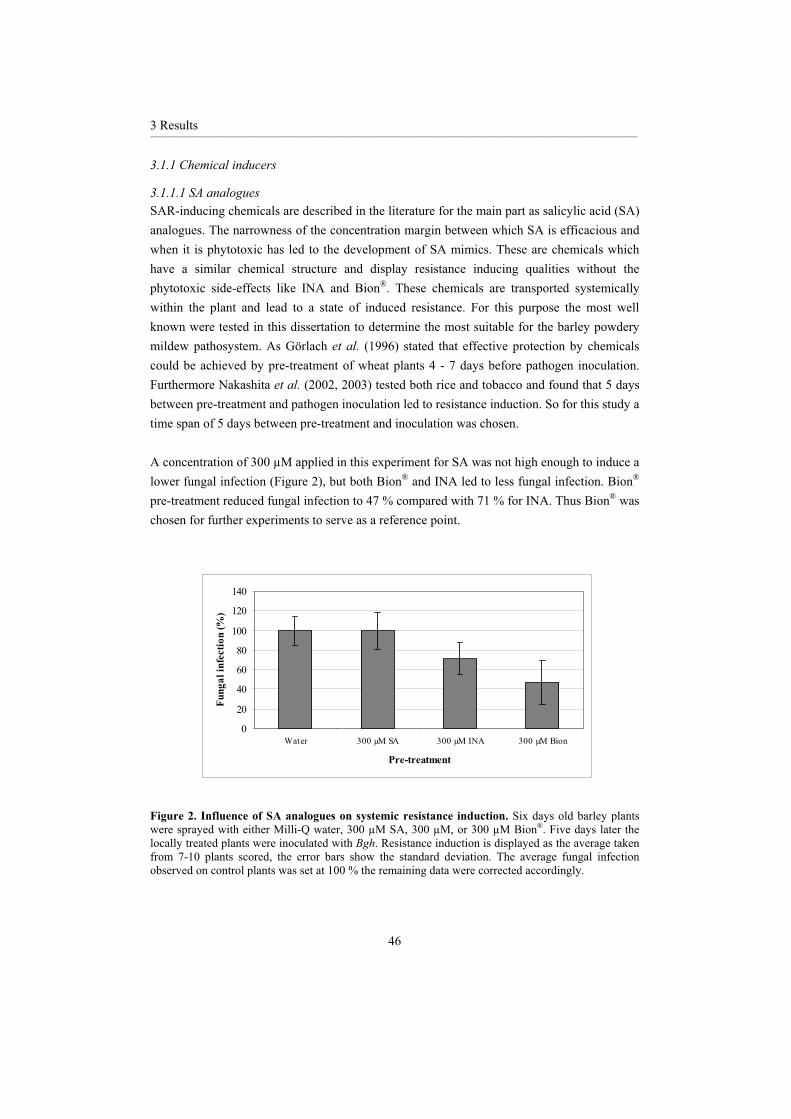
3 Results __________________________________________________________________________________________________________________________________________________________________________________________________________________________________
46
3.1.1 Chemical inducers
3.1.1.1 SA analogues SAR-inducing chemicals are described in the literature for the main part as salicylic acid (SA) analogues. The narrowness of the concentration margin between which SA is efficacious and when it is phytotoxic has led to the development of SA mimics. These are chemicals which have a similar chemical structure and display resistance inducing qualities without the phytotoxic side-effects like INA and Bion®. These chemicals are transported systemically within the plant and lead to a state of induced resistance. For this purpose the most well known were tested in this dissertation to determine the most suitable for the barley powdery mildew pathosystem. As Görlach et al. (1996) stated that effective protection by chemicals could be achieved by pre-treatment of wheat plants 4 - 7 days before pathogen inoculation. Furthermore Nakashita et al. (2002, 2003) tested both rice and tobacco and found that 5 days between pre-treatment and pathogen inoculation led to resistance induction. So for this study a time span of 5 days between pre-treatment and inoculation was chosen.
A concentration of 300 µM applied in this experiment for SA was not high enough to induce a lower fungal infection (Figure 2), but both Bion® and INA led to less fungal infection. Bion®
pre-treatment reduced fungal infection to 47 % compared with 71 % for INA. Thus Bion® was chosen for further experiments to serve as a reference point.
0
20
40
60
80
100
120
140
Water 300 µM SA 300 µM INA 300 µM Bion
Pre-treatment
Fung
al in
fect
ion
(%)
Figure 2. Influence of SA analogues on systemic resistance induction. Six days old barley plants were sprayed with either Milli-Q water, 300 µM SA, 300 µM, or 300 µM Bion®. Five days later the locally treated plants were inoculated with Bgh. Resistance induction is displayed as the average taken from 7-10 plants scored, the error bars show the standard deviation. The average fungal infection observed on control plants was set at 100 % the remaining data were corrected accordingly.

3 Results __________________________________________________________________________________________________________________________________________________________________________________________________________________________________
47
Görlach et al. (1996) described concentration dependence in the resistance inducing effects of Bion® in wheat. To ascertain the most suitable Bion® concentration for the present barley powdery mildew pathosystem, various concentrations (0.1 - 1.2 mM) were tested. An inverse concentration dependency was found (Figure 3). The lowest concentration (0.1 mM) tested was more than twice as effective as the higher Bion® doses, 17 % fungal infection compared to 47 % following pre-treatment with 0.3 mM. As higher Bion® concentrations did not lead to increased resistance induction a Bion® concentration of 100 µM was used for further experiments.
0
20
40
60
80
100
120
Water 0.1 mM Bion 0.3 mM Bion 1.2 mM Bion
Pre-treatment
Fung
al in
fect
ion
(%)
Figure 3. Bion concentration dependence. Six days old barley plants were sprayed with either Milli-Q water, 0.1 mM, 0.3 mM or 1.2 mM Bion®. Five days later the locally treated plants were inoculated with Bgh. Resistance induction is displayed as the average taken from 10 - 20 plants scored, the error bars show the standard deviation. The average fungal infection observed on control plants was set at 100 % the remaining data were corrected accordingly.
3.1.1.2 A Pro-oxidant chemical
Paraquat is commonly used as a herbicide, which acts as a strong electron acceptor of photosystem I in the light and of NADPH in the dark (Hauschild and von Schaewen, 2003).
During the subsequent auto-oxidation free radicals are produced, often in the form of superoxide anions, therefore giving rise to an altered redox status in the plant leading at higher doses to cell death and ultimately death of the whole plant. At lower concentrations in cucumber and tobacco, both dicotyledons, this pro-oxidant chemical has been shown to induce SAR (Strobel and Ku , 1995). Ananieva et al. (2002, 2004) carried out a series of experiments into the effect of Paraquat on different physiological parameters they found that
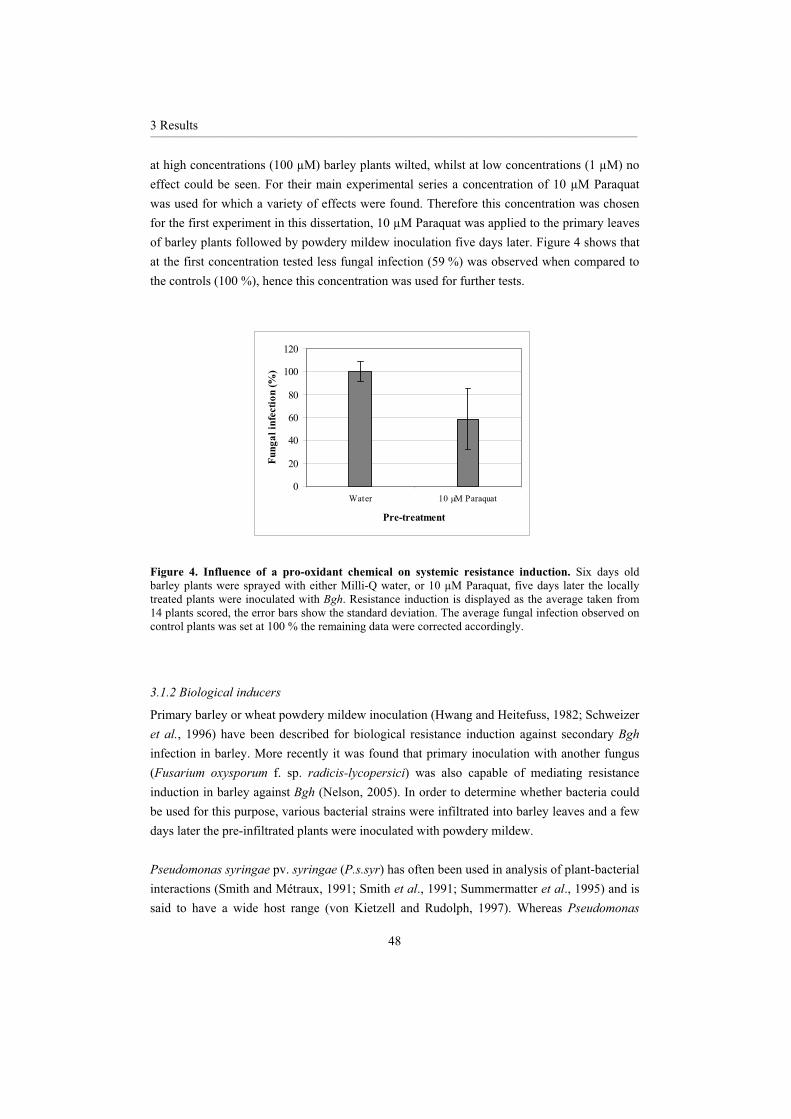
3 Results __________________________________________________________________________________________________________________________________________________________________________________________________________________________________
48
at high concentrations (100 µM) barley plants wilted, whilst at low concentrations (1 µM) no effect could be seen. For their main experimental series a concentration of 10 µM Paraquat was used for which a variety of effects were found. Therefore this concentration was chosen for the first experiment in this dissertation, 10 µM Paraquat was applied to the primary leaves of barley plants followed by powdery mildew inoculation five days later. Figure 4 shows that at the first concentration tested less fungal infection (59 %) was observed when compared to the controls (100 %), hence this concentration was used for further tests.
0
20
40
60
80
100
120
Water 10 µM Paraquat
Pre-treatment
Fung
al in
fect
ion
(%)
Figure 4. Influence of a pro-oxidant chemical on systemic resistance induction. Six days old barley plants were sprayed with either Milli-Q water, or 10 µM Paraquat, five days later the locally treated plants were inoculated with Bgh. Resistance induction is displayed as the average taken from 14 plants scored, the error bars show the standard deviation. The average fungal infection observed on control plants was set at 100 % the remaining data were corrected accordingly.
3.1.2 Biological inducers
Primary barley or wheat powdery mildew inoculation (Hwang and Heitefuss, 1982; Schweizer et al., 1996) have been described for biological resistance induction against secondary Bghinfection in barley. More recently it was found that primary inoculation with another fungus (Fusarium oxysporum f. sp. radicis-lycopersici) was also capable of mediating resistance induction in barley against Bgh (Nelson, 2005). In order to determine whether bacteria could be used for this purpose, various bacterial strains were infiltrated into barley leaves and a few days later the pre-infiltrated plants were inoculated with powdery mildew.
Pseudomonas syringae pv. syringae (P.s.syr) has often been used in analysis of plant-bacterial interactions (Smith and Métraux, 1991; Smith et al., 1991; Summermatter et al., 1995) and is said to have a wide host range (von Kietzell and Rudolph, 1997). Whereas Pseudomonas

3 Results __________________________________________________________________________________________________________________________________________________________________________________________________________________________________
49
syringae pv. tomato (P.s.tom) is a pathogen in Arabidopsis and tomato (Katagiri et al., 2002) should thus be a non-host pathogen in barley. Pseudomonas syringae pv. maculicola (Psm)avir and VIR were chosen because they displayed both avirulent and virulent properties in Arabidopsis (von Rad, personal communication 2005). Pseudomonas syringae pv. japonica (P.s.jap) and Xanthomonas strains were isolated from barley plants (LMG Database; http://bccm.belspo.be/index.php) therefore allowing host pathogens to be tested.
However before the resistance inducing properties of the bacteria were tested, it was of primary importance to determine the action of the bacteria alone in the plants, without the secondary powdery mildew inoculation.
3.1.2.1 Bacterial growth following infiltration
Bacterial growth was tested first for Xanthomonas translucens pv. cerealis (X.t.cer) at four concentrations 1 x 10⁴, 1 x 10⁶, 1 x 10⁸, 1 x 10¹⁰ colony forming units (cfu)/ ml. Increasing bacterial concentrations led to a correlated increase in the amount of bacteria found in planta(Figure 5A). The lowest detectable infiltrated concentration 1 x 10⁶ cfu/ ml gave rise to 2.5 cfu/ cm2 leaf area compared to the highest infiltrated concentration 1 x 10¹⁰ cfu/ ml which resulted in 1.4 x 10⁴ cfu/ cm2 leaf area.
Following this preliminary experiment various bacterial strains were cultivated and differing concentrations were infiltrated into barley primary leaves. Figure 5C displays the actual amount of bacteria that survived the infiltration into the plants. The higher the concentration of infiltrated bacteria the greater the number of viable bacteria found in planta, as described above for X.t.cer. Interestingly at the highest concentration (1 x 10¹⁰ cfu/ ml) tested, a threshold seems to be reached for P.s.jap. Although 4 orders of magnitude more P.s.japbacteria were infiltrated (1 x 10⁶ cfu/ ml and 1 x 10¹⁰ cfu/ ml) this only resulted in a 2 orders of magnitude increase in bacteria present after infiltration (20 and ~1 000 cfu, respectively), much lower than that observed above for X.t.cer. In spite of the fact that the P.s.syr and P.s.tom bacterial cultures were in the stationary growth phase before infiltration solution preparation, hence containing not only live but also dead bacteria. The number of living bacteria as determined by this test was in a similar range to that of the other bacterial strains from which the overnight cultures were in the logarithmic growth phase, as ascertained by photometric analysis of an aliquot taken from the growing culture.

3 Results __________________________________________________________________________________________________________________________________________________________________________________________________________________________________
50
1.00E+00
1.00E+01
1.00E+02
1.00E+03
1.00E+04
1.00E+05
Mock 1.00E+04 1.00E+06 1.00E+08 1.00E+10
Pre-infiltration
cfu
/ cm
2 leaf
tiss
ue
1 h
A
1.00E+00
1.00E+01
1.00E+02
1.00E+03
1.00E+04
1.00E+05
Mock 1.00E+04 1.00E+06
Pre-infiltration
cfu
/ cm
2 leaf
tiss
ue
5 d
B
1.00E+001.00E+011.00E+021.00E+031.00E+041.00E+051.00E+061.00E+071.00E+08
Mock P.s.jap6
P.s.syr8
P.s.tom8
X.t.cer8
X.t.hor8
X.t.tra8
Psmavir 10
PsmVIR 10
P.s.jap10
Pre-infiltration
cfu
/ cm
2 leaf
tiss
ue
1 h 4 - 5 d
C
Figure 5. Bacterial growth following infiltration and in planta. Six days old barley plants were infiltrated with bacterial suspensions at different concentrations of colony forming units (cfu) per ml: 1 x 10⁴, 1 x 10⁶, 1 x 10⁸ or 1 x 10¹⁰ cfu/ ml X.t.cer, X.t.hor, X.t.tra, P.s.jap, Psm avir or VIR, P.s.syrand P.s.tom were tested. A) X.t.cer bacterial growth following infiltration. Samples were taken 1 hour after infiltration and the number of living bacteria infiltrated into the barley plants was determined. B) X.t.cer bacterial growth in planta. Samples were taken 5 days after infiltration and the number of living bacteria which had multiplied in the barley plants was determined and can be compared to the 1 hour values (see A). C) Comparison of all bacterial strains tested.

3 Results __________________________________________________________________________________________________________________________________________________________________________________________________________________________________
51
3.1.2.2 Bacterial growth in planta
Determination of the number of bacteria originally infiltrated into the barley plants enabled the bacterial growth within a set period of time in planta to be examined. Depending upon the rate at which the bacteria can replicate in a certain plant, e.g. barley, information can be discerned about the nature of the bacterial infection. Katagiri et al. (2002) state that if a bacterial pathogen is virulent it can replicate more than 10 000 fold within a few days, whereas avirulent bacteria will either not grow or only multiply 10 - 100 fold.
For the increasing bacterial concentrations infiltrated using X.t.cer as an example, it can be seen (Figure 5B) that the replication factor approximately 6 000 fold remains comparable irrespective of the initial infiltration concentration.
When all tested bacterial strains were examined with respect to their bacterial growth inplanta, a variety of interactions could be observed (Figure 5C). P.s.syr and P.s.tom did not grow, moreover a decrease in the number of living bacteria could be seen, whilst Psm avir or VIR managed at best an increase of merely 10 fold, clearly placing these bacterial strains in the avirulent category. Although the plasmids in Psm avir or VIR display avirulent or virulent attributes in Arabidopsis, both were avirulent in barley, thereby confirming the necessity of testing each bacterial strain in the respective plant to determine the nature of the experimental pathosystem.
Xanthomonas bacterial strains displayed a near virulent behaviour, depending on the experiment 2 - 6 000 fold increase could be observed. This is slightly lower than the value for virulent pathogens, yet far from the rate described for avirulent pathogens. The multiplication factor, 600 - 700, for P.s.jap was found to lie in between that of the Xanthomonas strains and the other Pseudomonas strains. Therefore these bacterial strains can not be ranked according to the thresholds set by Katagiri et al. (2002), as the replication rates lay between avirulent and virulent growth rates.
With this variety of bacterial pathogenicity from reduction in growth, avirulent growth, and near virulent growth in barley, a broad spectrum of plant-pathogen interactions was tested.
3.1.2.3 Local and systemic bacterial growth in planta
Further tests were carried out to check whether the bacteria could spread within the barley plant, however, it was found that the bacteria were confined to the area directly surrounding the infiltration point, the infiltration area. Local (1 - 2 cm away from the infiltrated area on the infiltrated leaf) and systemic (from a distal leaf) samples were tested in a similar manner to the infiltration area, but no living bacteria could be found (data not shown). As there were

3 Results __________________________________________________________________________________________________________________________________________________________________________________________________________________________________
52
contamination problems with Xanthomonas translucens pv. hordei (X.t.hor) infiltrated plants, they could not be included in this experimental series.
3.1.2.4 Locally induced bacterial lesions
Induced bacterial lesions are displayed in Figure 6. As can be seen for Xanthomonas strains when lower concentrations were infiltrated no external symptoms could be observed. Whilst at the higher concentrations either chlorosis (X.t.cer and X.t.hor) or water soaked areas (Xanthomonas translucens pv. translucens, X.t.tra) were to be found. To visually aid the experimental process the lowest concentration at which symptoms could be observed was chosen 1 x 10⁸ cfu/ ml.
For all the Pseudomonas strains tested similar necrotic lesions were found irrespective of infiltration concentration or strain infiltrated. However, the necrosis that developed following infiltration with 1 x 10⁸ cfu/ ml Psm avir or VIR were patchy and did not cover the complete infiltration area. It should be noted that all the observed bacterial lesions were discrete and could only be found around the infiltration point, which was still visible 5 days after infiltration.

3 Results __________________________________________________________________________________________________________________________________________________________________________________________________________________________________
53
P.s.jap
106
108
P.s.syr
1010
P.s.tom
1010
Psm avir
108
1010
Psm VIR
108
1010
X.t.tra
104
106
108
1010
X.t.cer
104
106
108
1010
X.t.hor
104
106
108
1010
Figure 6. Typical bacterial symptoms on barley leaves five days after infiltration. Six days old barley plants were infiltrated with bacterial suspensions at different concentrations of colony forming units (cfu) per ml: 1 x 10⁴, 1 x 10⁶, 1 x 10⁸ or 1 x 10¹⁰ cfu/ ml. X.t.cer, X.t.hor, X.t.tra, P.s.jap, Psmavir or VIR, P.s.syr and P.s.tom were the bacteria tested. A representative leaf for each treatment is displayed.
3.1.2.5 Induced resistance by biological inducers
Comparison of P.s.syr and P.s.tom
P.s.syr and P.s.tom were the first bacteria to be tested for their potential resistance inducing properties. As described above these two bacterial strains displayed an avirulent nature in barley and they caused necrosis formation (Figure 6). When either of the above bacterial strains was infiltrated into local barley leaves at high bacterial concentrations (1 x 10¹⁰ cfu/ ml) and inoculated with Bgh 5 days later, lower fungal infection on systemic leaves was variable, e.g. P.s.syr 83 % ± 10 % (striped columns in Figure 1). Whilst when the lower bacterial concentration (1 x 10⁸ cfu/ ml) was infiltrated no effect could be seen with respect to the resistance induced, P.s.tom 99 % ± 6 %. The bacteria used for these experiments were in the stationary phase of growth, which could explain the varying results. It can be expected that in addition to living bacteria, dead bacteria were also infiltrated into the barley plants. In the next phase of the system development, care was taken to ensure that the bacteria used for infiltration purposes were prepared from logarithmically growing bacterial cultures.
3 Results __________________________________________________________________________________________________________________________________________________________________________________________________________________________________
54
Comparison of avirulent and virulent strains (Psm)
For Psm avir and VIR again two different infiltration concentrations (1 x 10⁸ and 1 x 10¹⁰ cfu/ ml) were tested to ascertain whether this had an effect on the resistance inducing properties of the bacteria. Although Psm avir and VIR displayed avirulent nature in barley and two different bacterial infiltration concentrations were tested, local pre-infiltration with these bacteria failed to induce lower systemic fungal infection (hatched columns in Figure 1). The fungal infection following Psm pre-infiltration was within biological variance, e.g. 1 x 10¹⁰ cfu/ ml Psm avir 89 % ± 26 % compared to mock infiltrated control plants 100 % ± 16 %.
Comparison of P.s.jap and Xanthomonas
Having found near virulent bacterial strains (X.t.cer and X.t.tra), they were tested to find out if they possessed resistance inducing qualities in this pathosystem. As displayed in Figure 1 pre-infiltration of barley plants with Xanthomonas strains led to a lower fungal growth (between 50 and 65 %) compared to the control plants (100 %). Thus showing that in spite of the near virulent nature of these Xanthomonas pathovars in the tested barley cultivar an induction of resistance could be found.
The near virulent P.s.jap could also invoke lower fungal infection in this pathosystem. Generally it was found that 1 x 10⁶ cfu/ ml P.s.jap pre-infiltration led to the best resistance induction (30 - 40 % fungal infection) of the four bacteria which displayed a significant effect.
P.s.jap, X.t.cer, X.t.hor and X.t.tra resistance induction was variable; Figure 7 displays two from a series of seven independent experiments which show both extremes. The experiment depicted in Figure 7A gave rise to the best resistance induction observed within the period of this dissertation. All four bacteria induced lower fungal infection between 13 and 28 % Bghinfection compared to 100 % for mock treated plants. Leaf material from this main experiment was used for the further analyses into the molecular mechanisms in Section 3.2.
Figure 7B illustrates the other end of the scale, where only P.s.jap pre-infiltration led to a 50 % fungal infection. X.t.cer and X.t.tra pre-infiltration had no effect on Bgh infection and resembled the mock treated plants. X.t.hor was left out of this experiment due to contamination problems. Prior to infiltration the bacterial solutions were stored for 1 - 2 hours at 4 °C. It is possible that this altered the bacterial vitality, and as such reduced their ability to induce resistance. Alternatively, perhaps the barley plants had not been watered sufficiently leading to a slight drought stress, making them less responsive to the bacteria, and therefore causing them to react only with lesser molecular induction. It is also possible that drought stressed plants are more susceptible to powdery mildew infection.
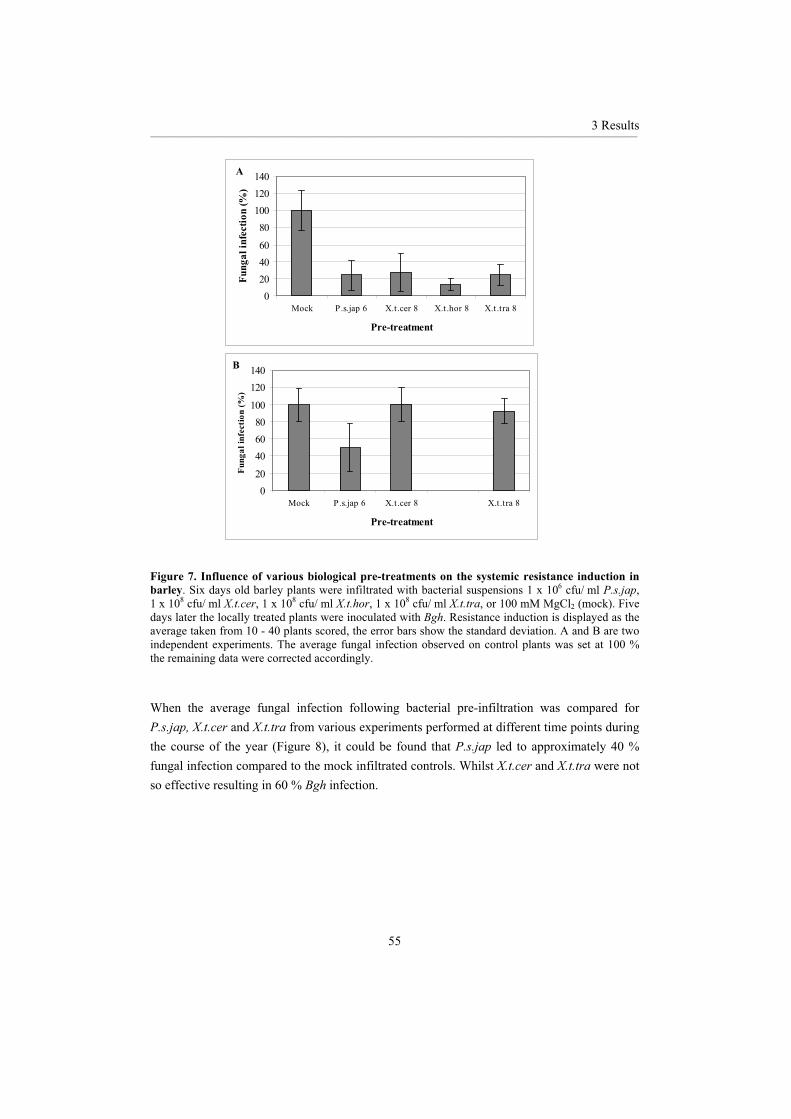
3 Results __________________________________________________________________________________________________________________________________________________________________________________________________________________________________
55
0204060
80100120140
Mock P.s.jap 6 X.t.cer 8 X.t.hor 8 X.t.tra 8
Pre-treatment
Fung
al in
fect
ion
(%)
A
020
406080
100
120140
Mock P.s.jap 6 X.t.cer 8 X.t.tra 8
Pre-treatment
Fung
al in
fect
ion
(%)
B
Figure 7. Influence of various biological pre-treatments on the systemic resistance induction in barley. Six days old barley plants were infiltrated with bacterial suspensions 1 x 10⁶ cfu/ ml P.s.jap,1 x 108 cfu/ ml X.t.cer, 1 x 10⁸ cfu/ ml X.t.hor, 1 x 10⁸ cfu/ ml X.t.tra, or 100 mM MgCl2 (mock). Five days later the locally treated plants were inoculated with Bgh. Resistance induction is displayed as the average taken from 10 - 40 plants scored, the error bars show the standard deviation. A and B are two independent experiments. The average fungal infection observed on control plants was set at 100 % the remaining data were corrected accordingly.
When the average fungal infection following bacterial pre-infiltration was compared for P.s.jap, X.t.cer and X.t.tra from various experiments performed at different time points during the course of the year (Figure 8), it could be found that P.s.jap led to approximately 40 % fungal infection compared to the mock infiltrated controls. Whilst X.t.cer and X.t.tra were not so effective resulting in 60 % Bgh infection.

3 Results __________________________________________________________________________________________________________________________________________________________________________________________________________________________________
56
0
20
40
60
80
100
120
140
Mock P.s.jap X.t.cer X.t.tra
Pre-infiltration
Fung
al in
fect
ion
(%) c
a
bb
Figure 8. Influence of various bacterial pre-infiltration on the systemic resistance induction in barley. Six days old barley plants were infiltrated with bacterial suspensions 1 x 10⁶ cfu/ ml P.s.jap,1 x 108 cfu/ ml X.t.cer, 1 x 10⁸ cfu/ ml X.t.tra, or 100 mM MgCl2 (mock). Five days later the locally treated plants were inoculated with Bgh. Resistance induction is displayed as the average taken from 100 - 120 plants scored from six independent experiments, the error bars show the standard deviation. The average fungal infection observed on control plants was set at 100 % the remaining data were corrected accordingly. Statistical analysis was performed by ANOVA, different letters indicate significant difference between the treatments (P < 0.05).
X.t.hor was generally involved in resistance induction experiments. However, this strain was difficult to cultivate, which has led to less experimental repetitions compared to the other bacterial strains. For this reason X.t.hor data has been excluded from Figures 8 and 9. Since X.t.hor functioned well as a biological resistance inducer in the main experimental series (Figure 7A), the further analyses were also carried out with X.t.hor pre-treated barley leaves. Therefore all X.t.hor data in the further analyses should be considered with caution, and would have to be statistically verified.
3.1.3 Comparison of biological and chemical resistance inducers
After identification of chemical and biological resistance inducers the next step was to compare the effects of the individual inducer.
The results from six independent experiments carried out at various time points throughout the year were pooled together. Each individual experiment consisted of a minimum of 7 plants per pre-treatment, though for most experiments data from 10 - 20 plants were incorporated in the overall data analysis. Figure 9A displays the average infected fungal area on systemic barley leaves following pre-treatment with biological and chemical resistance inducers.
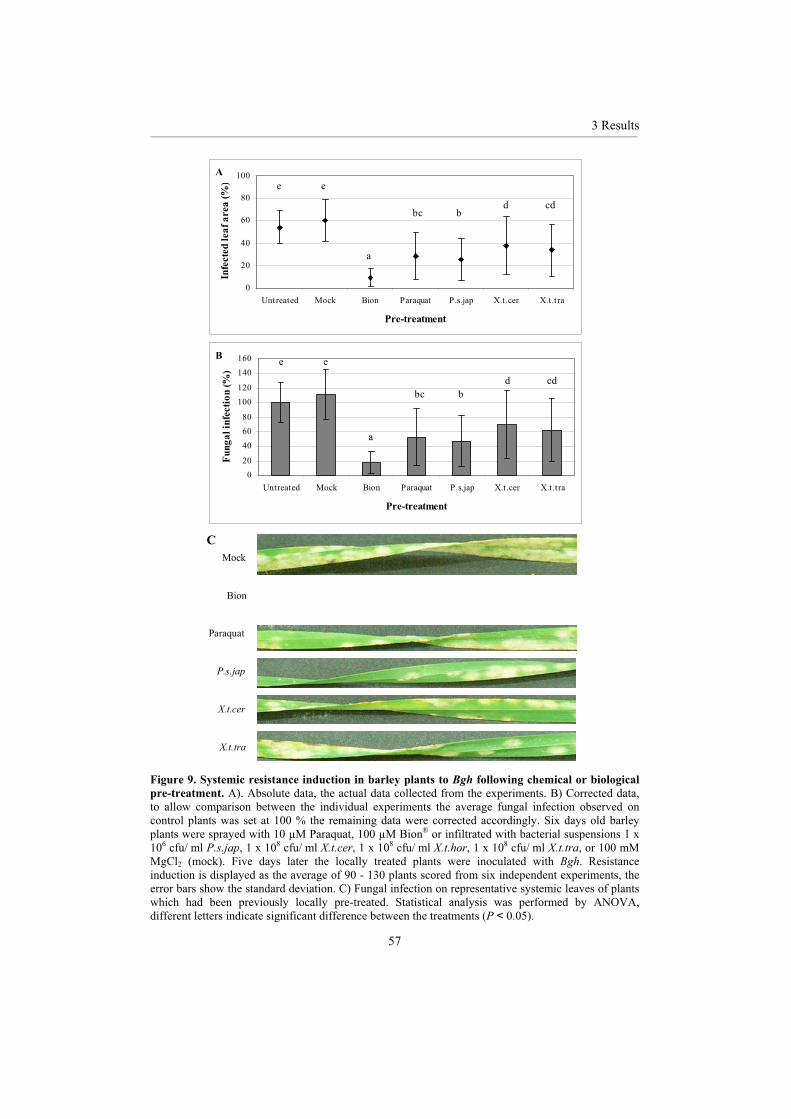
3 Results __________________________________________________________________________________________________________________________________________________________________________________________________________________________________
57
0
20
40
60
80
100
Untreated Mock Bion Paraquat P.s.jap X.t.cer X.t.tra
Pre-treatment
Infe
cted
leaf
are
a (%
)
Ae e
a
bc bcdd
020
406080
100120
140160
Untreated Mock Bion Paraquat P.s.jap X.t.cer X.t.tra
Pre-treatment
Fung
al in
fect
ion
(%)
B e e
a
bc bcdd
Mock
Bion
Paraquat
P.s.jap
X.t.cer
X.t.tra
C
Figure 9. Systemic resistance induction in barley plants to Bgh following chemical or biological pre-treatment. A). Absolute data, the actual data collected from the experiments. B) Corrected data, to allow comparison between the individual experiments the average fungal infection observed on control plants was set at 100 % the remaining data were corrected accordingly. Six days old barley plants were sprayed with 10 µM Paraquat, 100 µM Bion® or infiltrated with bacterial suspensions 1 x 10⁶ cfu/ ml P.s.jap, 1 x 10⁸ cfu/ ml X.t.cer, 1 x 10⁸ cfu/ ml X.t.hor, 1 x 10⁸ cfu/ ml X.t.tra, or 100 mM MgCl2 (mock). Five days later the locally treated plants were inoculated with Bgh. Resistance induction is displayed as the average of 90 - 130 plants scored from six independent experiments, the error bars show the standard deviation. C) Fungal infection on representative systemic leaves of plants which had been previously locally pre-treated. Statistical analysis was performed by ANOVA, different letters indicate significant difference between the treatments (P < 0.05).

3 Results __________________________________________________________________________________________________________________________________________________________________________________________________________________________________
58
To allow easier comparison with the previously displayed diagrams (Figures 1-4, 7 and 8) the corrected data is also shown (Figure 9B). It can be clearly seen that the least fungal infection can be observed in the Bion® pre-treated plants (18 %) and that this was significantly different (P < 0.05) from control plants and all other pre-treatments. Resistance mediated by Paraquat and P.s.jap pre-treatment (53 and 47 % respectively) differed significantly from the other pre-treatments and the respective control plants. Paraquat and X.t.tra resistance induction did not differ significantly from one another. X.t.cer and X.t.tra pre-treatment resulted in 70 and 63 % fungal infection, which did not differ from each other but from the remaining pre-treatments and control plants (Figure 9B).
Figure 9C displays the extent to which pre-treatments lowered the amount of fungal infection on representative systemic leaves, the majority of the mock pre-treated leaf is covered with powdery mildew whereas the other leaves exhibit less fungal infection.
Effect of soil moisture on resistance induction
When barley plants were grown under damp conditions no or very little resistance could be induced. Figure 10A shows that more fungal infection was found on pre-treated plants than the untreated controls, corrected values ranging from 92 - 189 % compared to 100 %. Whilst the second experiment (Figure 10B) depicts a similar trend, with the exception of P.s.jap20 %, all other pre-treatments were at or above the fungal infection found on untreated controls corrected values ranging from 92 - 177 %.
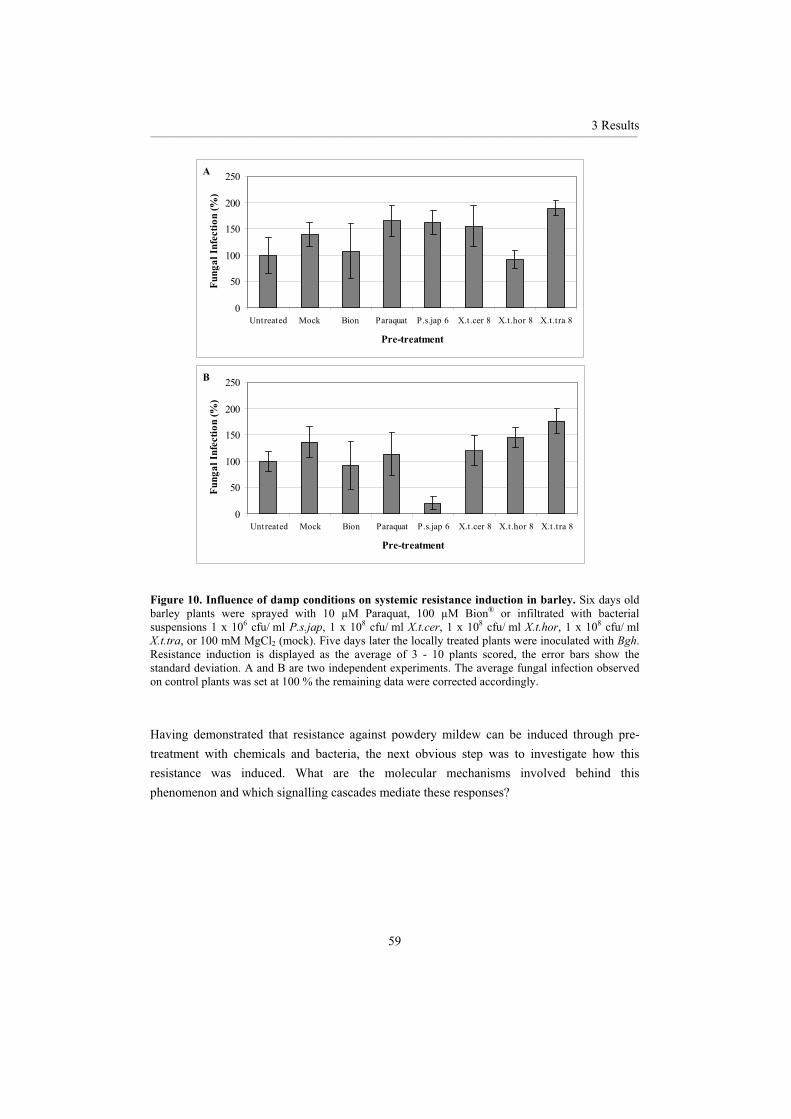
3 Results __________________________________________________________________________________________________________________________________________________________________________________________________________________________________
59
0
50
100
150
200
250
Untreated Mock Bion Paraquat P.s.jap 6 X.t.cer 8 X.t.hor 8 X.t.tra 8
Pre-treatment
Fung
al In
fect
ion
(%)
A
0
50
100
150
200
250
Untreated Mock Bion Paraquat P.s.jap 6 X.t.cer 8 X.t.hor 8 X.t.tra 8
Pre-treatment
Fung
al In
fect
ion
(%)
B
Figure 10. Influence of damp conditions on systemic resistance induction in barley. Six days old barley plants were sprayed with 10 µM Paraquat, 100 µM Bion® or infiltrated with bacterial suspensions 1 x 10⁶ cfu/ ml P.s.jap, 1 x 10⁸ cfu/ ml X.t.cer, 1 x 10⁸ cfu/ ml X.t.hor, 1 x 10⁸ cfu/ ml X.t.tra, or 100 mM MgCl2 (mock). Five days later the locally treated plants were inoculated with Bgh.Resistance induction is displayed as the average of 3 - 10 plants scored, the error bars show the standard deviation. A and B are two independent experiments. The average fungal infection observed on control plants was set at 100 % the remaining data were corrected accordingly.
Having demonstrated that resistance against powdery mildew can be induced through pre-treatment with chemicals and bacteria, the next obvious step was to investigate how this resistance was induced. What are the molecular mechanisms involved behind this phenomenon and which signalling cascades mediate these responses?

3 Results __________________________________________________________________________________________________________________________________________________________________________________________________________________________________
60
3.2 Investigations of the responsible mechanisms and signalling cascades
3.2.1 Oxidative burst
One of the first events to occur following pathogen recognition is the so-called oxidative burst, in which large amounts of reactive oxygen species (ROS) are accumulated at the site of infection (Lamb and Dixon, 1997; Heath, 2000b). This accumulation can lead to the hypersensitive response (HR) where the plant sacrifices a few cells for the greater good of the whole plant (Heath, 2000b). Another important aspect concerns the role of HR in the induction of SAR (Alvarez et al., 1998; Grant et al., 2000). Thus ROS production following bacterial infiltration could initiate signalling cascades leading to systemic induced resistance.
ROS accumulation
When barley leaves are infiltrated with DAB staining solution, sites of hydrogen peroxide accumulation can be identified as areas in which a brown precipitate is formed (Thordal-Christensen et al., 1997).
Both control and mock infiltrated plants displayed no H2O2 accumulation, whereas P.s.japinfiltration led to a quick yet transient accumulation (Figure 11A). Brown precipitate formation can be seen mainly around the edges of the P.s.jap infiltrated area 24 hours after infiltration. By 48 hours the leaf was necrotic in this region, however, hydrogen peroxide accumulation could be determined. Following X.t.cer infiltration DAB staining was visible 24 hours later, however, not as strong as following P.s.jap infiltration. Yet by 48 hours after X.t.cer infiltration hydrogen peroxide accumulation could be observed throughout the complete area in which bacteria were infiltrated. X.t.hor infiltration led to hydrogen peroxide accumulation at the outer edges of the infiltration area (24 hours), whilst later the complete area displayed brown precipitate. The slowest and/ or lowest H2O2 accumulation was observed following X.t.tra infiltration. After 24 hours brown precipitate formation was barely visible, whilst after 48 hours the hydrogen peroxide accumulation resembled the 24 hour values seen for X.t.cer and X.t.hor.
In the presence of superoxide NBT staining forms a blue product, formazan (Doke and Ohashi, 1988). Because superoxide is a by-product of photosynthesis, it was to be expected that the control and mock infiltrated leaves would display uniform weak blue staining (Figure 11B). When this staining was compared to that observed 24 hours after P.s.jap infiltration, it can be seen that blue staining in the infiltrations area was reduced compared to the control, possibly due to reduced photosynthetic activity in this area. However a higher amount of blue product was visible at the edge of the infiltration area. By 48 hours the infiltration area was

3 Results __________________________________________________________________________________________________________________________________________________________________________________________________________________________________
61
24 h 48 h
Untreated
Mock
P.s.jap
X.t.cer
X.t.hor
X.t.tra
A
Mock
X.t.cer
X.t.hor
X.t.tra
P.s.jap
Untreated
24h 48hB
Figure 11. Distribution of ROS accumulation in barley leaves infiltrated with various bacterial strains. A). H2O2 accumulation detected by DAB staining. B). O·-
2 accumulation observed following NBT staining. Six days old barley plants were infiltrated with bacterial suspensions 1 x 10⁶ cfu/ mlP.s.jap, 1 x 10⁸ cfu/ ml X.t.cer, 1 x 10⁸ cfu/ ml X.t.hor, 1 x 10⁸ cfu/ ml X.t.tra, 100 mM MgCl2 (mock) the buffer used to resuspend the bacteria or left completely untreated. At respective time points following infiltration 5 primary leaves were harvested and subjected to DAB/ NBT staining. A representative leaf for each treatment and time point is displayed. h = hours after bacterial infiltration.

3 Results __________________________________________________________________________________________________________________________________________________________________________________________________________________________________
62
dead, therefore not allowing accumulation of superoxide and no detection of superoxide as photosynthesis by-product. Exclusion of superoxide was also visible 24 hours after X.t.cer and X.t.hor infiltration. After 48 hours the reaction to X.t.hor and X.t.cer differed. While still no superoxide could be detected in the infiltration area of X.t.hor a clear accumulation within the X.t.cer infiltration area was visible, with strong staining at the edges. This was comparable to the reaction to P.s.jap infiltration after 24 hours. Superoxide accumulation after X.t.trainfiltration was unclear, by 24 hours the staining resembled the control plants, whereas at 48 hours a small exclusion zone became visible.
For both types of staining only the infiltrated area was found to accumulate ROS this correlates with the area in which bacterial lesions were found, compare Figure 6.
Ascorbate peroxidase transcript expression
Ascorbate peroxidase (APX) is an enzyme involved in the Halliwell-Asada pathway for removing ROS. It therefore plays an important role in maintaining the antioxidant balance within the cell (Shigeoka et al., 2002). APX gene expression was found to be induced in response to various stress conditions, e.g. paraquat, ethylene and drought, suggesting an important role in stress tolerance (Inzé and Van Montagu, 1995). An alternative role for APX is linked to the findings that SA and Bion® inhibit APX enzyme activity. This APX suppression would lead to a dramatic increase in H2O2 accumulation, which would subsequently activate cell death and defence related gene expression (Durner and Klessig, 1995; Mittler et al., 1998; Iriti et al., 2003). Thus if HR is involved in the systemic resistance against Bgh reduced APX gene expression in pre-treated and inoculated plants would be expected.
In plants pre-treated with either X.t.hor or P.s.jap and inoculated with Bgh, APX transcription expression was induced in systemic samples taken 4 hours after inoculation, thus representing the early reactions (Figure 12). Therefore these pre-treated plants were able to respond quicker to the second pathogen attack. For all other treatments a basal expression could be observed. By 24 hours a slightly elevated expression was found in all inoculated samples with no great differences between the individual treatments.

3 Results __________________________________________________________________________________________________________________________________________________________________________________________________________________________________
63
Untreated
- +
Mock
- +
Bion
- +
Paraquat
- +
X.t.cer
- +
X.t.hor
- +
P.s.jap
- +
X.t.tra
- +
4 hSys
24 h Sys
B.g.h.
Figure 12. Characterisation of ascorbate peroxidase expression. Six day old barley plants (cv. Villa) were pre-treated with 100 µM Bion®, 10 µM Paraquat in comparison to untreated control plants or pre-infiltrated with 1 x 10⁸ cfu/ ml X.t.cer, 1 x 10⁸ cfu/ ml X.t.hor, 1 x 10⁸ cfu/ ml X.t.tra, 1 x 10⁶
cfu/ ml P.s.jap in comparison to 100 mM MgCl2 (mock) pre-infiltration. Inoculation with Bgh (+) took place 5 days following pre-treatment, some plants were left uninoculated (-). Plants were harvested 10 or 24 hours later and the total RNA isolated from systemic (Sys) leaves. After gel electrophoretic separation the APX expression was subjected to Northern blot analysis. Equal RNA loading was verified by methylene blue staining of the membrane.
3.2.2 Phenolic accumulation
It has been previously described that phenolic compounds play an important role in pathogen defence (Nicholson and Hammerschmidt, 1992; Dixon et al., 2002). Therefore if phenolics were involved in resistance induction either pre-treatments alone would lead to altered local and/ or systemic phenolic accumulation or treated plants would respond quicker to challenge infection producing phenolic compounds.
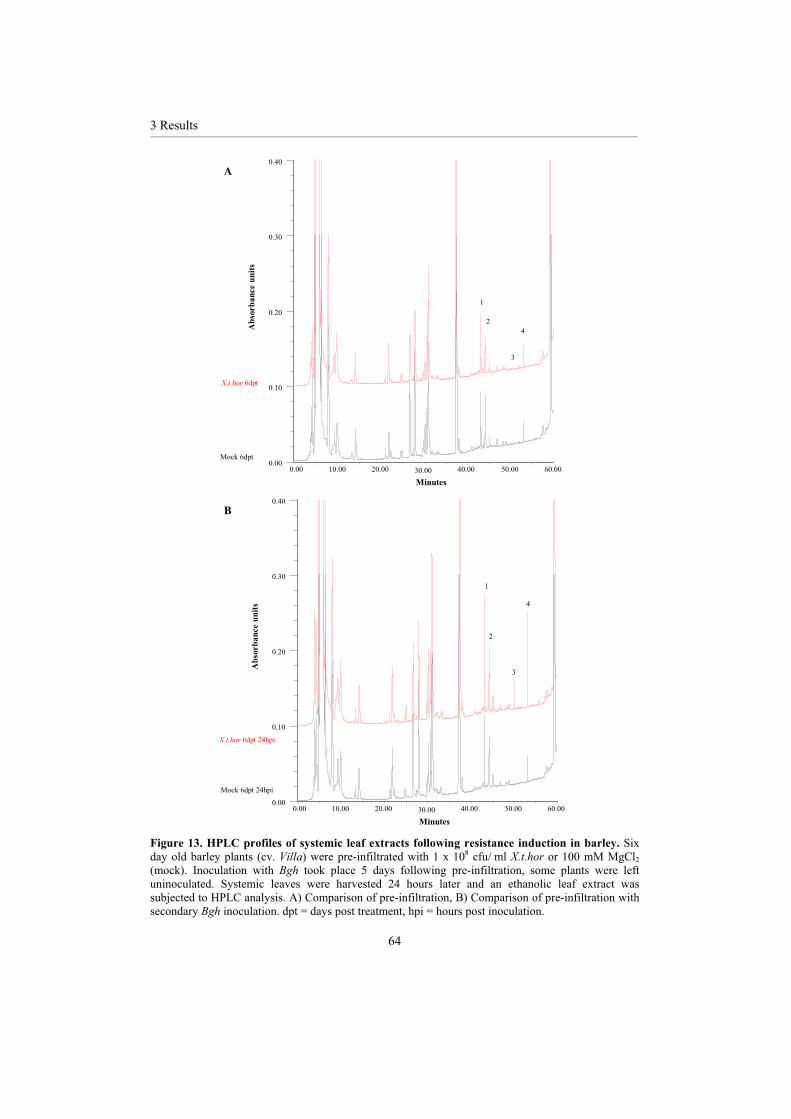
3 Results __________________________________________________________________________________________________________________________________________________________________________________________________________________________________
64
Mock 6dpt
X.t.hor 6dpt
1
2
3
4
0.00
0.10
0.20
0.30
0.40
Abs
orba
nce
units
Minutes0.00 10.00 20.00 30.00 40.00 50.00 60.00
A
Mock 6dpt 24hpi
X.t.hor 6dpt 24hpi
1
2
3
4
0.00
0.10
0.20
0.30
0.40
Abs
orba
nce
units
Minutes0.00 10.00 20.00 30.00 40.00 50.00 60.00
B
Figure 13. HPLC profiles of systemic leaf extracts following resistance induction in barley. Six day old barley plants (cv. Villa) were pre-infiltrated with 1 x 10⁸ cfu/ ml X.t.hor or 100 mM MgCl2(mock). Inoculation with Bgh took place 5 days following pre-infiltration, some plants were left uninoculated. Systemic leaves were harvested 24 hours later and an ethanolic leaf extract was subjected to HPLC analysis. A) Comparison of pre-infiltration, B) Comparison of pre-infiltration with secondary Bgh inoculation. dpt = days post treatment, hpi = hours post inoculation.
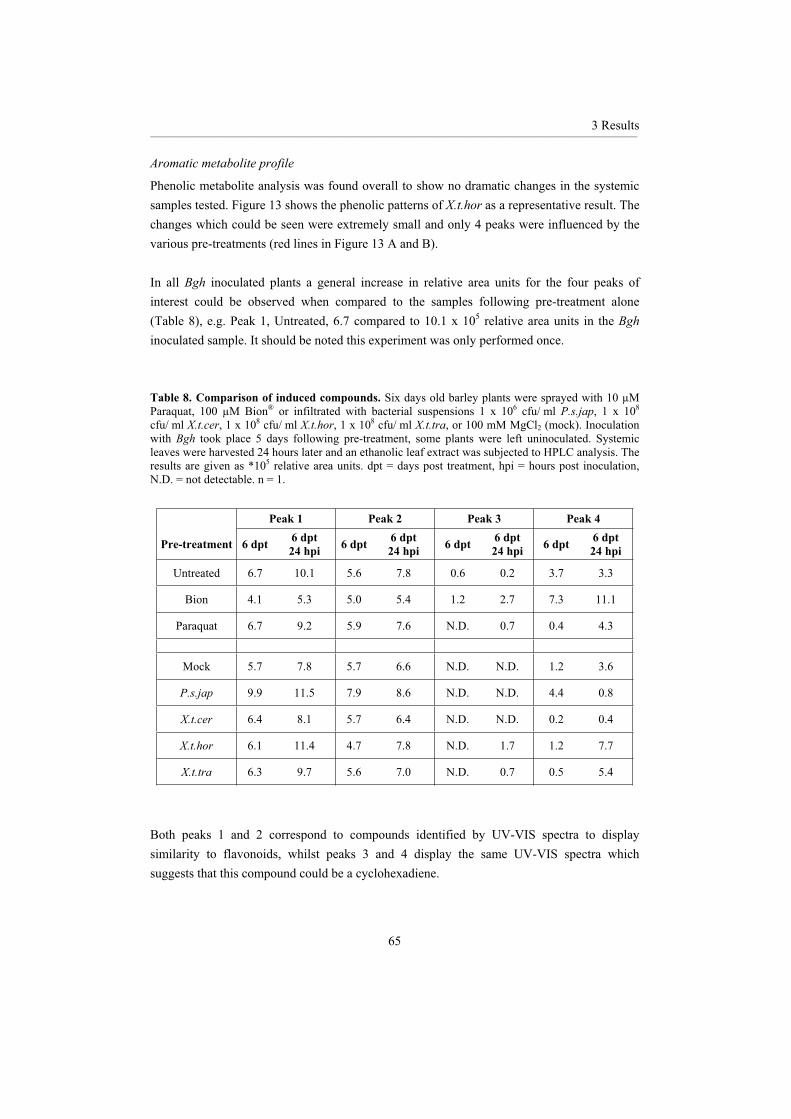
3 Results __________________________________________________________________________________________________________________________________________________________________________________________________________________________________
65
Aromatic metabolite profile
Phenolic metabolite analysis was found overall to show no dramatic changes in the systemic samples tested. Figure 13 shows the phenolic patterns of X.t.hor as a representative result. The changes which could be seen were extremely small and only 4 peaks were influenced by the various pre-treatments (red lines in Figure 13 A and B).
In all Bgh inoculated plants a general increase in relative area units for the four peaks of interest could be observed when compared to the samples following pre-treatment alone (Table 8), e.g. Peak 1, Untreated, 6.7 compared to 10.1 x 10⁵ relative area units in the Bghinoculated sample. It should be noted this experiment was only performed once.
Table 8. Comparison of induced compounds. Six days old barley plants were sprayed with 10 µM Paraquat, 100 µM Bion® or infiltrated with bacterial suspensions 1 x 10⁶ cfu/ ml P.s.jap, 1 x 10⁸
cfu/ ml X.t.cer, 1 x 10⁸ cfu/ ml X.t.hor, 1 x 10⁸ cfu/ ml X.t.tra, or 100 mM MgCl2 (mock). Inoculation with Bgh took place 5 days following pre-treatment, some plants were left uninoculated. Systemic leaves were harvested 24 hours later and an ethanolic leaf extract was subjected to HPLC analysis. The results are given as *105 relative area units. dpt = days post treatment, hpi = hours post inoculation, N.D. = not detectable. n = 1.
Peak 1 Peak 2 Peak 3 Peak 4
Pre-treatment 6 dpt 6 dpt 24 hpi 6 dpt 6 dpt
24 hpi 6 dpt 6 dpt24 hpi 6 dpt 6 dpt
24 hpi
Untreated 6.7 10.1 5.6 7.8 0.6 0.2 3.7 3.3
Bion 4.1 5.3 5.0 5.4 1.2 2.7 7.3 11.1
Paraquat 6.7 9.2 5.9 7.6 N.D. 0.7 0.4 4.3
Mock 5.7 7.8 5.7 6.6 N.D. N.D. 1.2 3.6
P.s.jap 9.9 11.5 7.9 8.6 N.D. N.D. 4.4 0.8
X.t.cer 6.4 8.1 5.7 6.4 N.D. N.D. 0.2 0.4
X.t.hor 6.1 11.4 4.7 7.8 N.D. 1.7 1.2 7.7
X.t.tra 6.3 9.7 5.6 7.0 N.D. 0.7 0.5 5.4
Both peaks 1 and 2 correspond to compounds identified by UV-VIS spectra to display similarity to flavonoids, whilst peaks 3 and 4 display the same UV-VIS spectra which suggests that this compound could be a cyclohexadiene.
3 Results __________________________________________________________________________________________________________________________________________________________________________________________________________________________________
66
Bion® pre-treatment reduced the accumulation of the flavonoid compound (Peak 1) and following inoculation both flavonoid compounds were reduced compared to the control plants (Peaks 1 and 2). In comparison Bion® pre-treatment led to an induction of the compounds corresponding to peaks 3 and 4, which was elevated further following fungal infection. Suggesting that cyclohexadienes but not flavonoids could play a role in Bion® mediated resistance induction in the barley-powdery mildew pathosystem.
Paraquat pre-treatment displayed no effect on the flavonoid accumulation in comparison to control plants. However, the compounds represented by both peaks 3 and 4 appear to be reduced by Paraquat pre-treatment alone, yet in pre-treated inoculated plants an increase was observed compared to the control plants.
In stark contrast to Bion® pre-treatment, P.s.jap infiltration led to increased accumulation of both peaks 1 and 2. This increase was further elevated in the inoculated samples compared to the mock infiltrated plants. Interestingly peak 4 was increased following P.s.jap pre-treatment alone but decreased in the P.s.jap pre-treated inoculated plants. This suggests that for this type of resistance flavonoids play a more important role.
In general there is no significant overall soluble phenolic accumulation. It is irrelevant whether the plants were pre-treated or inoculated, the phenylpropanoid pathway does not seem to be triggered in the forms of induced resistance seen. But still it is unclear whether one of the identified substances might play a role in the defence reaction, as there seems to be a degree of regulation. Large variability was observed for the few substances which displayed altered accumulation, although the changes were inconsistent could be important.
Salicylic acid accumulation
In dicotyledons salicylic acid (SA) is known to accumulate in systemic tissue after SAR has been induced (Métraux et al., 1990; Malamy et al., 1990; Ryals et al., 1995). However whether this occurs in monocotyledons has yet to be shown. The monocotyledon plant rice has a high constitutive SA level, it has been shown that rice cultivars with higher SA levels are less susceptible to pathogen attack than cultivars with lower SA content (Silverman et al.,1995). Thus biological or chemical pre-treatment could enhance basal SA levels or might lead to the plants being able to respond quicker to fungal attack, also known as priming. To determine whether SA or its glucoside (SAG) accumulation play a role in the induced resistance observed, SA and SAG concentration were compared. These results, however, should be viewed with caution as there were only performed once. Because the observed changes were not in the same order of magnitude as that described in dicotyledons no further tests were carried out. The concentrations of both SA and SAG were in the lower detection area for the used measurement method.
3 Results __________________________________________________________________________________________________________________________________________________________________________________________________________________________________
67
The pre-treatments alone had little effect on the SA concentration in the systemic leaves, if anything less SA could be found in Bion®, X.t.cer and P.s.jap pre-treated plants. An increase in SA after inoculation was found in the untreated controls, Bion® and P.s.jap pre-treated plants, 2 fold increase in the 24 hpi sample, much lower than the 5 - 10 fold found in systemic tobacco leaves following local TMV infection (Malamy et al., 1990).
For the detection system used here the detection limit for SAG was 500 ng/ g fresh weight (FW), for most of the samples analysed it could only be stated that less than 500 ng/ g FW was present. P.s.jap pre-treated plants displayed slightly elevated SAG concentrations of approximately 600 ng SAG/ g FW irrelevant of whether the plants were inoculated or not. X.t.tra pre-treatment led to a potentiation of SAG accumulation, the pre-treated plants were able to quickly respond and a 2 fold increase of SAG was observed in the inoculated plants, < 500 to 970 ng SAG/ g FW in inoculated samples.
SA accumulation does not appear to play a significant role in the observed induced resistance.
Phenylalanine ammonium lyase transcript expression
Phenylalanine ammonium lyase (PAL) is a key enzyme in the phenylpropanoid biosynthesis. This pathway marks the transition from primary to aromatic secondary metabolism. Phenylpropanoid biosynthesis produces a wide range of products including: lignin, phytoalexins and other phenolic compounds which play diverse roles in plant defence mechanisms (Hahlbrook and Scheel, 1989). Also SA which is involved in SAR can be produced through PAL’s action. Thus PAL regulation was investigated as marker for the involvement of phenylpropanoid biosynthesis in the observed resistance.
In early (4h) local samples from X.t.cer and P.s.jap pre-treated plants PAL expression was induced (Figure 14). All other pre-treatments potentiated PAL expression, so that the basal expression was similar in plants that were pre-treated to the control or mock infiltrated plants, yet after inoculation augmented induction was observed in the pre-treated plants. This was only a transient effect because by 24 hours after inoculation PAL expression had balanced out and all inoculated samples displayed similar induction irrespective of the pre-treatment.
In systemic samples there also appears to be pre-induction of PAL expression following the pre-treatments but after inoculation the expression was comparable to the controls and no stronger induction could be observed.
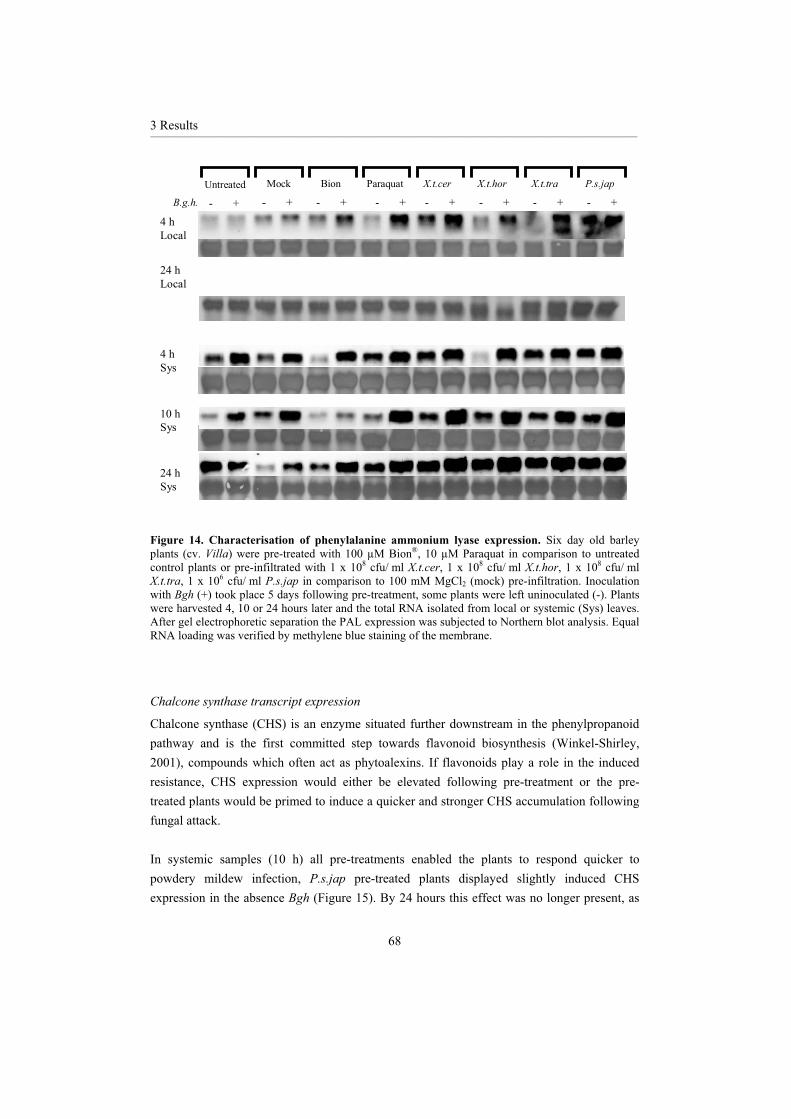
3 Results __________________________________________________________________________________________________________________________________________________________________________________________________________________________________
68
Untreated
- +
Mock
- +
Bion
- +
Paraquat
- +
X.t.cer
- +
X.t.hor
- +
P.s.jap
- +
X.t.tra
- +
4 h Local
24 hLocal
4 hSys
10 h Sys
24 h Sys
B.g.h.
Figure 14. Characterisation of phenylalanine ammonium lyase expression. Six day old barley plants (cv. Villa) were pre-treated with 100 µM Bion®, 10 µM Paraquat in comparison to untreated control plants or pre-infiltrated with 1 x 10⁸ cfu/ ml X.t.cer, 1 x 10⁸ cfu/ ml X.t.hor, 1 x 10⁸ cfu/ mlX.t.tra, 1 x 10⁶ cfu/ ml P.s.jap in comparison to 100 mM MgCl2 (mock) pre-infiltration. Inoculation with Bgh (+) took place 5 days following pre-treatment, some plants were left uninoculated (-). Plants were harvested 4, 10 or 24 hours later and the total RNA isolated from local or systemic (Sys) leaves. After gel electrophoretic separation the PAL expression was subjected to Northern blot analysis. Equal RNA loading was verified by methylene blue staining of the membrane.
Chalcone synthase transcript expression
Chalcone synthase (CHS) is an enzyme situated further downstream in the phenylpropanoid pathway and is the first committed step towards flavonoid biosynthesis (Winkel-Shirley, 2001), compounds which often act as phytoalexins. If flavonoids play a role in the induced resistance, CHS expression would either be elevated following pre-treatment or the pre-treated plants would be primed to induce a quicker and stronger CHS accumulation following fungal attack.
In systemic samples (10 h) all pre-treatments enabled the plants to respond quicker to powdery mildew infection, P.s.jap pre-treated plants displayed slightly induced CHS expression in the absence Bgh (Figure 15). By 24 hours this effect was no longer present, as

3 Results __________________________________________________________________________________________________________________________________________________________________________________________________________________________________
69
elevated CHS expression was displayed in all inoculated samples with no differences between the treatments.
Untreated
- +
Mock
- +
Bion
- +
Paraquat
- +
X.t.cer
- +
X.t.hor
- +
P.s.jap
- +
X.t.tra
- +
10 h Sys
24 h Sys
B.g.h.
Figure 15. Characterisation of chalcone synthase expression. Six day old barley plants (cv. Villa)were pre-treated with 100 µM Bion®, 10 µM Paraquat in comparison to untreated control plants or pre-infiltrated with 1 x 10⁸ cfu/ ml X.t.cer, 1 x 10⁸ cfu/ ml X.t.hor, 1 x 10⁸ cfu/ ml X.t.tra, 1 x 10⁶ cfu/ mlP.s.jap in comparison to 100 mM MgCl2 (mock) pre-infiltration. Inoculation with Bgh (+) took place 5 days following pre-treatment, some plants were left uninoculated (-). Plants were harvested 10 or 24 hours later and the total RNA isolated from systemic (Sys) leaves. After gel electrophoretic separation the CHS expression was subjected to Northern blot analysis. Equal RNA loading was verified by methylene blue staining of the membrane.
3.2.3 Signal transduction
Besides ROS and SA other important signalling molecules found in plants (e.g. jasmonic acid and ethylene) are also known to influence plants resistance induction. This section aims to determine whether these signals play a role in the development of the observed resistance induction. The amount or concentrations of the signalling molecules themselves was not investigated, rather the transcript expression of key enzymes within the biosynthesis pathways of the relevant molecules.
Role of Jasmonic acid
Lipoxygenase (LOX) is an important enzyme in the octadecanoid pathway, where lipid peroxidation products are catalysed by LOX. This enzyme is at the start of the jasmonic acid (JA) biosynthesis pathway. JA is involved in signalling as part of the induced systemic resistance (ISR) induced by root growth promoting bacteria (Pieterse et al., 1996; Dong 2001); in the wound response and in pathogen defence (Rosahl, 1996). Thus if JA plays a role in the observed resistance LOX transcript expression would be altered in comparison to the
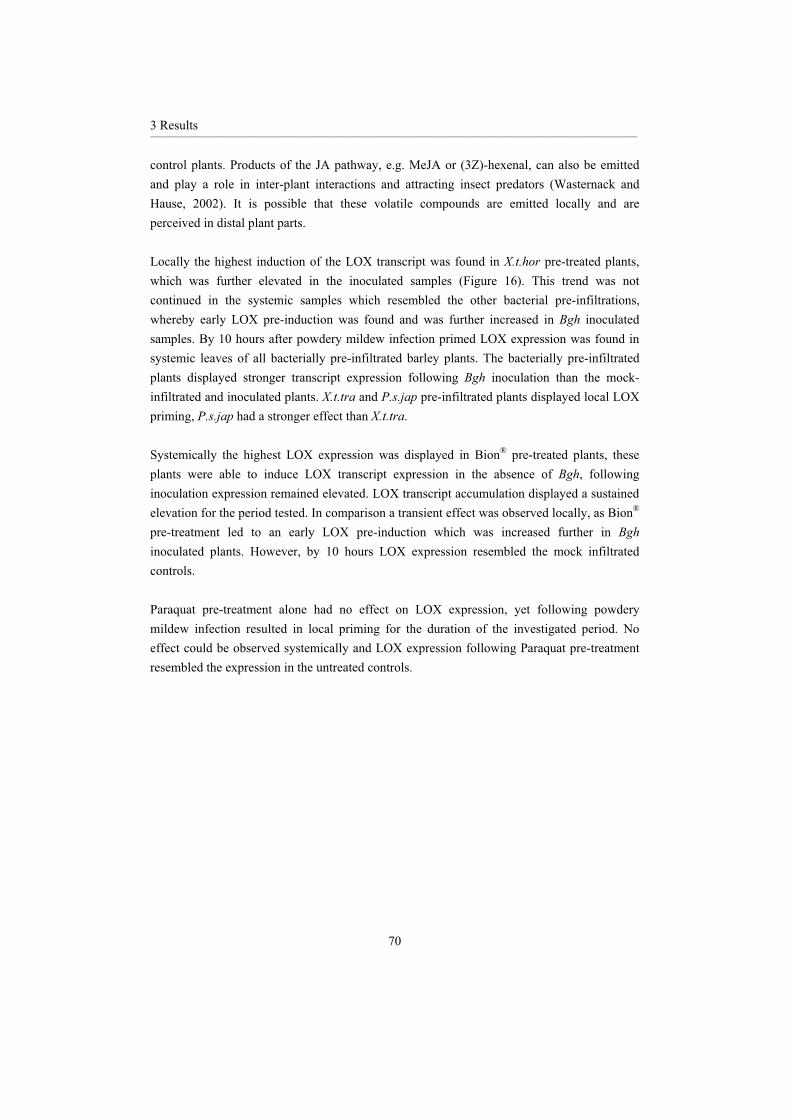
3 Results __________________________________________________________________________________________________________________________________________________________________________________________________________________________________
70
control plants. Products of the JA pathway, e.g. MeJA or (3Z)-hexenal, can also be emitted and play a role in inter-plant interactions and attracting insect predators (Wasternack and Hause, 2002). It is possible that these volatile compounds are emitted locally and are perceived in distal plant parts.
Locally the highest induction of the LOX transcript was found in X.t.hor pre-treated plants, which was further elevated in the inoculated samples (Figure 16). This trend was not continued in the systemic samples which resembled the other bacterial pre-infiltrations, whereby early LOX pre-induction was found and was further increased in Bgh inoculated samples. By 10 hours after powdery mildew infection primed LOX expression was found in systemic leaves of all bacterially pre-infiltrated barley plants. The bacterially pre-infiltrated plants displayed stronger transcript expression following Bgh inoculation than the mock-infiltrated and inoculated plants. X.t.tra and P.s.jap pre-infiltrated plants displayed local LOX priming, P.s.jap had a stronger effect than X.t.tra.
Systemically the highest LOX expression was displayed in Bion® pre-treated plants, these plants were able to induce LOX transcript expression in the absence of Bgh, following inoculation expression remained elevated. LOX transcript accumulation displayed a sustained elevation for the period tested. In comparison a transient effect was observed locally, as Bion®
pre-treatment led to an early LOX pre-induction which was increased further in Bghinoculated plants. However, by 10 hours LOX expression resembled the mock infiltrated controls.
Paraquat pre-treatment alone had no effect on LOX expression, yet following powdery mildew infection resulted in local priming for the duration of the investigated period. No effect could be observed systemically and LOX expression following Paraquat pre-treatment resembled the expression in the untreated controls.
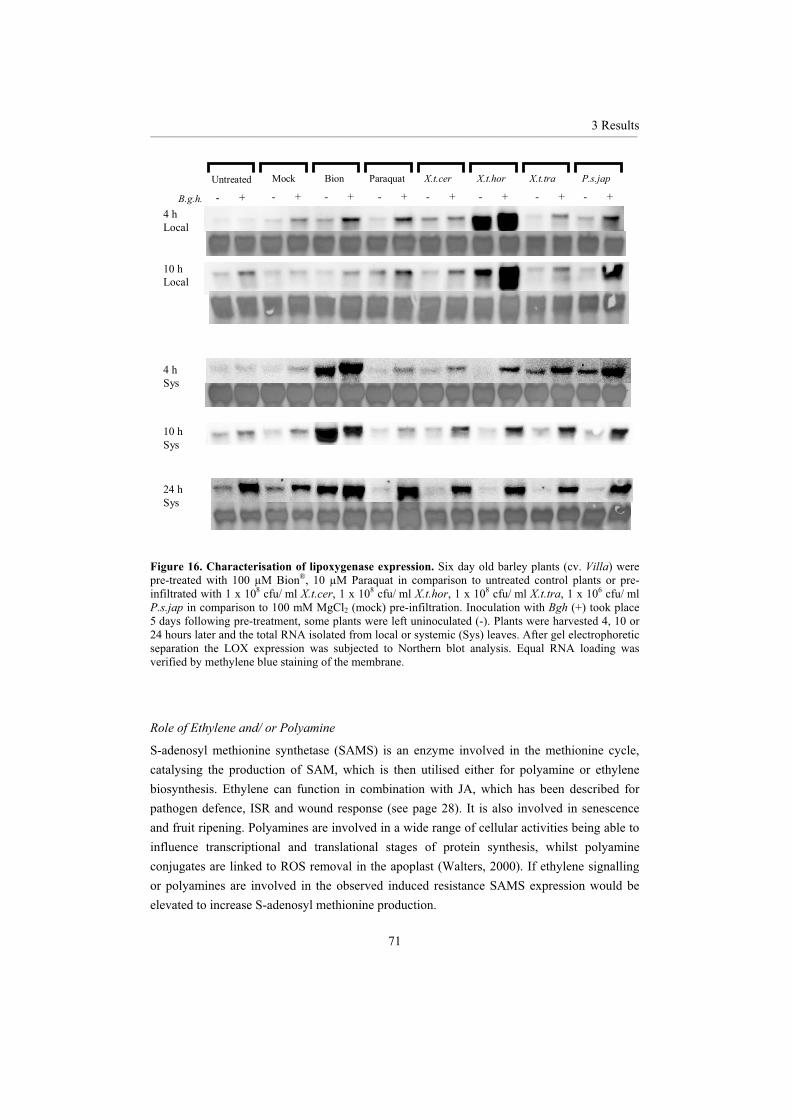
3 Results __________________________________________________________________________________________________________________________________________________________________________________________________________________________________
71
4 h Local
Untreated
- +
Mock
- +
Bion
- +
Paraquat
- +
X.t.cer
- +
X.t.hor
- +
P.s.jap
- +
X.t.tra
- +
10 hLocal
4 hSys
10 h Sys
24 h Sys
B.g.h.
Figure 16. Characterisation of lipoxygenase expression. Six day old barley plants (cv. Villa) were pre-treated with 100 µM Bion®, 10 µM Paraquat in comparison to untreated control plants or pre-infiltrated with 1 x 10⁸ cfu/ ml X.t.cer, 1 x 10⁸ cfu/ ml X.t.hor, 1 x 10⁸ cfu/ ml X.t.tra, 1 x 10⁶ cfu/ mlP.s.jap in comparison to 100 mM MgCl2 (mock) pre-infiltration. Inoculation with Bgh (+) took place 5 days following pre-treatment, some plants were left uninoculated (-). Plants were harvested 4, 10 or 24 hours later and the total RNA isolated from local or systemic (Sys) leaves. After gel electrophoretic separation the LOX expression was subjected to Northern blot analysis. Equal RNA loading was verified by methylene blue staining of the membrane.
Role of Ethylene and/ or Polyamine
S-adenosyl methionine synthetase (SAMS) is an enzyme involved in the methionine cycle, catalysing the production of SAM, which is then utilised either for polyamine or ethylene biosynthesis. Ethylene can function in combination with JA, which has been described for pathogen defence, ISR and wound response (see page 28). It is also involved in senescence and fruit ripening. Polyamines are involved in a wide range of cellular activities being able to influence transcriptional and translational stages of protein synthesis, whilst polyamine conjugates are linked to ROS removal in the apoplast (Walters, 2000). If ethylene signalling or polyamines are involved in the observed induced resistance SAMS expression would be elevated to increase S-adenosyl methionine production.
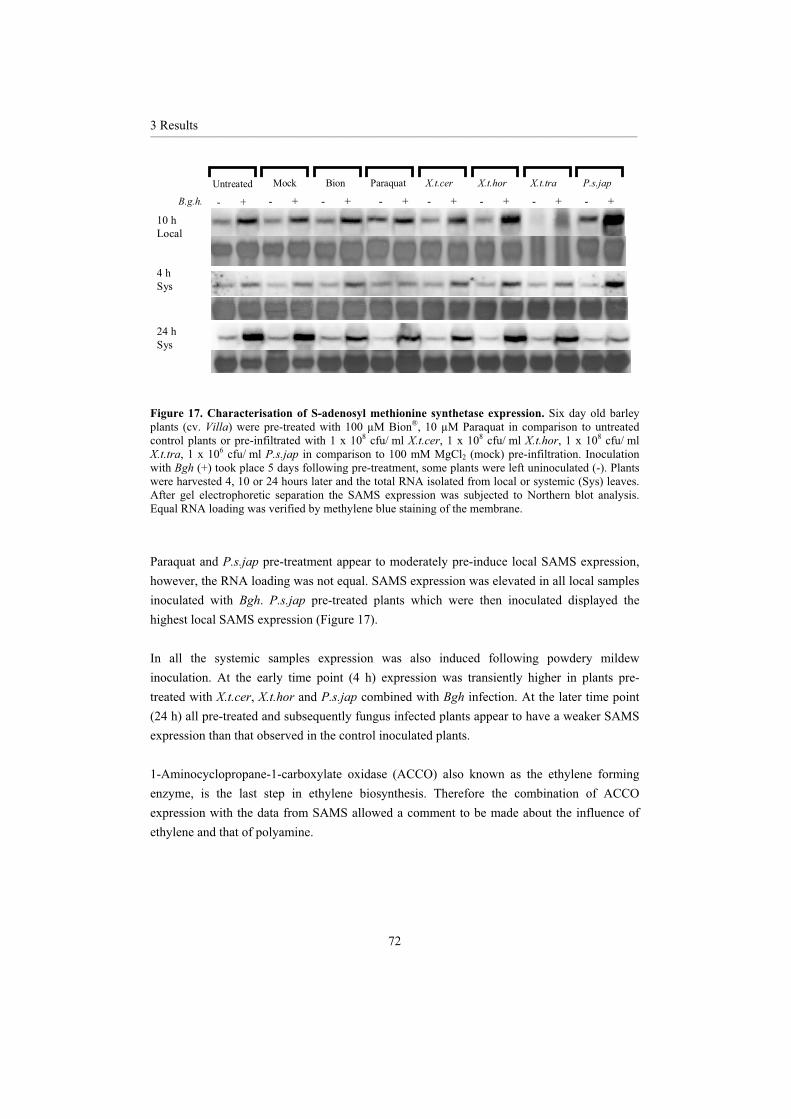
3 Results __________________________________________________________________________________________________________________________________________________________________________________________________________________________________
72
Untreated
- +
Mock
- +
Bion
- +
Paraquat
- +
X.t.cer
- +
X.t.hor
- +
P.s.jap
- +
X.t.tra
- +
10 hLocal
4 hSys
24 h Sys
B.g.h.
Figure 17. Characterisation of S-adenosyl methionine synthetase expression. Six day old barley plants (cv. Villa) were pre-treated with 100 µM Bion®, 10 µM Paraquat in comparison to untreated control plants or pre-infiltrated with 1 x 10⁸ cfu/ ml X.t.cer, 1 x 10⁸ cfu/ ml X.t.hor, 1 x 10⁸ cfu/ mlX.t.tra, 1 x 10⁶ cfu/ ml P.s.jap in comparison to 100 mM MgCl2 (mock) pre-infiltration. Inoculation with Bgh (+) took place 5 days following pre-treatment, some plants were left uninoculated (-). Plants were harvested 4, 10 or 24 hours later and the total RNA isolated from local or systemic (Sys) leaves. After gel electrophoretic separation the SAMS expression was subjected to Northern blot analysis. Equal RNA loading was verified by methylene blue staining of the membrane.
Paraquat and P.s.jap pre-treatment appear to moderately pre-induce local SAMS expression, however, the RNA loading was not equal. SAMS expression was elevated in all local samples inoculated with Bgh. P.s.jap pre-treated plants which were then inoculated displayed the highest local SAMS expression (Figure 17).
In all the systemic samples expression was also induced following powdery mildew inoculation. At the early time point (4 h) expression was transiently higher in plants pre-treated with X.t.cer, X.t.hor and P.s.jap combined with Bgh infection. At the later time point (24 h) all pre-treated and subsequently fungus infected plants appear to have a weaker SAMS expression than that observed in the control inoculated plants.
1-Aminocyclopropane-1-carboxylate oxidase (ACCO) also known as the ethylene forming enzyme, is the last step in ethylene biosynthesis. Therefore the combination of ACCO expression with the data from SAMS allowed a comment to be made about the influence of ethylene and that of polyamine.

3 Results __________________________________________________________________________________________________________________________________________________________________________________________________________________________________
73
24hSys
Untreated
- +
Mock
- +
Bion
- +
Paraquat
- +
X.t.cer
- +
X.t.hor
- +
P.s.jap
- +
X.t.tra
- +
Figure 18. Characterisation of 1-Aminocyclopropane-1-carboxylate oxidase expression. Six day old barley plants (cv. Villa) were pre-treated with 100 µM Bion®, 10 µM Paraquat in comparison to untreated control plants or pre-infiltrated with 1 x 10⁸ cfu/ ml X.t.cer, 1 x 10⁸ cfu/ ml X.t.hor, 1 x 10⁸
cfu/ ml X.t.tra, 1 x 10⁶ cfu/ ml P.s.jap in comparison to 100 mM MgCl2 (mock) pre-infiltration. Inoculation with Bgh (+) took place 5 days following pre-treatment, some plants were left uninoculated (-). Plants were harvested 24 hours after inoculation and the total RNA isolated from systemic (Sys) leaves. After gel electrophoretic separation the ACCO expression was subjected to Northern blot analysis. Equal RNA loading was verified by methylene blue staining of the membrane.
Despite the overall weak signals displayed in the blot (Figure 18), ACCO expression seemed to be reduced systemically after Bgh inoculation, irrespective of the pre-treatment.
Taken together the induction of SAMS and the reduction of ACCO after inoculation indicate an increase in polyamines and a reduction in ethylene in the barley powdery mildew interaction.
3.2.4 Chemical induced resistance
Chemical induced resistance (CIR) has up until now been described primarily in monocotyledons (Görlach et al., 1996; Beßer et al., 2000), although it can also be found in dicotyledons (Ryals et al., 1996). This is presumably because a biological model for SAR does not yet exist in barley. CIR is characterised by the expression of molecular markers, specific genes induced after chemical treatment which are not found after pathogen attack.
Expression of chemically induced transcripts
Barley chemically induced gene 4 (BCI-4) first described by Beßer et al. (2000) was used as a molecular marker for CIR. This type of gene was induced following chemical treatment e.g. Bion, but not following powdery mildew infection alone.
Figure 19 shows that only Bion® pre-treatment led to BCI-4 expression, neither Paraquat nor X.t.cer treatment had an effect on expression. Indicating a different mechanism for Paraquat despite being a chemical.
3 Results __________________________________________________________________________________________________________________________________________________________________________________________________________________________________
74
4hSys
Mock
0 4 4
- +
Untreated
0 4 4
- +
Xtcer
0 4 4
- +
Paraquat
0 4 4
- +
Bion
0 4 4
- + B.g.h.
Figure 19. Characterisation of barley chemically induced-4 expression. Six day old barley plants (cv. Villa) were pre-treated with 100 µM Bion®, 10 µM Paraquat in comparison to untreated control plants or pre-infiltrated with 1 x 10⁸ cfu/ ml X.t.cer in comparison to 100 mM MgCl2 (mock) pre-infiltration. Inoculation with Bgh (+) took place 5 days following pre-treatment, some plants were left uninoculated (-). Plants were harvested either prior to or 4 hours after inoculation and the total RNA isolated from systemic (Sys) leaves. After gel electrophoretic separation the BCI-4 expression was subjected to Northern blot analysis. Equal RNA loading was verified by methylene blue staining of the membrane.
3.2.5 Pathogenesis-related proteins
Pathogenesis-related (PR) proteins are described as a set of proteins which accumulate in plants following pathogen attack (van Loon, 1985). It has since been found that the onset of SAR in dicotyledons is correlated with the co-ordinate induction of a specific set of genes, most of which are PR proteins (Ward et al., 1991). The exact combination of these SAR genes varies between plant species (Ryals et al., 1996). If the induced resistance displays similarities to SAR it would be expected that pre-treatment would lead to co-ordinated elevated PR protein expression in systemic tissue before the secondary powdery mildew infection.
PR-1 transcript expression
PR-1 is a molecular marker for SAR in dicotyledons (Ward et al., 1991), which can be divided into isoforms: acidic, extracellular localisation and basic, intracellular localisation. Linthorst (1991) showed that both acidic and basic PR-1 proteins were induced following TMV infection and SA application in tobacco. PR-1 proteins accumulate after pathogen infection and are antifungal (Niderman et al., 1995; Selitrennikoff, 2001). Up until now only basic isoforms have been described in barley (Bryngelsson et al., 1994), which accumulated on the transcript level 3 days after powdery mildew infection. In this study the expression of basic PR-1 was examined.
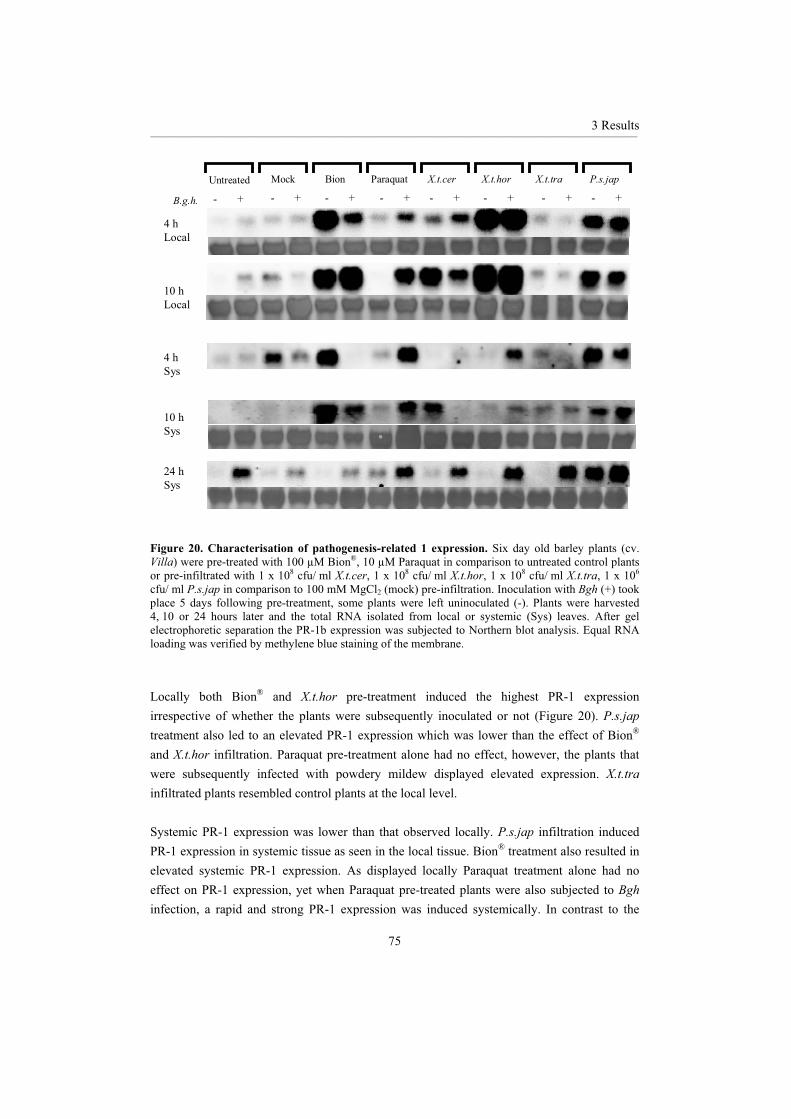
3 Results __________________________________________________________________________________________________________________________________________________________________________________________________________________________________
75
Untreated
- +
Mock
- +
Bion
- +
Paraquat
- +
X.t.cer
- +
X.t.hor
- +
P.s.jap
- +
X.t.tra
- +
4 h Local
10 hLocal
4 hSys
10 h Sys
24 h Sys
B.g.h.
Figure 20. Characterisation of pathogenesis-related 1 expression. Six day old barley plants (cv. Villa) were pre-treated with 100 µM Bion®, 10 µM Paraquat in comparison to untreated control plants or pre-infiltrated with 1 x 10⁸ cfu/ ml X.t.cer, 1 x 10⁸ cfu/ ml X.t.hor, 1 x 10⁸ cfu/ ml X.t.tra, 1 x 10⁶
cfu/ ml P.s.jap in comparison to 100 mM MgCl2 (mock) pre-infiltration. Inoculation with Bgh (+) took place 5 days following pre-treatment, some plants were left uninoculated (-). Plants were harvested 4, 10 or 24 hours later and the total RNA isolated from local or systemic (Sys) leaves. After gel electrophoretic separation the PR-1b expression was subjected to Northern blot analysis. Equal RNA loading was verified by methylene blue staining of the membrane.
Locally both Bion® and X.t.hor pre-treatment induced the highest PR-1 expression irrespective of whether the plants were subsequently inoculated or not (Figure 20). P.s.japtreatment also led to an elevated PR-1 expression which was lower than the effect of Bion®
and X.t.hor infiltration. Paraquat pre-treatment alone had no effect, however, the plants that were subsequently infected with powdery mildew displayed elevated expression. X.t.trainfiltrated plants resembled control plants at the local level.
Systemic PR-1 expression was lower than that observed locally. P.s.jap infiltration induced PR-1 expression in systemic tissue as seen in the local tissue. Bion® treatment also resulted in elevated systemic PR-1 expression. As displayed locally Paraquat treatment alone had no effect on PR-1 expression, yet when Paraquat pre-treated plants were also subjected to Bghinfection, a rapid and strong PR-1 expression was induced systemically. In contrast to the

3 Results __________________________________________________________________________________________________________________________________________________________________________________________________________________________________
76
elevated local PR-1 expression pattern for X.t.hor pre-treatment, in systemic leaves a different pattern was found. This resembled that seen following Paraquat treatment, such that a quicker PR-1 induction following Bgh infection was seen, whilst X.t.hor pre-treatment did not induce PR-1 transcript accumulation.
-1,3-glucanase transcript expression
-1,3-glucanase (GLC) is one of the first enzymes to attack pathogenic fungi, they hydrolyse the fungal cell walls, and it is also a typical PR-protein (Ryals et al., 1996; Prell and Day, 2001).
Bion® treatment led to elevated glucanase expression both locally and systemically irrespective of whether the plants were only treated with Bion® or also inoculated (Figure 21). X.t.hor infiltration induced glucanase expression locally yet had little effect on transcript expression in systemic tissue. X.t.cer and P.s.jap infiltration both caused moderate local glucanase expression, however, at the earlier time point (10 h) systemically a priming effect was found. P.s.jap infiltrated plants were able to accumulate glucanase mRNA quicker in response to fungal attack than mock infiltrated and inoculated plants. Paraquat pre-treatment also displayed a priming effect at the same time point in systemic leaves. X.t.tra infiltrated plants resembled transcript expression observed in control plants on both levels.
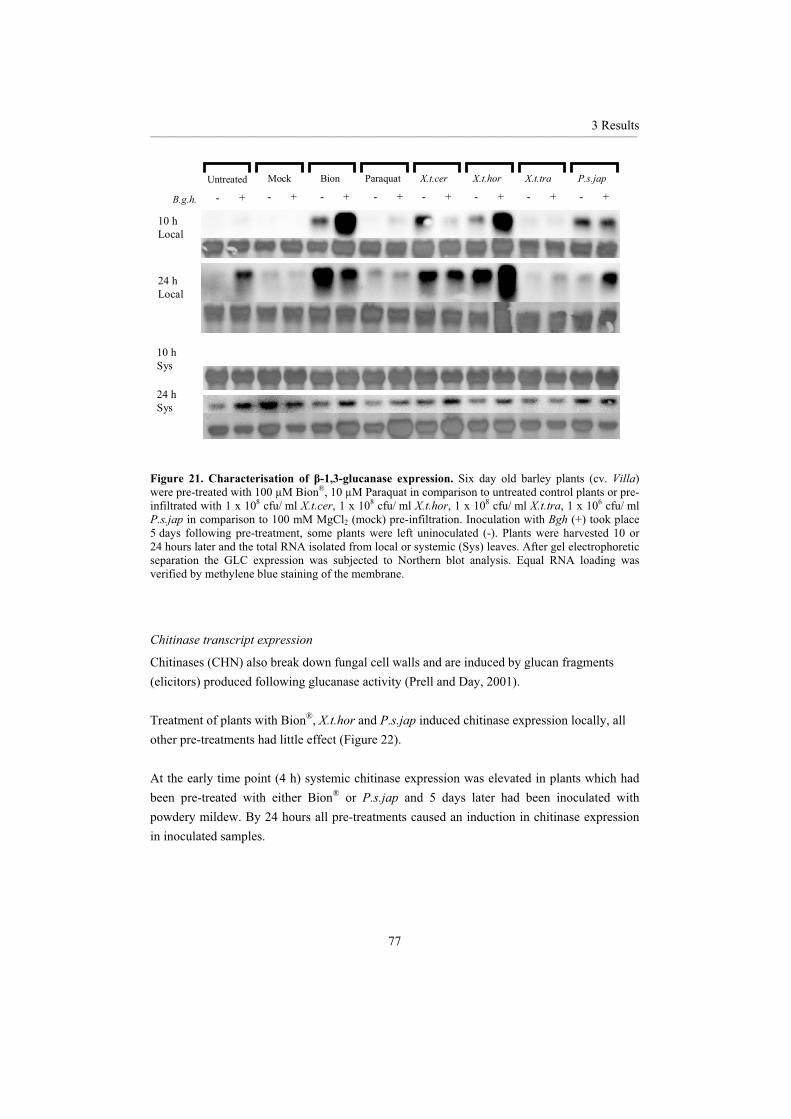
3 Results __________________________________________________________________________________________________________________________________________________________________________________________________________________________________
77
Untreated
- +
Mock
- +
Bion
- +
Paraquat
- +
X.t.cer
- +
X.t.hor
- +
P.s.jap
- +
X.t.tra
- +
10 h Local
24 hLocal
10 h Sys
24 h Sys
B.g.h.
Figure 21. Characterisation of -1,3-glucanase expression. Six day old barley plants (cv. Villa)were pre-treated with 100 µM Bion®, 10 µM Paraquat in comparison to untreated control plants or pre-infiltrated with 1 x 10⁸ cfu/ ml X.t.cer, 1 x 10⁸ cfu/ ml X.t.hor, 1 x 10⁸ cfu/ ml X.t.tra, 1 x 10⁶ cfu/ mlP.s.jap in comparison to 100 mM MgCl2 (mock) pre-infiltration. Inoculation with Bgh (+) took place 5 days following pre-treatment, some plants were left uninoculated (-). Plants were harvested 10 or 24 hours later and the total RNA isolated from local or systemic (Sys) leaves. After gel electrophoretic separation the GLC expression was subjected to Northern blot analysis. Equal RNA loading was verified by methylene blue staining of the membrane.
Chitinase transcript expression
Chitinases (CHN) also break down fungal cell walls and are induced by glucan fragments (elicitors) produced following glucanase activity (Prell and Day, 2001).
Treatment of plants with Bion®, X.t.hor and P.s.jap induced chitinase expression locally, all other pre-treatments had little effect (Figure 22).
At the early time point (4 h) systemic chitinase expression was elevated in plants which had been pre-treated with either Bion® or P.s.jap and 5 days later had been inoculated with powdery mildew. By 24 hours all pre-treatments caused an induction in chitinase expression in inoculated samples.
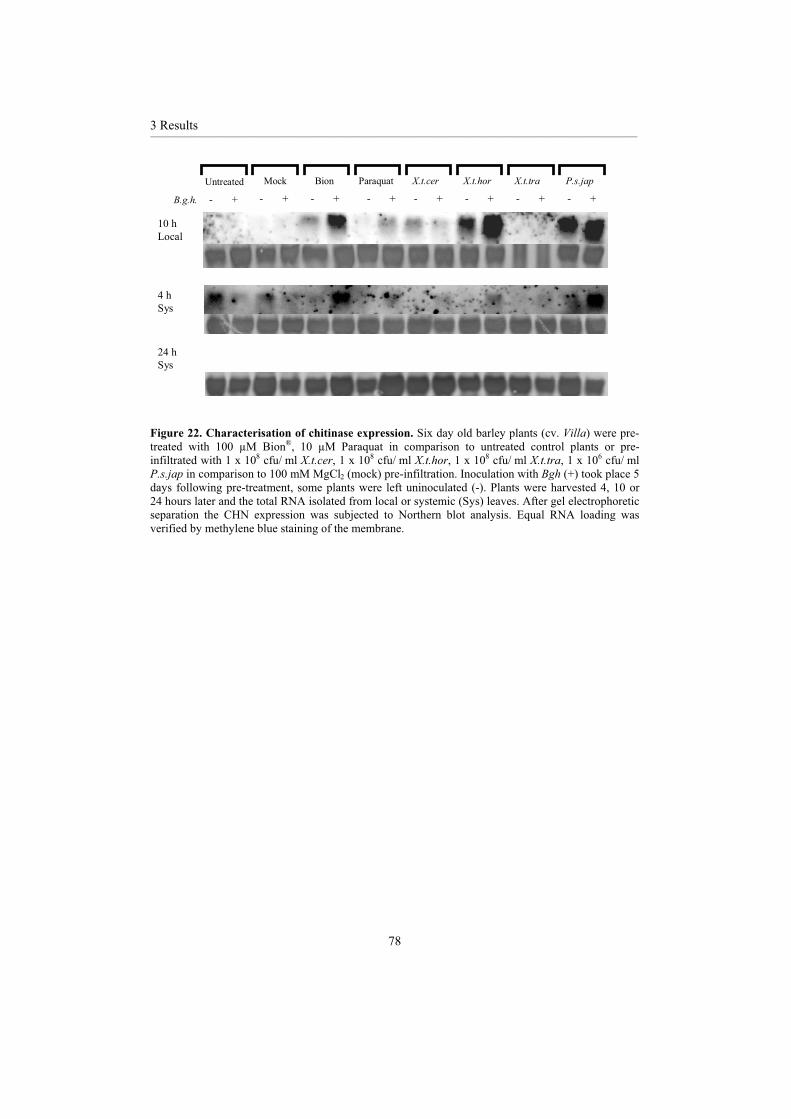
3 Results __________________________________________________________________________________________________________________________________________________________________________________________________________________________________
78
Untreated
- +
Mock
- +
Bion
- +
Paraquat
- +
X.t.cer
- +
X.t.hor
- +
P.s.jap
- +
X.t.tra
- +
10 hLocal
4 hSys
24 h Sys
B.g.h.
Figure 22. Characterisation of chitinase expression. Six day old barley plants (cv. Villa) were pre-treated with 100 µM Bion®, 10 µM Paraquat in comparison to untreated control plants or pre-infiltrated with 1 x 10⁸ cfu/ ml X.t.cer, 1 x 10⁸ cfu/ ml X.t.hor, 1 x 10⁸ cfu/ ml X.t.tra, 1 x 10⁶ cfu/ mlP.s.jap in comparison to 100 mM MgCl2 (mock) pre-infiltration. Inoculation with Bgh (+) took place 5 days following pre-treatment, some plants were left uninoculated (-). Plants were harvested 4, 10 or 24 hours later and the total RNA isolated from local or systemic (Sys) leaves. After gel electrophoretic separation the CHN expression was subjected to Northern blot analysis. Equal RNA loading was verified by methylene blue staining of the membrane.

3 Results __________________________________________________________________________________________________________________________________________________________________________________________________________________________________
79
3.2.6 Microarray
Microarray analysis allows the expression of a large number of genes to be monitored simultaneously. Thus enabling an insight into the interplay of gene regulation following specific treatments to be investigated. The microarray consisted of approximately 350 genes involved in or associated with plant defence and primary metabolism and/ or housekeeping.
Three of the resistance inducers were chosen to be analysed in more depth: X.t.hor, P.s.japand Paraquat, and RNA from systemic leaves from two different time points were subjected to microarray analyses. The first to investigate the systemic effect of local treatment alone 24 hours post treatment (24 hpt) and the second to observe the early events following secondary Bgh inoculation 5 days post treatment and 4 hours post inoculation (5 dpt 4 hpi).
Changes in total expression
For each treatment and time point, two microarrays were conducted with a so-called dye swap. Where for one array the treated samples were labelled with Cy3 and the other with Cy5, whilst control samples were labelled with the opposite dye. This was performed to compensate for the differing binding efficiencies of the two fluorescent dyes. This technical replicate allowed the reproducibility of the microarray results to be assessed. The signal intensities obtained from both arrays were then compared.
Before the differentially expressed genes for the individual time point and treatment are presented, an overview of the total expression observed is shown (Tables 9A and B). These tables compare the total number of genes with the number of which gave a signal on both arrays (dye swap) and finally how many of these differentially expressed genes were statistically significant.
Normally a gene is classified as induced or repressed when the change in expression is more than 2.0 fold (von Rad et al., 2005). This threshold ensures that false positives are excluded from further analyses. As the number of genes which displayed statistically significant altered expression was relatively low (Tables 9A and B), it was decided to include a slightly relaxed lower threshold 1.5 - 2.0 fold change, thereby allowing more genes to be scrutinised.
Statistically significance is defined by the CV values, a coefficient which describes the difference between the signals on the two arrays. The lower the CV value the closer together the signal strengths hence the more significant the median value (induction factor). A good threshold for this value is 25, however, this is sometimes viewed as being stringent (von Rad, personal communication 2006), for this dissertation a threshold value of 50 has been set.

3 Results __________________________________________________________________________________________________________________________________________________________________________________________________________________________________
80
Table 9. Overview of the differentially expressed genes in systemic barley leaves. Six or eleven (for 5 dpt 4 hpi and 24 hpt, respectively) day old barley plants (cv. Villa) were either infiltrated with 1 x 10⁸ cfu/ ml X.t.hor, 1 x 10⁶ cfu/ ml P.s.jap or 100 mM MgCl2 (mock) or treated with 10 µM Paraquat or left untreated. Inoculation with Bgh took place 5 days following pre-treatment. Plants were harvested at indicated time points and the total RNA isolated from systemic leaves. Microarray analysis was performed with fluorescently labelled probes. A) 24 hpt, B) 5 dpt 4 hpi. hpt = hours post treatment. dpt = days post treatment. hpi = hours post inoculation. Total genes = total number of detected genes expressed. On both arrays = Number of genes expressed following dye-swap. Stat. sig. = Number of genes with statistically significant expression. Changes in expression are highlighted: dark grey = 1.5 - 2.0 fold activation; light grey = 1.5 - 2.0 fold repression.
A
X.t.hor 24 hpt P.s.jap 24 hpt Paraquat 24 hpt
Inductionfactor
Totalgenes
Onboth
Arrays
Stat.sig.
Totalgenes
Onboth
Arrays
Stat.sig.
Totalgenes
Onboth
Arrays
Stat.sig.
> 2.0 2 1 0 2 0 0 6 4 0 > 1.5 - 2.0 4 3 2 12 8 0 14 11 50.66 - 1.5 263 228 61 228 188 42 127 95 23 0.5 - 0.66 6 5 2 4 3 0 9 4 3
< 0.5 3 1 0 1 1 0 16 7 7
B
X.t.hor 5 dpt 4hpi P.s.jap 5 dpt 4hpi Paraquat 5 dpt 4 hpi
Inductionfactor
Totalgenes
Onboth
Arrays
Stat.sig.
Totalgenes
Onboth
Arrays
Stat.sig.
Totalgenes
Onboth
Arrays
Stat.sig.
> 2.0 7 1 1 6 3 3 7 0 0 > 1.5 - 2.0 9 3 3 14 12 12 10 9 90.66 - 1.5 260 246 244 219 201 200 240 232 227 0.5 - 0.66 5 0 0 8 2 2 21 15 13
< 0.5 3 0 0 2 0 0 22 12 7
Having set additional threshold values, all the non-differentially expressed genes (induction factor 0.66 - 1.5) were observed for statistical significance. It was found that the majority of the genes on the microarray were not regulated. For Paraquat 24 hpt the lowest total number of identified expressed genes was found, only 172 from ~350 genes (Table 9A), of which 127 were not regulated, 95 genes were present on both arrays and merely 23 were significantly non-differentially expressed. For both X.t.hor and P.s.jap the number of genes which were not regulated significantly was also low 61 and 42 respectively. X.t.hor infiltration induced 2 genes and reduced the expression of 2 genes significantly. P.s.jap infiltration induced and reduced the expression of 8 and 4 genes, respectively, however none significantly. Despite the

3 Results __________________________________________________________________________________________________________________________________________________________________________________________________________________________________
81
low overall number of detected expressed genes following Paraquat treatment, the most significant differential expression was observed for this treatment, 5 genes were induced and 10 reduced.
The microarray analysis for the later time point (5 dpt 4 hpi) gave rise to a larger number of differentially expressed genes (Table 9B). For this series of microarrays the expression significance was much higher, such that when a gene was expressed on both arrays it was generally significant. It can be concluded that these data are more reliable for analysing the gene expression profiles, because higher correlations between the data sets displayed in Table 9B were found. Again the majority of the genes were not regulated. The lowest number of significantly non-differentially expressed genes was 200 for P.s.jap 5 dpt 4 hpi which was more than 4 times more than for P.s.jap 24 hpt. This indicates experimental problems were encountered for the microarray analysis of the early time point. For the bacterial pre-infiltration and subsequent fungal inoculation more genes were induced than reduced, X.t.hor4 and 0, or P.s.jap 15 and 2 respectively. As seen above Paraquat treatment led to the strongest overall response with the most differential expression, 9 genes were identified as induced while 20 genes were reduced.
More detailed data analysis was only performed on genes which displayed differential expression of statistically significance.
Differential expression of genes
All the gene names and thus the putative function of the gene products for the sequences presented in the following tables have been confirmed by analysing the translated sequences using DNAMAN software and Blastp.
Genes regulated by X.t.hor
X.t.hor infiltration led to the slight induction of a ROS producing germin-like protein (GLP4, 1.91) thought to be involved in the oxidative burst (Zhang et al., 1995; Zhou et al., 1998; Bernier and Berna, 2001). -1,3-glucanase (PR2) a protein often involved in defence (1.55) was also induced. Whilst a secretory peroxidase (PRXCB, 0.53), involved in H2O2 reduction and defence (Passardi et al., 2004) was slightly reduced (Table 10A).
In samples which represent the early reactions following the secondary fungal infection expression of a SA inducible MYB1 transcription factor was elevated (2.07), in X.t.hor pre-infiltrated plants (Table 10B). RNase S-like protein (1.61) was slightly induced, this protein is expressed in response to pathogen infection (Galiana et al., 1997). A gene involved in sterol

3 Results __________________________________________________________________________________________________________________________________________________________________________________________________________________________________
82
biosynthesis ( -24-sterol methyltransferase, 1.61) and putative signal recognition particle (1.55) were all slightly induced. For this treatment no genes were significantly reduced.
Table 10. Differential gene expression in systemic barley leaves after X.t.hor infiltration. Six or eleven (for 5 dpt 4 hpi and 24 hpt, respectively) day old barley plants (cv. Villa) were infiltrated either with 1 x 10⁸ cfu/ ml X.t.hor or 100 mM MgCl2 (mock). Inoculation with Bgh took place 5 days following pre-infiltration. Plants were harvested at indicated time points and the total RNA isolated from systemic leaves. After fluorescent labelling microarray analysis was performed. A) 24 hpt, B) 5 dpt 4 hpi. CV = Coefficient of variation. ID = Accession or EST number. Changes in expression are highlighted: light yellow = 1.5 - 2.0 fold activation; yellow = 2.0 - 2.5 fold activation; light turquoise = 1.5 - 2.0 fold repression.
A
Name Median CV ID GLP4 1.91 29 HR01P10
BG1 = PR2 1.55 14 HK04P09 Unknown protein 0.62 21 HF01D22
PRXCB 0.53 19 HW07K02
B
Name Median CV ID MYB1 Transcription factor 2.07 5 HA09K10
RNase S-like protein 1.61 1 AY120886 -24-sterol methyltransferase 1.61 26 U60754
putative Signal recognition particle 1.55 17 HX03A15
Genes regulated by P.s.jap
P.s.jap infiltration alone led to no significant differential gene expression (Table 9). However a large number of genes were regulated at the later time point tested (Table 11). A multidrug resistance associated protein (MRP2) displayed the highest induction found in this dissertation with a median value of 3.24. MRP proteins belong to a subfamily of ATP-binding cassette (ABC) transporters, which mediate the transportation of a wide range of substrates out of the cell and into the vacuole (Kolukisaoglu et al., 2002; Klein et al., 2006). Two transcription factors were found to be induced: an ethylene responsive factor was highly induced (2.97), and similar to X.t.hor MYB1 transcription factor (2.33).
Twelve genes were slightly induced amongst others a disease resistance-like protein (1.96), RbohA (respiratory burst oxidase homologue, 1.83) which is involved in ROS production

3 Results __________________________________________________________________________________________________________________________________________________________________________________________________________________________________
83
(Groom et al., 1996); factors involved in protein synthesis: a translation initiation (eIF-4A, 1.68) and 40S ribosomal S23 (1.78); and a MEKK1 (1.79) involved in signalling cascades. In comparison only 2 genes were slightly reduced a protein foldase (peptidylprolyl isomerase, 0.65) and glutathione-S-transferase (GST, 0.61) which is involved in cellular detoxification.
Table 11. Differential gene expression in systemic barley leaves after P.s.jap induced resistance.Six day old barley plants (cv. Villa) were infiltrated either with 1 x 10⁶ cfu/ ml P.s.jap or 100 mM MgCl2 (mock). Inoculation with Bgh took place 5 days following pre-infiltration. Plants were harvested 4 hours later and the total RNA isolated from systemic leaves. After fluorescent labelling microarray analysis was performed. CV = Coefficient of variation. ID = Accession or EST number. Changes in expression are highlighted: light yellow = 1.5 - 2.0 fold activation; yellow = 2.0 - 2.5 fold activation; orange = 2.5 - 3.0 fold activation; red = more than threefold activation; light turquoise = 1.5 - 2.0 fold repression.
Name Median CV ID MRP2 3.24 13 HM03H07
ERF3 Ethylene responsive factor 3 2.97 21 HV04J09 MYB1 Transcription factor 2.33 18 HA09K10
Disease resistance-like protein isolate 29050 1.96 37 AY224475Alanine aminotransferase 1.88 23 Z26322
APX1 1.86 8 HA04K10 Rboh A 1.83 29 HD01O06
26S proteosome regulatory subunit 1.80 27 AB037149MEKK1 Map-Kinase-Kinase1 1.79 20 HA05G08
40S ribosomal protein S23 1.78 29 HA08P24 RNase S-like protein 1.76 7 AY120886
PRXCB 1.71 12 HR01M11 S-adenosyl-L-homocysteine hydrolase (SH6.2) 1.68 5 L11872
translation initiation factor eIF-4A - wheat 1.52 19 HA02F18 Glutathione-S-transferase I subunit 1.51 15 AJ419775
Peptidylprolyl isomerase 0.65 39 Y07636 GST1 Glutathione-S-transferase 0.61 37 HS01J15
To confirm the sensitivity of the microarray data a Northern blot was hybridised with DIG-labelled MRP2 probe. The gene which displayed the highest increase after P.s.jap pre-infiltration and subsequent Bgh inoculation (Table 11). Figure 23 shows that the strongest induction is indeed found after P.s.jap pre-infiltration and Bgh inoculation, it can also be seen that MRP2 expression was slightly induced in all the inoculated samples.

3 Results __________________________________________________________________________________________________________________________________________________________________________________________________________________________________
84
4hSys
Untreated
- +
Mock
- +
Bion
- +
Paraquat
- +
X.t.cer
- +
X.t.hor
- +
P.s.jap
- +
X.t.tra
- + B.g.h.
Figure 23. Characterisation of MRP2 expression. Six day old barley plants (cv. Villa) were pre-treated with 100 µM Bion®, 10 µM Paraquat in comparison to untreated control plants or pre-infiltrated with 1 x 10⁸ cfu/ ml X.t.cer, 1 x 10⁸ cfu/ ml X.t.hor, 1 x 10⁸ cfu/ ml X.t.tra, 1 x 10⁶ cfu/ mlP.s.jap in comparison to 100 mM MgCl2 (mock) pre-infiltration. Inoculation with Bgh (+) took place 5 days following pre-treatment, some plants were left uninoculated (-). Plants were harvested 4 hours later and the total RNA isolated from systemic (Sys) leaves. After gel electrophoretic separation the MRP2 expression was subjected to Northern blot analysis. Equal RNA loading was verified by methylene blue staining of the membrane.
Genes regulated by Paraquat
After Paraquat treatment (24 hours) more genes were reduced than induced (Table 12). Those that were only slightly induced included 2 thionins (1.88 and 1.71), which display anti-microbial functions (Florack and Stiekema, 1994) and a GST (1.92). This was the only treatment which led to strongly reduced gene expression of less than 0.33, two peroxidases (probably Peroxidase, 0.28, and At-ELI11, 0.07), a cytochrome p450 (CYP 71B6, 0.20) and a proteinase inhibitor (PIN1, 0.31).
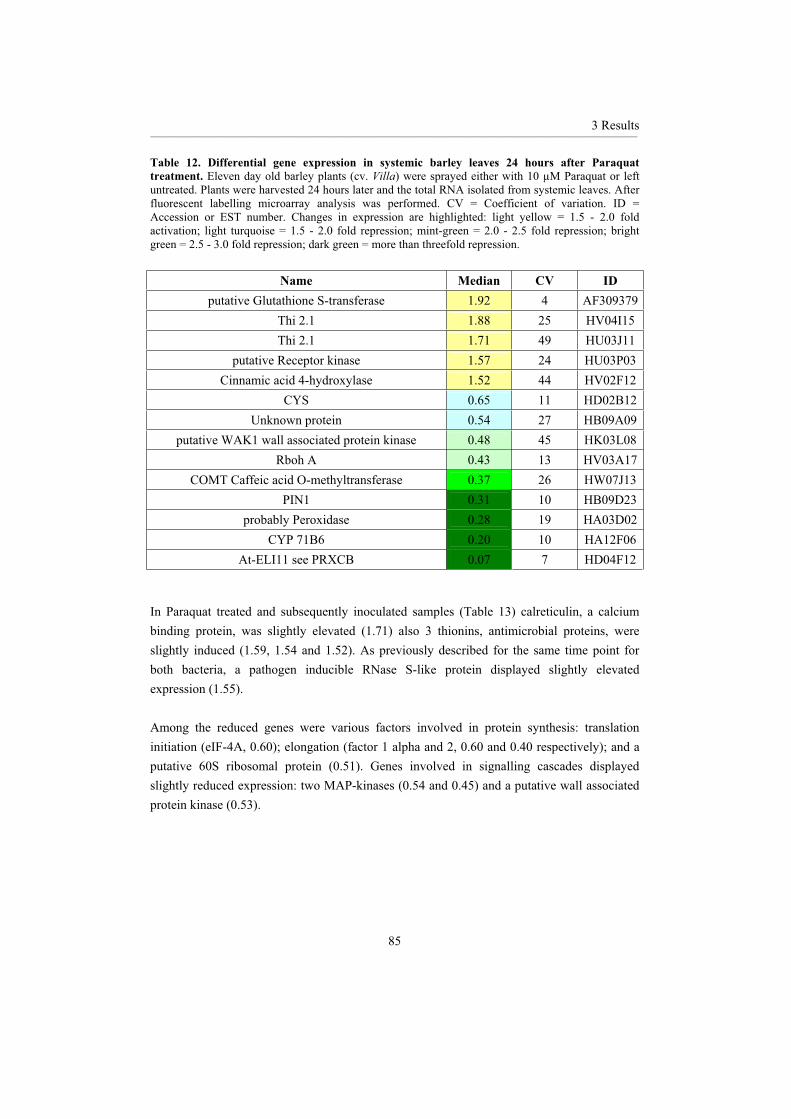
3 Results __________________________________________________________________________________________________________________________________________________________________________________________________________________________________
85
Table 12. Differential gene expression in systemic barley leaves 24 hours after Paraquat treatment. Eleven day old barley plants (cv. Villa) were sprayed either with 10 µM Paraquat or left untreated. Plants were harvested 24 hours later and the total RNA isolated from systemic leaves. After fluorescent labelling microarray analysis was performed. CV = Coefficient of variation. ID = Accession or EST number. Changes in expression are highlighted: light yellow = 1.5 - 2.0 fold activation; light turquoise = 1.5 - 2.0 fold repression; mint-green = 2.0 - 2.5 fold repression; bright green = 2.5 - 3.0 fold repression; dark green = more than threefold repression.
Name Median CV ID putative Glutathione S-transferase 1.92 4 AF309379
Thi 2.1 1.88 25 HV04I15 Thi 2.1 1.71 49 HU03J11
putative Receptor kinase 1.57 24 HU03P03 Cinnamic acid 4-hydroxylase 1.52 44 HV02F12
CYS 0.65 11 HD02B12Unknown protein 0.54 27 HB09A09
putative WAK1 wall associated protein kinase 0.48 45 HK03L08Rboh A 0.43 13 HV03A17
COMT Caffeic acid O-methyltransferase 0.37 26 HW07J13PIN1 0.31 10 HB09D23
probably Peroxidase 0.28 19 HA03D02CYP 71B6 0.20 10 HA12F06
At-ELI11 see PRXCB 0.07 7 HD04F12
In Paraquat treated and subsequently inoculated samples (Table 13) calreticulin, a calcium binding protein, was slightly elevated (1.71) also 3 thionins, antimicrobial proteins, were slightly induced (1.59, 1.54 and 1.52). As previously described for the same time point for both bacteria, a pathogen inducible RNase S-like protein displayed slightly elevated expression (1.55).
Among the reduced genes were various factors involved in protein synthesis: translation initiation (eIF-4A, 0.60); elongation (factor 1 alpha and 2, 0.60 and 0.40 respectively); and a putative 60S ribosomal protein (0.51). Genes involved in signalling cascades displayed slightly reduced expression: two MAP-kinases (0.54 and 0.45) and a putative wall associated protein kinase (0.53).

3 Results __________________________________________________________________________________________________________________________________________________________________________________________________________________________________
86
Table 13. Differential gene expression in systemic barley leaves after Paraquat induced resistance. Six day old barley plants (cv. Villa) were sprayed with 10 µM Paraquat or left untreated. Inoculation with Bgh took place 5 days following pre-treatment. Plants were harvested 4 hours later and the total RNA isolated from systemic leaves. After fluorescent labelling microarray analysis was performed. CV = Coefficient of variation. ID = Accession or EST number. Changes in expression are highlighted: light yellow = 1.5 - 2.0 fold activation; light turquoise = 1.5 - 2.0 fold repression; mint-green = 2.0 - 2.5 fold repression; bright green = 2.5 - 3.0 fold repression.
Name Median CV ID calreticulin - barley 1.71 3 HA04B09Unknown protein 1.61 27 AL928930
Thi 2.1 1.59 1 HU03J11 RNase S-like protein 1.55 4 AY120886
Glycine decarboxylase 1.54 19 AY123417Thi 2.1 1.54 1 HV04I15
Barley leaf specific thionin 1.52 5 M19048 Unknown protein 1.52 18 HP01J03
2OG-Fe(II) oxygenase 1.52 17 HW05F10IFR Isoflavone reductase 0.66 5 HD02G19
Rboh A 0.66 22 HV03A17PIN1 0.64 18 HB09D23CYS 0.64 22 HD02B12
Germin-like protein 0.62 5 AF493980translation initiation factor eIF-4A - wheat 0.60 2 HA02F18
Elongation factor 1 alpha 0.60 11 L11740 PRXCB 0.60 11 HY07M08
Unknown protein 0.54 22 HV02N02MEK1 MAP-Kinase 0.54 33 HU04G22
putative WAK1 wall associated protein kinase 0.53 20 HK03L08 putative 60S ribosomal protein 0.51 18 HV04K22
PR3 A IV 0.51 10 HT01C02 putative Immunophilin 0.48 38 HD04E03
GST1 0.46 32 HW05H18MEK1 MAP-Kinase 0.45 21 HB09E24 Elongation factor 2 0.40 10 AF005085
GST1 0.37 40 HD03F05 Tyrosine decarboxylase 0.36 24 HB09O13
putative Serine carboxypeptidase III 0.35 41 1H3

3 Results __________________________________________________________________________________________________________________________________________________________________________________________________________________________________
87
Paraquat treatment led to reduced expression of ROS-producing enzymes: Rboh A (0.66), and germin-like protein (0.62). As well as enzymes involved in defence and cellular detoxification: secretory peroxidase (PRXCB, 0.60) and 2 GSTs (0.46 and 0.37). Interestingly chitinase (PR3) expression was also slightly reduced (0.51).
Paraquat treatment led to the slight induction of 2 thionins which remained at a constant level for both time points tested. Cysteine proteinase inhibitor (CYS) remained slightly reduced after Paraquat treatment.
Table 14. Comparison of the differential gene expression following Paraquat treatment. Changesin expression are highlighted: light yellow = 1.5 - 2.0 fold activation; light turquoise = 1.5 - 2.0 fold repression; mint-green = 2.0 - 2.5 fold repression; dark green = more than threefold repression.
Name 24 hpt 5 dpt 4 hpi Thi 2.1 Thi 2.1 CYS
putative WAK1 wall associated protein kinase Rboh A
PIN1
For the 3 remaining genes: a putative wall associated protein kinase; a respiratory burst oxidase homologue (Rboh A); and a proteinase inhibitor (PIN1), the degree of reduction became less intense over time. Such that at the later time point although reduced gene expression was still found it was not as pronounced as shortly after treatment.
Genes directly regulated by different pre-treatments
MYB1 Transcription factor was found to be induced in bacterially pre-infiltrated and subsequently inoculated plants. Only one gene was found to be similarly slightly induced following all three treatments, RNase S-like protein. Whilst translation initiation factor eIF-4A was slightly induced in P.s.jap pre-infiltration yet slightly reduced after Paraquat pre-treatment.
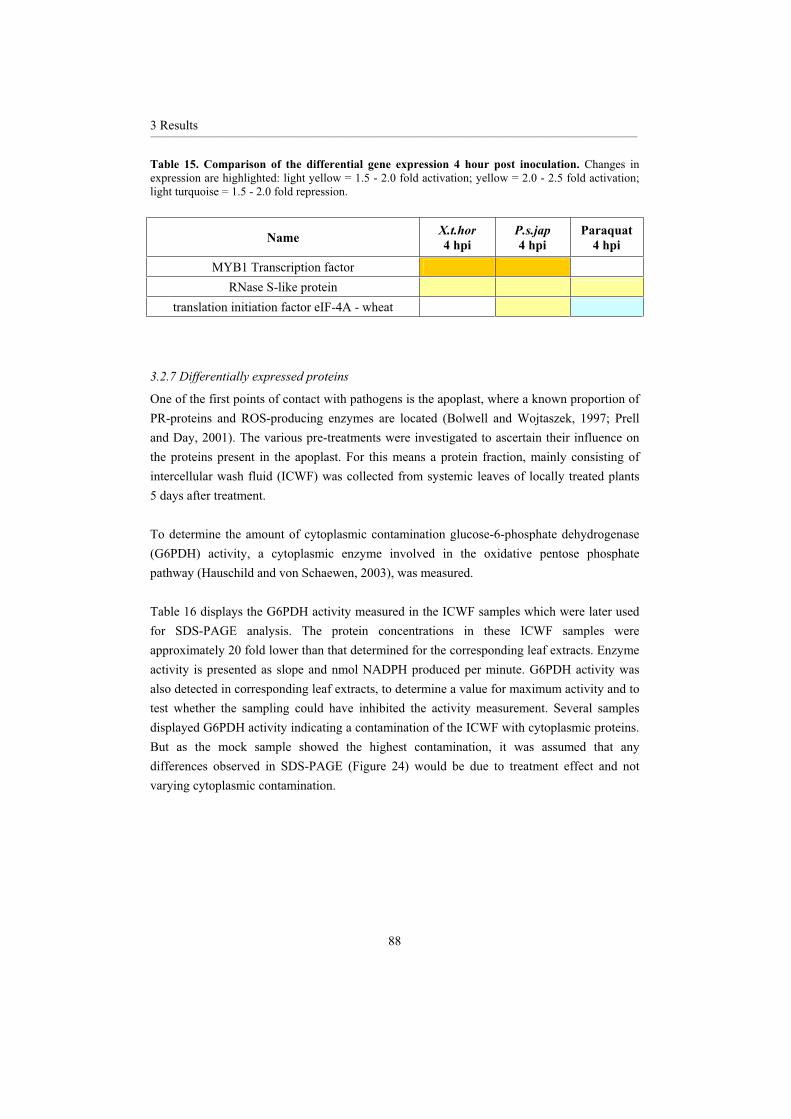
3 Results __________________________________________________________________________________________________________________________________________________________________________________________________________________________________
88
Table 15. Comparison of the differential gene expression 4 hour post inoculation. Changes in expression are highlighted: light yellow = 1.5 - 2.0 fold activation; yellow = 2.0 - 2.5 fold activation; light turquoise = 1.5 - 2.0 fold repression.
Name X.t.hor4 hpi
P.s.jap4 hpi
Paraquat4 hpi
MYB1 Transcription factor RNase S-like protein
translation initiation factor eIF-4A - wheat
3.2.7 Differentially expressed proteins
One of the first points of contact with pathogens is the apoplast, where a known proportion of PR-proteins and ROS-producing enzymes are located (Bolwell and Wojtaszek, 1997; Prell and Day, 2001). The various pre-treatments were investigated to ascertain their influence on the proteins present in the apoplast. For this means a protein fraction, mainly consisting of intercellular wash fluid (ICWF) was collected from systemic leaves of locally treated plants 5 days after treatment.
To determine the amount of cytoplasmic contamination glucose-6-phosphate dehydrogenase (G6PDH) activity, a cytoplasmic enzyme involved in the oxidative pentose phosphate pathway (Hauschild and von Schaewen, 2003), was measured.
Table 16 displays the G6PDH activity measured in the ICWF samples which were later used for SDS-PAGE analysis. The protein concentrations in these ICWF samples were approximately 20 fold lower than that determined for the corresponding leaf extracts. Enzyme activity is presented as slope and nmol NADPH produced per minute. G6PDH activity was also detected in corresponding leaf extracts, to determine a value for maximum activity and to test whether the sampling could have inhibited the activity measurement. Several samples displayed G6PDH activity indicating a contamination of the ICWF with cytoplasmic proteins. But as the mock sample showed the highest contamination, it was assumed that any differences observed in SDS-PAGE (Figure 24) would be due to treatment effect and not varying cytoplasmic contamination.

3 Results __________________________________________________________________________________________________________________________________________________________________________________________________________________________________
89
Table 16. Glucose-6-phosphate dehydrogenase activity in intercellular wash fluid samples used for SDS-PAGE analysis. Six day old barley plants (cv. Villa) were treated with 100 µM Bion®, 10 µM Paraquat in comparison to untreated control plants or infiltrated with 1 x 10⁸
cfu/ ml X.t.cer, 1 x 10⁸ cfu/ ml X.t.hor, 1 x 10⁸ cfu/ ml X.t.tra, 1 x 10⁶ cfu/ ml P.s.jap in comparison to 100 mM MgCl2 (mock) infiltration. Intercellular wash fluid (ICWF) samples was collected 5 days later and tested for glucose-6-phosphate dehydrogenase (G6PDH) activity. n = 1.
SampleICWF
G6PDH activity (Slope)
Leaf extract G6PDH activity
(Slope)
ICWF G6PDH activity (nmol NADPH min-1)
Leaf extract G6PDH activity (nmol NADPH min-1)
Untreated 0.000 0.027 0.00 217.85 Mock 0.005 0.025 41.80 198.55 Bion 0.002 0.018 13.67 147.11
Paraquat 0.000 0.027 0.00 213.29 P.s.jap 0.001 0.027 11.25 213.83 X.t.cer 0.003 0.025 20.10 199.89 X.t.hor 0.002 0.023 18.49 188.64 X.t.tra 0.001 0.024 11.25 195.87
Sodium dodecyl sulphate-polyacrylamide gel electrophoresis
Protein separation by sodium dodecyl sulphate-polyacrylamide gel electrophoresis (SDS-PAGE) allowed alterations in protein patterns following biological and chemical treatment to be visualised. P.s.jap and X.t.cer treatment led to an increase of a protein band of approximately 55 kDa and the faint appearance of a protein of approximately 16.5 kDa (Figure 24). Bion® treatment increased the presence of a protein of 27-28 kDa and of two proteins smaller than 14.4 kDa.

3 Results __________________________________________________________________________________________________________________________________________________________________________________________________________________________________
90
Untreated Mock Bion Paraquat P.s.jap X.t.cer X.t.traX.t.horLMW
97.4 kDa
66.2 kDa
45.0 kDa
31.0 kDa
21.5 kDa
14.4 kDa
Figure 24. Differential protein expression in intercellular wash fluid following treatment. Six day old barley plants (cv. Villa) were treated with 100 µM Bion®, 10 µM Paraquat in comparison to untreated control plants or infiltrated with 1 x 10⁸ cfu/ ml X.t.cer, 1 x 10⁸ cfu/ ml X.t.hor, 1 x 10⁸
cfu/ ml X.t.tra, 1 x 10⁶ cfu/ ml P.s.jap in comparison to 100 mM MgCl2 (mock) infiltration. Intercellular wash fluid (ICWF) samples were collected 5 days later. 20 µg protein was separated by SDS-PAGE and subsequently stained with Coomassie blue. LMW = Low molecular weight standards.
To ease photometric determination, proteins in ICWF samples for 2D analysis were concentrated before G6PDH activity was measured. For this experiment the G6PDH activity values were much higher 6.50 nmol NADPH min-1 mg protein-1 (mock) and 7.45 nmol NADPH min-1 mg protein-1 (X.t.cer). Due to low sample volume for P.s.jap G6PDH activity could not be measured, however, it can be assumed that the cytoplasmic contamination would have been similar to that found for mock and X.t.cer, approximately 50 %. As the values were of the same range for all treatments it can be assumed that any differences observed by 2D analysis are due to treatment influence.

3 Results __________________________________________________________________________________________________________________________________________________________________________________________________________________________________
91
Table 17. Glucose-6-phosphate dehydrogenase activity in intercellular wash fluid samples used for 2D analysis. Six day old barley plants (cv. Villa) were infiltrated with 1 x 10⁸
cfu/ ml X.t.cer, 1 x 10⁶ cfu/ ml P.s.jap in comparison to 100 mM MgCl2 (mock) infiltration. Intercellular wash fluid (ICWF) samples were collected 5 days later and tested for glucose-6-phosphate dehydrogenase (G6PDH) activity. N.M. = Not measured. N.Q. = Not Quantified. n = 3.
Sample ICWF G6PDH activity
(nmol NADPH min-1 mg protein-1)
Leaf extract G6PDH activity (nmol NADPH
min-1 mg protein-1)
Cytoplasmic contamination (%)
Mock 6.50 15.27 43 X.t.cer 7.45 13.61 55 P.s.jap N.M. 17.07 N.Q.
2D
To allow a higher resolution of protein separation P.s.jap and X.t.cer treatments were selected and subjected to 2D analysis, both were compared to mock infiltration. Six and seven protein spots were found to be induced following X.t.cer and P.s.jap treatments, respectively, in comparison to mock infiltration (Figure 25). They were present in an acidic low molecular weight area of the 2D gels.

3 Results __________________________________________________________________________________________________________________________________________________________________________________________________________________________________
92
pH 4 pH 7IEF
SDS-
PAG
E17.5 kDa
76.0 kDa
12
3
465
123
465
7
Mock X.t.cer P.s.jap
Figure 25. Two-dimensional display of proteins present in intercellular wash fluid following treatment. Six day old barley plants (cv. Villa) were infiltrated with 1 x 10⁸ cfu/ ml X.t.cer, 1 x 10⁶
cfu/ ml P.s.jap in comparison to 100 mM MgCl2 (mock) infiltration. Intercellular wash fluid (ICWF) samples were collected 5 days later and subjected to 2D analysis. Top: 2D gel of mock infiltrated ICWF sample. Bottom: Close-up comparisons of the boxed area from each 2D gel. Circles (spots) represent the induced proteins and the numbers correspond to the gel fragments which were prepared for further analysis by Mass Spectrometry. Spots: X.t.cer 1, 2, 3 and 6 as well as P.s.jap 1-7 were identified as Hordeum-Plastocyanin. For spots X.t.cer 4 and 5 no sequence could be identified.
Following trypsin digest, the peptides were analysed by Mass Spectrometry. The only proteins to be identified were plastocyanin, a nuclear-encoded chloroplast protein. The fact that plastocyanin was found confirms the presence of cytoplasmic contamination in the ICWF samples. Yet this protein was induced in the treated samples (both X.t.cer and P.s.jap)compared to the mock-infiltrated plants, indicating a possible role in the observed induced resistance.
3.3 Summary of important results
In this study it was shown that local pre-treatment with two different chemicals and four bacterial strains was able to provide systemic protection to a secondary powdery mildew infection. Thus proving that systemic resistance can be induced in monocotyledons. It was

3 Results __________________________________________________________________________________________________________________________________________________________________________________________________________________________________
93
also found that the individual pre-treatments invoked varying defence responses. An overview of the important findings of this study can be found below (Table 18).
Table 18. Overview of the important results obtained in this study. PR = pathogenesis related genes, CIR = chemically induced resistance. n.t. = not tested.
Treatment Systemic resistanceinduction
PR Phenylpropanoid Jasmonate CIR Differentially
regulatedgenes
P.s.jap yes stronginduction
transient localinduction
systemic pre-induction
priming n.t. 24 hpt 0 genes
5 dpt 4 hpi 17 genes
X.t.cer yes localinduction
transient localinduction
systemic pre-induction
weak priming no expression n.t.
X.t.hor yes
localinduction systemic priming
transient localpotentiation
systemic pre-induction
local induction systemic priming
n.t. 24 hpt 4 genes
5 dpt 4 hpi 4 genes
X.t.tra yes similar to mock
transient localpotentiation
systemic pre-induction
priming n.t. n.t.
Bion yes stronginduction
transient localpotentiation
systemic pre-induction
local priming systemic induction
stronginduction n.t.
Paraquat yes priming
transient localpotentiation
systemic pre-induction
priming no expression 24 hpt 15 genes
5 dpt 4 hpi 29 genes

3 Results __________________________________________________________________________________________________________________________________________________________________________________________________________________________________
94
4 Discussion__________________________________________________________________________________________________________________________________________________________________________________________________________________________________
95
4 Discussion
Plants are immobile organisms which are unable to move away from their enemies. Instead they have to overcome the sometimes hostile conditions in order to survive. Among the various changes that can occur in the environment around them, biotic stress due to phytopathogens is one of the most common. Plants have evolved two distinct mechanisms to combat pathogen attack. The first is constitutive defence, which is always present, i.e. toxins and cell walls (Heath, 2000a). The second is induced defence. Following survival of a primary infection, plants are often able to respond quicker and more effectively to a secondary pathogen attack as such they are less susceptible to disease (Sticher et al., 1997). This pathogen induced systemic acquired resistance (SAR) can last for months after the initial triggering (Ryals et al., 1994, 1995). Induced systemic resistance (ISR) is an alternative form of protection and is mediated by non-pathogenic rhizobacteria (van Loon et al., 1998).
4.1 Testing the system
In the course of this thesis a new method for observing systemic induced resistance was established. To ensure a clear segregation between local pre-treatment and systemic effects, barley plants were treated in the one leaf growth stage. The second leaf, which grew within the next 5 days, could be described as systemic as it was not present at the time of pre-treatment. In contrast to dicotyledons where the first two leaves grow opposite each other, for monocotyledons the base of the second leaf is hidden under the sheath of the first leaf. For this reason a local chemical application is in practical terms extremely difficult when barley seedlings are larger than the one leaf growth stage. To ensure that only the first leaf is treated means that the rest of the plant would have to be shielded whilst spraying and until the chemical had dried on the leaf surface in order to prevent inadvertent transfer to the systemic leaves. Also the quantity of plants per pot would have to be reduced to prevent spraying neighbouring plants.
With this new form of treatment it was found that local pre-treatment of barley plants with some but not all of the tested bacteria and chemicals resulted in a lower powdery mildew infection in the systemic parts of the plant, which is discussed in more detail below.
4.1.1 Biological resistance induction
Bacteria were chosen as primary biological inducers so that the sequential infection of two different types of foliar pathogen could be tested. To determine whether primary infection with one type of pathogen (bacteria) could induce systemic resistance to a different type of pathogen (fungi). At present little data of experiments which combined two pathogen types in
4 Discussion__________________________________________________________________________________________________________________________________________________________________________________________________________________________________
96
resistance induction can be found. What has been done related to ISR and involves induction by non-pathogenic rhizobacteria (Pieterse et al., 1996). But SAR and ISR are discussed to provide broad-spectrum resistance to various types of pathogen (Ryals et al., 1996; van Loon et al., 1998). Therefore if such a broad spectrum resistance exists in barley, bacterial pre-infiltration should offer systemic protection against powdery mildew. Several bacterial strains were assayed for their ability to lessen powdery mildew infection on systemic barley leaves. Pre-infiltration of barley plants with avirulent bacteria, invoking an incompatible interactionshould lead to a hypersensitive response (HR; Maleck and Dietrich, 1999) and subsequently result in lower systemic fungal growth. Four of the eight tested bacterial strains were found to induce lower fungal infection in barley against secondary Blumeria graminis f.sp. hordei(Bgh) infection. Direct competition between bacteria and fungi can be eliminated as a possible reason for the lower fungal infection as the inducing bacteria were spatially separated from Bgh (data not shown). Antibiosis, whereby the bacteria produce substances which are released into the plant and disrupt fungal growth, can not be ruled out at this point. But the most likely cause for the lower fungal infection on systemic leaves of locally pre-treated plants is that a state of systemic resistance is induced. As described above an incompatible interaction between avirulent bacteria and barley should lead to induced resistance.
To determine whether a distinct type of plant-pathogen interaction was responsible for the observed resistance bacterial replication rates were analysed. Virulent bacteria are capable of replicating rapidly within host tissue (> 10 000 fold), whilst avirulent or non-pathogenic bacteria will either not grow or only multiply 10 - 100 fold (Katagiri et al., 2002). Pseudomonas syringae pv. japonica (P.s.jap), Xanthomonas translucens pv. cerealis (X.t.cer),Xanthomonas translucens pv. hordei (X.t.hor) and Xanthomonas translucens pv. translucens (X.t.tra) all displayed near virulent growth in planta according to the criteria described by Katagiri et al. (2002). It was found that this enhanced bacterial multiplication in the locally infiltrated barley leaves was required to induce resistance in systemic leaves. The bacterial strains (P.s.syr, P.s.tom, P.s.m avir and VIR) that were unable to multiply in barley leaves were also unable to induce systemic resistance (Table 19). During the course of this study near virulent bacterial growth of barley pathogens resulted in lower fungal infection in systemic barley leaves. Neither avirulent nor non-pathogenic bacterial growth were capable of inducing such an effect. This is in contrast to the literature where systemic resistance is for the main part induced by prior infection with avirulent pathogens in both monocotyledons and dicotyledons. For example Lee and Hwang (2005) found that prior local inoculation of pepper plants with non-pathogenic bacteria (Pseudomonas fluorescens) or a virulent strain of the pathogenic bacteria (Xanthomonas campestris pv. vesicatoria, X.c.v) had little effect on challenge systemic growth of virulent X.c.v. In comparison primary infection with a virulent powdery mildew race led to reduced fungal growth on upper leaves after a secondary infection, however, the protection provided by pre-treatment with an avirulent fungal race was

4 Discussion__________________________________________________________________________________________________________________________________________________________________________________________________________________________________
97
more effective (Hwang and Heitefuss, 1982). This study differs from the above mentioned work as it combined a prior local bacterial infiltration with a secondary fungal inoculation. In another study non pathogen wheat powdery mildew (Blumeria graminis f.sp. tritici) was found to protect barley against a secondary Bgh inoculation (Thordal-Christensen and Smedegård-Petersen, 1988; Schweizer et al., 1996). Two other non-pathogenic fungi (Bipolaris maydis and Septoria nodorum) induced resistance against a necrotrophic fungus (Drechslera teres) in barley (Jørgensen et al., 1998). All of the above studies use the same type of pathogen (e.g. fungi) for the primary and secondary infection. Pathogenic induction of broad spectrum resistance has been described by Smith and co-workers (Smith and Métraux, 1991; Smith et al., 1991) who used bacteria as a primary infection and proved that this gave systemic protection against secondary fungal infection. The authors provided descriptive studies using HR causing bacteria in cucumber and rice. This gave indications for the present work that bacteria would also be able to induce systemic resistance in barley against secondary powdery mildew infection. In comparison to the above mentioned studies, experiments performed during the course of this thesis showed that primary infection with avirulent pathogens did not result in lower systemic fungal infection. Near virulent bacteria were required to offer systemic protection against powdery mildew. Experiments performed by Smith and co-workers (Smith and Métraux, 1991) and those carried out in this study indicate that broad spectrum resistance does occur in monocotyledons. This is one of the characteristics of SAR found in dicotyledons.
The best known form of induced resistance is SAR, which is induced following either local infection of a necrotising pathogen and/ or an incompatible interaction resulting in a HR (Ryals et al., 1996; Sticher et al., 1997). In both cases necrosis formation plays a significant role to differing degrees. It should be noted that necrosis can be either actively, i.e. in response to cellular signalling (Gilchrist, 1998), or passively, direct cellular death resulting from severe and persistent trauma (Vranová et al., 2002), triggered. Despite necrosis formation by avirulent and non pathogens no effect on systemic fungal growth was found in this study which indicates that necrosis formation is not absolutely necessary for resistance induction. That X.t.cer, X.t.hor and X.t.tra are capable of inducing resistance although they do not form necrosis, rather they form either chlorosis or water soaked areas, strengthens the argument that necrosis formation alone is not only insufficient for inducing systemic resistance but also not necessary. This coincides with results from Strobel and Ku (1995), who found that various necrosis forming treatments (e.g. flame and dry ice) did not induce SAR in cucumber. Therefore it is more likely that confining bacterial growth plays a more important role in resistance induction than necrotic lesion formation. Another possibility is that a signal is generated from the replicating bacteria, which is transmitted throughout the plant. The fact that bacterial strains which displayed high local bacterial growth (Table 19) were able to induce systemic resistance supports the idea for a continual signal supply. It

4 Discussion__________________________________________________________________________________________________________________________________________________________________________________________________________________________________
98
could be speculated that a potential signal is recognised by a local receptor which in turn activates a second messenger that is transported throughout the plant.
Maybe the low bacterial concentrations applied for this study also played a role in the extent of the resistance induced in the systemic tissues. Such that although near virulent bacteria were infiltrated into barley plants, the actual number of bacteria infiltrated was low enough that the plant was able to contain the bacterial growth to a local lesion. Ross (1961) used diluted virulent strains of tobacco mosaic virus (TMV) to induce the systemic resistance in tobacco against secondary TMV infections, the first major experimental series on SAR to be performed. SAR is described as a phenomenon whereby plants which were able to overcome a primary infection are more resilient to a secondary infection on distal tissue both to the original pathogen as well as a broad spectrum of other phytopathogens.
Table 19. Overview of bacterially induced local events and systemic resistance induction.n.t. = not tested.
Treatment
High bacterial growth in
locallyinfiltrated leaf
Bacterialsymptoms
Systemicresistance induction
Hydrogenperoxide
Superoxideanion
P.s.jap yes Necrosis yes rapidaccumulation
rapidaccumulation at edges, exclusion from infiltrated
area
P.s.syr no Necrosis no n.t. n.t.
P.s.tom no Necrosis no n.t. n.t.
Psm no Necrosis no n.t. n.t.
X.t.cer yes Chlorosis yes rapidaccumulation
rapidaccumulation
X.t.hor yes Chlorosis yes rapidaccumulation
rapidaccumulation at edges, exclusion from infiltrated
area
X.t.tra yes Water soaked areas yes slow or lower
accumulation slow or lower accumulation
4 Discussion__________________________________________________________________________________________________________________________________________________________________________________________________________________________________
99
4.1.2 Chemical resistance induction
White et al. (1979) first described the exogenous application of SA leading to smaller TMV lesions in tobacco compared to untreated plants. In this study it was found that pre-treatment with Bion®, a SA analogue, 5 days before Bgh inoculation resulted in lower fungal infection, this is in agreement with results for wheat (Görlach et al., 1996), rice and tobacco (Nakashitaet al., 2002, 2003). SA and two SA analogues tested displayed differing inducing strength in this barley powdery mildew pathosystem (Figure 2). Bion® was shown to be the most effective SA analogue as previously seen in barley and wheat (Beßer et al., 2000; Görlach etal., 1996).
Bion® action displayed an inverse dose dependence, such that the highest resistance inducing effect was observed at the lowest concentration tested (Figure 3). Contradicting results were described by Görlach et al. (1996) when Bion® was tested in a wheat powdery mildew pathosystem. Also in tobacco Bion® displayed a typical dose dependence, the lowest infection observed at the highest Bion® concentration tested (Friedrich et al., 1996). The SA analogue INA also has a dose dependence described for barley and powdery mildew (Wasternack et al., 1994) the higher the INA dose (up to 500 ng per leaf injected) the greater the reduction in macroscopically visible colonies. In contrast Schweizer et al. (1997) found that lower INA concentrations (1 ppm) were more effective for plant protection in rice compared to 100 ppm, the threshold concentration at which INA was found to be phytotoxic for rice. The authors suggested this was a strong indication for an indirect mode of action, i.e. acquired resistance. This coincides with the results for Bion® pre-treatment in this study, suggesting that induced resistance is responsible for the reduced systemic fungal infection. Although no systemic SA accumulation was found in the barley powdery mildew pathosystem tested here, it has been previously proposed that SA analogues function either at the same site or downstream of SA accumulation (Lawton et al., 1996). The results obtained in this study strengthens the proposal that Bion® functions downstream of SA accumulation. This means systemic effects appear not to involve mediation following SA accumulation, however, it can not be ruled out that SA plays a role locally in transmitting the initial trigger for systemic induced resistance. Although Bion® is known to spread systemically through the plant (Oostendorp et al.,2001), it seems more likely that a second messenger triggers the induced resistance, as the low Bion® concentration applied would become even more diluted once it was spread systemically throughout the plant. The actual amount of active ingredient that would reach distal plant parts would be extremely small. Therefore Bion would not reach threshold concentrations required for it to act as a SA substitute, ruling out the possibility that Bion® could accumulate instead of SA. Further supporting the site of effect being downstream of SA accumulation. The same reasoning applies for Paraquat, as low Paraquat concentrations were applied and local Paraquat treatment also resulted in a lack of systemic SA accumulation.
4 Discussion__________________________________________________________________________________________________________________________________________________________________________________________________________________________________
100
Paraquat pre-treatment has previously been shown to induce resistance in both tobacco and cucumber, both dicotyledons, against viral and/ or fungal infection (Strobel and Ku , 1995). Despite being a herbicide Paraquat is able to induce resistance, perhaps because at lower concentrations the effects of this pro-oxidant chemical lead to an altered redox status. This has been described to be sufficient to induce NPR1, a positive regulator of SAR in dicotyledons,to move to the nucleus and interacts with TGA transcription factors (Mou et al., 2003; Durrant and Dong, 2004; Fobert and Depres, 2005). It is conceivable that Paraquat mediated resistance induces NPR1 nuclearisation via redox alterations, following which gene expression is activated leading to systemic resistance against powdery mildew. However, Paraquat pre-treatment was less effective than Bion®, indicating that either additional defence responses are induced following Bion® pre-treatment or that not as much NPR1 is induced by Paraquat as by Bion®. Further experiments would be required to test this hypothesis. As previously shown for H2O2 the concentration of a chemical in the plant is important for its role (Levine et al., 1994). It would seem that at high Paraquat concentrations (100 µM) cell death is induced (Ananieva et al., 2002), whilst at low Paraquat concentrations (10 µM) cellular protection is enhanced, i.e. resistance is induced (This study; Strobel and Ku , 1995).
This section has discussed the findings that systemic resistance could be induced in this system by local pre-treatment with some, but not all, bacterial strains and chemicals tested. The following section concerns the mechanisms behind the induced resistance and which markers correspond with the resistance mediated by the individual pre-treatments.
4.2 Systemic induced resistance: Looking for the responsible mechanisms
A variety of defence responses combine together to give rise to induced resistance. This feature means that protection is given against a wide range of phytopathogens. As such the individual responses play their own role but it is the sum of all the responses that characterises the plants ability to respond more strongly and quickly to secondary pathogen attack. In this section the accumulation of defence proteins (PR proteins, intercellular proteins and phenylpropanoid proteins) or antimicrobial substances (reactive oxygen species and phenolic compounds) will be discussed. Other issues addressed in this section are: The timing of the accumulation and thus how the plant responds to the local treatment; Whether the plant reprogrammes itself to pre-induce defence responses defence responses in the event of a later pathogen attack; Or whether the plant enters a state of enhanced ability to respond more strongly and more rapidly to a challenge pathogen.
4 Discussion__________________________________________________________________________________________________________________________________________________________________________________________________________________________________
101
4.2.1 Pathogenesis-related (PR) Proteins
PR proteins are a group of serologically similar proteins that accumulate following pathogen infection (van Loon, 1985; Linthorst, 1991). Some of these proteins have clearly defined functions, e.g. -1,3-glucanase (PR-2) and chitinase (PR-3) which hydrolyse fungal cell walls, whilst for others the function is not certain e.g. PR-1. PR proteins are often co-ordinately elevated during induced resistance (Ward et al., 1991). They have been classified into 14 families according to their sequences and properties (Gozzo, 2003). The majority of PR proteins are present in acidic and basic isoforms. Generally acidic isoforms are found in the apoplast and are induced by SA signalling, whilst basic PR proteins are located in the vacuole and are triggered by JA (Niki et al., 1998).
PR-1
Both Bion® and P.s.jap pre-treatments induced basic PR-1 expression both locally and systemically, suggesting that PR-1 plays a role in the resistance induced by both these treatments. In comparison to wheat where PR-1 genes can not be used as markers for induced resistance as PR-1 expression did not correlate with resistance (Molina et al., 1999), PR-1 is a suitable marker for resistance induced by Bion® and P.s.jap in this pathosystem. As described above basic PR expression is generally signalled by JA, yet this is unlikely for this pathosystem. Pre-treatment with Bion® or P.s.jap alone resulted in no local LOX expression, however, after the second infection local enhanced (primed) LOX expression was found (Figure 16) whilst PR-1 was induced after pre-treatment alone. Thus indicating that in addition to JA another signal induces local PR-1 expression, and this also applies to systemic PR-1 expression following P.s.jap pre-treatment. However it is possible that Bion® induced systemic PR-1 expression is triggered by JA. Paraquat pre-treatment led to no PR-1 induction through treatment alone, however, after secondary powdery mildew infection a strong priming effect was found both locally and systemically. Here the Paraquat pre-treated plants appear to be poised to respond quicker to challenge fungal attack, without having the cost of pre-emptively producing defence proteins. Local PR-1 priming correlates with the early local LOX priming suggesting the involvement of JA signalling in the first leaf. Another signalling molecule must contribute to the systemic response as Paraquat had no systemic effect upon LOX expression. Green and Fluhr (1995) found that SA induction of PR-1 expression functions via a ROS requiring pathway and non-ROS requiring pathway. However, it is unlikely that SA is involved in this induction as Paraquat treatment did not result in significant SA accumulation. Potentially a signal other than SA could induce comparable downstream cascades. The non-ROS requiring pathway is blocked by cylcoheximide thereby displaying a requirement for de novo protein synthesis, these results are consistent with those of Uknes et al. (1993). Various factors involved in protein synthesis were down regulated in plants displaying Paraquat mediated resistance (Table 13) suggesting a down regulation in de novo protein synthesis making it unlikely that
4 Discussion__________________________________________________________________________________________________________________________________________________________________________________________________________________________________
102
the non-ROS requiring pathway induces the observed PR-1 expression. The role of altered redox status in PR-1 expression was also described by Schultheiss et al. (2003), who found a temporal correlation between PR-1 induction and H2O2 accumulation in barley following Bghor Bipolaris sorokiniana infection. Paraquat mediated resistance altered the expression of a large number of redox genes (Table 13) implying an alteration in the redox potential. It is conceivable that ROS accumulation could contribute to systemic PR-1 expression. X.t.hor pre-treatment led to a mixture of responses, locally PR-1 expression was pre-induced similar to P.s.jap pre-treatment whilst systemically priming was found similar to Paraquat. This suggests that X.t.hor pre-treatment induces two independent signalling pathways, one involved in the local responses and the other for systemic responses. A similar expression pattern was also found for lipoxygenase, despite the local and systemic differences, it is possible that both pathways involve JA signalling and/ or perception.
Both acidic and basic PR-1 proteins were induced following TMV infection and SA application in tobacco (Linthorst, 1991). In contradiction, Niki et al. (1998) found that acidic PR-1 was induced by SA and was induced only at later time points after wounding, whilst basic PR-1 expression increased in water controls after wounding and not in SA treated tobacco plants. They suggest that acidic PR-1 is positively regulated by SA and negatively regulated by JA with opposing regulatory mechanisms for basic PR-1. The investigated PR-1 in this study was a basic isoform and appears to be regulated, at least to some extent, by JA however it appears that another signalling molecule has to be involved in expression regulation. Perhaps these differences in transcript regulation are because a monocotyledon was investigated here and not a dicotyledon as described above.
-1,3-Glucanase (PR2)
-1,3-glucanases are thought to play a role in signalling. Its enzymatic activity releases elicitors which can induce further defence responses, amongst others chitinase activity is induced by glucan fragments.
Basic -1,3-glucanase expression was induced in local and systemic leaves of Bion® treated plants. This correlates with expression patterns found in tobacco and Arabidopsis (Friedrich etal., 1996; Lawton et al., 1996). But Kogel et al. (1994) who used INA as a SA analogue and applied this by soil drench, could not find an induction in barley. It is possible that a different isoform was investigated which displays alternative expression patterns, or that soil drench leads to different results. It is difficult to compare the amount of SA analogue applied to a plant when different studies use soil drench or spraying. When soil drench is the method of choice, it is problematic determining what proportion is bound to soil particles and how much active ingredient actually reaches the plant. These are considerations before the actual uptake
4 Discussion__________________________________________________________________________________________________________________________________________________________________________________________________________________________________
103
into the plant and the final translocation within the plant. Soil drench also means that different long distance transport mechanisms are involved as the active ingredient, metabolite or second messenger must travel from the roots to the shoots, and therefore must be xylem mobile. When local leaves are sprayed shoot to shoot transport allows the systemic translocation, in this case transport must occur through the phloem. As in this system the first leaf was sprayed, which was clearly a source leaf during development of the second systemic leaf.
P.s.jap and Bion® pre-treatment resulted in similar -1,3-glucanase expression patterns although the systemic induction following P.s.jap pre-treatment was less pronounced than in the Bion® samples. This suggests that more -1,3-glucanase is present before Bgh inoculation occurs and can therefore engage antifungal action earlier than in uninduced plants and so contribute to thwarting fungal invasion. Bacterial infiltration led to similar results observed for PR-1 expression, local induction and systemic priming, implying that bacterially mediated resistance relies on co-ordinated PR gene expression. Shortly after treatment with X.t.hor (24 hpt) -1,3-glucanase displayed elevated systemic expression (Table 10A), at this time period treatment of barley with X.t.hor alone was sufficient to induce expression. This enhanced expression must be transient because in systemic samples taken 5 - 6 days after X.t.hor treatment either no or only basal expression was observed (Figure 21). Enhanced or primed -1,3-glucanase expression, in comparison to the mock controls, only became apparent after secondary fungal infection in systemic tissue.
Another situation was found after Paraquat pre-treatment, this resulted in priming barley plants to respond quicker to later fungal infection. Thus confirming previous indications that Paraquat initiates its effect on systemic resistance via another signalling pathway than the biotic inducers or SA analogue.
Chitinase (PR3)
Chitinase is a hydrolytic enzyme that acts on chitin, a substance present in fungal cell walls, which leads to weakening and eventually disruption of the fungal structures infecting plant cells (Iseli et al., 1996). This enzyme often works in combination with -1,3-glucanase (Schneider and Ullrich, 1994; Münch-Garthoff et al., 1997). As previously described for the other two tested PR genes chitinase expression was locally induced in barley plants pre-treated with Bion®, X.t.hor or P.s.jap. Implying that all these treatments function, at least partly, through the same pathway.
Chitinase expression differs systemically slightly from PR-1 and -1,3-glucanase, where Bion® and P.s.jap pre-treatment resulted in systemic gene induction. Only these two pre-treatments had an effect on systemic chitinase expression and then enhanced expression only
4 Discussion__________________________________________________________________________________________________________________________________________________________________________________________________________________________________
104
became apparent after the secondary fungal infection, and hence displayed a rapid primed response. This strengthens the idea that these two treatments activate the same signalling pathway.
Systemic resistance induction in barley seems to require the co-ordinate induction (Bion® and bacteria) or priming (Paraquat and X.t.hor systemically) of a group of PR genes, this idea was previously suggested for tobacco and cucumber (Schneider and Ullrich, 1994). The question remains as to which pathways are involved in mediating the observed PR expression. As the induced resistance appears to be SA-independent (see section 4.2.2.), signalling could be mediated by JA, ROS or possibly a further as yet unidentified second messenger. This will be discussed later.
A second question is, whether besides basic PR proteins other mechanisms are involved in the observed induced resistance. Thus it could be possible that acidic PR proteins, which are supposed to be intercellular, might be expressed.
Intercellular proteins
In an effort to encompass this last question 2D experiments were performed. Unfortunately the method for acquiring intercellular wash fluid (ICWF) led to a substantial cytoplasmic contamination. Other authors were able to extract the ICWF with less cellular perturbation (Schneider and Ullrich, 1994; Wohlgemuth, 2002) from tobacco. One possible reason for the high cytoplasmic contamination could be that the barley leaves were young and had not yet developed strong cell walls.
Very few proteins in the obtained “ICWF” from systemic leaves of locally pre-treated plants displayed differential expression (Figure 25) and these were identified as plastocyanin, a nuclear-encoded chloroplast protein involved in photosynthesis. This suggests that pre-treated plants do not accumulate large amounts of defence proteins in the apoplastic space. In tobacco plants 25 – 35 % of the defence enzyme activity was found in the intercellular wash fluid (Schneider and Ullrich, 1994). The PR genes tested during the course of this study coded for basic PR proteins. These isoforms are generally present in the vacuole (Linthorst, 1991), as such it is possible that the acidic isoforms, found intercellularly, were not induced. Perhaps as seen for transcript profiles major changes in protein expression are only apparent after secondary challenge with Bgh and not in systemic tissue of plants that were locally treated. Enhanced protein expression may only occur intracellularly, however this assumption conflicts with the literature where it has been found that primary powdery mildew infection induces higher accumulation of oxalate oxidase activity present in the apoplast (Vanacker etal., 1998). PR-1 proteins were also found to be present in ICWF following Bgh inoculation(Bryngelsson et al., 1994).

4 Discussion__________________________________________________________________________________________________________________________________________________________________________________________________________________________________
105
Further experiments would determine if protein expression is primed to respond stronger and faster as shown for transcript accumulation. In order to obtain a full picture of how the plant responds in the induced state enzyme activity tests would also be necessary.
As a systemic induction of intercellular proteins after the first treatment does not seem to be responsible for the observed induced resistance, it was analysed whether the oxidative capacity was affected. This could lead to marked changes in a rapid response to a second infection.
4.2.2 Reactive oxygen species (ROS) accumulation
ROS accumulation occurs rapidly after pathogen attack and is commonly known as an oxidative burst (Levine et al., 1994; Tenhaken et al., 1995; Low and Merida, 1996; Lamb and Dixon, 1997; Wojtaszek, 1997; Grant et al., 2000). Also associated with ROS accumulation is the hypersensitive response, which causes localised cell death around the site of pathogen penetration thus halting further pathogen growth into neighbouring tissues (Levine et al.,1996; Richael and Gilchrist, 1999; Alvarez, 2000; Heath, 2000b). ROS can be directly involved in pathogen defence, which will be discussed here, or can serve as a local signal, which will be discussed later in section 4.3.2.
Rboh A (respiratory burst oxidase homologue), a superoxide generating enzyme (Groom etal., 1996), was systemically induced in P.s.jap treated and Bgh inoculated plants (Table 11), thus increasing the ROS production capability. Ascorbate peroxidase (APX) and PRXCB, a secretory peroxidase, were also both induced, these enzymes are involved in detoxification of ROS within the cell. This was an unexpected finding as it was hypothesised that reduced APX expression would establish the involvement of HR in the systemic resistance. However these results indicate that systemically ROS are unable to accumulate to large quantities. Possibly the simultaneous induced expression of ROS producing and detoxifying genes results in a rapid ROS turnover. Hence allowing a tight control and faster induction of ROS related defence responses. Conceivably these genes could be compartmentalised in different leaf regions. So that perhaps close to the site of pathogen infection ROS producing genes are induced whilst in adjacent tissue ROS detoxifying genes are elevated. This would also be relevant for the role of ROS as signalling molecules, which is discussed later (see section 4.3.2). Whether such compartmentalisation of ROS genes exists would require discrete sampling.
Peroxidase (class III) catalyses the reduction of H2O2 in a broad range of physiological processes such as auxin metabolism, lignin formation, oxidative cross-linking of cell wall proteins, defence against pathogens or cell elongation (Bradley et al., 1992; Olson and

4 Discussion__________________________________________________________________________________________________________________________________________________________________________________________________________________________________
106
Varner, 1993; Brisson et al., 1994; Passardi et al., 2004). That this protein is down regulatedfor both Paraquat time points (Table 12 and 13) suggests that an elevated amount of ROS would be able to accumulate within the cells. So allowing either direct antimicrobial action or signalling to occur as a result of an oxidative burst. This also implies that mechanisms such as lignification or cross-linking of cell wall proteins do not play an important role in this form of mediated resistance. Local Paraquat treatment had a massive effect upon systemic redox genes for the majority of cases the genes were reduced. This would lead to a dramatic change in the redox potential of Paraquat treated plants, a state which can influence NPR1 localisation, a positive SAR or ISR regulator (see below). However both Rboh A and a germin-like protein, two ROS producing enzymes, were also reduced following Paraquat treatment or mediated resistance. Leaving the possibility that not all ROS producing or metabolising enzymes are encompassed on the present array, or compartmentalisation of the enzymes as described above.
4.2.3 Phenylpropanoid
Other possible substances, which might lead to an increased resistance in systemic leaves are phenylpropanoids, which are aromatic secondary metabolites produced in plants. These compounds are as diverse in structure, ranging from coumarins to anthocyanins (Hahlbrock and Scheel, 1989), as they are in function. Phenylpropanoids can serve as UV protectants, signalling molecules or flower pigments to name but a few (Nicholson and Hammerschmidt, 1992; Winkel-Shirley, 2001; Winkel, 2004). Whilst in pathogen defence their functions range from cell wall strengthening, e.g. lignification (Olson and Varner, 1993), to antimicrobialtoxicity, e.g. phytoalexins (Hammerschmidt, 1999). Lignification and phytoalexin synthesis in combination with other phenolic compounds could lead to an enhanced resistance.
Phenylalanine ammonium lyase (PAL)
PAL as the first enzyme of phenylpropanoid metabolism (Logemann, et al., 1995; Dixon etal., 2002) was locally slightly induced in X.t.cer and P.s.jap pre-treated plants (Figure 14). And it was strongly induced in systemic Bgh inoculated samples which in turn led to a slight general increase in soluble aromatic compounds (compare Figures 13, 14 and Table 8). However, differentiation of the response to the individual pre-treatments could not be observed. Thus although PAL is transcriptionally regulated, it is involved in general rather than specific resistance (Kervinen et al., 1997) and not affected by the pre-treatments. Use of the PAL inhibitor AOPP ( -amino- -phenylpropionic acid) demonstrated that PAL activity is required for powdery mildew resistance in barley (Carver et al., 1994). This correlates with data obtained during the course of this study, where fungal infection led to an increase in PAL expression, whilst pre-treatments failed to enhance this systemic induction.
4 Discussion__________________________________________________________________________________________________________________________________________________________________________________________________________________________________
107
For local defence reactions Katz et al. (1998) showed that in parsley cell suspension Bion®
pre-treatment led to a primed PAL transcript accumulation. This correlates with the data presented here (4h local), not only for Bion® but also for Paraquat, X.t.hor and X.t.tratreatments, suggesting that PAL expression is involved in local reactions and could also be relevant for local secondary infections. It possibly leads to enhanced production of phenolic products for lignification or alternative cross-linking to strengthen cell walls. These phenolic compounds are bound to the cell wall and would therefore not be detected by the method used in this study. Papilla, cell wall appositions, form below the fungal appressorium and prevent fungal penetration (Zeyen et al., 2002). Papillae contain phenolics and proteins amongst others (Wei et al., 1994), offering another possible defence response, again the phenolics would be bound within the papillae and thus undetectable to the method utilised in this study.
Chalcone synthase (CHS)
CHS is the first committed step of flavonoid biosynthesis (Logemann, et al., 2000; Rohde etal., 1991). Flavonoids are secondary metabolites with a wide variety of functions including flower pigmentation and plant-pathogen interactions (Winkel-Shirley, 2001; Hartmann et al.,2005). Primed CHS expression was observed in systemic leaves of Paraquat or bacterially pre-treated barley plants in response to secondary fungal infection (Figure 15). In combination with phenolic profiles for Peaks 1 and 2 (Table 8) it could be speculated that induced compounds were enhanced for the treatments which effected CHS expression. Such that the pre-treatments appear to induce CHS expression which later led to higher accumulation of flavonoids. Flavonoids often act as phytoalexins (Winkel-Shirley, 2001), possibly their accumulation is primed allowing the plant to react more effectively to secondary pathogen attack.
The lack of alteration in soluble phenolic compound accumulation in response to the individual pre-treatments suggests that if phenolics do play a significant role in the observed resistance then it must be due to the insoluble cell wall bound phenolics that could not be determined by the method used in the course of this study. Further experiments would be required to clarify this. However, it seems unlikely that insoluble phenolics would play a role in the observed systemic resistance as the individual pre-treatments failed to display differential systemic PAL expression.
4.2.4 Additional defence mechanisms
This subsection discusses the mechanisms for which indications were found from microarray analysis.
4 Discussion__________________________________________________________________________________________________________________________________________________________________________________________________________________________________
108
RNase S-like protein is a protein for which the clear function in SAR is not known at present, it has been found to be induced in SAR induced tobacco plants (Galiana et al., 1997). It was slightly induced systemically in X.t.hor pre-treated and subsequently with Bgh inoculated(Table 10B), this correlates well with the literature where it is expressed in response to pathogen invasion.
Immunophilins display elevated expression after wounding, high salt concentrations, heat (Vucich and Gasser, 1996; Kurek et al., 1999) and may be induced by other forms of stress. However during the course of this study the immunophilin peptidylprolyl isomerase was slightly reduced systemically in P.s.jap mediated resistance (5 dpt 4 hpi, Table 11). Peptidylprolyl isomerase belongs to a group of proteins with the ability to bind immuno-suppressive drugs such as the macrolide drug FK506 or cyclosporin A (Kurek et al., 1999). FKBPs (FK506-binding protein) have been suggested to function as regulators of multidrug resistance (MDR)-like ATP-binding cassette (ABC) transporters (Geisler et al., 2004). ABC transporters actively bind harmful or unwanted substances and traffic them out of the cell, so detoxifying the cell (Klein et al., 2006). The multidrug resistance associated protein (MRP)-like ABC transporter gene family is closely related to the MDR subfamily (Kolukisaoglu etal., 2002). Post-translational events such as protein-protein interactions with calmodulin and immunophilins are an integral part of the regulatory network of ABC transporters (Klein et al., 2006). If indeed immunophilins are negative regulators this would be in accordance with the results obtained here as in P.s.jap mediated resistance (5 dpt 4 hpi) MRP2 expression was highly increased whilst peptidylprolyl isomerase expression was reduced. Thereby allowing additional toxic substances to be transported out of the cell and into the vacuole.
Positively charged proteins, such as thionins which were induced in plants following Paraquat treatment or mediated response (Table 12 and 13), interact with negatively charged fungal lipid bilayer leading to membrane permeability modification and disrupting the membrane organisation (Pelegrini et al., 2005) thus directly involved in defence against fungal attack. Membrane disruption could also lead to the release of elicitors which could function as secondary messengers in signal transduction.
4.3 Role of signalling cascades
Up to this point the mechanisms involved in providing systemic induced resistance have been discussed. Now a closer look will be taken at the signalling cascades which are putatively involved in mediating the observed response.

4 Discussion__________________________________________________________________________________________________________________________________________________________________________________________________________________________________
109
4.3.1 Calcium
Calcium serves as a cellular second messenger, triggering responses to a wide variety of signals including fungal elicitors, oxidative stress and wounding (Trewavas, 2000), and regulates some forms of programmed cell death (PCD) and gene expression (Michalak et al.,1998). Calcium influx is stimulated following pathogen perception, representing one of the earliest detectable reactions of the cells (Jabs et al., 1997), and leads to an increase in the concentration of free Ca2+ in the cytosol. This alteration in calcium concentration can initiate various defence responses including ROS production (Blumwald et al., 1998). Hydrogen peroxide from an oxidative burst can also stimulate Ca2+ influx, resulting in positive feedback and signal amplification. This allows hydrogen peroxide threshold levels to be reached and a sustained calcium influx which can then activate cell death (Levine et al., 1996).
The expression of calreticulin, which is a major calcium binding protein located in ER responsible for the regulation of cytosolic free calcium concentrations (Chen et al., 1994; Michalak et al., 1998; Agrawal et al., 2002), increased in systemic leaves of plants displaying Paraquat mediated resistance (5 dpt 4 hpi, Table 13). In addition to its role in calcium homeostasis, it is proposed to play an important role as a molecular chaperone (Michalak et al., 1998; Agrawal et al., 2002). Paraquat induced calreticulin could be required for extra calcium storage to enhance the plants capability to specify the strength and/ or duration of a calcium signal. Another possibility would be as part of a general shift in metabolism and a heightened requirement for correct protein folding in its chaperone function.
Chitinase (PR3) was down regulated in systemic samples of Paraquat treated and subsequently powdery mildew infected plants. This was also found during Northern blot analysis (Figure 22). In rice Ca2+ induces this gene (Saito et al., 2003). The up regulation of calreticulin could be involved in the down regulation of this PR protein. Enhanced storage capacity would lead to more calcium being bound to calreticulin leaving less free calcium available for signalling and therefore for chitinase induction.
4.3.2 ROS
ROS can function as second messengers that induce HR and then SAR (Levine et al., 1994; Ryals et al., 1996; Lamb and Dixon, 1997; Alvarez et al., 1998; Alvarez 2000; Grant et al.,2000). In this study two ROS signalling effects were found, firstly in local leaves shortly after bacterial pre-treatment. At the infiltration site shortly after bacterial pre-treatment it was found that hydrogen peroxide accumulated in all bacteria-barley interactions that resulted in systemic induced resistance (Figure 11A). A correlation between the speed and strength, as determined by intensity of DAB accumulation, of hydrogen peroxide accumulation and the degree of systemic resistance was found. The quicker and more intense the DAB staining, hence H2O2, the lower the systemic fungal growth therefore the better the resistance

4 Discussion__________________________________________________________________________________________________________________________________________________________________________________________________________________________________
110
induction. Hydrogen peroxide has previously been shown to play an important role in cell death (Mellersh et al., 2002; Hückelhoven and Kogel, 2003), as seen for P.s.jap large quantities led to local cell death. This signalling molecule has the longest half life of all ROS and can cross membranes (Baker and Orlandi, 1995). Thus increased levels of hydrogen peroxide could also function as a local signal that could initiate a systemic signal to be transported throughout the plant enabling it to react quicker to secondary pathogen attack.
Superoxide accumulated around the infiltration area (Figure 11B) which corresponds to its proposed role in restricting the spread of cell death throughout the whole leaf or plant (Hückelhoven and Kogel, 2003). As described for hydrogen peroxide the speed and strength of O.-
2 accumulation correlated to the protection provided against systemic powdery mildew infection. Exclusion of superoxide accumulation, which is also a product of normal photosynthetic activity, following P.s.jap and X.t.hor infiltration suggests that photosynthesisis down-regulated within the infiltrated area. At later time points necrosis and chlorosis formation was observed at the infiltration sites confirming that photosynthesis is down-regulated after bacterial infiltration. This would deprive the pathogen of carbon and energy, in the form of sugar, thus hindering further pathogen growth.
The second ROS signalling effect was found to occur in systemic leaves of locally pre-treated plants before secondary pathogen attack. Germin was increased in systemic leaves X.t.hor24 hpt (Table 10A) which is said to be involved in ROS production combined with reduced PRXCB a secretory peroxidase found in the extracellular space or vacuole which is involved in hydrogen peroxide detoxification. This indicates that local X.t.hor treatment leads to a systemic ROS increase. This could enable direct antimicrobial action or activate systemic defence genes to respond quicker to secondary pathogen attack.
4.3.3 Salicylic acid (SA)
Increases seen in SA accumulation here are low (maximum 2 fold induction) for untreated, Bion® and P.s.jap pre-treatments for the 24 hpi samples in comparison to that found in tobacco of 5 - 10 fold induction following local TMV infection (Malamy et al., 1990). The individual pre-treatments had no effect on systemic SA accumulation.
In this study it was found that SA did not significantly accumulate after Bgh infection. This is in line with previous studies using the same pathosystem (Kogel et al., 1994; Schweizer et al.,1997; Vallélian-Bindschedler et al., 1998). It can be concluded that SA accumulation does not appear to play a significant role in systemic resistance in barley. However, SA involvement in local defence reactions can not be ruled out.

4 Discussion__________________________________________________________________________________________________________________________________________________________________________________________________________________________________
111
MYB1 transcription factor was highly elevated shortly after the challenge fungal infection (4 hpi) in X.t.hor pre-treated plants (Table 10A), possibly it was primed to respond quicker and stronger. In tobacco NtMYB1 was found to be SA-inducible and induced following TMV infection (Jin and Martin, 1999). This transcription factor could be involved in the signallingcascade leading to elevation of defence gene expression. In Arabidopsis AtMYB1 was expressed in most tissues and after most treatments (Kranz et al., 1998), showing that MYB1 from different species can perform different roles.
Basal resistance to biotrophic pathogens in dicotyledons is controlled by SA triggered responses (Ton et al., 2002). Although Bgh is a biotroph, barley does not appear to rely on SA-mediated signalling cascades. SA accumulation was not a pre-requisite for defence gene expression or induced resistance as in dicotyledons, e.g. SAR. This suggests that there are major differences in the signalling pathways mediating induced resistance in monocotyledons and dicotyledons. Perhaps JA plays a more important role in signalling systemic induced resistance in monocotyledons.
4.3.4 Jasmonate
LOX expression was investigated as a measure of the influence of jasmonic acid (JA) and the octadecanoid pathway on the induced resistance. LOX was examined because it plays an important role in the wound response (Rosahl, 1996), in JA-dependent defence reactions (Thomma et al., 1998) and in the Rhizobacteria mediated induced systemic resistance (Pieterse et al., 1996). Differences were found not only between the individual treatments but also locally and systemically. X.t.hor pre-treatment led to significant local LOX induction, whilst systemic primed expression was observed after the secondary fungal infection. Bion®
pre-treatment induced LOX expression systemically, all other pre-treatments led to systemic priming of LOX transcript accumulation. LOX has also been described as a BCI by Beßer et al. (2000), as such expression was only induced following chemical activation and not following Bgh infection. Hause et al. (1999) showed that 7 hours after Bion® treatment LOX was induced and remained induced for the duration of the experiment. In contrast to the literature the same isoform was found to be induced in this pathosystem, confirming that cultivars can differ in gene expression.
Due to the chloroplastic localisation of this protein (Vöros et al., 1998) a direct signalling role in epidermal cells against powdery mildew can be ruled out. As Bgh attack occurs solely in the epidermal cells which contain few if any chloroplasts. Thus JA would be produced in the neighbouring mesophyll cells and not in the attacked epidermal cells. It seems probable that the primed expression could also play a role in signalling for systemic defence responses. Whereby elevated JA biosynthesis activates defence responses, such as typical JA inducible

4 Discussion__________________________________________________________________________________________________________________________________________________________________________________________________________________________________
112
proteins (e.g. thionins or defensins) or alternatively the as yet undefined responses induced during ISR, which offer a broad spectrum resistance.
Indeed, two thionin coding ESTs (Thi 2.1) were up-regulated in systemic Paraquat 24 hpt samples (Table 12) and an additional thionin was induced 5 dpt 4 hpi (Table 13). This group of basic peptides is one of the main JA-induced proteins in barley leaves (Andresen et al.,1992). Suggesting that Paraquat mediated induced resistance utilises the JA signalling pathway as opposed to SA signalling pathways involved in SAR of dicotyledons. Ethylene signalling suppresses Thi 2.1 transcription in Arabidopsis (Turner et al., 2002), this is an unusual finding as JA and ethylene signalling often respond synergistically following pathogen invasion (Lorenzo et al., 2003). However, neither JA (LOX, Figure 16) nor ethylene (SAMS, Figure 17 and ACCO, Figure 18) were systemically induced by Paraquat treatment. Suggesting that a different signalling mechanism is responsible for the Paraquat-mediated resistance or that Paraquat functions downstream of JA. Thionins are highly induced by pathogens and MeJA (Florack and Stiekema, 1994; Pieterse and Van Loon, 1999; Pelegrini et al., 2005). It is possible that a mechanism similar to that described for rhizobacterium-mediated ISR is induced by Paraquat pre-treatment. That despite no JA accumulation, the induced plants could display a heightened JA sensitivity (Pieterse and Van Loon, 1999). It follows that it is possible that induced plants are able to demonstrate a higher sensitivity to a specific hormone. Even if no phytohormone accumulation could be determined, these plants might already respond to very low doses of these phytohormones. The induced plants could also respond to SA, even though no systemic accumulation was found following Paraquat pre-treatment irrespective of subsequent fungal infection. Thionin genes in barley can be induced by SA as well as jasmonate (Kogel et al., 1995). Demonstrating that thionins are regulated by more than one signalling cascade. Induction of leaf thionin mRNA has been described after powdery mildew infection, however, a cultivar-related difference in distribution of these thionins in epidermal cells in compatible and incompatible interactions between barley and powdery mildew was found (Florack and Stiekema, 1994). Therefore the induced expression of thionin genes in this work does not give any definite indication as to which signalling pathways were involved in the mediation of resistance. Further experiments would have to be performed to clarify the role, timing and spatial location of the individual signalling pathways in initiating the observed systemic resistance.
Proteinase inhibitor (PIN) is another protein, known to be regulated by JA. This type of protein is wound-induced and inhibits insects’ proteolytic digestive enzymes which can lead to a protein malnutrition and growth problems eventually leading to the insects death (Doares et al., 1995). This protein is up regulated by JA and its expression is reduced by SA, thereby raising doubt for the role of JA signalling in Paraquat mediated resistance as in this study it is

4 Discussion__________________________________________________________________________________________________________________________________________________________________________________________________________________________________
113
down regulated. Which correlates well with northern LOX data (Figure 16) as Paraquat treatment had no effect on systemic LOX expression. This indicates that not all responses downstream of JA, which must be induced by another signalling molecule, play a role in the response triggered by Paraquat. The fact that Paraquat pre-treatment had no effect on SA accumulation suggests that an alternative negative regulation for PIN exists, which could be ethylene.
4.3.5 Ethylene/ Polyamine
Taken together the weak transient SAMS induction (Figure 17) and ACCO reduction (Figure 18) after Bgh inoculation for P.s.jap and X.t.hor indicates a small increase in polyamine biosynthesis occurred. Whilst ACCO was reduced in all Bgh inoculated samples and therefore representing a general reaction to Bgh. The combined results give a clear indication that ethylene signalling is not involved in the observed resistance 24 hours after powdery mildew infection. However, ethylene signalling shortly after the secondary pathogen attack can not be ruled out, particularly for P.s.jap 4 hpi which displayed the strongest SAMS induction. Ethylene signalling, in the form of ACCO transcript induction, has previously been described to occur shortly (2 hours) after bacterial infiltration (Scheideler et al., 2002). Suggesting that early ACCO induction could have been missed, if this induction was transient. The fact that an ethylene responsive factor (ERF3) was strongly induced in P.s.jap pre-treated and subsequently Bgh inoculated systemic samples (Table 11) strengthens the idea that, at least for P.s.jap-mediated resistance, ethylene is involved in early signalling events.
Polyamines accumulate in response to pathogen infection (Cowley and Walters, 2002a; Walters, 2003a). In addition it was found that primary leaves treated with MeJA lead to systemic protection against Bgh and polyamine accumulation (Walters et al., 2002). As described above systemic LOX induction and priming was observed for Bion® and bacterial pre-infiltrations, respectively, the increased JA could lead to systemic polyamine priming. This could be a factor in the observed induced resistance. To ascertain whether polyamine biosynthesis is increased the following enzyme activities: ornithine decarboxylase; soluble and particulate arginine decarboxylase; and SAM decarboxylase (Cowley and Walters, 2002b) could be monitored. Also the polyamine concentration could be measured, to determine if accumulation occurs.
Hydroxycinnamic acid amides (HCAA) have been implicated in plant resistance to pathogens (Walters, 2003b). High polyamine levels are generally found in young actively metabolising tissues whilst low polyamine levels are more common in tissue where metabolism has slowed down e.g. senescing leaves (Walters, 2000). Polyamine conjugates such as HCAAs are known to accumulate in incompatible plant-pathogen interactions and have also been shown to exhibit direct antifungal properties (von Ropenack et al., 1998). If these compounds played a

4 Discussion__________________________________________________________________________________________________________________________________________________________________________________________________________________________________
114
role in the systemic resistance, it would have been expected to find an accumulation in the soluble phenolic HPLC profiles. As this was not the case, it can be assumed that polyamine conjugates are not important for the improved resistance.
4.3.6 Additional signalling events
Of all the biological and chemical pre-treatments only Bion® induced BCI-4 expression, a molecular marker for chemically induced resistance (CIR). Indicating that although Paraquat is a chemical it does not induce CIR and functions differently to the SA analogue Bion®.

5 Conclusions__________________________________________________________________________________________________________________________________________________________________________________________________________________________________
115
5 Conclusions
5.1 Testing the system During the course of this study the effects of local pre-treatment of barley with certain chemicals or bacteria on secondary powdery mildew growth on systemic leaves was investigated. It was demonstrated that some but not all of the bacteria tested were capable of lowering systemic Blumeria graminis f.sp. hordei (Bgh) infection. Furthermore it was concluded that this systemic protection was in the form of induced resistance.
It could be demonstrated that confined virulent bacterial growth was necessary andsufficient to induce systemic resistance. Furthermore continued bacterial growth was found, which led to the speculation that the growing bacteria released a signal into the plant and that this continuous signal supply was important to the systemic protection provided. The bacteria that were able to induce systemic resistance did so at differing rates, Pseudomonassyringae pv. japonica (P.s.jap) was the most effective biological inducer whilst Xanthomonas translucens pv. translucens (X.t.tra) was the least effective.
Bion® was the most effective salicylic acid (SA) analogue and displayed inverse dose dependence. Despite being a herbicide it was found that local pre-treatment of barley leaves with low concentrations of Paraquat triggered systemic cellular protection. This pro-oxidant chemical was less effective than Bion® at protecting systemic tissues from secondary fungal infection.
5.2 Systemic induced resistance: Looking for the responsible mechanisms It was found that barley plants responded differently to the individual pre-treatments tested during the course of this thesis. Defence proteins, all 3 PR-proteins tested, accumulated systemically following Bion® or P.s.jap pre-treatments alone. These pre-treatments generally seemed to result in the plant reprogramming itself pre-inducing defence responses allowing the induced plant to respond instantly to subsequent pathogen attack.
Paraquat pre-treatment of barley plants alone appeared to have no significant effect on the plant. Enhanced accumulation of defence proteins, e.g. PR-1, only became apparent following secondary powdery mildew infection. Indications were found that two soluble phenolic compounds, possibly flavonoids (potential antimicrobial substances), were also enhanced. As such the plant had entered a state of enhanced ability to respond stronger and more rapidly to the challenge pathogen.

5 Conclusions__________________________________________________________________________________________________________________________________________________________________________________________________________________________________
116
For the remaining bacterial (Xanthomonas subspecies) inducers a combination of the above described processes was found. In local tissues the pre-treatments resulted in induction of defence mechanisms, whilst the systemic tissues became primed to respond stronger and more rapidly to the secondary powdery mildew infection.
5.3 Role of signalling cascades It was proposed that Bion® mediates its systemic effects through JA signalling, whilst an additional signal is required locally possibly ROS or SA. P.s.jap utilises at least to a certain extent the same local signalling cascades as Bion®, this combination of JA and ROS signalling appears to be preceded systemically by early transient ethylene involvement.
Paraquat treatment alone or in combination with a secondary Bgh infection had a massive effect on a number of redox genes in systemic tissues, which were reduced indicating it is more likely that alterations in the redox potential may occur. JA is suggested to mediate local responses to Paraquat treatment.
Local signalling events are initiated by ROS following Xanthomonas subspecies pre-treatment and possibly include JA at later time points. In systemic tissues JA signalling could also be involved although a different response was found (priming as opposed to local induction).
The results obtained during this study indicate that a complex interaction of signalling pathways is involved in mediating the observed systemic induced resistance in barley. This resistance although displaying certain similarities to SAR in dicotyledons differs in many aspects. This study suggests that induced resistance in monocotyledons is even more elaborate than that found in dicotyledons and deserves further investigation.

6 References__________________________________________________________________________________________________________________________________________________________________________________________________________________________________
117
6 References
Abbott, W. (1925). A method for computing the effectiveness of an insecticide. Journal of Economic Entomology 18, 265-267.
Agarwal, G. K., Rakwal, R., Yonekura, M., Kubo, A., & Saji, H. (2002). Proteome analysis of differentially displayed proteins as a tool for investigating ozone stress in rice (Oryza sativa L.) seedlings. Proteomics 2, 947-959.
Alvarez, M. E., Pennell, R. I., Meijer, P. J., Ishikawa, A., Dixon, R. A., & Lamb, C. (1998). Reactive oxygen intermediates mediate a systemic signal network in the establishment of plant immunity. Cell 92, 773-784.
Alvarez, M. E. (2000). Salicylic acid in the machinery of hypersensitive cell death and disease resistance. Plant Molecular Biology 44, 429-442.
Ananieva, E. A., Alexieva, V. S., & Popova, L. P. (2002). Treatment with salicylic acid decreases the effects of paraquat on photosynthesis. Journal of Plant Physiology 159, 685-693.
Ananieva, E. A., Christov, K. N., & Popova, L. P. (2004). Exogenous treatment with salicylic acid leads to increased antioxidant capacity in leaves of barley plants exposed to paraquat. Journal of Plant Physiology 161, 319-328.
Andresen, I., Becker, W., Schlüter, K., Burges, J., Parthier, B., & Apel, K. (1992). The identification of leaf thionin as one of the main jasmonate-induced proteins of barley (Hordeum vulgare). Plant Molecular Biology 19, 193-204.
Ausubel, F. M., Brent, R., Kingston, R. E., Moore, D. D., Seidman, J. G., Smith, J. A., & Struhl, K. (2002). Current protocols in molecular biology John Wiley & Sons, Inc., New York.
Baker, C. J. & Orlandi, E. W. (1995). Active oxygen in plant pathogenesis. Annual Review of Phytopathology 33, 299-321.
Bernier, F. & Berna, A. (2001). Germins and germin-like proteins: Plant do-all proteins. But what do they do exactly? Plant Physiology and Biochemistry 39, 545-554.
Besser, K., Jarosch, B., Langen, G., & Kogel, K.-H. (2000). Expression analysis of genes induced in barley after chemical activation reveals distinct disease resistance pathways. Molecular Plant Pathology 1, 277-286.

6 References ________________________________________________________________________________________________________________________________________________________________________________________________________________________________ __
118
Blumwald, E., Aharon, G. S., & Lam, B. C. H. (1998). Early signal transduction pathways in plant-pathogen interactions. Trends in Plant Science 3, 342-346.
Bolwell, G. P. & Wojtaszek, P. (1997). Mechanisms for the generation of reactive oxygen species in plant defence - a broad perspective. Physiological and Molecular Plant Pathology 51, 347-366.
Bradford, M. M. (1976). A rapid and sensitive method for the quantitation of microgram quantities of protein utilizing the principle of protein-dye binding. Analytical Biochemistry 72,248-254.
Bradley, D. J., Kjellbom, P., & Lamb, C. J. (1992). Elicitor-induced and wound-induced oxidative cross-linking of a proline-rich plant cell wall protein - a novel, rapid defense response. Cell 70, 21-30.
Brisson, L. F., Tenhaken, R., & Lamb, C. (1994). Function of oxidative cross-linking of cell wall structural proteins in plant disease resistance. Plant Cell 6, 1703-1712.
Bryngelsson, T., Sommerknudsen, J., Gregersen, P. L., Collinge, D. B., Ek, B., & Thordal-Christensen, H. (1994). Purification, characterization, and molecular cloning of basic PR-1-type pathogenesis-related proteins from barley. Molecular Plant-Microbe Interactions 7, 267-275.
Cao, H., Glazebrook, J., Clarke, J. D., Volko, S., & Dong, X. N. (1997). The Arabidopsis NPR1 gene that controls systemic acquired resistance encodes a novel protein containing ankyrin repeats. Cell 88, 57-63.
Carver, T. L. W., Zeyen, R. J., Bushnell, W. R., & Robbins, M. P. (1994). Inhibition of phenylalanine ammonia-lyase and cinnamyl alcohol-dehydrogenase increases quantitative susceptibility of barley to powdery mildew (Erysiphe graminis DC). Physiological and Molecular Plant Pathology 44, 261-272.
Chaure, P., Gurr, S. J., & Spanu, P. (2000). Stable transformation of Erysiphe graminis, an obligate biotrophic pathogen of barley. Nature Biotechnology 18, 205-207.
Chen, F., Hayes, P. M., Mulrooney, D. M., & Pan, A. (1994). Identification and characterization of cDNA clones encoding plant calreticulin in barley. Plant Cell 6, 835-843.
Chen, Y. F., Etheridge, N., & Schaller, G. E. (2005). Ethylene signal transduction. Annals of Botany 95, 901-915.
6 References__________________________________________________________________________________________________________________________________________________________________________________________________________________________________
119
Chen, Z. X., Silva, H., & Klessig, D. F. (1993). Active oxygen species in the induction of plant systemic acquired resistance by salicylic acid. Science 262, 1883-1886.
Cheong, J. J. & Choi, Y. D. (2003). Methyl jasmonate as a vital substance in plants. Trends in Genetics 19, 409-413.
Cowley, T. & Walters, D. R. (2002a). Polyamine metabolism in an incompatible interaction between barley and the powdery mildew fungus, Blumeria graminis f. sp hordei. Journal of Phytopathology-Phytopathologische Zeitschrift 150, 581-586.
Cowley, T. & Walters, D. R. (2002b). Polyamine metabolism in barley reacting hypersensitively to the powdery mildew fungus Blumeria graminis f. sp hordei. Plant Cell and Environment 25,461-468.
Delaney, T. P., Uknes, S., Vernooij, B., Friedrich, L., Weymann, K., Negrotto, D., Gaffney, T., Gutrella, M., Kessmann, H., Ward, E., & Ryals, J. (1994). A central role of salicylic acid in plant disease resistance. Science 266, 1247-1250.
Delaney, T. P., Friedrich, L., & Ryals, J. A. (1995). Arabidopsis signal transduction mutant defective in chemically and biologically induced disease resistance. Proceedings of the National Academy of Sciences of the United States of America 92, 6602-6606.
Dietrich, R. A., Lawton, K., Friedrich, L., Cade, R., Willits, M., & Maleck, K. (1999). Induced plant defence responses: scientific and commerical development possibilities. In Insect-plant interactions and induced plant defence, eds. Chadwick, D. J. & Goode, J. A., pp. 205-216. John Wiley & Sons Ltd., Chicester.
Dixon, R. A., Achnine, L., Kota, P., Liu, C. J., Reddy, M. S. S., & Wang, L. J. (2002). The phenylpropanoid pathway and plant defence - a genomics perspective. Molecular Plant Pathology 3, 371-390.
Doares, S. H., Narvaez-Vasquez, J., Conconi, A., & Ryan, C. A. (1995). Salicylic acid inhibits synthesis of proteinase inhibitors in tomato leaves induced by systemin and jasmonic acid. Plant Physiology 108, 1741-1746.
Doke, N. & Ohashi, Y. (1988). Involvement of an O2- generating system in the indcution of
necrotic lesions on tobacco leaves infected with tobacco mosaic virus. Phyiological and Molecular Plant Pathology 32, 163-175.

6 References ________________________________________________________________________________________________________________________________________________________________________________________________________________________________ __
120
Dong, X. N. (1998). SA, JA, ethylene, and disease resistance in plants. Current Opinion in Plant Biology 1, 316-323.
Dong, X. N. (2001). Genetic dissection of systemic acquired resistance. Current Opinion in Plant Biology 4, 309-314.
Durner, J. & Klessig, D. F. (1995). Inhibition of ascorbate peroxidase by salicylic-acid and 2,6-dichloroisonicotinic acid, 2 inducers of plant defense responses. Proceedings of the National Academy of Sciences of the United States of America 92, 11312-11316.
Durrant, W. E. & Dong, X. (2004). Systemic acquired resistance. Annual Review of Phytopathology 42, 185-209.
Esposito, S., Guerriero, G., Vona, V., Rigano, V. D., Carfagna, S., & Rigano, C. (2005). Glutamate synthase activities and protein changes in relation to nitrogen nutrition in barley: the dependence on different plastidic glucose-6P dehydrogenase isoforms. Journal of Experimental Botany 56, 55-64.
Farmer, E. E. & Ryan, C. A. (1992). Octadecanoid precursors of jasmonic acid activate the synthesis of wound-inducible proteinase inhibitors. Plant Cell 4, 129-134.
Farmer, E. E., Alméras, E., & Krishnamurthy, V. (2003). Jasmonates and related oxylipins in plant responses to pathogenesis and herbivory. Current Opinion in Plant Biology 6, 372-378.
Feussner, I., Hause, B., Vörös, K., Parthier, B., & Wasternack, C. (1995). Jasmonate-induced lipoxygenase forms are localized in chloroplasts of barley leaves (Hordeum vulgare cv. Salome).Plant Journal 7, 949-957.
Feussner, I. & Wasternack, C. (2002). The lipoxygenase pathway. Annual Review of Plant Biology 53, 275-297.
Flor, H. H. (1971). Current status of gene-for-gene concept. Annual Review of Phytopathology 9,275-&.
Florack, D. E. A. & Stiekema, W. J. (1994). Thionins: properties, possible biological roles and mechanisms of action. Plant Molecular Biology 26, 25-37.
Fobert, P. R. & Despres, C. (2005). Redox control of systemic acquired resistance. CurrentOpinion in Plant Biology 8, 378-382.

6 References__________________________________________________________________________________________________________________________________________________________________________________________________________________________________
121
Friedrich, L., Vernooij, B., Gaffney, T., Morse, A., & Ryals, J. (1995). Characterization of tobacco plants expressing a bacterial salicylate hydroxylase gene. Plant Molecular Biology 29,959-968.
Friedrich, L., Lawton, K., Ruess, W., Masner, P., Specker, N., Rella, M. G., Meier, B., Dincher, S., Staub, T., Uknes, S., Métraux, J. P., Kessmann, H., & Ryals, J. (1996). A benzothiadiazole derivative induces systemic acquired resistance in tobacco. Plant Journal 10, 61-70.
Gaffney, T., Friedrich, L., Vernooij, B., Negrotto, D., Nye, G., Uknes, S., Ward, E., Kessmann, H., & Ryals, J. (1993). Requirement of salicylic acid for the induction of systemic acquired resistance. Science 261, 754-756.
Galiana, E., Bonnet, P., Conrod, S., Keller, H., Panabières, F., Ponchet, M., Poupet, A., & Ricci, P. (1997). RNase activity prevents the growth of a fungal pathogen in tobacco leaves and increases upon induction of systemic acquired resistance with elicitin. Plant Physiology 115,1557-1567.
Geisler, M., Girin, M., Brandt, S., Vincenzetti, V., Plaza, S., Paris, N., Kobae, Y., Maeshima, M., Billion, K., Kolukisaoglu, U. H., Schulz, B., & Martinoia, E. (2004). Arabidopsis immunophilin-like TWD1 functionally interacts with vacuolar ABC transporters. Molecular Biology of the Cell15, 3393-3405.
Gilchrist, D. G. (1998). Programmed cell death in plant disease: The purpose and promise of cellular suicide. Annual Review of Phytopathology 36, 393-414.
Görg, A., Postel, W., Günther, S., & Weser, J. (1985). Improved horizontal two-dimensional electrophoresis with hybrid isoelectric focusing in immobilized pH gradients in the first dimension and laying-on transfer to the second dimension. Electrophoresis 6 , 599-604.
Görg, A., Postel, W., & Günther, S. (1988). Two-dimensional electrophoresis. The current state of two-dimensional electrophoresis with immobilized pH gradients. Electrophoresis 9, 531-546.
Gozzo, F. (2003). Systemic acquired resistance in crop protection: From nature to a chemical approach. Journal of Agricultural and Food Chemistry 51, 4487-4503.
Görlach, J., Volrath, S., KnaufBeiter, G., Hengy, G., Beckhove, U., Kogel, K. H., Oostendorp, M., Staub, T., Ward, E., Kessmann, H., & Ryals, J. (1996). Benzothiadiazole, a novel class of inducers of systemic acquired resistance, activates gene expression and disease resistance in wheat. Plant Cell 8, 629-643.

6 References ________________________________________________________________________________________________________________________________________________________________________________________________________________________________ __
122
Grant, J. J., Yun, B. W., & Loake, G. J. (2000). Oxidative burst and cognate redox signalling reported by luciferase imaging: identification of a signal network that functions independently of ethylene, SA and Me-JA but is dependent on MAPKK activity. Plant Journal 24, 569-582.
Green, R. & Fluhr, R. (1995). UV-B-induced PR-1 accumulation is mediated by active oxygen species. Plant Cell 7, 203-212.
Gregersen, P. L., Thordal-Christensen, H., Forster, H., & Collinge, D. B. (1997). Differential gene transcript accumulation in barley leaf epidermis and mesophyll in response to attack by Blumeria graminis f.sp. hordei (syn. Erysiphe graminis f.sp. hordei). Physiological and Molecular Plant Pathology 51, 85-97.
Groom, Q. J., Torres, M. A., Fordham-Skelton, A. P., Hammond-Kosack, K. E., Robinson, N. J., & Jones, J. D. G. (1996). rbohA, a rice homologue of the mammalian gp91phox respiratory burst oxidase gene. Plant Journal 10, 515-522.
Hahlbrock, K. & Scheel, D. (1989). Physiology and molecular biology of phenylpropanoid metabolism. Annual Review of Plant Physiology and Plant Molecular Biology 40, 347-369.
Hammerschmidt, R. (1999). Phytoalexins: What have we learned after 60 years? Annual Review of Phytopathology 37, 285-306.
Hammond-Kosack, K. E. & Jones, J. D. G. (1996). Resistance gene-dependent plant defense responses. Plant Cell 8, 1773-1791.
Hammond-Kosack, K. & Jones, J. D. G. (2000). Responses to plant pathogens. In Biochemistry and molecular biology of plants, eds. Buchanan, B., Gruissem, W., & Jones, R., pp. 1102-1156. American society of plant physiologists, Rockville, MD.
Harmon, A. C. (1997). The calcium connection. Trends in Plant Science 2, 121-122.
Hartmann, U., Sagasser, M., Mehrtens, F., Stracke, R., & Weisshaar, B. (2005). Differential combinatorial interactions of cis-acting elements recognized by R2R3-MYB, bZIP, and bHLH factors control light-responsive and tissue-specific activation of phenylpropanoid biosynthesis genes. Plant Molecular Biology 57, 155-171.
Hauschild, R. & von Schaewen, A. (2003). Differential regulation of glucose-6-phosphate dehydrogenase isoenzyme activities in potato. Plant Physiology 133, 47-62.
6 References__________________________________________________________________________________________________________________________________________________________________________________________________________________________________
123
Hause, B., Vörös, K., Kogel, K. H., Besser, K., & Wasternack, C. (1999). A jasmonate-responsive lipoxygenase of barley leaves is induced by plant activators but not by pathogens. Journal of Plant Physiology 154, 459-462.
Heath, M. C. (2000a). Nonhost resistance and nonspecific plant defenses. Current Opinion in Plant Biology 3, 315-319.
Heath, M. C. (2000b). Hypersensitive response-related death. Plant Molecular Biology 44, 321-334.
Herrin, D. L. & Schmidt, G. W. (1988). Rapid, reversible staining of northern blots prior to hybridization. BioTechniques 6, 196-200.
Horvath, D. M. & Chua, N. H. (1994). The role of salicylic acid in systemic acquired resistance. Current Opinion in Biotechnology 5, 131-136.
Hunt, M. D., Neuenschwander, U. H., Delaney, T. P., Weymann, K. B., Friedrich, L. B., Lawton, K. A., Steiner, H. Y., & Ryals, J. A. (1996). Recent advances in systemic acquired resistance research - A review. Gene 179, 89-95.
Hückelhoven, R., Fodor, J., Preis, C., & Kogel, K. H. (1999). Hypersensitive cell death and papilla formation in barley attacked by the powdery mildew fungus are associated with hydrogen peroxide but not with salicylic acid accumulation. Plant Physiology 119, 1251-1260.
Hückelhoven, R. & Kogel, K. H. (2003). Reactive oxygen intermediates in plant-microbe interactions: Who is who in powdery mildew resistance? Planta 216, 891-902.
Hwang, B. K. & Heitefuss, R. (1982). Induced resistance of spring barley to Erysiphe graminis f sp hordei. Phytopathologische Zeitschrift-Journal of Phytopathology 103, 41-47.
Iiyama, K., Lam, T. B. T., & Stone, B. A. (1994). Covalent cross-links in the cell-wall. Plant Physiology 104, 315-320.
Inoue, H., Nojima, H., & Okayama, H. (1990). High efficiency transformation of Escherichia coliwith plasmids. Gene 96, 23-28.
Inzé, D. & Van Montagu, M. (1995). Oxidative stress in plants. Current Opinion in Biotechnology 6, 153-158.

6 References ________________________________________________________________________________________________________________________________________________________________________________________________________________________________ __
124
Iriti, M., Rabotti, G., De Ascensa, A., & Faoro, F. (2003). Benzothiadiazole-induced resistance modulates ozone tolerance. Journal of Agricultural and Food Chemistry 51, 4308-4314.
Iseli, B., Armand, S., Boller, T., Neuhaus, J. M., & Henrissat, B. (1996). Plant chitinases use two different hydrolytic mechanisms. FEBS Letters 382, 186-188.
Jabs, T., Tschope, M., Colling, C., Hahlbrock, K., & Scheel, D. (1997). Elicitor-stimulated ion fluxes and O2
- from the oxidative burst are essential components in triggering defense gene activation and phytoalexin synthesis in parsley. Proceedings of the National Academy of Sciences of the United States of America 94, 4800-4805.
Jensen, O. N., Wilm, M., Schevchenko, A., & Mann, M. (1998). Sample preparation methods for mass spectrometric peptide mapping directly from 2-DE gels. In 2-D Proteome analysis protocols, ed. Link, A. J., pp. 513-530. Humana Press, Inc., Totowa, N.J.
Jin, H. L. & Martin, C. (1999). Multifunctionality and diversity within the plant MYB-gene family. Plant Molecular Biology 41, 577-585.
Jørgensen, H. J. L., Lubeck, P. S., Thordal-Christensen, H., de Neergaard, E., & Smedegård-Petersen, V. (1998). Mechanisms of induced resistance in barley against Drechslera teres.Phytopathology 88, 698-707.
Katagiri, F., Thilmony, R., & He, S. Y. (2002). The Arabidopsis thaliana-Pseudomonas syringaeinteraction. The Arabidopsis Book 1-35.
Katz, V. A., Thulke, O. U., & Conrath, U. (1998). A benzothiadiazole primes parsley cells for augmented elicitation of defense responses. Plant Physiology 117, 1333-1339.
Kervinen, T., Peltonen, S., Utriainen, M., Kangasjarvi, J., Teeri, T. H., & Karjalainen, R. (1997). Cloning and characterization of cDNA clones encoding phenylalanine ammnonia-lyase in barley. Plant Science 123, 143-150.
Kessmann, H., Staub, T., Hofmann, C., Maetzke, T., Herzog, J., Ward, E., Uknes, S., & Ryals, J. (1994). Induction of systemic acquired disease resistance in plants by chemicals. Annual Review of Phytopathology 32, 439-459.
Klein, M., Burla, B., & Martinoia, E. (2006). The multidrug resistance-associated protein (MRP/ABCC) subfamily of ATP-binding cassette transporters in plants. FEBS Letters 580, 1112-1122.

6 References__________________________________________________________________________________________________________________________________________________________________________________________________________________________________
125
Klessig, D. F. & Malamy, J. (1994). The salicylic acid signal in plants. Plant Molecular Biology26, 1439-1458.
Kogel, K. H., Beckhove, U., Dreschers, J., Münch, S., & Rommé, Y. (1994). Acquired resistance in barley - the resistance mechanism induced by 2,6-dichloroisonicotinic acid is a phenocopy of a genetically based mechanism governing race-specific powdery mildew resistance. Plant Physiology 106, 1269-1277.
Kogel, K. H., Ortel, B., Jarosch, B., Atzorn, R., Schiffer, R., & Wasternack, C. (1995). Resistance in barley against the powdery mildew fungus (Erysiphe graminis f.sp.hordei) is not associated with enhanced levels of endogenous jasmonates. European Journal of Plant Pathology 101, 319-332.
Kolukisaoglu, U. H., Bovet, L., Klein, M., Eggmann, T., Geisler, M., Wanke, D., Martinoia, E., & Schulz, B. (2002). Family business: the multidrug-resistance related protein (MRP) ABC transporter genes in Arabidopsis thaliana. Planta 216, 107-119.
Kranz, H. D., Denekamp, M., Greco, R., Jin, H., Leyva, A., Meissner, R. C., Petroni, K., Urzainqui, A., Bevan, M., Martin, C., Smeekens, S., Tonelli, C., Paz-Ares, J., & Weisshaar, B. (1998). Towards functional characterisation of the members of the R2R3-MYBgene family from Arabidopsis thaliana. Plant Journal 16, 263-276.
Kurek, I., Aviezer, K., Erel, N., Herman, E., & Breiman, A. (1999). The wheat peptidyl prolyl cis-trans-isomerase FKBP77 is heat induced and developmentally regulated. Plant Physiology119, 693-704.
Laemmli, U. K. (1970). Cleavage of structural proteins during the assembly of the head of bacteriophage T4. Nature 227, 680-685.
Lamb, C. & Dixon, R. A. (1997). The oxidative burst in plant disease resistance. Annual Review of Plant Physiology and Plant Molecular Biology 48, 251-275.
Lawton, K. A., Friedrich, L., Hunt, M., Weymann, K., Delaney, T., Kessmann, H., Staub, T., & Ryals, J. (1996). Benzothiadiazole induces disease resistance in Arabidopsis by activation of the systemic acquired resistance signal transduction pathway. Plant Journal 10, 71-82.
Lee, S. C. & Hwang, B. K. (2005). Induction of some defense-related genes and oxidative burst is required for the establishment of systemic acquired resistance in Capsicum annuum. Planta 221,790-800.

6 References ________________________________________________________________________________________________________________________________________________________________________________________________________________________________ __
126
Levine, A., Tenhaken, R., Dixon, R., & Lamb, C. (1994). H2O2 from the oxidative burst orchestrates the plant hypersensitive disease resistance response. Cell 79, 583-593.
Levine, A., Pennell, R. I., Alvarez, M. E., Palmer, R., & Lamb, C. (1996). Calcium-mediated apoptosis in a plant hypersensitive disease resistance response. Current Biology 6, 427-437.
Linthorst, H. J. M. (1991). Pathogenesis-related proteins of plants. Critical Reviews in Plant Sciences 10, 123-150.
Logemann, E., Parniske, M., & Hahlbrock, K. (1995). Modes of expression and common structural features of the complete phenylalanine ammonia-lyase gene family in parsley. Proceedings of the National Academy of Sciences of the United States of America 92, 5905.
Logemann, E., Tavernaro, A., Schulz, W. G., Somssich, I. E., & Hahlbrock, K. (2000). UV light selectively coinduces supply pathways from primary metabolism and flavonoid secondary product formation in parsley. Proceedings of the National Academy of Sciences of the United States of America 97, 1903-1907.
Lorenzo, O., Piqueras, R., Sanchez-Serrano, J. J., & Solano, R. (2003). Ethylene response factor1 integrates signals from ethylene and jasmonate pathways in plant defense. Plant Cell 15, 165-178.
Low, P. S. & Merida, J. R. (1996). The oxidative burst in plant defense: Function and signal transduction. Physiologia Plantarum 96, 533-542.
Malamy, J., Carr, J. P., Klessig, D. F., & Raskin, I. (1990). Salicylic acid: A likely endogenous signal in the resistance response of tobacco to viral infection. Science 250, 1002-1004.
Maleck, K. & Dietrich, R. A. (1999). Defense on multiple fronts: How do plants cope with diverse enemies? Trends in Plant Science 4, 215-219.
Mehdy, M. C. (1994). Active oxygen species in plant defense against pathogens. Plant Physiology 105, 467-472.
Mellersh, D. G., Foulds, I. V., Higgins, V. J., & Heath, M. C. (2002). H2O2 plays different roles in determining penetration failure in three diverse plant-fungal interactions. Plant Journal 29,257-268.

6 References__________________________________________________________________________________________________________________________________________________________________________________________________________________________________
127
Métraux, J. P., Signer, H., Ryals, J., Ward, E., Wyss-Benz, M., Gaudin, J., Raschdorf, K., Schmid, E., Blum, W., & Inverardi, B. (1990). Increase in salicylic acid at the onset of systemic acquired resistance in cucumber. Science 250, 1004-1006.
Métraux, J. P., Ahl-Goy, P., Staub, T., Speich, J., Steinemann, A., Ryals, J., & Ward, E. (1991). Induced systemic resistance in cucumber in reponse to 2,6-dichloro-isonicotinic acid and pathoogens. In Advances in Molecular Genetics of Plant-Microbe Interactions, eds. Hennecke, H. & Verma, D. P. S., pp. 432-439. Kluwer Academic Press, Dordrecht.
Michalak, M., Mariani, P., & Opas, M. (1998). Calreticulin, a multifunctional Ca2+ binding chaperone of the endoplasmic reticulum. Biochemistry and Cell Biology-Biochimie et Biologie Cellulaire 76, 779-785.
Mittler, R., Feng, X., & Cohen, M. (1998). Post-transcriptional suppression of cytosolic ascorbate peroxidase expression during pathogen-induced programmed cell death in tobacco. Plant Cell10, 461.
Molina, A., Hunt, M. D., & Ryals, J. A. (1998). Impaired fungicide activity in plants blocked in disease resistance signal transduction. Plant Cell 10, 1903-1914.
Molina, A., Görlach, J., Volrath, S., & Ryals, J. (1999). Wheat genes encoding two types of PR-1 proteins are pathogen inducible, but do not respond to activators of systemic acquired resistance. Molecular Plant-Microbe Interactions 12, 53-58.
Morrissey, J. P. & Osbourn, A. E. (1999). Fungal resistance to plant antibiotics as a mechanism of pathogenesis. Microbiology and Molecular Biology Reviews 63, 708-724.
Mou, Z., Fan, W., & Dong, X. (2003). Inducers of plant systemic acquired resistance regulate NPR1 function through redox changes. Cell 113, 935-944.
Münch-Garthoff, S., Neuhaus, J. M., Boller, T., Kemmerling, B., & Kogel, K. H. (1997). Expression of beta-1,3-glucanase and chitinase in healthy, stem-rust-affected and elicitor-treated near-isogenic wheat lines showing Sr5- or Sr24-specified race-specific rust resistance. Planta201, 235-244.
Nakashita, H., Yasuda, M., Nishioka, M., Hasegawa, S., Arai, Y., Uramoto, M., Yoshida, S., & Yamaguchi, I. (2002). Chloroisonicotinamide derivative induces a broad range of disease resistance in rice and tobacco. Plant and Cell Physiology 43, 823-831.

6 References ________________________________________________________________________________________________________________________________________________________________________________________________________________________________ __
128
Nakashita, H., Yasuda, M., Nitta, T., Asami, T., Fujioka, S., Arai, Y., Sekimata, K., Takatsuto, S., Yamaguchi, I., & Yoshida, S. (2003). Brassinosteroid functions in a broad range of disease resistance in tobacco and rice. Plant Journal 33, 887-898.
Nelson, H. E. (2005). Fusarium oxysporum f. sp. radicis-lycopersici can induce systemic resistance in barley against powdery mildew. Journal of Phytopathology 153, 366-370.
Nicholson, R. L. & Hammerschmidt, R. (1992). Phenolic compounds and their role in disease resistance. Annual Review of Phytopathology 30, 369-389.
Niderman, T., Genetet, I., Bruyere, T., Gees, R., Stintzi, A., Legrand, M., Fritig, B., & Mosinger, E. (1995). Pathogenesis-related PR-1 proteins are antifungal (Isolation and characterization of three 14-Kilodalton proteins of tomato and of a basic PR-1 of tobacco with inhibitory activity against Phytophthora infestans). Plant Physiology 108, 17-27.
Niki, T., Mitsuhara, I., Seo, S., Ohtsubo, N., & Ohashi, Y. (1998). Antagonistic effect of salicylic acid and jasmonic acid on the expression of pathogenesis-related (PR) protein genes in wounded mature tobacco leaves. Plant and Cell Physiology 39, 500-507.
Olson, P. D. & Varner, J. E. (1993). Hydrogen peroxide and lignification. Plant Journal 4, 887-892.
Oostendorp, M., Kunz, W., Dietrich, B., & Staub, T. (2001). Induced disease resistance in plants by chemicals. European Journal of Plant Pathology 107, 19-28.
Passardi, F., Longet, D., Penel, C., & Dunand, C. (2004). The class III peroxidase multigenic family in rice and its evolution in land plants. Phytochemistry 65, 1879-1893.
Patra, J. & Panda, B. B. (1998). A comparison of biochemical responses to oxidative and metal stress in seedlings of barley, Hordeum vulgare L. Environmental Pollution 101, 99.
Pawlowski, K., Kunze, R., De Vries, S., & Bisseling, T. (1994). Isolation of total, poly (A) and polysomal RNA from plant tissues. Plant Molecular Biology Manual D5, 1-13.
Pearce, G., Strydom, D., Johnson, S., & Ryan, C. A. (1991). A polypeptide from tomato leaves induces wound-inducible proteinase-inhibitor proteins. Science 253, 895-898.
6 References__________________________________________________________________________________________________________________________________________________________________________________________________________________________________
129
Pelegrini, P. B. & Franco, O. L. (2005). Plant -thionins: Novel insights on the mechanism of action of a multi-functional class of defense proteins. The International Journal of Biochemistry & Cell Biology 37, 2239-2253.
Penninckx, I. A. M. A., Eggermont, K., Terras, F. R. G., Thomma, B. P. H. J., Samblanx, G. W. D., Buchala, A., Métraux, J. P., Manners, J. M., & Broekaert, W. F. (1996). Pathogen-induced systemic activation of a plant defensin gene in Arabidopsis follows a salicylic acid-independent pathway. Plant Cell 8, 2309-2323.
Pieterse, C. M. J., van Wees, S. C. M., Hoffland, E., van Pelt, J. A., & van Loon, L. C. (1996). Systemic resistance in Arabidopsis induced by biocontrol bacteria is independent of salicylic acid accumulation and pathogenesis-related gene expression. Plant Cell 8, 1225-1237.
Pieterse, C. M. J., van Wees, S. C. M., van Pelt, J. A., Knoester, M., Laan, R., Gerrits, N., Weisbeek, P. J., & van Loon, L. C. (1998). A novel signaling pathway controlling induced systemic resistance in Arabidopsis. Plant Cell 10 , 1571-1580.
Pieterse, C. M. J. & van Loon, L. C. (1999). Salicylic acid-independent plant defence pathways. Trends in Plant Science 4, 52-58.
Pieterse, C. M. J., van Wees, S. C. M., Ton, J., van Pelt, J. A., & van Loon, L. C. (2002). Signalling in rhizobacteria-induced systemic resistance in Arabidopsis thaliana. Plant Biology 4,535-544.
Pieterse, C. M. & Van Loon, L. (2004). NPR1: the spider in the web of induced resistance signaling pathways. Current Opinion in Plant Biology 7, 456-464.
Prell, H. H. & Day, P. R. (2001). Plant-fungal pathogen interactions - A classical and molecular view Springer, Berlin.
Ranjeva, R., Thuleau, P., & Schroeder, J. I. (2006). Signal transduction and calcium channels in higher plants. Current Opinion in Biotechnology 4, 172-176.
Raskin, I. (1992). Salicylate, a new plant hormone. Plant Physiology 99, 799-803.
Rasmussen, J. B., Hammerschmidt, R., & Zook, M. N. (1991). Systemic induction of salicylic acid accumulation in cucumber after inoculation with Pseudomonas syringae pv syringae. Plant Physiology 97, 1342-1347.

6 References ________________________________________________________________________________________________________________________________________________________________________________________________________________________________ __
130
Richael, C. & Gilchrist, D. (1999). The hypersensitive response: A case of hold or fold? Physiological and Molecular Plant Pathology 55, 5-12.
Rohde, W., Dorr, S., Salamini, F., & Becker, D. (1991). Structure of a chalcone synthase gene from Hordeum vulgare. Plant Molecular Biology 16, 1103-1106.
Rosahl, S. (1996). Lipoxygenases in plants - their role in development and stress response. Zeitschrift für Naturforschung 51c, 123-138.
Ross, A. F. (1961). Systemic acquired resistance induced by localized virus infections in plants. Virology 14, 340-358.
Ryals, J., Uknes, S., & Ward, E. (1994). Systemic acquired resistance. Plant Physiology 104,1109-1112.
Ryals, J., Lawton, K. A., Delaney, T. P., Friedrich, L., Kessmann, H., Neuenschwander, U., Uknes, S., Vernooij, B., & Weymann, K. (1995). Signal transduction in systemic acquired resistance. Proceedings of the National Academy of Sciences of the United States of America 92,4202-4205.
Ryals, J. A., Neuenschwander, U. H., Willits, M. G., Molina, A., Steiner, H. Y., & Hunt, M. D. (1996). Systemic acquired resistance. Plant Cell 8, 1809-1819.
Ryals, J., Weymann, K., Lawton, K., Friedrich, L., Ellis, D., Steiner, H. Y., Johnson, J., Delaney, T. P., Jesse, T., Vos, P., & Uknes, S. (1997). The Arabidopsis NIM1 protein shows homology to the mammalian transcription factor inhibitor I B. Plant Cell 9, 425-439.
Saito, M., Mukai, Y., Komazaki, T., Oh, K.-B., Nishizawa, Y., Tomiyama, M., Shibuya, N., & Matsuoka, H. (2003). Expression of rice chitinase gene triggered by the direct injection of Ca2+ .Journal of Biotechnology 105, 41-49.
Sambrook, J. & Russell, D. W. (2001). Molecular Cloning: a laboratory manual, 3rd ed. Cold Spring Harbour Laboratory Press, New York.
Scheideler, M., Schlaich, N. L., Fellenberg, K., Beissbarth, T., Hauser, N. C., Vingron, M., Slusarenko, A. J., & Hoheisel, J. D. (2002). Monitoring the switch from housekeeping to pathogen defense metabolism in Arabidopsis thaliana using cDNA Arrays. Journal of Biological Chemistry 277, 10555-10561.
6 References__________________________________________________________________________________________________________________________________________________________________________________________________________________________________
131
Schneider, S. & Ullrich, W. R. (1994). Differential induction of resistance and enhanced enzyme activities in cucumber and tobacco caused by treatment with various abiotic and biotic inducers. Physiological and Molecular Plant Pathology 45, 291.
Schultheiss, H., Dechert, C., Kiraly, L., Fodor, J., Michel, K., Kogel, K. H., & Hückelhoven, R. (2003). Functional assessment of the pathogenesis-related protein PR-1b in barley. Plant Science165, 1275-1280.
Schweizer, P., Jeanguenat, A., Whitacre, D., Métraux, J. P., & Mosinger, E. (1996). Induction of resistance in barley against Erysiphe graminis f sp hordei by free cutin monomers. Physiological and Molecular Plant Pathology 49, 103-120.
Schweizer, P., Buchala, A., & Metraux, J. P. (1997). Gene-expression patterns and levels of jasmonic acid in rice treated with the resistance inducer 2,6-dichloroisonicotinic acid. Plant Physiology 115, 61-70.
Selitrennikoff, C. P. (2001). Antifungal proteins. Applied and Environmental Microbiology 67,2883-2894.
Shigeoka, S., Ishikawa, T., Tamoi, M., Miyagawa, Y., Takeda, T., Yabuta, Y., & Yoshimura, K. (2002). Regulation and function of ascorbate peroxidase isoenzymes. Journal of Experimental Botany 53, 1305-1319.
Silverman, P., Seskar, M., Kanter, D., Schweizer, P., Métraux, J. P., & Raskin, I. (1995). Salicylic acid in rice (Biosynthesis, conjugation, and possible role). Plant Physiology 108, 633-639.
Smith, J. A. & Métraux, J. P. (1991). Pseudomonas syringae pv. syringae induces systemic resistance to Pyricularia oryzae in rice. Physiological and Molecular Plant Pathology 39 , 451-461.
Smith, J. A., Hammerschmidt, R., & Fulbright, D. W. (1991). Rapid induction of systemic resistance in cucumber by Pseudomonas syringae pv. syringae. Physiological and Molecular Plant Pathology 38, 223-235.
Staswick, P. E. (1992). Jasmonate, genes, and fragrant signals. Plant Physiology 99, 804-807.
Sticher, L., Mauch-Mani, B., & Métraux, J. P. (1997). Systemic acquired resistance. Annual Review of Phytopathology 35, 235-270.

6 References ________________________________________________________________________________________________________________________________________________________________________________________________________________________________ __
132
Strobel, N. E. & Ku , J. A. (1995). Chemical and biological inducers of systemic resistance to pathogens protect cucumber and tobacco plants from damage caused by paraquat and cupric chloride. Phytopathology 85, 1306-1310.
Summermatter, K., Sticher, L., & Métraux, J. P. (1995). Systemic responses in Arabidopsis thaliana infected and challenged with Pseudomonas syringae pv syringae. Plant Physiology 108,1379-1385.
Tenhaken, R., Levine, A., Brisson, L. F., Dixon, R. A., & Lamb, C. (1995). Function of the oxidative burst in hypersensitive disease resistance. Proceedings of the National Academy of Sciences of the United States of America 92, 4158-4163.
Thomma, B. P. H. J., Eggermont, K., Penninckx, I. A. M. A., Mauch-Mani, B., Vogelsang, R., Cammue, B. P. A., & Broekaert, W. F. (1998). Separate jasmonate-dependent and salicylate-dependent defense-response pathways in Arabidopsis are essential for resistance to distinct microbial pathogens. Proceedings of the National Academy of Sciences of the United States of America 95, 15107-15111.
Thordal-Christensen, H. & Smedegård-Petersen, V. (1988). Comparison of resistance-inducing abilities of virulent and avirulent races of Erysiphe graminis f.sp. hordei and a race of Erysiphe graminis f.sp. tritici in barley. Plant Pathology 37, 20-27.
Thordal-Christensen, H., Zhang, Z., Wie, Y., & Collinge, D. B. (1997). Subcellular localization of H2O2 in plants: H2O2 accumulation in papillae and hypersensitive response during the barley-powedery mildew interaction. Plant Journal 11, 1187-1194.
Thordal-Christensen, H. (2003). Fresh insights into processes of nonhost resistance. Current Opinion in Plant Biology 6, 351-357.
Ton, J., van Pelt, J. A., van Loon, L. C., & Pieterse, C. M. J. (2002). Differential effectiveness of salicylate-dependent and jasmonate/ethylene-dependent induced resistance in Arabidopsis.Molecular Plant-Microbe Interactions 15, 27-34.
Trewavas, A. (2000). Signal perception and transduction. In Biochemistry and molecular biology of plants, eds. Buchanan, B., Gruissem, W., & Jones, R., pp. 930-987. American society of plant physiologists, Rockville, MD.
Turner, J. G., Ellis, C., & Devoto, A. (2002). The jasmonate signal pathway. Plant Cell 14, S153-S164.
6 References__________________________________________________________________________________________________________________________________________________________________________________________________________________________________
133
Uknes, S., Dincher, S., Friedrich, L., Negrotto, D., Williams, S., Thompson-Taylor, H., Potter, S., Ward, E., & Ryals, J. (1993). Regulation of pathogenesis-related protein-1a gene expression in tobacco. Plant Cell 5, 159-169.
Vallélian-Bindschedler, L., Métraux, J. P., & Schweizer, P. (1998). Salicylic acid accumulation in barley is pathogen specific but not required for defense-gene activation. Molecular Plant-Microbe Interactions 11, 702-705.
van Loon, L. C. (1985). Pathogenesis-related proteins. Plant Molecular Biology 4, 111-116.
van Loon, L. C., Bakker, P. A. H. M., & Pieterse, C. M. J. (1998). Systemic resistance induced by rhizosphere bacteria. Annual Review of Phytopathology 36, 453-483.
van Loon, L. C., Geraats, B. P. J., & Linthorst, H. J. M. (2006). Ethylene as a modulator of disease resistance in plants. Trends in Plant Science 11, 184-191.
van Wees, S. C. M., de Swart, E. A. M., van Pelt, J. A., van Loon, L. C., & Pieterse, C. M. J. (2000). Enhancement of induced disease resistance by simultaneous activation of salicylate- and jasmonate-dependent defense pathways in Arabidopsis thaliana. Proceedings of the National Academy of Sciences of the United States of America 97, 8711-8716.
Vanacker, H., Carver, T. L. W., & Foyer, C. H. (1998). Pathogen-induced changes in the antioxidant status of the apoplast in barley leaves. Plant Physiology 117, 1103-1114.
Vernooij, B., Friedrich, L., Morse, A., Reist, R., Kolditzjawhar, R., Ward, E., Uknes, S., Kessmann, H., & Ryals, J. (1994). Salicylic acid is not the translocated signal responsible for inducing systemic acquired-resistance but is required in signal. Plant Cell 6, 959-965.
von Kietzell, J. & Rudolph, K. (1997). Wheat diseases caused by Pseudomonas syringaepathovars. In The Bacterial Diseases of Wheat: Concepts and Methods of Disease Management. , eds. Duveiller, E., Fucikovsky, L., & Rudolph, K., pp. 49-57. CIMMYT, Mexico.
von Rad, U., Mueller, M. J., & Durner, J. (2005). Evaluation of natural and synthetic stimulants of plant immunity by microarray technology. New Phytologist 165, 191-202.
von Ropenack, E., Parr, A., & Schulze-Lefert, P. (1998). Structural analyses and dynamics of soluble and cell wall-bound phenolics in a broad spectrum resistance to the powdery mildew fungus in barley. Journal of Biological Chemistry 273, 9013-9022.

6 References ________________________________________________________________________________________________________________________________________________________________________________________________________________________________ __
134
Vörös, K., Feussner, I., Kuhn, H., Lee, J., Graner, A., Lobler, M., Parthier, B., & Wasternack, C. (1998). Characterization of a methyljasmonate-inducible lipoxygenase from barley (Hordeum vulgare cv. Salome) leaves. European Journal of Biochemistry 251, 36-44.
Vranová, E., Inze, D., & Van Breusegem, F. (2002). Signal transduction during oxidative stress. Journal of Experimental Botany 53, 1227-1236.
Vucich, V. A. & Gasser, C. S. (1996). Novel structure of a high molecular weight FK506 binding protein from Arabidopsis thaliana. Molecular & General Genetics 252, 510-517.
Walters, D. R. (2000). Polyamines in plant-microbe interactions. Phyiological and Molecular Plant Pathology 57, 137-146.
Walters, D., Cowley, T., & Mitchell, A. (2002). Methyl jasmonate alters polyamine metabolism and induces systemic protection against powdery mildew infection in barley seedlings. Journal of Experimental Botany 53, 747-756.
Walters, D. (2003a). Resistance to plant pathogens: possible roles for free polyamines and polyamine catabolism. New Phytologist 159, 109-115.
Walters, D. R. (2003b). Polyamines and plant disease. Phytochemistry 64, 97-107.
Ward, E. R., Uknes, S. J., Williams, S. C., Dincher, S. S., Wiederhold, D. L., Alexander, D. C., Ahlgoy, P., Métraux, J. P., & Ryals, J. A. (1991). Coordinate gene activity in response to agents that induce systemic acquired resistance. Plant Cell 3, 1085-1094.
Wasternack, C., Atzorn, R., Jarosch, B., & Kogel, K. H. (1994). Induction of a thionin, the jasmonate-induced 6 KDa protein of barley by 2,6-dichloroisonicotinic acid. Journal of Phytopathology-Phytopathologische Zeitschrift 140, 280-284.
Wasternack, C. & Parthier, B. (1997). Jasmonate-signalled plant gene expression. Trends in Plant Science 2, 302-307.
Wasternack, C. & Hause, B. (2002). Jasmonates and octadecanoids: Signals in plant stress responses and development. Progress in Nucleic Acid Research and Molecular Biology, Vol 7272, 165-221.
Weber, H. (2002). Fatty acid-derived signals in plants. Trends in Plant Science 7, 217-224.
6 References__________________________________________________________________________________________________________________________________________________________________________________________________________________________________
135
Wei, Y. D., Deneergaard, E., Thordal-Christensen, H., Collinge, D. B., & Smedegaard-Petersen, V. (1994). Accumulation of a putative guanidine compound in relation to other early defense reactions in epidermal-cells of barley and wheat exhibiting resistance to Erysiphe graminis f sp hordei. Physiological and Molecular Plant Pathology 45, 469-484.
Wei, Y. D., Zhang, Z. G., Andersen, C. H., Schmelzer, E., Gregersen, P. L., Collinge, D. B., Smedegård-Petersen, V., & Thordal-Christensen, H. (1998). An epidermis/papilla-specific oxalate oxidase-like protein in the defence response of barley attacked by the powdery mildew fungus. Plant Molecular Biology 36, 101-112.
Wessel, D. & Flügge, U. I. (1984). A method for the quantitative recovery of protein in dilute solution in the presence of detergents and lipids. Analytical Biochemistry 138, 141-143.
White, R. F. (1979). Acetylsalicylic-acid (aspirin) induces resistance to tobacco mosaic-virus in tobacco. Virology 99, 410-412.
Winkel-Shirley, B. (2001). Flavonoid biosynthesis. A colorful model for genetics, biochemistry, cell biology, and biotechnology. Plant Physiology 126, 485-493.
Winkel, B. S. J. (2004). Metabolic channeling in plants. Annual Review of Plant Biology 55, 85-107.
Wohlgemuth, H. (2002). Untersuchungen zur Rolle von reaktiven Sauerstoffspezies bei Ozon-induziertem Zelltod in Pflanzen. (Investigations into the role of reactive oxygen species in ozone induced cell death in plants.) PhD Thesis. LMU Munich, Germany.
Xu, Y., Chang, P. F. L., Liu, D., Narasimhan, M. L., Raghothama, K. G., Hasegawa, P. M., & Bressan, R. A. (1994). Plant defense genes are synergistically induced by ethylene and methyl jasmonate. Plant Cell 6, 1077-1085.
Young, J. M., Saddler, G. S., Takikawa, Y., De Boer, S. H., Vauterin, L., Gardan, L., Gvozdyak, R. I., & Stead, D. E. (1996). Names of plant pathogenic bacteria 1864-1995. Review of Plant Pathology 75, 721-763.
Zeyen, R. J., Carver, T. L. W., & Lyngkjaer, M. F. (2002). Epidermal cell papillae. In Thepowdery mildews. A comprehensive treatise., eds. Belanger, R. R., Bushnell, W. R., Dik, A. J., & Carver, T. L. W., pp. 107-125. The American Phytopathology Society, St. Paul, Minnesota.
Zhang, Y. L., Fan, W. H., Kinkema, M., Li, X., & Dong, X. N. (1999). Interaction of NPR1 with basic leucine zipper protein transcription factors that bind sequences required for salicylic acid

6 References ________________________________________________________________________________________________________________________________________________________________________________________________________________________________ __
136
induction of the PR-1 gene. Proceedings of the National Academy of Sciences of the United States of America 96, 6523-6528.
Zhang, Z. G., Collinge, D. B., & Thordal-Christensen, H. (1995). Germin-like oxalate oxidase, a H2O2-producing enzyme, accumulates in barley attacked by the powdery mildew fungus. Plant Journal 8, 139-145.
Zhou, F. S., Zhang, Z. G., Gregersen, P. L., Mikkelsen, J. D., de Neergaard, E., Collinge, D. B., & Thordal-Christensen, H. (1998). Molecular characterization of the oxalate oxidase involved in the response of barley to the powdery mildew fungus. Plant Physiology 117, 33-41.
Acknowledgements__________________________________________________________________________________________________________________________________________________________________________________________________________________________________
137
Acknowledgements
To Junior Professor Dr. Ingar Janzik, I don’t even know where to begin thanking you. You have accompanied my scientific research from my diploma up until the finalisation of this thesis. You have always had an open ear for discussions, problems and have been supportive and continuously challenged me. You are everything that anyone could wish for in a supervisor and friend. I would also like to thank Professor Dr. Uli Schurr for giving me the opportunity to work at the Institute Phytosphere (ICG III), Research Centre Jülich and for being my co-referee.
To Angelika Simons thank you for all your help with the official steps and making the bureaucracy so much easier.
For the gift of powdery mildew I would like to thank Dr Isolde Häuser-Hahn from Bayer CropScience also for all our pleasant chats.
I thank Dr Patrick Schweizer from IPK Gatersleben for supplying the MRP2 EST.
Many thanks go to Dr Uta von Rad and Dr Jörg Durner for my introduction to microarray analysis and all those at GSF, especially Elke Mattes, who assisted me during my stay making it an enjoyable and productive experience.
I thank Dr. Markus Piotrowski from Ruhr University Bochum for performing Mass spectrometry analyses.
The “girls” Andrea Neuwohner, Sabine “Mama” Preiskowski, Kathi Klug, Nico Hampe, Patric “Patrice” Carolla, Sven “Svenja” Martin, Imke Koch thank you for such a memorable time. For the friendly atmosphere working in the lab and the office, for laughs and fun when things went well and being there when the bacteria didn’t want to grow again! Nico, thank you for all your help with the never ending RNA isolation and grinding of plant samples.
I would especially like to thank Dr. Shizue Matsubara, Dr. Vicky Temperton, Dr. Anika Wiese and Dr. Jürgen Wildt for listening, discussions and offering helpful friendly advice.
To all the other colleagues in ICG-III you have made the last few years fly by, I thoroughly enjoyed my time at Jülich. Thank you for the pleasant working environment, the good collegial banter and all your help, in particular: Andreas Averresch, Andrés Chavarría-Krauser, Dr. Maja

Acknowledgements __________________________________________________________________________________________________________________________________________________________________________________________________________________________________
138
Christ, Marco Dautzenberg, Grégoire Hummel, Annelie Lorenz, “Kälte Technik”, Professor Dr. Helmut Kniefel, Dr. Peter Minchin, Carola Mohl, Dr. Kerstin Nagel, van-Dy Nguyen, Dr. Gerd Roeb, Beate Uhlig and Dr. Wilfried Wolff.
To Regina Kade, my best friend, I thank you for your friendship and especially for proof-reading this thesis. You are a Star!
Thank you to my family for your love and support.
Last but by no means least to my boyfriend Felix Holtz, none of this would have been possible if you hadn’t been there. Thank you for your never-ending love, support, encouragement, patience and picking me up when another experiment didn’t go according to plan.


Schriften des Forschungszentrums Jülich Reihe Umwelt / Environment
1. Energiemodelle in der Bundesrepublik Deutschland. Stand der Entwicklung IKARUS-Workshop vom 24. bis 25. Januar 1996 herausgegeben von S. Molt, U. Fahl (1997), 292 Seiten ISBN: 978-3-89336-205-9
2. Ausbau erneuerbarer Energiequellen in der Stromwirtschaft Ein Beitrag zum Klimaschutz Workshop am 19. Februar 1997, veranstaltet von der Forschungszentrum Jülich GmbH und der Deutschen Physikalischen Gesellschaft herausgegeben von J.-Fr. Hake, K. Schultze (1997), 138 Seiten ISBN: 978-3-89336-206-6
3. Modellinstrumente für CO2-Minderungsstrategien IKARUS-Workshop vom 14. bis 15. April 1997 herausgegeben von J.-Fr. Hake, P. Markewitz (1997), 284 Seiten ISBN: 978-3-89336-207-3
4. IKARUS-Datenbank - Ein Informationssystem zur technischen, wirtschaftlichen und umweltrelevanten Bewertung von Energietechniken IKARUS. Instrumente für Klimagas-Reduktionsstrategien Abschlußbericht Teilprojekt 2 „Datenbank“ H.-J. Laue, K.-H. Weber, J. W. Tepel (1997), 90 Seiten ISBN: 978-3-89336-214-1
5. Politikszenarien für den KlimaschutzUntersuchungen im Auftrag des Umweltbundesamtes Band 1. Szenarien und Maßnahmen zur Minderung von CO2-Emissionen in Deutschland bis zum Jahre 2005herausgegeben von G. Stein, B. Strobel (1997), 410 Seiten ISBN: 978-3-89336-215-8
6. Politikszenarien für den KlimaschutzUntersuchungen im Auftrag des Umweltbundesamtes Band 2. Emissionsminderungsmaßnahmen für Treibhausgase, ausgenommen energiebedingtes CO2herausgegeben von G. Stein, B. Strobel (1997), 110 Seiten ISBN: 978-3-89336-216-5
7. Modelle für die Analyse energiebedingter KlimagasreduktionsstrategienIKARUS. Instrumente für Klimagas-Reduktionsstrategien Abschlußbericht Teilprojekt 1 „Modelle“ P. Markewitz, R. Heckler, Ch. Holzapfel, W. Kuckshinrichs, D. Martinsen, M. Walbeck, J.-Fr. Hake (1998), VI, 276 Seiten ISBN: 978-3-89336-220-2

Schriften des Forschungszentrums Jülich Reihe Umwelt / Environment
8. Politikszenarien für den KlimaschutzUntersuchungen im Auftrag des Umweltbundesamtes Band 3. Methodik-Leitfaden für die Wirkungsabschätzung von Maßnahmen zur Emissionsminderungherausgegeben von G. Stein, B. Strobel (1998), VIII, 95 Seiten ISBN: 978-3-89336-222-6
9. Horizonte 20006. Wolfgang-Ostwald-Kolloquium der Kolloid-Gesellschaft 3. Nachwuchstage der Kolloid- und Grenzflächenforschung Kurzfassungen der Vorträge und Poster zusammengestellt von F.-H. Haegel, H. Lewandowski, B. Krahl-Urban (1998), 150 Seiten ISBN: 978-3-89336-223-3
10. Windenergieanlagen - Nutzung, Akzeptanz und Entsorgung von M. Kleemann, F. van Erp, R. Kehrbaum (1998), 59 Seiten ISBN: 978-3-89336-224-0
11. Policy Scenarios for Climate Protection Study on Behalf of the Federal Environmental Agency Volume 4. Methodological Guideline for Assessing the Impact of Measures for Emission Mitigationedited by G. Stein, B. Strobel (1998), 103 pages ISBN: 978-3-89336-232-5
12. Der Landschaftswasserhaushalt im Flußeinzugsgebiet der ElbeVerfahren, Datengrundlagen und Bilanzgrößen Analyse von Wasserhaushalt, Verweilzeiten und Grundwassermilieu im Flußeinzugsgebiet der Elbe (Deutscher Teil). Abschlußbericht Teil 1. von R. Kunkel, F. Wendland (1998), 110 Seiten ISBN: 978-3-89336-233-2
13. Das Nitratabbauvermögen im Grundwasser des ElbeeinzugsgebietesAnalyse von Wasserhaushalt, Verweilzeiten und Grundwassermilieu im Flußeinzugsgebiet der Elbe (Deutscher Teil). Abschlußbericht Teil 2. von F. Wendland, R. Kunkel (1999), 166 Seiten ISBN: 978-3-89336-236-3
14. Treibhausgasminderung in Deutschland zwischen nationalen Zielen und internationalen VerpflichtungenIKARUS-Workshop am 27.05.1998, Wissenschaftszentrum Bonn-Bad Godesberg. Proceedings herausgegeben von E. Läge, P. Schaumann, U. Fahl (1999), ii, VI, 146 Seiten ISBN: 978-3-89336-237-0
Schriften des Forschungszentrums Jülich Reihe Umwelt / Environment
15. Satellitenbildauswertung mit künstlichen Neuronalen Netzen zur UmweltüberwachungVergleichende Bewertung konventioneller und Neuronaler Netzwerkalgorithmen und Entwicklung eines integrierten Verfahrens von D. Klaus, M. J. Canty, A. Poth, M. Voß, I. Niemeyer und G. Stein (1999), VI, 160 Seiten ISBN: 978-3-89336-242-4
16. Volatile Organic Compounds in the TroposphereProceedings of the Workshop on Volatile Organic Compounds in the Troposphere held in Jülich (Germany) from 27 – 31 October 1997 edited by R. Koppmann, D. H. Ehhalt (1999), 208 pages ISBN: 978-3-89336-243-1
17. CO2-Reduktion und Beschäftigungseffekte im Wohnungssektor durch das CO2-Minderungsprogramm der KfW Eine modellgestützte Wirkungsanalyse von M. Kleemann, W. Kuckshinrichs, R. Heckler (1999), 29 Seiten ISBN: 978-3-89336-244-8
18. Symposium über die Nutzung der erneuerbaren Energiequellen Sonne und Wind auf Fischereischiffen und in Aquakulturbetrieben Symposium und Podiumsdiskussion, Izmir, Türkiye, 28.-30.05.1998. Konferenzberichtherausgegeben von A. Özdamar, H.-G. Groehn, K. Ülgen (1999), IX, 245 Seiten ISBN: 978-3-89336-247-9
19. Das Weg-, Zeitverhalten des grundwasserbürtigen Abflusses im ElbeeinzugsgebietAnalyse von Wasserhaushalt, Verweilzeiten und Grundwassermilieu im Flußeinzugsgebiet der Elbe (Deutscher Teil). Abschlußbericht Teil 3. von R. Kunkel, F. Wendland (1999), 122 Seiten ISBN: 978-3-89336-249-3
20. Politikszenarien für den KlimaschutzUntersuchungen im Auftrag des Umweltbundesamtes Band 5. Szenarien und Maßnahmen zur Minderung von CO2-Emissionen in Deutschland bis 2020 herausgegeben von G. Stein, B. Strobel (1999), XII, 201 Seiten ISBN: 978-3-89336-251-6
21. Klimaschutz durch energetische Sanierung von Gebäuden. Band 1 von J.-F. Hake, M. Kleemann, G. Kolb (1999), 216 Seiten ISBN: 978-3-89336-252-3
Schriften des Forschungszentrums Jülich Reihe Umwelt / Environment
22. Electroanalysis Abstracts of the 8th International Conference held from 11 to 15 June 2000 at the University of Bonn, Germany edited by H. Emons, P. Ostapczuk (2000), ca. 300 pages ISBN: 978-3-89336-261-5
23. Die Entwicklung des Wärmemarktes für den Gebäudesektor bis 2050 von M. Kleemann, R. Heckler, G. Kolb, M. Hille (2000), II, 94 Seiten ISBN: 978-3-89336-262-2
24. Grundlegende Entwicklungstendenzen im weltweiten Stoffstrom des Primäraluminiumsvon H.-G. Schwarz (2000), XIV, 127 Seiten ISBN: 978-3-89336-264-6
25. Klimawirkungsforschung auf dem Prüfstand Beiträge zur Formulierung eines Förderprogramms des BMBF Tagungsband des Workshop „Klimaforschung“, Jülich, vom 02. bis 03.12.1999 von J.-Fr. Hake, W. Fischer (2000), 150 Seiten ISBN: 978-3-89336-270-7
26. Energiezukunft 2030 Schlüsseltechnologien und Techniklinien Beiträge zum IKARUS-Workshop 2000 am 2./3. Mai 2000 herausgegeben von U. Wagner, G. Stein (2000), 201 Seiten ISBN: 978-3-89336-271-4
27. Der globale Wasserkreislauf und seine Beeinflussung durch den Menschen Möglichkeiten zur Fernerkundungs-Detektion und -Verifikation von D. Klaus und G. Stein (2000), 183 Seiten ISBN: 978-3-89336-274-5
28. Satelliten und nukleare Kontrolle Änderungsdetektion und objektorientierte, wissensbasierte Klassifikation von Multispektralaufnahmen zur Unterstützung der nuklearen Verifikation von I. Niemeyer (2001), XIV, 206 Seiten ISBN: 978-3-89336-281-3
29. Das hydrologische Modellsystem J2000Beschreibung und Anwendung in großen Flußgebieten von P. Krause (2001), XIV, 247 Seiten ISBN: 978-3-89336-283-7
30. Aufwands- und ergebnisrelevante Probleme der Sachbilanzierung von G. Fleischer, J.-Fr. Hake (2002), IV, 64 Blatt ISBN: 978-3-89336-293-6
Schriften des Forschungszentrums Jülich Reihe Umwelt / Environment
31. Nachhaltiges Management metallischer Stoffströme Indikatoren und deren Anwendung Workshop, 27.-28.06.2001 im Congresscentrum Rolduc, Kerkrade (NL) herausgegeben von W. Kuckshinrichs, K.-L. Hüttner (2001), 216 Seiten ISBN: 978-3-89336-296-7
32. Ansätze zur Kopplung von Energie- und Wirtschaftsmodellen zur Bewertung zukünftiger Strategien IKARUS-Workshop am 28. Februar 2002, BMWi, Bonn. Proceedings herausgegeben von S. Briem, U. Fahl (2003), IV, 184 Seiten ISBN: 978-3-89336-321-6
33. TRACE. Tree Rings in Archaeology, Climatology and Ecology Volume 1: Proceedings of the Dendrosymposium 2002, April 11th – 13th 2002, Bonn/Jülich, Germany edited by G. Schleser, M. Winiger, A. Bräuning et al., (2003), 135 pages, many partly coloured illustrations ISBN: 978-3-89336-323-0
34. Klimaschutz und Beschäftigung durch das KfW-Programm zur CO2-Minderung und das KfW-CO2-Gebäudesanierungsprogramm von M. Kleemann, R. Heckler, A. Kraft u. a., (2003), 53 SeitenISBN: 978-3-89336-326-1
35. Klimaschutz und Klimapolitik: Herausforderungen und Chancen Beiträge aus der Forschung herausgegeben von J.-Fr. Hake, K. L. Hüttner (2003), III, 231 Seiten ISBN: 978-3-89336-327-8
36. Umweltschutz und Arbeitsplätze, angestoßen durch die Tätigkeiten des Schornsteinfegerhandwerks Auswertung von Schornsteinfeger-Daten von M. Kleemann, R. Heckler, B. Krüger (2003), VII, 66 Seiten ISBN: 978-3-89336-328-5
37. Die Grundwasserneubildung in Nordrhein-Westfalen von H. Bogena, R. Kunkel, T. Schöbel, H. P. Schrey, F. Wendland (2003), 148 SeitenISBN: 978-3-89336-329-2
38. Dendro-Isotope und Jahrringbreiten als Klimaproxis der letzten 1200 Jahre im Karakorumgebirge/Pakistan von K. S. Treydte (2003), XII, 167 Seiten ISBN: 978-3-89336-330-8
39. Das IKARUS-Projekt: Energietechnische Perspektiven für Deutschland herausgegeben von P. Markewitz, G. Stein (2003), IV, 274 Seiten ISBN: 978-3-89336-333-9
Schriften des Forschungszentrums Jülich Reihe Umwelt / Environment
40. Umweltverhalten von MTBE nach Grundwasserkontamination von V. Linnemann (2003), XIV, 179 Seiten ISBN: 978-3-89336-339-1
41. Climate Change Mitigation and Adaptation: Identifying Options for Developing CountriesProceedings of the Summer School on Climate Change, 7-17 September 2003, Bad Münstereifel, Germany edited by K. L. Hüttner, J.-Fr. Hake, W. Fischer (2003), XVI, 341 pages ISBN: 978-3-89336-341-4
42. Mobilfunk und Gesundheit: Risikobewertung im wissenschaftlichen Dialog von P. M. Wiedemann, H. Schütz, A. T. Thalmann (2003), 111 Seiten ISBN: 978-3-89336-343-8
43. Chemical Ozone Loss in the Arctic Polar Stratosphere: An Analysis of Twelve Years of Satellite Observationsby S. Tilmes (2004), V, 162 pages ISBN: 978-3-89336-347-6
44. TRACE. Tree Rings in Archaeology, Climatology and EcologyVolume 2: Proceedings of the Dendrosymposium 2003, May 1st – 3rd 2003, Utrecht, The Netherlands edited by E. Jansma, A. Bräuning, H. Gärtner, G. Schleser (2004), 174 pages ISBN: 978-3-89336-349-0
45. Vergleichende Risikobewertung: Konzepte, Probleme und Anwendungs-möglichkeitenvon H. Schütz, P. M. Wiedemann, W. Hennings et al. (2004), 231 Seiten ISBN: 978-3-89336-350-6
46. Grundlagen für eine nachhaltige Bewirtschaftung von Grundwasser-ressourcen in der Metropolregion Hamburgvon B. Tetzlaff, R. Kunkel, R. Taugs, F. Wendland (2004), 87 Seiten ISBN: 978-3-89336-352-0
47. Die natürliche, ubiquitär überprägte Grundwasserbeschaffenheit in Deutschland von R. Kunkel, H.-J. Voigt, F. Wendland, S. Hannappel (2004), 207 Seiten ISBN: 978-3-89336-353-7
48. Water and Sustainable Development edited by H. Bogena, J.-Fr. Hake, H. Vereecken (2004), 199 pages ISBN: 978-3-89336-357-5
49. Geo- and Biodynamic Evolution during Late Silurian / Early Devonian Time (Hazro Area, SE Turkey) by O. Kranendonck (2004), XV, 268 pages ISBN: 978-3-89336-359-9
Schriften des Forschungszentrums Jülich Reihe Umwelt / Environment
50. Politikszenarien für den UmweltschutzUntersuchungen im Auftrag des Umweltbundesamtes Langfristszenarien und Handlungsempfehlungen ab 2012 (Politikszenarien III) herausgegeben von P. Markewitz u. H.-J. Ziesing (2004), XVIII, 502 Seiten ISBN: 978-3-89336-370-4
51. Die Sauerstoffisotopenverhältnisse des biogenen Opals lakustriner Sedimente als mögliches Paläothermometer von R. Moschen (2004), XV, 130 Seiten ISBN: 978-3-89336-371-1
52. MOSYRUR: Water balance analysis in the Rur basinvon Heye Bogena, Michael Herbst, Jürgen-Friedrich Hake, Ralf Kunkel, Carsten Montzka, Thomas Pütz, Harry Vereecken, Frank Wendland (2005), 155 Seiten ISBN: 978-3-89336-385-8
53. TRACE. Tree Rings in Archaeology, Climatology and EcologyVolume 3: Proceedings of the Dendrosymposium 2004, April 22nd – 24th 2004, Birmensdorf, Switzerland edited by Holger Gärtner, Jan Esper, Gerhard H. Schleser (2005), 176 pages ISBN: 978-3-89336-386-5
54. Risikobewertung Mobilfunk: Ergebnisse eines wissenschaftlichen Dialogs herausgegeben von P. M. Wiedemann, H. Schütz, A. Spangenberg (2005), ca. 380 Seiten ISBN: 978-3-89336-399-5
55. Comparison of Different Soil Water Extraction Systems for the Prognoses of Solute Transport at the Field Scale using Numerical Simulations, Field and Lysimeter Experiments by L. Weihermüller (2005), ca. 170 pages ISBN: 978-3-89336-402-2
56. Effect of internal leaf structures on gas exchange of leaves by R. Pieruschka (2005), 120 pages ISBN: 978-3-89336-403-9
57. Temporal and Spatial Patterns of Growth and Photosynthesis in Leaves of Dicotyledonous Plants Under Long-Term CO2- and O3-Exposureby M. M. Christ (2005), 125 pages ISBN: 978-3-89336-406-0
58. Öffentliche Kommunikation über Klimawandel und Sturmflutrisiken Bedeutungskonstruktion durch Experten, Journalisten und Bürgervon H. P. Peters, H. Heinrichs (2005), 231 Seiten, CD ISBN: 978-3-89336-415-2

Schriften des Forschungszentrums Jülich Reihe Umwelt / Environment
59. Umsatz verschiedener Ernterückstände in einem Bodensäulenversuchssystem – Einfluss auf die organische Bodensubstanz und den Transport zweier Xenobiotika von N. Drewes (2005), 221 Seiten ISBN: 978-3-89336-417-6
60. Evaluierung der CO2-Minderungsmaßnahmen im Gebäudebereich von M. Kleemann, P. Hansen (2005), 84 Seiten ISBN: 978-3-89336-419-0
61. TRACE. Tree Rings in Archaeology, Climatology and EcologyVolume 4: Proceedings of the Dendrosymposium 2005, April 21st – 23rd 2005, Fribourg, Switzerland edited by Ingo Heinrich, Holger Gärtner, Michel Monbaron, Gerhard Schleser (2006), 313 pages ISBN: 978-3-89336-425-1
62. Diffuse Nitrateinträge in die Grund- und Oberflächengewässer von Rhein und EmsIst-Zustands- und Maßnahmenanalysen von R. Kunkel, F. Wendland (2006), 130 Seiten ISBN: 978-3-89336-437-4
63. Abhängigkeit des Wurzelwachstums vom Lichtregime des Sprosses und deren Modifikation durch Nährstoffe sowie im Gravitropismusvon Kerstin A. Nagel (2006), 119 Seiten ISBN: 978-3-89336-443-5
64. Chancen und Risiken zukünftiger netzgebundener Versorgung Ein multi-kriterielles Verfahren zur Bewertung von Zukunftsszenarien von C. R. Karger, W. Hennings, T. Jäger (2006), 296 Seiten ISBN: 978-3-89336-445-9
65. Die Phosphatbelastung großer Flusseinzugsgebiete aus diffusen und punktuellen Quellen von B. Tetzlaff (2006), 287 Seiten ISBN: 978-3-89336-447-3
66. Fate of veterinary pharmaceuticals in soil: An experimental and numerical study on the mobility, sorption and transformation of sulfadiazine by A. Wehrhan (2006), XXII, 134 pages ISBN: 978-3-89336-448-0
67. Biomacromolecules of Fossil Algae, Spores and Zooclasts from Selected Time Windows of Proterozoic to Mesozoic Age as Revealed by Pyrolysis-Gas Chromatography-Mass Spectrometry – A Biogeochemical Study by S. Dutta (2006), XVI, 139 pages ISBN: 978-3-89336-455-8

Schriften des Forschungszentrums Jülich Reihe Umwelt / Environment
68. Bestimmung der Nicotinverteilung und anderer Stickstoffverbindungen in den Blattgeweben von Nicotiana tabacum unter verschiedenen Wachstumsbedingungen durch Einzelzellanalyse, Kapillarelektrophorese und der Massenspektrometrie von K. Wieland (2006), X, 189 Seiten ISBN: 978-3-89336-458-9
69. Systemic effects of mycorrhization on root and shoot physiology of Lycopersicon esculentumby K. Klug (2006), IV, 105 pagesISBN: 978-3-89336-463-3
70. The impact of nutrient heterogeneity on maize plants by R. Rist (2006), XII, 74 pagesISBN: 978-3-89336-464-0
71. Optimization of Tracer Experiments to Characterize Transport Properties in Heterogeneous Aquifers Using Non-Invasive Measurement Techniques by K. Müller (2006), XVII, 103 pages ISBN: 978-3-89336-465-7
72. Measurement of Peroxy Radicals using Laser-Induced Fluorescence Techniqueby H. Fuchs (2006), VI, 140 pages ISBN: 978-3-89336-467-1
73. Biological and chemical induction of systemic resistance in the barley powdery mildew pathosystem by K. L. Morrissey (2007), 138 pagesISBN: 978-3-89336-475-6


UmweltEnvironment
Band/Volume 73ISBN 978-3-89336-475-6
�������������� �������������������� �����������