biological networks lectures 6-7 : february 02, 2010 graph algorithms review global network...
TRANSCRIPT

Biological Networks
Lectures 6-7 : February 02, 2010
Graph Algorithms ReviewGlobal Network PropertiesLocal Network Properties
1

Graph Algorithms Review
Readings: Chapter 2 of “Analysis of biological networks” by Junker and Björn
You will be responsible for knowing the following about the following 3 algorithms:
• For un-weighted graphs: – Breadth-First Search (BFS)
• For weighted graphs:– Dijkstra’s algorithm– Floyd-Warshal algorithm
2

Graph Algorithms Review
• Breadth-First Search (BFS)– Input: un-weighted graph G(V,E), start node s– Ouput:
• Shortest paths and distances from s to all other nodes of G
• Connected components of G
– Running time: linear, O(|V|+|E|)
3
For un-weighted graphs:

– Order of exploration of G with BFS:1. Start from the start node s2. Explore the neighbors of s3. Explore the neighbors of neighbors of s from the first
explored neighbor to the last one4. …
– Example :
4
Graph Algorithms Review

• Dijkstra’s algorithm– Input: weighted graph G(V,E), start node s– Output: shortest paths and distances from s to all other
nodes of G– Running time: O(|V| log|V|+|E|)
• Floyd-Warshal Algorithm– Input: weighted graph G(V,E)– Output: Matrix of distances and shortest paths between
all pairs of nodes of G– Running time: O(|V|3)
5
Graph Algorithms Review
For weighted graphs:

Network Comparisons:Properties of Large Networks
• Large network comparison is computationally hard due to NP-completeness of the underlying subgraph isomorphism problem.
• Thus, network comparisons rely on easily computable heuristics (approximate solutions), called “network properties”
• Network properties can roughly be divided in two categories:
1. Global network properties: give an overall view of the network, but might not be detailed enough to capture complex topological characteristics of large networks
2. Local network properties: more detailed network descriptors which usually encompass larger number of constraints, thus reducing degrees of freedom in which the networks being compared can vary.
6
1. Global Network Properties
Readings: Chapter 3 of “Analysis of biological networks” by Junker and Björn
• Global Network Properties:1) Degree distribution2) Average clustering coefficient3) Clustering spectrum4) Average Diameter5) Spectrum of shortest path lengths6) Centralities
7

1) Degree Distribution
Definitions: • degree of a node is the number of edges
incident to the node.• Average degree of a network: average of the
degrees over all nodes in the network. However, it might not be representative, since the distribution of degrees might be skewed.
8
1. Global Network Properties

• Degree distribution:Let P(k) be the percentage of nodes of degree k in
the network. The degree distribution is the distribution of P(k) over all k.
P(k) can be understood as the probability that a node has degree k.
9
1. Global Network Properties
1) Degree Distribution

• Example:
(log-log plot)
Here P(k) ~ k-γ , where often 2 ≤ γ < 3. This is a power-law, heavy-tailed distribution. Networks with power-law degree distributions are called scale-free networks. In them, most
of the nodes are of low degree, but there is a small number of highly-linked nodes (nodes of high degree) called “hubs.”
10
1. Global Network Properties1) Degree Distribution

• Another Example:
average degree is meaningful
Here P(k) is a Poisson distribution.11
1. Global Network Properties1) Degree Distribution

• However: degree distribution (and global properties in general) are weak predictors of network structure.
• Illustration:
G1 and G2 are of the same size (i.e.,|G1|=|G2| -- they have the same number of nodes and edges) and they have same degree distribution, but G1 and G2 have very different topologies (i.e., graph stucture). 12
1. Global Network Properties1) Degree Distribution

G
Examples:

• Definition: clustering coefficient Cv of a node v:Cv = |E(N(v))|/(max possible number of edges in N(v))
Where N(v) the neighborhood of v, i.e., all nodes adjacent to v
Cv can be viewed as the probability that two neighbors of v are connected.
Thus 0 ≤ Cv ≤ 1.
By definition: For vertex v of degree 0 or 1, by definition Cv=0.
14
1. Global Network Properties2) Average Clustering Coefficient

• Example:
|N(v)|= 4, since there are 4 nodes in N(v), i.e., N(v)= {1, 2, 3, 4} |E(N(v))|= 3, since there are 3 edges between nodes in N(v) Max possible number of edges between nodes in N(v) is: choose(4,2) = 6. Therefore Cv= 3/6 = 1/2
15
1. Global Network Properties2) Average Clustering Coefficient
• Definition: average clustering coefficient of a network is the average Cv over all the nodes v V∈ .
16
1. Global Network Properties2) Average Clustering Coefficient

• Definition: clustering spectrum, C(k), is the distribution of the average clustering coefficients of all nodes of degree k in the network, over all k.
Example:
17
1. Global Network Properties3) Clustering Spectrum

• Cv – Clustering coefficient of node vCA= 1/1 = 1CB = 1/3 = 0.33CC = 0 CD = 2/10 = 0.2 …
• C = Avg. clust. coefficient of the whole network = avg {Cv over all nodes v of G}
• C(k) – Avg. clust. coefficient of all nodesof degree kE.g.: C(2) = (CA + CC)/2 = (1+0)/2 = 0.5
=> Clustering spectrum
E.g. (not for G)
2) And 3) Clustering Coefficient and Spectrum
G

19
• Definition: the distance between two nodes is the smallest number of links that have to be traversed to get from one node to the other.
• Definition: the shortest path is the path that achieves that distance.
• Definition: the average network diameter is the average of shortest path lengths over all pairs of nodes in a network.
1. Global Network Properties4) Average Diameter

• Definition:Let S(d) be the percentage of node pairs that are at distance d. The spectrum of shortest path lengths is the distribution of S(d) over d.Example:
20
1. Global Network Properties5) Spectrum of shortest path lengths

4) and 5) Average Diameter and Spectrum of Shortest Path Lengths
G
u
v
E.g.(not for G)
• Distance between a pair of nodes u and v:
Du,v = min {length of all paths between u and v} = min {3,4,3,2} = 2 = dist(u,v)
• Average diameter of the whole network:
D = avg {Du,v for all pairs of nodes {u,v} in G}
• Spectrum of the shortest path lengths

(Readings: Chapter 3 of “Analysis of biological networks”-Junker,Björn)
• Definitions: – Centrality quantifies the topological importance of a node
(edge) in a network.There are many different types of centralities:
1. degree centrality Cd: nodes with a large number of neighbors (i.e., edges) have high centrality. Therefore we have Cd(v)=deg(v)
Example of a use of degree centrality:
In PPI networks, nodes with high degree centrality are considered to be “biologically important.” We will learn later in the course what this means.
22
1. Global Network Properties6) Node Centralities
• Definitions: – Centrality quantifies the topological importance of a node (edge) in a network.
There are many different types of centralities:
1. Degree centrality, Cd(v): nodes with a large number of neighbors (i.e., edges) have high centrality. Therefore, we have Cd(v)=deg(v).
2. Closeness centrality, Cc(v): nodes with short paths to all other nodes in the network have high closeness centrality
Cc(v)=
23
1
dist(u,v)uV
1. Global Network Properties6) Node Centralities

24
• Definitions: – Centrality quantifies the topological importance of a node (edge) in a network.
There are many different types of centralities:
3. Betweenness centrality, Cb(v): Nodes (or edges) which occur in many of the shortest paths have high betweeness centrality. Cb(v)=
The above summation means that there is a sum on the top and on the bottom of the fraction.
Above:σst = the number of shortest paths from s to t (they may or not pass
through node v)σst(v) = the number of shortest paths from s to t that pass through
v. 24
1. Global Network Properties6) Node Centralities
st(v)stst
svvt

2525
• Definitions: – Centrality quantifies the topological importance of a node (edge) in a network.
There are many different types of centralities:
4. Eccentricity centrality, Ce(v):
Eccentricity of a node v is defined as ecc(v) = So it is the maximum shortest path length from node u to all other nodes v in V.
Eccentricity centrality of a node v:Ce(v) = 1/Ecc(v)Thus, central nodes have higher Ce since they have lower
ecc.
There exist many other definitions of node centralities.25
1. Global Network Properties6) Node Centralities
maxvVdist(u,v)

• Example:
26
Degree Closeness Betweeness
From highest D F, G H
F, G D, H F, G
to A, B A, B I
C, E, H C, E D
lowest I I A, B
J J C, D, J
1. Global Network Properties6) Node Centralities

• You need to know how to compute these centralities (and all other network properties) by hand on small networks.
• For large real-world networks, you could use software, e.g., CentiBiN.– http://centibin.ipk-gatersleben.de/
27
1. Global Network Properties6) Node Centralities

28
Network Properties
2. Local Network Properties(Chapter 5 of the course textbook “Analysis of Biological Networks” by Junker and Schreiber)
1) Network motifs2) Graphlets
Two network comparison measures based on them: 2.1) Relative Graphlet Frequence Distance between two
networks 2.2) Graphlet Degree Distribution Agreement between two
networks
• Definition: A network motif is a small over-represented partial subgraph of real network.
Here, over-represented means that it is over-represented when compared to networks coming from a random graph model.
Problem: What is expected at random, i.e., which network “null model” to use to identify motifs?
29
2. Local Network Properties1) Network Motifs
30
2. Local Network Properties1) Network MotifsExample of a random graph model:• Erdos-Renyi (ER) random graphs – Definition:
– A graph on n nodes (for some positive integer n)– Edges are added between pairs of nodes uniformly at
random with same probability p
ER graphs usually have a small number of dense (in term of number of edges) subgraphsThere will be no regions in the network that have
large density of edges. Why?

Example:
If motifs are identified when comparing the data with ER model networks, every dense subgraph would come up as a motif because they do not exist in our ER model networks.
31
2. Local Network Properties1) Network Motifs

• Motifs:– May provide insight into both the structure and function of the
whole network.– Can potentially define universal classes of networks.
Networks of similar type share the same motifs (e.g., all networks that tranmit information, but in different domains) – see examples in next class Motifs could reflect the evolutionary processes that generated these
network classes
• Issue: network null model used to define motifs• Another issue: partial versus induced subgraphs
Motifs are partial subgraphs!
32
2. Local Network Properties1) Network Motifs
33
2. Local Network Properties1) Network Motifs
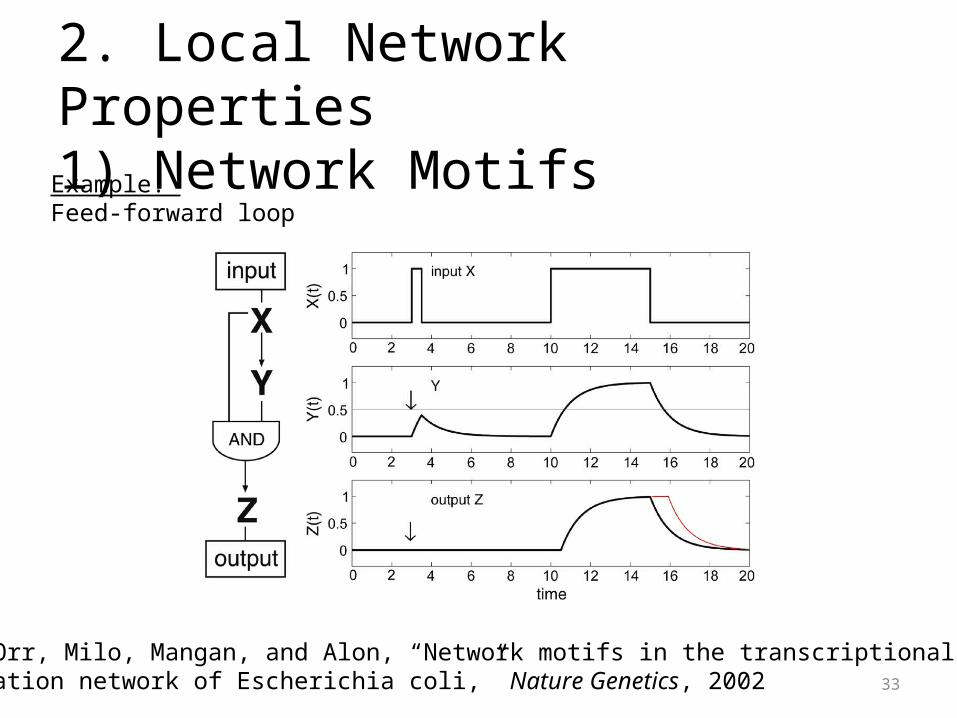
Example: Feed-forward loop
Shen-Orr, Milo, Mangan, and Alon, “Network motifs in the transcriptional regulation network of Escherichia coli,” Nature Genetics, 2002

• Definition: Graphlets are small connected induced non-isomorphic subgraphs of a large network.
They do not need to be over-represented no issues with the null model.
34
2. Local Network Properties2) Graphlets

• Graphlet frequencies: count the occurrences of all small (2 to 5 node) graphlets in a network.
• Thus, we can compare these frequencies between two networks – this is Relative Graphlet Frequency Distance (RGF-distance) measure of structural similarity between two networks.
35
2. Local Network Properties2) Graphlets

36
2. Local Network Properties2) Graphlets
• Graphlet Degree Distribution Agreement (GDD-agreement):• Generalization of the degree distribution to a spectrum of GDD distributions• Degree distribution measures: the number of nodes touching k edges for each value of k • An edge is the only 2-node graphlet (graphlet denoted by G0 in the examples below)• There is nothing special about an edge• Why not count how many triangles, squares,... a node touches?•“GDD signature” of a node – how many times a node touches each of the graphlets at a given orbit
(see examples in next class)