biological networksbiological networks construction and...
TRANSCRIPT

Biological networksBiological networks
Construction andAnalysis
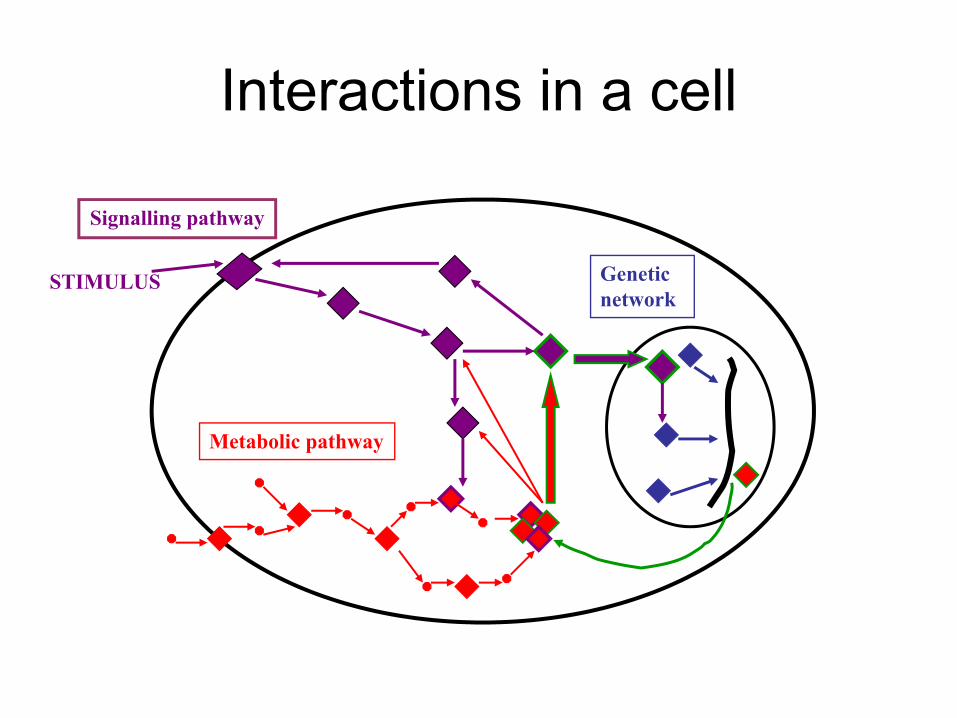
Interactions in a cellInteractions in a cell
Signalling pathway
Geneticnetwork
STIMULUS
Metabolic pathway

Interactions Pathways NetworkInteractions Pathways Network
• A collection of interactions defines aA collection of interactions defines a network
• Pathways are subsets of networks• Pathways are subsets of networks– All pathways are networks of interactions,
however not all networks are pathways!however not all networks are pathways!– Difference in the level of annotation or
understandingunderstanding• We can define a pathway as a biological
network that relates to a knownnetwork that relates to a knownphysiological process or complete function

A biological networkA biological network
The network around the BRCA1gene in human.The snapshot is from the STRINGDatabase at string.embl.de

Types of protein interactions
• Metabolic and signaling (genetic) pathwaysMetabolic and signaling (genetic) pathways• Morphogenic pathways in which groups of
proteins participate in the same cellularproteins participate in the same cellular function during a developmental processSt t l l d l l• Structural complexes and molecular machines in which numerous proteins are b ht t thbrought together

Signaling pathwaysSignaling pathways

Morphogenic pathwaysMorphogenic pathways

Structural complexes and l l himolecular machines
ATPaseATPase

Experimental methodsExperimental methods
• Tagged Fusion ProteinsTagged Fusion Proteins• Coimmunoprecipitation• Yeast Two hybrid• Yeast Two-hybrid• Biacore
At i F Mi (AFM)• Atomic Force Microscopy (AFM)• Fluorescence Resonace Energy Trasfer
(FRET)(FRET)• X-ray Diffraction

Where is the data?
R lt f hi h th h t i t• Results of high-throughput experiments are usually collected in databasesWh t b t l th h t i t ?• What about low-throughput experiments?

The literatureThe literature
• Thousands of small scale low throughputThousands of small scale, low throughput experiments performed in labs worldwide for yearsfor years– The results are published as articles
So we can collect this information to get• So we can collect this information to get individual data about pairs of proteins/genesproteins/genes
• What is the difficulty?

Text miningText mining
• Hundreds of thousands of unstructuredHundreds of thousands of unstructured free text articles should be processed automatically to extract this informationy
• Challenges– Non standard naming of genes, proteins, g g , p ,
processes– Understanding natural language
• Concerns– Accuracy?– Coverage?

BioCreative ChallengeBioCreative Challenge
• A competition of algorithms for text miningA competition of algorithms for text mining• Problems
Id tif h th ti l t i th– Identify whether an article contains the relevant information or notExtract the information– Extract the information

What else can we do?What else can we do?• Computational prediction of relationships p p p
between pairs of genes/proteins• Data sources for prediction
S d t– Sequence data– Genome data:
• Interologs• Existence of genes in multiple organisms• Existence of genes in multiple organisms• Locations of the genes
– Bio-image dataGene Ontology annotations– Gene Ontology annotations
– Microarray experiments– Sub-cellular localization data

Probabilistic network approachProbabilistic network approach
• Each “interaction” link between twoEach interaction link between two proteins has a posterior probability of existence based on the quality ofexistence, based on the quality of supporting evidence.

Computing the posteriorComputing the posterior
• Using Bayes’ rule and with naïve BayesUsing Bayes rule and with naïve Bayes assumption that different evidence types are independent of one another given theare independent of one another given the truth about interaction:
∏=
=⋅
=
== 1
)1()1|()|1(
T
ii ypyzp
yp z
∑ ∏∈ =
=⋅
=
==
1,0 1
)()|()|1(
j
T
ii jypjyzp
yp z
Asthana et al. Genome Research, 13:1170:1174 (2004)

Bayesian Network approachBayesian Network approach
• Jansen et al (2003) Science Lee et alJansen et al. (2003) Science. Lee et al.(2004) Science.
• Combine individual probabilities of• Combine individual probabilities of likelihood computed for each data source into a single likelihood (or probability)into a single likelihood (or probability)
• Naïve Bayes:– Assume independence of data sources– Combine likelihoods using simple
multiplication

Bayesian Network approachBayesian Network approach
Jansen et al. (2003) Science

Bayesian ApproachBayesian Approach
• A scalar score for a pair of genes is computedA scalar score for a pair of genes is computed separately for each information source.
• Using gold positives (known interacting pairs) g g p ( g p )and gold negatives (known non-interacting pairs) interaction likelihoods for each information source is computed.
• The product of likelihoods can be used to bi l i l i f icombine multiple information sources
– Assumption: A score from a source is independent from a score from another sourcefrom a score from another source.

Naïve Bayes vs. Fully Connected BBayes
• In Naïve Bayes approach we can find theIn Naïve Bayes approach we can find the correlation of each data source with the gold standards separately and thengold standards separately and then compute the combined likelihood of a protein pair by just multiplying theprotein pair by just multiplying the individual likelihoods.

Computing the likelihoodsComputing the likelihoods
• Partition the pair scores of an informationPartition the pair scores of an information source into bins and provide likelihoods for score-rangesscore ranges
• E.g. Using the microarray information source and using Pearson correlation forsource and using Pearson correlation for scoring protein pairs you may get scores between 1 and 1 You want to know whatbetween -1 and 1. You want to know what is the likelihood of interaction for a protein pair that gets a Pearson correlation of 0 6pair that gets a Pearson correlation of 0.6.

Partitioning the scoresPartitioning the scores
pearson corr likelihoodpearson corr. likelihood(0.8,1.0](0.6,0.8](0.4,0.6](0.2,0.4](0 0 0 2](0.0,0.2](-0.2,0.0](-0.4,-0.2]( , ](-0.6,-0.4](-0.8,-0.6][-1.0,-0.8]

Computing the likelihoodComputing the likelihood
• P(Score | Interaction) / P (Interaction)P(Score | Interaction) / P (Interaction)L = ---------------------------------------------------
P(S | I t ti ) / P ( I t ti )P(Score | ~Interaction) / P (~Interaction)
• Example

ExampleExample
• Calculating the likelihood ratio forCalculating the likelihood ratio for expression dataset.

ExampleExample• Calculating the likelihood ratio for the
Bi l i l P (GO) d t tBiological Process (GO) dataset.
• Given a pair of proteins with microarray Pearson correlation 0 65 and GOPearson correlation 0.65 and GO biological process similarity 2500, what is the likelihood of interaction?the likelihood of interaction?
67.4*3.0 = 202.2

Protein interaction networksProtein interaction networks
• Large scale (genome wide networks):• Large scale (genome wide networks):ProNet (Asthana et al.)
YeastYeast3,112 nodes12,594 edges

Analyzing Protein NetworksAnalyzing Protein Networks
• Predict members of a partially known protein complex/pathway.
• Infer individual genes’ functions on the basis of linked neighbors.
• Find strongly connected components, clusters to reveal unknown complexes.clusters to reveal unknown complexes.
• Find the best interaction path between a source and a target genesource and a target gene.

Simple analysis
The network can be thresholdedto reveal clusters of interactinginteracting proteins

Advanced AnalysisAdvanced Analysis
• Clustering algorithmsClustering algorithms– MCL (Markov CLustering)– RNSC (Restricted Neighborhood Search Clustering)RNSC (Restricted Neighborhood Search Clustering)– SPC (Super Paramagnetic Clustering)– MCODE (Molecular COmplex DEtection)– and many more– “Evaluation of clustering algorithms for
protein-protein interaction networks,” by Brohee and van Helden in BMC Bioinformatics November 2006Bioinformatics, November 2006.

Markov Cluster AlgorithmMarkov Cluster Algorithm
• Simulates a flow on the graphSimulates a flow on the graph.• Calculates successive powers of the
adjacency matrixadjacency matrix• Parameters
– One parameter: inflation parameter• The process partitions the graph (i.e., no
overlapping clusters)• The inflation parameter influence the p
number of clusters generated

Restricted Neighborhood Search ClusteringRestricted Neighborhood Search Clustering
• Starts with an initial random clusteringStarts with an initial random clustering• Tries to minimize a cost function by
iteratively moving vertices betweeniteratively moving vertices between neighboring clusters.P t• Parameters:– Number of iterations– Diversification frequency– …. and 5 other parameters

Super Paramagnetic ClusteringSuper Paramagnetic Clustering
• Hierarchical algorithm inspired from anHierarchical algorithm inspired from an analogy with the physical properties of a ferromagnetic model subject to fluctuationferromagnetic model subject to fluctuation at nonzero temperature.
• Parameters:• Parameters:– Number of nearest neighbors
T t– Temperature

MCODEMCODE• Weight each vertex by its local neighborhood
d it ( i difi d i f l t idensity (using a modified version of clustering coefficient using k-cores)St ti f th t i ht d t i l d• Starting from the top weighted vertex, include neighborhood vertices with similar weights to the clustercluster
• Post-process to remove or add new vertices• Continue with the next highest weight vertex in• Continue with the next highest weight vertex in
the network• May provide overlapping clustersMay provide overlapping clusters

Vertex weightingVertex weighting
• Clustering coefficientClustering coefficient
2e)1(
2−
=ii
ii dd
eCC
where ei is the number of edges between the
)( ii
where ei is the number of edges between the neighbors of node i and di is the number of neighbors of node ineighbors of node i.

k-corek core
• A part of a graph where every node isA part of a graph where every node is connected to other nodes with at least k edges (k=0 1 2 3 )edges (k 0,1,2,3...)
• Finding a k-core in a graph proceeds by progressively removing vertices of degree < k until all remaining vertices are connected to each other by degree k or more. Complexity: O(n2). The highest k-core is found by trying to find k-cores from one up until the highesttrying to find k cores from one up until the highest degree in the neighborhood graph. Overall complexity: O(n3)

k-core examplek core example

Core-clustering CoefficientCore clustering Coefficient
• Product of the clustering coefficient of theProduct of the clustering coefficient of the highest k-core in the neighborhood of a vertex and kvertex and k.

Features of the algorithmsFeatures of the algorithms