biological treatment system using coconut … treatment system using coconut... · di sarawak,...
TRANSCRIPT

BIOLOGICAL TREATMENT SYSTEM USING COCONUT WASTE AS SUPPORT MEDIA FOR TREATING GREY WATER
Sabrina Ummi
Master of Engineering 2011

PUS..I KlUdmat Maklum l Ufl1l1' UNlVERSfll ~ IA SARAWAK
BIOLOGICAL TREATMENT SYSTEM USING COCONUT WASTE AS SUPPORT MEDIA FOR TREATING GREY WATER
P.KHIDMAT MAKLUMAT AKADEMIK
11II11111 fli'~illlllllill 1000246325
SABRINA UMMI
A thesis submitted
in fulfillment of requirements for the degree of Master of Engineering
Faculty of Engineering
UNIVERSITI MALAYSIA SARA W AK 2011
r Ii 1/

DECLARATION
I would like to declare that this dissertation is my original writing, except the data, notes and
facts that already stated with its sources and origins.
SABRINA UMMI
83021 }-13-5144
Vedicatedt~·
my tate belOved:Mollie?; :J# 'Ummi Suliziman
11
ACKNOWLEDGEMENTS
I would like to thank my supervisor, Dr. Onni Suhaiza Selaman and Prof. Salim Said for
their constant support and much needed direction, also their perseverance with some of my
wild ideas and running hypotheses; some of which were a little pre-emptive. From this, I am
beginning to appreciate how a structured, directed and enthusiastic approach to projects which
have many benefits, including success. There are many walls encountered in research,
whereby without perseverance and lateral thinking some of them would never be overcome.
I would also like to thank Mr. Jethro Henry Adam, Prof Law Puong Ling and Dr.
Ivy Tan for their help throughout this project his assistance and input on the project and the
offers of help. I also would like to thanks all the lab assistances, their laboratory skills which
saved me much needed time on several occasions and all my fellow friends specially my
housemates Ms. Sharifah Norizan Wan Zain and Ms. Siti Hawa Sulaiman for giving
additional supports, helps and ideas for problem solving whenever I needed it.
A lot of thanks also go to government agencies that had provided a lot of information
regarding on wastewater management in Kuching City, especially the Natural Resources and
Environmental Board (NREB) and Sarawak Sewerage Department (SSD). A big thank to
Research and Innovation Management Center, UNIMAS for the financial support on this
project and Zamalah, UNIMAS for providing the scholarship.
III
Finally, I would like to thank my late beloved mother, Puan Hj. Ummi Sulaiman pass
away on 14 June 2011, and fathers Mr. Jubli Chin and Mr. Basri Sirat for their eternal
support and understanding of my goals and aspirations. It is from them that I have drawn all of
my determination and perseverance as there have been many occasions where I questioned
them on my direction and purpose. Without them, I would not have been able to complete
much of what I have done and become who I am. Mom, even though you not around me
anymore, your spirit and courage always be with me forever. RIP.
iv
ABSTRACT
In Sarawak, rivers are an important source of potable water. Nowadays, a number of
environmental issues have been encountered in relation to land used in Sarawak. The issue
mainly concern of wastewater discharges and management. Direct discharge of wastewater
and low performance wastewater treatment facilities leads to deterioration of river water
quality. This matter not only spoils the valuable resources but also will lead to public health
problem.
This research was carried out to develop an individual wastewater treatment system in
order to minimize the pollution from domestic wastewater into the rivers. Water quality trends
of Sarawak River and its tributaries and wastewater characteristic were identified and studied
at the beginning of the researchJ These preliminary results led to development of a biological
wastewater treatment system with focus on domestic wastewater before discharge into the
water inland. Since grey water is generated directly from every household and food outlets in
just about equal volume every day, it presents a constant resource and it is quite a waste to be
thrown away. Proper treatment of grey water at each individual premises is one way reduce
point source of pollutant into the rivers. Such treatment facilities can also open up the potential
for reuse of non-consumptive proposes.
A prototype of Biological Domestic Wastewater Treatment System (BWTS) has been
developed to determine its potential in treating grey water. The proposed system consists of
five unit operations. They are feed tank, primary sedimentation tank, vertical fixed film
v
bioreactor, secondary sedimentation tank and storage tank. A coconut waste was used as the
support media in the bioreactor in order to minimize other sources of solid waste. The seed
consortium was prepared by aerating actual wastewater for a few days until reasonable
microbial growth population achieved (about 600nm optical density). The potential of the
designed treatment system to treat domestic wastewater was evaluated based on its operating
flow rates, concentration of wastewater, and volume of support media. Synthetic wastewater
was used during evaluation.
Treatment process using coconut fiber as support media in bioreactor showed
significant removal of TSS (81.88%), TS (70.83%), COD (93.46%) and BOD (82.03%). The
contribution of coir pith to TSS, TS, COD and BOD removal efficiencies reached 95.92%,
71.88%, 99.86%, and 57.14%, respectively. The removal percentages show that coconut waste
has a capability to be a biofilter. This research also revealed that quality of effluent from the
treatment system decreases as the operating flow rates and concentration of influent increase.
While if the volume of support media inside bioreactor reduces, the effluent quality also drop
off. Biological treatment system has been demonstrated capable to treat synthetic domestic
wastewater.
From the experimental results and observation, the Biological Domestic Wastewater
Treatment System (BWTS) has a possibility to become an alternative in river water quality
restoration. It also can achieve high possible environmental improvement for the least possible
amount of physical and financial resources.
VI
ABSTRAK
Di Sarawak, sungai adalah satu sumber penting untuk bekalan air minuman. Kini beberapa
isu pencemaran alam sekitar berkaitan dengan aktiviti-aktiviti yang dijalankan oleh pihak
tertentu telah limbul di Sarawak. Isu yang membimbangkan adalah pembuangan terus air
kumbahan. Pembuangan langsung air kumbahan tanpa rawatan ataupun aliran keluar air
kumbahan daripada sistem rawatan yang kurang berkesan membawa kepada kemerosotan
kua/iti air sungai. Perkara ini bukan sahaja merosakkan sumber berharga tetapi juga akan
menjurus kepada masalah kesihatan awam.
Penyelidikan ini dijalankan membangunkan sistem rawatan air sisa secara individu
untuk meminimumkan pencemaran dari air sisa domestik ke dalam sungai-sungai tersebut.
Kualiti air Sungai Sarawak dan cawangannya dan sifat-sifat air sisa telah dikenal pasti dan
dipelajari diawal penyelidikan. Keputusan pra-penyelidikan ini menjurus kepada
pembangunan sistem rawatan air sisa secara biologi yang boleh merawat air sisa domestik
sebelum dilepaskan ke kawasa tadahan air. Oleh kerana air kumbahan domestik dilepaskan
secara lang sung dari setiap rumah penduduk dan kedai-kedai makan dalam jumlah yang agak
sama setiap hari, ia merupakan satu sumber malar dan satu pembaziran jika dibuang begitu
sahaja. Proses rawatan air domestik yang baik di setiap premis masing-masing adalah
merupakan satu cara untuk mengurangkan sumber pence mar ke dalam sungai-sungai.
Kemudahan rawatan sedemikian boleh juga membuka potensi untuk penggunaan
semula air yang telah dirawat untuk kegunaan aktiviti luaran rumah. Satu prototaip Sistem
vii
Rawatan Air Kumbahan Domestik Secara Biologi telah dibina untuk mengkaji potensi ia
dalam merawat air kumbahan. Sistem yang dicadangkan terdiri daripada lima unit operasi.
Unit-unit operasi tersebut adalah tangki sua pan, tangki enap sebelum, bioreaktor vertikal,
tangki enap selepas dan tangki simpanan. Bahan-bahan buangan kelapa digunakan sebagai
bahan penapis dalam bioreaktor supaya meminimumkan sumber sisa pepejal yang lain.
Konsortium benih microorganisma telah disediakan dengan mengudarakan air sisa sebenar
untuk beberapa hari sehingga pertumbuhan mikrob munasabah dicapai (kira-kira 600nm
ketumpatan optik). Potensi sistem rawatan air sisa domestik ini dinilai berdasarkannya kadar
aliran ia beroperasi, kepekatan air sisa yang dirawat , dan isipadu media sokongan yang
digunakan semasa rawatan. Air buangan sintetik telah digunakan semasa penilaian.
Proses rawatan menggunakan serat kelapa sebagai media sokongan dalam bioreaktor
menurljukkan peratusan penyingkiran yang besar dim ana TSS (81.88%), TS (70.83%), COD
(93.46%) dan BOD (82.03%). Manakala sumbangan empulur sabut kelapa kepada peratusan
penyingkiran untuk TSS, TS, COD, dan BOD mencecah 95.92%, 71.88%, 99.86%, dan
57.14% masing-masing. Peratusan penyingkiran menunjukkan sisa kelapa mempunyai
kemampuan untuk menjadi penapis biologi. Penyelidikan juga mendedahkan bahawa kualiti
air yang telah dirtiwat menurun apabila system beroperasi pada kadar aliran yang tinggi dan
merawat air sisa yang berkepekatan tinggi. Manakala jika jumlah media sokongan di dalam
bioreaktor dikurangkan, kualiti air yang telah dirawat juga juga menurun. Sistem rawatan
biologi telah didemonstrasikan mampu merawat air sisa domestik sintetik.
Daripada keputusan ekperimen dan pemerhatian yang telah dijalankan, Sistem
Rawatan Air Kumbahan Domestik Secara Biologi mempunyai satu kebolehan untuk menjadi
Vlll

alternatif dolam proses peningkatan kualiti air sungai. Pendekatan ini menggabungkan aspek
elconomi untukjangka panjang, mesra alam sekitar dan melestarikan kualiti air sungai-sungai
diSarawak.
ix

P al. Kh.i mal aJdumat Akademik UNlVERSm MALAYSIA SARAWA)(
TABLE OF CONTENTS
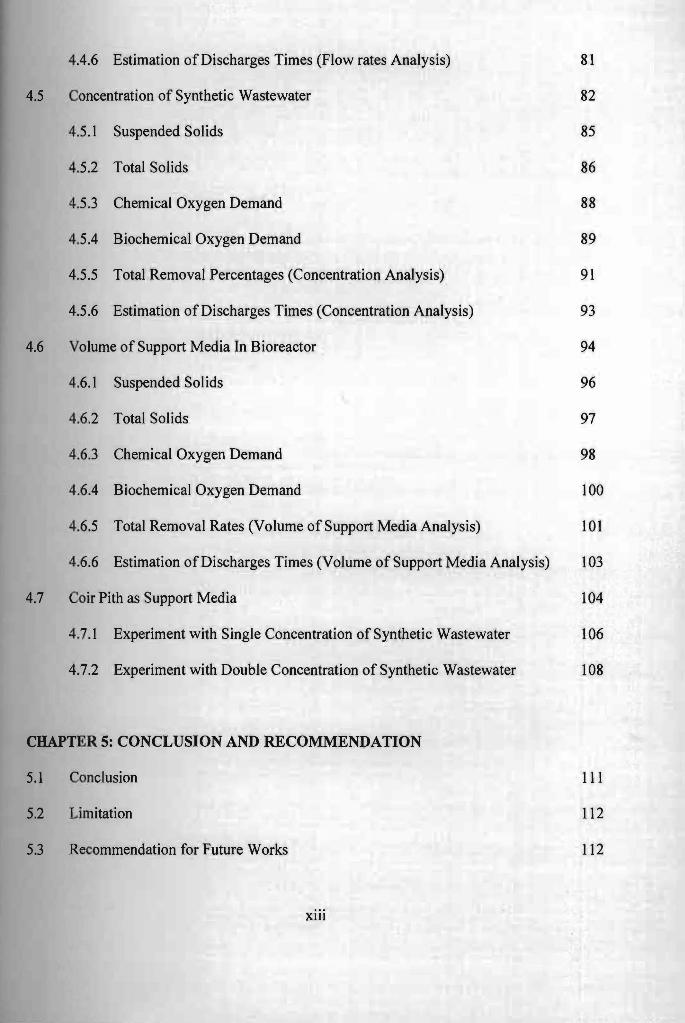
iiiACKNOWLEDGEMENTS
ABSTRACT v
viiABSTRAK
xTABLE OF CONTENTS
xvUST OF FIGURES
xviiLIST OF TABLES
xixLIST OF ABBREVIATIONS
CHAPTER 1: INTRODUCTION
1.1 The Sarawak River Basin
51.2 Problem Statements
61.3 Objectives and specific Aims
61.4 Hypothesis
71.5 Structure of Thesis
CHAPTER 2: LITERATURE REVIEW
92.1 Water Resources
112.2 Sewage
152.3 Wastewater Management in Kuching City
172.4 Wastewater Treatment
202.5 Biological Wastewater Treatment
252.6 Coconut Waste in Attached Growth Biological Reactor
x

r
2.7 General Observation on Attached Growth Biological Treatment 28
CHAPTER 3: MATERIALS AND METHODS
3.1 Introduction 29
3.2 Research Framework 29
3.3 Treatment System Design and Fabrication 30
3.3.1 Feed Tank 33
3.3.2 Pre Sedimentation Tank 33
3.3.3 Vertical Fixed Film Bioreactor 34
3.3.4 Post Sedimentation Tank 34
3.3.5 Storage Tank 35
3.4 Experimental Design 36
3.4.1 Preliminary Experimental Procedures 36
3.4.2 Operating Flow Rates 41
3.4.3 Concentration of Wastewater 43
3.4.4 Volume of Support Media 45
3.4.5 Coir Pith as Support Media 48
3.5 Analysis 50
3.5.1 Dissolved Oxygen (DO) 51
3.5.1.1 Manganous Sulfate Solution 51
3.5.1.2 Alkali Iodide Azide Reagent 51
3.5.1.3 Starch Indicator Solution 52
3.5.1.4 Standard Sodium Thiosulfate Titrant 52
3.5.1.5 Standard Potassium Bi -Iodate Solution (0.0021 M) 52
xi
3.5.1.6 Azide Modification Test Procedure 53
3.5.2 Total Solids (TS) 54
3.5.3 Total Suspended Solids (TSS) 55
3.5.4 Chemical Oxygen Demand (COD) 56
3.5.4.1 Digestion Solution 56
3.5.4.2 Sulfuric Acid Reagent 57
3.5.4.3 Closed Reflux Methods Procedures 57
3.5.5 Biochemical Oxygen Demand (BODs) 58
3.5.5.1 Phosphate Buffer Solution 59
3.5.5.2 Magnesium Sulfate Solution 59
3.5.5.3 Calcium Chloride Solution 59
3.5.5.4 Ferric Chloride Solution 59
3.5.5.5 BOD-5 Days Test Procedures 59
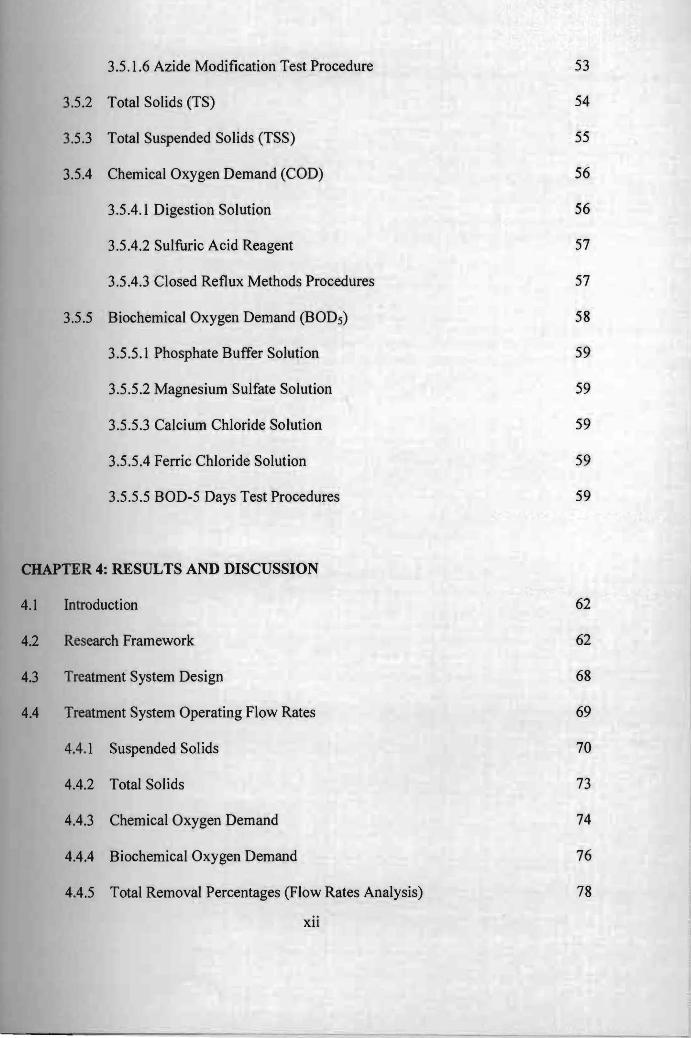
ICHAPTER 4: RESULTS AND DISCUSSION
4.1 Introduction 62 1
4.2 Jtesearch Framevvork 62 1 r
4.3 Treatment System Design 68
i 4.4 Treatment System Operating Flovv Rates 69
I
4.4.1 Suspended Solids 70
4.4.2 Total Solids 73
4.4.3 Chemical Oxygen Demand 74 I
4.4.4 Biochemical Oxygen Demand 76
4.4.5 Total Removal Percentages (Flovv Rates Analysis) 78
xu
------~---------------------=====~~~~--==~~------~~=====--====~---=~--------~
81 4.4.6 Estimation of Discharges Times (Flow rates Analysis)
4.5 Concentration of Synthetic Wastewater
4.5.1 Suspended Solids
4.5.2 Total Solids
4.5.3 Chemical Oxygen Demand
4.5.4 Biochemical Oxygen Demand
4.5.5 Total Removal Percentages (Concentration Analysis)
4.5.6 Estimation of Discharges Times (Concentration Analysis)
4.6 Volume of Support Media In Bioreactor
4.6.1 Suspended Solids
4.6.2 Total Solids
4.6.3 Chemical Oxygen Demand
4.6.4 Biochemical Oxygen Demand
4.6.5 Total Removal Rates (Volume of Support Media Analysis)
4.6.6 Estimation of Discharges Times (Volume of Support Media Analysis)
4.7 Coir Pith as Support Media
4.7.1 Experiment with Single Concentration of Synthetic Wastewater
4.7.2 Experiment with Double Concentration of Synthetic Wastewater
CHAPTER 5: CONCLUSION AND RECOMMENDATION
5.1 Conclusion
5.2 Limitation
5.3 Recommendation for Future Works
XIII
82
85
86
88
89
91
93
94
96
97
98
100
101
103
104
106
108
111
112
112

REFERENCES 114
APPENDIX A: Samples of Calculation 123
APPENDIX B-1: Data Sheet (Flow Rates Analysis -1.8 liter/min) 126
APPENDIX B-2: Data Sheet (Flow Rates Analysis - 4.0 liter/min) 130
APPENDIX B-3: Data Sheet (Flow Rates Analysis - 6.0 liter/min) 134
APPENDIX B-4: Data Sheet (Flow Rates Analysis - 8.0 liter/min) 138
APPENDIX B-5: Data Sheet (Concentration Analysis - Double) 142
APPENDIX B-6: Data Sheet (Concentration Analysis - Triple) 146
APPENDIX B-7: Data Sheet (Concentration Analysis - Quadruple) 150
APPENDIX B-8: Data Sheet (Volume of Packing Material Analysis -75%) 154
APPENDIX B-9: Data Sheet (Volume of Packing Material Analysis - 50%) 158
APPENDIX B-10: Data Sheet (Coir Pith Analysis - Concentration Single) 162
APPENDIXB-l1: Data Sheet (Coir Pith Analysis - Concentration Double) 166
APPENDIX C: Photographs 170
APPENDIX D-1: Chemistry Fundamental and Applications,
ISBN 978-967-5418-02-0 174
APPENDIX D-2: Proceedings of EnCon2010
ISBN 978-967-5418-10-5 181
APPENDIX D-3: A Study on Relationships between Land Used and River Water
Quality in Southern Region of Sarawak 187
APPENDIXD-4: TSS and COD Removal in Biological Domestic Wastewater
Treatment System; with Bioreactor Filled with Coconut Fiber 193
POSTER
xiv
j
•

LIST OF FIGURES
Figure 2-1: Hydrological cycles 10
Figure 2-2 Wastewater Treatment 19
Figure 2-2: Coconut fruit 26
Figure 3-1: Research activities flow chart 31
Figure 3-2: Schematic diagram for proposed treatment system 32
Figure 3-3: The entire treatment system set up 37
Figure 3-4: Bundles ofcoconut coir 38
Figure 3-5: Coconut coir inside bioreactor 38
Figure 3-6: Microbial population on agar plates 41
Figure 4-1: Direct sewage discharge from food outlet into the Sg. Padungan 63
Figure 4-2: Sg. Sekama become a waste dumping conduit by the nearest resident 63
Figure 4-3: The recorded of Chemical Oxygen Demand (COD), and Total Suspended 64
Solid (TSS) for Sg. Sarawak, 1999-2007
Figure 4-4: The recorded of Dissolved Oxygen (DO), Biochemical Oxygen Demand 65
(BOD), and Ammonia Nitrogen for Sg. Sarawak, 1999-2007
Figure 4-5: Water quality trends for four of Sg. Sarawak tributaries, Sg. Maong, Sg. 66
Bintangor, Sg. Padungan and Sg. Sekama
Figure 4-6: Suspended solids vs flow rates 71
Figure 4-7: Total solids vs flow rates 73
Figure 4-8: Chemical oxygen demand vs flow rates 75
xv
Figure 4-9:
Figure 4-10:
Figure 4-11 :
Figure 4-12:
Figure 4-13:
Figure 4-14:
Figure 4-15:
Figure 4-16:
Figure 4-17:
Figure 4-18:
Figure 4-19:
Figure 4-20:
Figure 4-21 :
Figure 4-22:
Figure 4-23:
Figure 4-24:
Figure 4-25:
Biochemical oxygen demand vs flow rates 77
Removal percentage after 60 treatment cycles (operating flow rates 78
analysis)
Fresh synthetic wastewater before treatment 80
Synthetic wastewater after treatment at 1.8 liter/min 80
Suspended solids vs concentration 86
Total solids vs concentration 87
Chemical oxygen demand vs concentration 89
Biochemical oxygen demand vs concentration 90
Removal efficiency at 75 treatment cycles 92
Suspended solids vs volume of support media 97
Total solids trends vs volume of support media 98
Chemical oxygen demand vs volume of support media 99
Biochemical oxygen demand vs volume of support media 101
Coir pith 104
Coir pith inside bioreactor 105
Comparison of effluent quality between coconut coir and coir pith as 107
support media (single concentration)
Comparison of effluent quality between coconut coir and coir pith as 108
support media (double concentration)
xvi

LIST OF TABLES
Table I-I: Classification of Sg. Sarawak and its tributaries based on NWQSM and WQI 4
in 2007
Table 2-1: Environmental Quality (Sewage and Industrial Effluents) Regulations, 2009 13
Maximum Effluent Parameters Limits Standards A and B
Table 2-2: National Water Quality Standard (NWQS) 14
Table 3-1: Composition of synthetic wastewater 39
Table 3-2: Luria-Bertani broth media recipe 40
Table 4-1: Food outlet wastewater characteristic 68
Table 4-2: Hydraulic retention time 70
Table 4-3: Loading rates for different operating flow rates 70
Table 4-4: Effluent quality after 60 treatment cycles (flow rates analysis) 79
Table 4-5: Estimation of discharges time vs flow rates 81
Table 4-6: Compositions of synthetic wastewater for different concentration 83
Table 4-7: Characteristics of fresh synthetic wastewater for different concentration 84
Table 4-8 Loading rates for different characteristics of fresh synthetic wastewater 84
Table 4-9: Effluent quality at 75 treatment cycles 93
Table 4-10: Estimation of discharges time vs concentration of influent 94
Table 4-1 I: Height and volume of coconut fiber inside bioreactor 95
Table 4-12: Loading rates for different volumes of support media 95
Table 4-13: Eflluent quality at final treatment cycles vs volume of support media 102
xvii
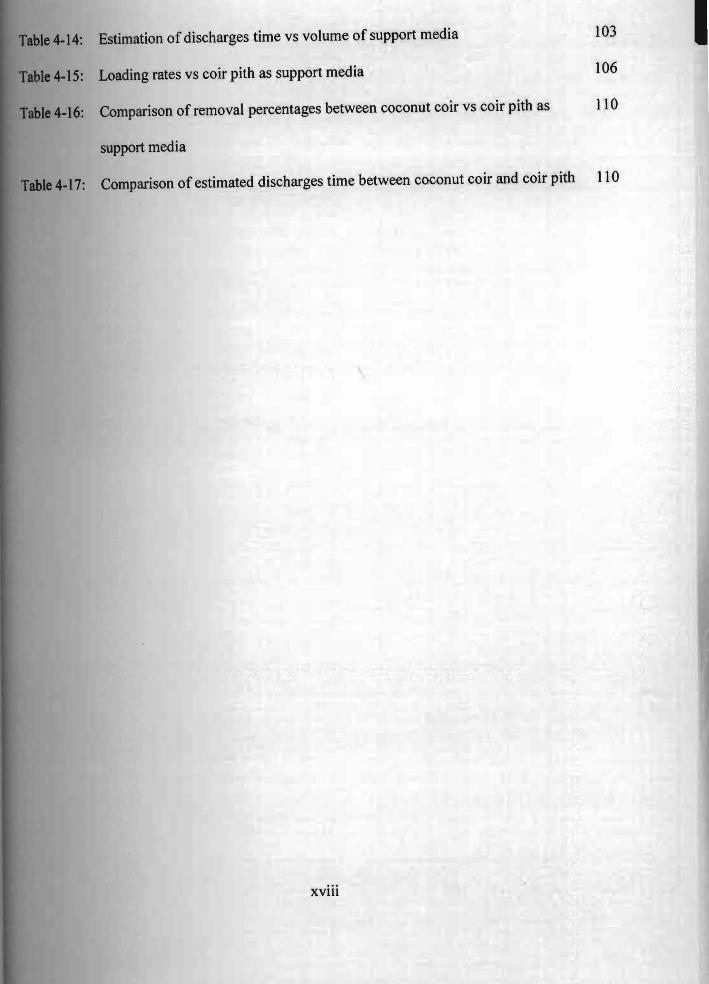
Estimation of discharges time vs volume of support media 103
Loading rates vs coir pith as support media 106
Comparison of removal percentages between coconut coir vs coir pith as 110
support media
Comparison of estimated discharges time between coconut coir and coir pith 110
xviii
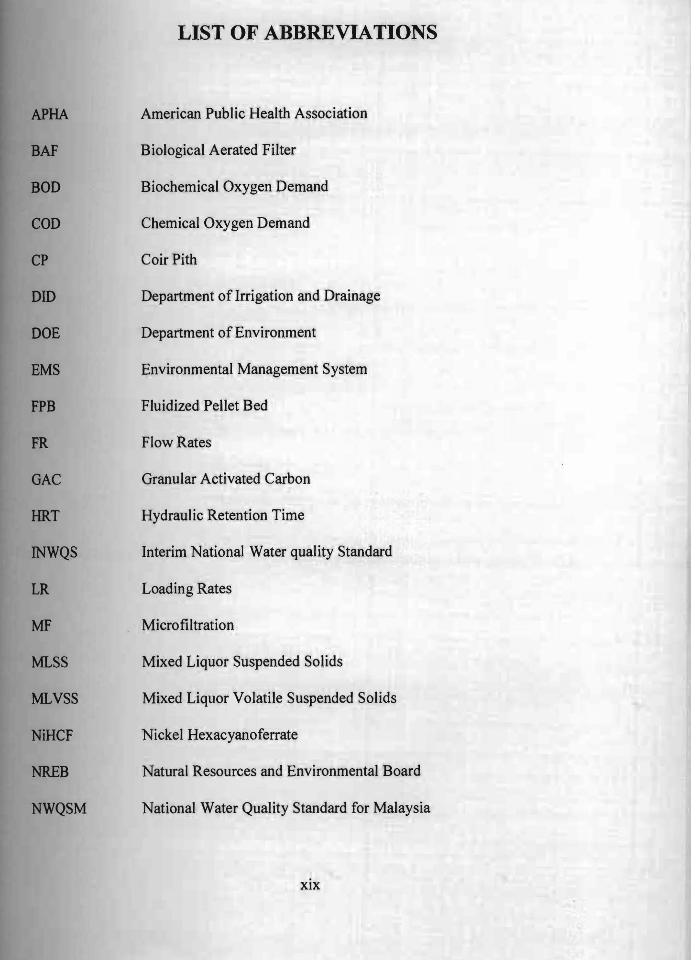
APHA
BAF
BOD
COD
CP
DID
DOE
EMS
FPB
FR
GAC
HRT
INWQS
LR
MF
MLSS
MLVSS
NiHCF
NREB
NWQSM
LIST OF ABBREVIATIONS
American Public Health Association
Biological Aerated Filter
Biochemical Oxygen Demand
Chemical Oxygen Demand
Coir Pith
Department of Irrigation and Drainage
Department of Environment
Environmental Management System
Fluidized Pellet Bed
Flow Rates
Granular Activated Carbon
Hydraulic Retention Time
Interim National Water quality Standard
Loading Rates
Microfiltration
Mixed Liquor Suspended Solids
Mixed Liquor Volatile Suspended Solids
Nickel Hexacyanoferrate
Natural Resources and Environmental Board
National Water Quality Standard for Malaysia
xix

OFR
RWQMP
SAGB
SAR
SRT
Tep
IDS
TKN
TN
TS
TSS
UNIMAS
WQI
Operating Flow Rates
River Water Quality Monitoring Programme
Submerged Attached Growth Bioreactor
Suspended Aerobic Reactor
Solid Retention Time
Trichlorophenol
Total Dissolved Solids
Total Kjeldahl Nitrogen
Total Nitrogen
Total Solids
Total Suspended Solids
Universiti Malaysia Sarawak
Water Quality Index
xx

CHAPTER ONE
INTRODUCTION
1.1 The Sarawak River Basin
Sarawak River or Sg. Sarawak is a river located in State of Sarawak, Malaysia. The area
of Sarawak River Basin is approximately 2,459km2, whereby the length of the main
river is about 120 km. It has been an important source of water supply and
transportation for the inhabitants in southwestern Sarawak. The river has also been used
for water-related sport activities such as Annual Sarawak Regatta, which attracts
significant number of tourists all over the world every year.
Recently, there is a slight deterioration of water quality in Sungai Sarawak. However,
the section of Sg. Sarawak that flows through the ~ity of Kuching has been classified as
"significantly polluted." The main sources of pollution are raw and insufficiently treated
wastewaters, which are directly discharged to the open drains in the city. Faecal-derived
coliform bacteria impose a major health risk polluted with organic matters and nutrients,
leading to oxygen deficiency, deleterious impact on the aquatic environment. If the
problems continue, inhabitants in southwestern part of Sarawak will lose the main
source of quality water for maintaining human life and for protecting natural ecological
systems.
The Natural Resources and Environment Board, Sarawak (NREB) is one of the state
agencies re~onsible for monitoring water quality of Sg. Sarawak and its tributaries and
other water catchment areas of Sarawak. NREB has been carrying out River Water
Quality Monitoring Program (RWQMP) since 1999 in an attempt to monitor the
impacts of human activities on the river water quality. Usually, water samplings are
conducted on a monthly or quarterly basis, depending on the sensitivity, relevancy and
accessibility of the locations.
The NREB also carries out some other environmental studies related to the water
quality of Sg. Sarawak. In 2001, a study entitled "Environment of Sg. Sarawak:
Relationship between City and River" had been carried out in conjunction with the
development of an Environmental Management System (EMS) for Kuching City. This
study provides a description of the river quality and sources of pollution; indicators for
the future river quality in the EMS. The findings of this study clearly indicate that the
water quality of Sg. Sarawak and its tributaries could be improved by establishing
efficient sewage treatment system for the individual households located within the
catchment.
In 2003, Sarawak State Government further embarked on exploring other alternatives to
minimize the pollution from wastewater discharge. The State conducted a feasibility
study on future wastewater management for Kuching; the Master Plan Study for a
In 2004, NREB, State Government of Sarawak and
Department of Irrigation and Drainage (DID) Sarawak proposed a Framework Plan for
Integrated Wastewater Management for Kuching. This Framework Plan describes an
approach which combines conventional, ecological and other methodologies into an
I
2