biological water-quality assessment of selected … water-quality assessment of selected streams in...
TRANSCRIPT

Biological Water-Quality Assessment of Selected Streams in the Milwaukee Metropolitan Sewerage District Planning Area of Wisconsin, 2007
Scientific Investigations Report 2010–5166Version 1.1, February 2014
Prepared in cooperation with the Milwaukee Metropolitan Sewerage District
U.S. Department of the InteriorU.S. Geological Survey

Cover artwork by Benjamin J. Siebers, U.S. Geological Survey, Wisconsin Water Science Center, Middleton, Wisconsin

Biological Water-Quality Assessment of Selected Streams in the Milwaukee Metropolitan Sewerage District Planning Area of Wisconsin, 2007
By Barbara C. Scudder Eikenberry, Amanda H. Bell, Daniel J. Sullivan, Michelle A. Lutz, and David A. Alvarez
Prepared in cooperation with the Milwaukee Metropolitan Sewerage District
Scientific Investigations Report 2010–5166Version 1.1, February 2014
U.S. Department of the InteriorU.S. Geological Survey

U.S. Department of the InteriorKEN SALAZAR, Secretary
U.S. Geological SurveyMarcia K. McNutt, Director
U.S. Geological Survey, Reston, Virginia: 2010Revised: 2014
For more information on the USGS—the Federal source for science about the Earth, its natural and living resources, natural hazards, and the environment, visit http://www.usgs.gov or call 1-888-ASK-USGS
For an overview of USGS information products, including maps, imagery, and publications, visit http://www.usgs.gov/pubprod
To order this and other USGS information products, visit http://store.usgs.gov
Any use of trade, product, or firm names is for descriptive purposes only and does not imply endorsement by the U.S. Government.
Although this report is in the public domain, permission must be secured from the individual copyright owners to reproduce any copyrighted materials contained within this report.
Suggested citation:Scudder Eikenberry, B.C., Bell, A.H., Sullivan, D.J., Lutz, M.A., and Alvarez, D.A., 2010, Biological water-quality assessment of selected streams in the Milwaukee Metropolitan Sewerage District Planning Area of Wisconsin, 2007 (ver. 1.1, February 2014): U.S. Geological Survey Scientific-Investigations Report 2010–5166, 28 p.

iii
Contents
Abstract ...........................................................................................................................................................1Introduction.....................................................................................................................................................2
Purpose and Scope ..............................................................................................................................2Methods...........................................................................................................................................................3
Study Area..............................................................................................................................................3Data Collection ......................................................................................................................................3Data Analysis .........................................................................................................................................6
Biological Community Assessment ............................................................................................................6Algae .......................................................................................................................................................7Invertebrates .......................................................................................................................................12Fish ........................................................................................................................................................19Comparative Bioassessment Among Algae, Invertebrates, and Fish ........................................22
Toxicity and Chemical Assessment Using SPMDS ................................................................................23SPMD Toxicity Tests ...........................................................................................................................24SPMD Chemical Screening ...............................................................................................................24
Summary and Conclusions .........................................................................................................................26References Cited..........................................................................................................................................27
Figures Figure 1. Map showing sites where biological assessments were completed in 2004 and
2007 in the Milwaukee Metropolitan Sewerage planning area, Wisconsin ……… 4 Figure 2. Photographs showing Lincoln Creek at 47th Street above USGS gage, looking
upstream at pedestrian bridge, in November 2001 during channel restructuring, and in June 2003 during recovery of riparian vegetation ………… 5
Figure 3. Photograph of passive-sampling devices (SPMDs) that were deployed for an average of 37 days at 6 of the 14 stream sites in the Milwaukee Metropolitan Sewerage District planning area to evaluate potential toxicity and concentrations of selected constituents in stream water ………………………… 6
Figure 4. Graph showing diatom classifications for 14 streams sampled for the Milwaukee Metropolitan Sewerage District planning area, Wisconsin, in 2004 and 2007 …… 12
Figure 5. Map showing Invertebrate Ephemeroptera-Plecoptera-Trichoptera (EPT) index values at 14 stream sites in the Milwaukee Metropolitan Sewerage District planning area, Wisconsin, 2004 and 2007 ………………………………………… 15
Figure 6. Map showing Invertebrate Hilsenhoff Biotic Index (HBI-10) values at 14 stream sites in the Milwaukee Metropolitan Sewerage District planning area, Wisconsin, 2004 and 2007 ………………………………………………………… 18
Figure 7. Map showing Fish Index of Biotic Integrity (IBI) scores at 14 stream sites in the Milwaukee Metropolitan Sewerage District planning area, Wisconsin, 2004 and 2007 …………………………………………………………………………… 21

iv
Tables Table 1. Stream sites where biological assessments were completed in 2004 and 2007
in the Milwaukee Metropolitan Sewerage District planning area of Wisconsin, showing drainage area and annual mean discharge …………………………… 5
Table 2. Algal assemblage information from one-time surveys conducted in September 2007 at 14 streams in the Milwaukee Metropolitan Sewerage District planning area, Wisconsin …………………………………………………………………… 8
Table 3. Comparison of algal-assemblage data from one-time surveys at 14 streams in the Milwaukee Metropolitan Sewerage District Planning area, Wisconsin, 2004 and 2007 ……………………………………………………………………… 9
Table 4. Water-quality ratings for the invertebrate Hilsenhoff Biotic Index and Index of Biotic Integrity for streams ……………………………………………………… 12
Table 5. Invertebrate-assemblage information from one-time surveys conducted in September 2007 at 14 stream sites in the Milwaukee Metropolitan Sewerage District planning area, Wisconsin ………………………………………………… 13
Table 6. Comparison of invertebrate-assemblage data from one-time surveys at 14 sites in the Milwaukee Metropolitan Sewerage District Planning area, Wisconsin, 2004 and 2007 ………………………………………………………… 16
Table 7. Scores and ratings for the fish Index of Biotic Integrity for warmwater streams … 19 Table 8. Comparison of fish-assemblage data from one-time surveys at 14 sites in the
Milwaukee Metropolitan Sewerage District Planning area, Wisconsin, 2004 and 2007 …………………………………………………………………………… 20
Table 9. Average trophic-level rankings and aggregate bioassessment rankings for stream sites in the Milwaukee Metropolitan Sewerage District planning area, Wisconsin, in 2007 and 2004 ……………………………………………………… 23
Table 10. Toxicity test results for passive sampling devices (SPMDs, semi-permeable membrane devices) deployed during July–August 2007, for a subset of six Phase III stream sites in the Milwaukee Metropolitan Sewerage District planning area, Wisconsin ………………………………………………………… 24
Table 11. Estimated concentration in water, in nanograms per liter, of polycyclic aromatic hydrocarbons (PAHs) computed from results for passive sampling devices (SPMDs, semi-permeable membrane devices) deployed at 6 of 14 stream sites in the Milwaukee Metropolitan Sewerage District planning area of Wisconsin, July–August, 2007. Values were estimated using 37 days, the average number of days all SPMDs were deployed ……………………………… 25
v
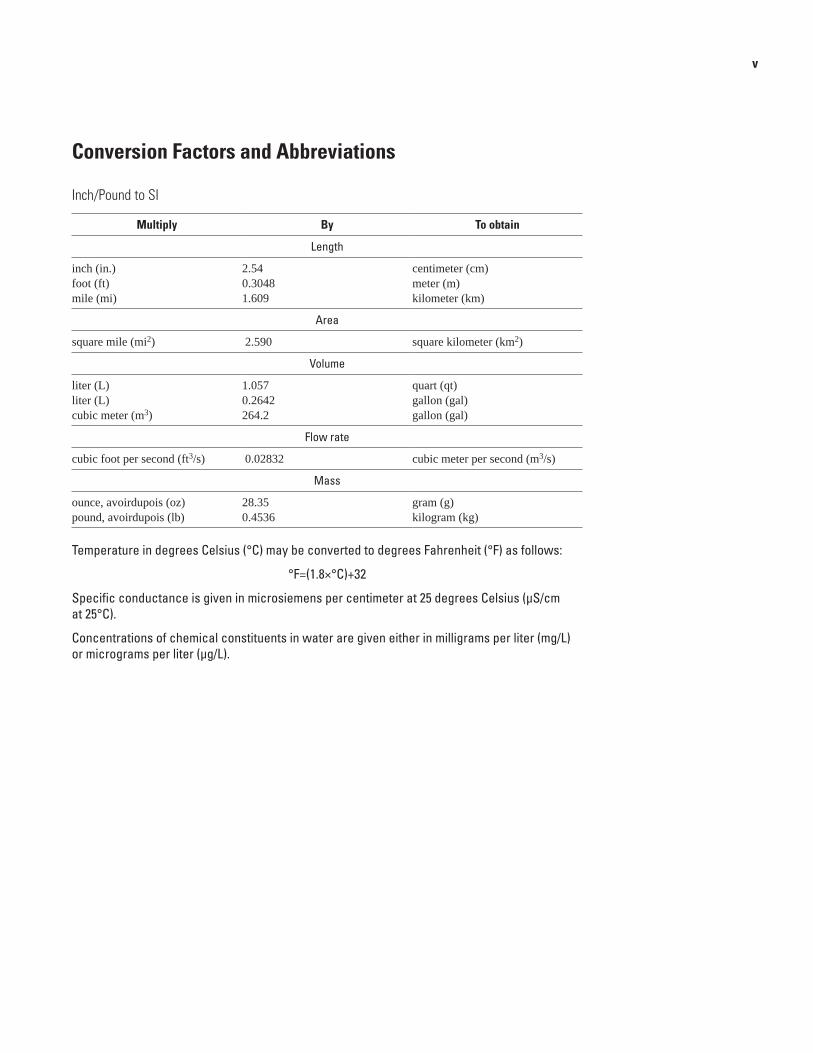
Conversion Factors and Abbreviations
Inch/Pound to SI
Multiply By To obtain
Length
inch (in.) 2.54 centimeter (cm)foot (ft) 0.3048 meter (m)mile (mi) 1.609 kilometer (km)
Area
square mile (mi2) 2.590 square kilometer (km2)
Volume
liter (L) 1.057 quart (qt)liter (L) 0.2642 gallon (gal)cubic meter (m3) 264.2 gallon (gal)
Flow rate
cubic foot per second (ft3/s) 0.02832 cubic meter per second (m3/s)
Mass
ounce, avoirdupois (oz) 28.35 gram (g) pound, avoirdupois (lb) 0.4536 kilogram (kg)
Temperature in degrees Celsius (°C) may be converted to degrees Fahrenheit (°F) as follows:
°F=(1.8×°C)+32
Specific conductance is given in microsiemens per centimeter at 25 degrees Celsius (µS/cm at 25°C).
Concentrations of chemical constituents in water are given either in milligrams per liter (mg/L) or micrograms per liter (µg/L).

vi
Other Abbreviations
BOD Biological Oxygen DemandEPT Ephemeroptera-Plecoptera-Trichoptera taxaGIS Geographic Information SystemHBI Hilsenhoff Biotic IndexHBI-10 Hilsenhoff Biotic Index, 10-Max modificationIBI Index of Biotic IntegrityMMSD Milwaukee Metropolitan Sewerage DistrictP450RGS Cytochrome-P450 Reporter Gene SystemPAH Polycyclic aromatic hydrocarbonPCB Polychlorinated biphenylPEC Probable effects concentrationPRA Percent relative abundanceSEWRPC Southeastern Wisconsin Regional Planning CommissionSPMD Semipermeable membrane device (type of passive-sampling device)TEC Threshold effect concentrationTEQ Toxic equivalents, from the SPMD P450RGS toxicity testTU50 Toxicity units for the Microtox toxicity testUSGS U.S. Geological SurveyWDNR Wisconsin Department of Natural Resources
vii
Acknowledgments
Technical Reviewers
Elisabeth A. Graffy, Economist, U.S. Geological Survey, Middleton, Wis.Mitchell A. Harris, Ecologist, U.S. Geological Survey, Urbana, Ill.
Editorial and Graphics
Alice Koller, Editor, Greymont –Koller Group, Lincoln, Mass.Michelle Greenwood, Geographer, U.S. Geological Survey, Middleton, Wis.
Data Collection, 2007
Austin K. Baldwin, Hydrologist, U.S. Geological Survey, Middleton, Wis.David J. Graczyk, Hydrologist, U.S. Geological Survey, Middleton, Wis.Ryan T. Jirik, Hydrologic Technician, U.S. Geological Survey, Rhinelander, Wis.Kevin D. Richards, Hydrologist, U.S. Geological Survey, Middleton, Wis.
Approving Official
Rip S. Shively, Bureau Reports Approving Official-Biology, Central Region, U.S. Geological Survey, Columbia, Mo.

viii
This page intentionally left blank.

Biological Water-Quality Assessment of Selected Streams in the Milwaukee Metropolitan Sewerage District Planning Area of Wisconsin, 2007
By Barbara C. Scudder Eikenberry, Amanda H. Bell, Daniel J. Sullivan, Michelle A. Lutz, and David A. Alvarez
AbstractChanges in the water quality of stream ecosystems in
an urban area may manifest in conspicuous ways, such as in murky or smelly streamwater, or in less conspicuous ways, such as fewer native or pollution-sensitive organisms. In 2004, and again in 2007, the U.S. Geological Survey sampled stream organisms—algae, invertebrates, and fish—in 14 Milwaukee area streams to assess water quality as part of the ongoing Milwaukee Metropolitan Sewerage District (MMSD) Corridor Study. In addition, passive-sampling devices (SPMDs, “semipermeable membrane devices”) were deployed at a subset of sites in order to evaluate the potential exposure of stream organisms to certain toxic chemicals. Results of the 2007 sampling effort are the focus of this report. Results of sampling from 2007 are compared with results from 2004.
The water quality of sampled streams was assessed by evaluating biological-assemblage data, metrics computed from assemblage data, and an aggregate bioassessment ranking method that combined data for algae, invertebrates, and fish. These data contain information about the abundance (number) of different species in each group of stream organisms and the balance between species that can or cannot tolerate polluted or disturbed conditions. In 2007, the highest numbers of algal, invertebrate, and fish species were found at the Milwaukee River at Milwaukee, the largest sampled site. Algal results indicated water quality concerns at 10 of the 14 sampled sites due to the occurrence of nuisance algae or low percentages of pollution-sensitive algae. When compared to 2004, total algal biovolume was higher in 2007 at 12 of 14 sites, due mostly to more nuisance green algae from unknown causes. Results of several metrics, including the Hilsenhoff Biotic Index (HBI-10), suggest that invertebrate assemblages in the Little Menomonee River, Underwood Creek, and Honey Creek were poorer quality in 2007 compared to 2004. Six sites received “very poor” quality ratings for fish in 2007, mostly because inadequate numbers of fish were collected at five sites to allow computation of an Index of Biotic Integrity (IBI); this resulted in three additional sites receiving “very poor” ratings
compared to 2004. Some signs of potential improvement in the fish assemblage were evident at Lincoln Creek, possibly reflecting delayed effects of the restoration of stream habitat, completed in 2002; however, algae and invertebrates did not show signs of improvement.
Aggregate bioassessment rankings across all groups of organisms for 2004 and 2007 indicated that water quality at the two Milwaukee River main stem sites (at Milwaukee and near Cedarburg), Jewel Creek, and the Menomonee River at Menomonee Falls was the least-degraded among all sampled sites. Rankings for Oak Creek and Little Menomonee suggested water quality was worse in 2007 compared to 2004 and placed these two sites together with Kinnickinnic River and Underwood Creek, two concrete-line sites, indicating the most-degraded water quality among all sampled sites. The aggregate ranking for Lincoln Creek in 2007 would have placed it in the most-degraded category but for the positive influence of the fish ranking when compared to poor algal and invertebrate rankings. Potential toxicity due to certain manmade chemicals, such as polycyclic aromatic hydrocarbons (PAHs), was found at all six sites where SPMDs were deployed. As was found in 2004, the highest potential toxicity in 2007 was observed at Lincoln Creek where chemical screening in 2007 also showed the highest total PAHs of all six sites; however, potential toxicity at Little Menomonee River, Honey Creek, and Kinnickinnic River was relatively high compared to Milwaukee River near Cedarburg. Although toxicity and chemical results in 2007 did not agree with aggregate rankings for Lincoln Creek because of fish, nor for Honey Creek, the results did agree with aggregate rankings at four of the six sites. In addition to toxicological and chemical influences, the more urbanized sites have high percentages of impervious surface area, resulting in frequent high stream flows that can adversely affect algal, invertebrate, and fish assemblages. Assessments of the ecological status of different groups of organisms and of potential chemical and physical stressors to organisms are important tools in evaluating streamwater quality.

2 Biological Water-Quality Assessment, Milwaukee Metropolitan Sewerage District Planning Area, Wisconsin, 2007
IntroductionThe Milwaukee Metropolitan Sewerage District (MMSD)
Corridor Study is designed to improve the understanding of water resources in the MMSD planning area by evaluating the quality of water resources and of biological communities of stream corridors within the MMSD planning area and by providing information for assessing the potential success of current and future management efforts. The study is a collaborative effort by MMSD, the Wisconsin Department of Natural Resources (WDNR), the Southeastern Wisconsin Regional Planning Commission (SEWRPC), University of Wisconsin-Milwaukee, Marquette University, Wisconsin Lutheran College, and the U.S. Geological Survey (USGS). Biological data, in combination with water chemistry and hydrologic data, provide multiple lines of evidence to assist scientists and managers in the assessment of water quality conditions. In the MMSD planning area, watersheds are generally becoming more urbanized, and the resulting changes in habitat, flow, and water chemistry can have major effects on organisms (biota) living in the streams. Because biota differ in their response to changes in water quality, data collected as part of this study included distribution and number of algal, invertebrate, and fish taxa (species, genus, family, phylum, or other grouping based on taxonomy of biota).
Benthic algae, also known as periphyton, are algae that attach to streambed materials such as rocks, logs, and other substrates. The most common benthic algae in most streams are diatoms. Blue-green and green algae may be found in greater abundance than diatoms in stream ecosystems that are subject to greater disturbance from human (anthropogenic) activities, such as nutrient enrichment and sedimentation carried in storm runoff from lawn fertilizers, construction, streets, etc. Because algae reproduce quickly and thus respond to short-term environmental changes, benthic algae were collected as water-quality indicators of short-term effects.
Benthic (attached) invertebrates include snails, mussels or clams, worms, leeches, and the larvae of many insects; aquatic insect larvae were targeted in this study. Invertebrates were collected as indicators of water-quality conditions of a slightly longer period than algae due to their relatively longer life spans: many invertebrates have life cycles of about a year. In addition, invertebrates are relatively stationary, and therefore are good indicators of conditions at a particular site. Some invertebrates are tolerant of a wide variety of water quality conditions, and others have a very narrow range of conditions they can tolerate.
Fish also were collected as part of the MMSD water-quality assessment. Fish generally live longer than algae or invertebrates and thus the fish assemblage may reflect water quality integrated over multiple years. However, fish are also mobile, and in some cases move great distances up and down rivers and streams. Thus, the fish assemblage at a particular site must be assessed within the larger context of the watershed (Allen and others, 1999; Fitzpatrick and others, 2001; Fore and others, 2003; Hambrook Berkman and others, 2010). Fish data also are useful from the standpoint of
public interest for sport and recreational fishing, and results of fish studies can be applied to the fishable waters mandate of Congress as part of the Clean Water Act.
While the health of in-stream biological communities is a useful indicator of ecosystem health, another aspect of pollution that is of concern to resource managers is the accumulation of potentially toxic chemicals in the tissues of fish and other stream biota. However, it is sometimes difficult or impossible to find sufficient numbers of the same taxa and size (or age) of biota across multiple sites for tissue analyses. Therefore, passive-sampling devices called “semipermeable membrane devices” (SPMDs) that mimic biological membranes, such as the gills of fish, can be used to predict exposure and accumulation of selected chemicals in fish and other aquatic biota (Alvarez and others, 2008; Bryant and Goodbred, 2009; Goodbred and others, 2009). SPMDs contain a manmade substance that is similar to lipids, or fats, found in fish tissues where waterborne chemicals accumulate. Chemicals commonly assessed by use of SPMDs are polycyclic aromatic hydrocarbons (PAHs), the largest group of suspected chemical carcinogens, which are formed mostly during incomplete combustion of fuel (Van Metre and others, 2000 and 2009). Together with assessment of the quality of aquatic assemblages at a site, use of SPMDs allow for a more complete picture of the overall health of each stream site examined (Bryant and Goodbred, 2009; Goodbred and others, 2009).
Purpose and Scope
Data collection was part of a larger water-quality study that began in 2000 to assess the water quality of selected stream sites in the Milwaukee area for the MMSD. The present report describes the results of biological and SPMD toxicity data collected in 2007 (“Phase III”) in streams of the MMSD planning area, and includes comparisons to data collected in 2004 (referred to as “Phase II”) and to a retrospective analysis of data (referred to as “Phase I”) collected prior to Phase II (Schneider, Lutz, and others, 2004; Thomas, Lutz, and others, 2007).
Biotic integrity and water quality were assessed at selected stream sites based on the biological assemblage data as well as on selected biological measures (metrics) that were computed based on these data. Effects of stream flows on biota at a subset of sites are described elsewhere (Richards and others, 2010; Steuer and others, 2010). The potential level of toxicity to stream biota from certain manmade chemicals was estimated at a subset of six sites based on analysis of data from SPMDs. Additional analysis of extracts for selected chemical concentrations allowed for a time-integrated concentration of the bioavailable fraction of these chemicals, thus supplementing single-sample measurements of total concentrations in water-column samples. The SPMD results were also compared to biological assemblage data at sampled sites, and together with the biological data provide multiple lines of evidence in an assessment of water quality.

Methods 3
MethodsBiological samples were collected once in 2004 and
once in 2007 from early July through early October, generally during periods of stable low flow when conditions were relatively stable and problems with access were minimized. Methods were in accordance with the USGS National Water-Quality Assessment Program (NAWQA) protocols detailed below.
Study Area
All stream sites were within the MMSD planning area (fig. 1 and table 1). The mouth of the Milwaukee River receives water from the Milwaukee, Menomonee, and Kinnickinnic River watersheds in addition to water from Lake Michigan (by way of reverse flow). Oak Creek and Root River both discharge directly into Lake Michigan south of the Milwaukee Harbor. Jewel Creek discharges into the Mississippi River by way of the Fox and Illinois Rivers. The Underwood Creek and Kinnickinnic River sampled reaches are mostly or entirely concrete-lined. Aquatic biological assemblages were sampled at the same 14 sites that were sampled in 2004 (Phase II) for numbers and types of algal, invertebrate, and fish taxa.
At the Lincoln Creek site, a major stream-restoration project was completed in 2002, about 2 years before this study began (fig. 2). The project included restructuring the channel together with removal and replacement of the streambed; all riparian vegetation was removed to allow for the major channel restructuring and streambank replacement. These dramatic modifications to the aquatic habitat will lead to ongoing ecological changes at this site, independently of direct water-quality changes, as biological assemblages adapt to the changed environment and approach equilibrium.
Data Collection
Algal, invertebrate, and fish samples were collected in a defined stream reach (150–300 m in length) according to the methods documented in Moulton and others (2002). Algal and invertebrate samples were collected during late August or early September 2004 and 2007. Fish were collected July through October in 2004 and only September in 2007. Area-wide storms and resulting high stream flows that occurred August 18–20, 2007, may have reduced the number of some stream biota for sampling. In addition to biological sampling, surface-water field parameters, including water temperature, pH, and specific electrical conductance (conductivity), were collected at the time of sampling.
Algal and invertebrate assemblages were sampled using USGS protocols for quantitative Richest-Targeted Habitat (RTH) samples (Moulton and others, 2002). The RTH sample was intended to represent the habitat with the greatest diversity of biota in a given stream reach, and was usually a
riffle. Willow Creek is a sand-bottomed stream with no riffles; therefore, woody snags were sampled as the richest habitat. Collection of algal and invertebrate samples was done at the same time in the same general area of the reach. Water depth and velocity were recorded at sampling locations during collection of algal and invertebrate samples.
Algal assemblage samples were collected using standard USGS methods (Moulton and others, 2002). Most samples were collected from cobble in riffle areas, except for the Willow Creek sample, which was collected from woody snags. At each site, five discrete collections in five riffle or snag areas were combined into a single composited algal sample to represent that site. The Academy of Natural Sciences in Philadelphia identified and counted algal taxa (generally species or genus) in all samples.
Invertebrate assemblage samples were collected using standard USGS methods (Moulton and others, 2002). Five discrete invertebrate collections were made from cobble at all but one site, using a modified Surber sampler with 500-micron-mesh net, and then combined into a single sample for each site (Moulton and others, 2002). At Willow Creek, where woody snags were sampled, discrete invertebrate collections from two snags were made at each of five locations and combined into a single sample. Identification and enumeration of invertebrate taxa (generally species or genus) were done by the Benthic Invertebrate Laboratory at the University of Wisconsin-Stevens Point (Stevens Point, Wis.).
A representative fish assemblage sample was collected at each site using backpack-mounted or towed-barge electrofishing units, as applicable, as well as seines (Moulton and others, 2002). Two electrofishing passes of the sampling reach were supplemented with three seine hauls per site. Fish were identified as to taxa (generally species), counted, weighed, and measured in the field, and then released to the stream. In the few cases where a fish could not be identified with certainty in the field, a few representative individuals were preserved for later identification.
SPMDs were deployed in duplicate at 6 of the 14 sites. SPMDs were in streams for 33–44 days (average of 37 days) during July–August 2007. One additional SPMD per site served as a “trip blank” or field quality-assurance sample, and was never deployed into the stream. SPMDs were 15.2-cm “mini-unit” devices of ultra-high-pure triolein, inside protective metal containers, and were purchased from Environmental Sampling Technologies (EST Labs; St. Joseph, MO) (fig. 3). Following deployment, SPMDs were returned to EST Labs for processing and dialysis to obtain chemical extracts. Extracts were sent to the USGS Columbia Environmental Research Center (CERC; Columbia, Mo.) for Microtox toxicity testing and PAH screening. The Microtox test screens for acute toxicity from certain manmade chemicals using strains of bioluminescent bacteria (Strategic Diagnostics, Inc.; Newark, DE). Extracts were sent to the U.S. Army Corps of Engineers, Engineer Research and Development Center—Waterways Experiment Station (Vicksburg, Miss.) for Cytochrome-P450 Reporter Gene System (P450RGS)

4 Biological Water-Quality Assessment, Milwaukee Metropolitan Sewerage District Planning Area, Wisconsin, 2007
EXPLANATION
Water
Area within the MMSDplanning area
Watershed boundary
Subwatershed boundary
Stream
Phase III biology-sampling site
Oak Creekat South Milwaukee
(OCSM)
Jewel Creekat Muskego
(JCM)
Honey Creek at Wauwatosa (HCW)
Willow Creek at Maple Roadnear Germantown
(WCG)
Lincoln Creekat 47th Streetat Milwaukee
(LCM)
Underwood Creekat Wauwatosa
(UCW)
Kinnickinnic Riverat S. 11th Street at Milwaukee
(KRM)
Little Menomonee Riverat Milwaukee
(LMM)
Root Rivernear Franklin
(RRF)
Root Riverat Grange Avenue
at Greenfield(RRG)
Menomonee Riverat Wauwatosa
(MRW)
Milwaukee Riverat Milwaukee
(MRM
Milwaukee Rivernear Cedarburg
(MRC)
Menomonee Riverat Menomonee Falls
(MRMF)
Oak Creekat South Milwaukee
(OCSM)
Jewel Creekat Muskego
(JCM)
Honey Creek at Wauwatosa (HCW)
Willow Creek at Maple Roadnear Germantown
(WCG)
Lincoln Creekat 47th Streetat Milwaukee
(LCM)
Underwood Creekat Wauwatosa
(UCW)
Kinnickinnic Riverat S. 11th Street at Milwaukee
(KRM)
Little Menomonee Riverat Milwaukee
(LMM)
Root Rivernear Franklin
(RRF)
Root Riverat Grange Avenue
at Greenfield(RRG)
Menomonee Riverat Wauwatosa
(MRW)
Milwaukee Riverat Milwaukee
(MRM)
Milwaukee Rivernear Cedarburg
(MRC)
Menomonee Riverat Menomonee Falls
(MRMF)
FOX RIVERFOX RIVER
ROOT RIVERROOT RIVER
MILWAUKEE RIVERMILWAUKEE RIVER
MENOMONEERIVER
MENOMONEERIVER
ROCK RIVERROCK RIVER
OAK CREEKOAK CREEK
KINNICKINNICRIVER
KINNICKINNICRIVER
DIRECTTRIBUTARY
DIRECTTRIBUTARY
DIRECTTRIBUTARY
DIRECTTRIBUTARY
LAKEMICHIGAN
DIRECT
LAKEMICHIGAN
DIRECT
88°10' 87°50'
42°5
0'43
°10'
Lake Michigan
0 42 Miles
0 42 Kilometers
Base composited from Southeastern Wisconsin Regional Planning Commission regional base map, 1:2,000, 1995; U.S. Geological Survey digital line graph hydrography, 1:100,000, 1989;
Wisconsin Department of Natural Resources version 2 hydrography, 1:24,000, 2002. Wisconsin Transverse Mercator Projection, referenced to North American Datum of 1983, 1991 adjustment.
Figure 1. Sites where biological assessments were completed in 2004 and 2007 in the Milwaukee Metropolitan Sewerage planning area, Wisconsin.
WISCONSIN
MICHIGAN
ILLINOISIOWA
MINNE-SOTA
MMSDplanning area
Figure 1. Sites where biological assessments were completed in 2004 and 2007 in the Milwaukee Metropolitan Sewerage planning area, Wisconsin.

Methods 5
Figure 2. Lincoln Creek at 47th Street above USGS gage, looking upstream at pedestrian bridge, (A) in November 2001 during channel restructuring, and (B) in June 2003 during recovery of riparian vegetation.
Table 1. Stream sites where biological assessments were completed in 2004 and 2007 in the Milwaukee Metropolitan Sewerage District planning area of Wisconsin, showing drainage area and annual mean discharge.
[Site locations are shown in figure 1. *, site at which semi-permeable membrane devices were deployed in 2007; mi2, square mile; ft3/s, cubic foot per second; ND, no data]
USGS site nameSite
abbreviation
USGS gaging station
No.
Drainage area (mi2)
Annual mean discharge
(ft3/s)
Milwaukee River near Cedarburg * MRC 04086600 607 453Lincoln Creek at 47th Street, at Milwaukee * LCM 040869416 9.56 13.2Milwaukee River at Milwaukee MRM 04087000 696 442Willow Creek at Maple Road, near Germantown WCG 040870195 6.33 NDMenomonee River at Menomonee Falls MRMF 04087030 34.7 31.1Little Menomonee River at Milwaukee * LMM 04087070 19.7 18.0Underwood Creek at Wauwatosa UCW 04087088 18.2 15.2Honey Creek at Wauwatosa * HCW 04087119 10.3 15.2Menomonee River at Wauwatosa MRW 04087120 123 107Kinnickinnic River at S. 11th Street, at Milwaukee * KRM 04087159 18.8 25.3Oak Creek at South Milwaukee * OCSM 04087204 25 23.9Root River at Grange Avenue, at Greenfield RRG 04087214 14.7 17.3Root River near Franklin RRF 04087220 49.2 44.8Jewel Creek at Muskego JCM 05544371 8.16 5.58
B
A

6 Biological Water-Quality Assessment, Milwaukee Metropolitan Sewerage District Planning Area, Wisconsin, 2007
testing. The P450RGS test detects the presence of and potential biological response to PAHs, polychlorinated biphenyls (PCBs), dioxins, and furans, and was performed according to USEPA Method 4425 using strains of bioluminescent hepatoma cells (Ang and others, 2000).
SPMDs were deployed in 2004 at some of these same sites as part of a USGS NAWQA study, and results can be found in the Phase II report (Thomas, Lutz, and others, 2007) as well as in Bryant and others (2007), Bryant and Goodbred (2009), and Richards and others (2010). Where possible, results for 2004 and 2007 are compared in the present report. The 2004 SPMD sites included Little Menomonee River, Lincoln Creek, and Oak Creek; SPMDs also were deployed at two additional sites that were near MMSD sites: Underwood Creek at Watertown Plank Road, at Elm Grove (040870856, about 3 mi upstream of the Underwood Creek at Wauwatosa, Phase II site), and Honey Creek near Portland Avenue, at Wauwatosa (04087118, about 1 mi upstream of the Honey Creek at Wauwatosa, Phase II site).
Data Analysis
Water quality was assessed at the 14 sites by examining the biological communities and their characteristics, such as number of individuals, number and types of taxa, pollution tolerance, and other traits. Algal metrics computed included the number of taxa, the relative proportion of each algal group (including diatoms), and percent pollution-sensitive and pollution-tolerant taxa. Computed metrics for invertebrate samples included the number of invertebrate taxa, Shannon Diversity Index, the percentage of invertebrate individuals or genera in the orders Ephemeroptera-Plecoptera-Trichoptera (EPT), the Hilsenhoff Biotic Index
(HBI-10; Hilsenhoff, 1987, 1998), and Index of Biotic Integrity (IBI; Weigel, 2003). Assemblage information and metrics for invertebrate samples were provided in the BUG database from the Benthic Invertebrate Laboratory at the University of Wisconsin-Stevens Point (Stevens Point, Wis.). Metrics computed for fish assemblages included the number of species and individuals; native species; predator fish; number of fish in certain groups such as sunfishes, suckers; pollution sensitive and pollution tolerant fish; and Fish IBI for Wisconsin warmwater streams (Lyons, 1992).
For SPMD results, values for Microtox and P450RGS were standardized to 30 days to allow comparison across sites; and concentrations of chemicals determined in the PAH screen were standardized using the average number of days deployed (37). Total PAH water concentrations were estimated using pyrene as a representative common PAH. Pyrene is produced during incomplete fossil-fuel combustion, for example, by cars and power plants, and it is also found in coal tar and coal-tar sealants (Mahler and others, 2005; Van Metre and others, 2009). Results are presented as the estimated time-weighted average water concentration for all constituents with available uptake kinetics (sampling rates) from the literature (Alvarez and others, 2008).
Statistical methods used in data analyses included basic descriptive statistics, such as means and quartiles, as well as graphing and Spearman Rank correlation (Data Desk version 6.1, Data Description Inc., 1996).
Biological Community AssessmentThe following discussion includes results from the
Phase III sampling conducted in 2007 and compares these results from the Phase II sampling conducted in 2004. In addition, maps showing the distribution of biological indexes from earlier reporting on the 2004 sampling results (Thomas, Lutz, and others, 2007) have been updated with Phase III data. It should be noted that differences between single samples taken in 2004 and 2007 are provided for comparison; however, these results may not represent statistically significant trends. Actual long-term trends in water quality and biological communities can be determined only from additional samples collected during ensuing years. Some degree of year-to-year variation in the structure of biotic communities is expected to occur in all streams and may not by itself be indicative of a trend. Variation may be greater in urban-affected streams because of increased disturbance from physical and chemical stressors, for example, impervious land cover leading to more stream flows of higher magnitude and shorter duration that have adverse effects on stream biota (Paul and Meyer, 2001; Kennen and others, 2010; Poff and Zimmerman, 2010).
Figure 3. Passive-sampling devices (SPMDs) that were deployed for an average of 37 days at 6 of the 14 stream sites in the Milwaukee Metropolitan Sewerage District planning area to evaluate potential toxicity and concentrations of selected constituents in stream water.
Biological Community Assessment 7
Although an evaluation of flow effects on biota is beyond the scope of this report, an increase in these so-called “flashy” high flows is common in many of the study streams with high percentages of developed land and impervious urban surfaces (Richards and others, 2010; Steuer and others, 2010)
Algae
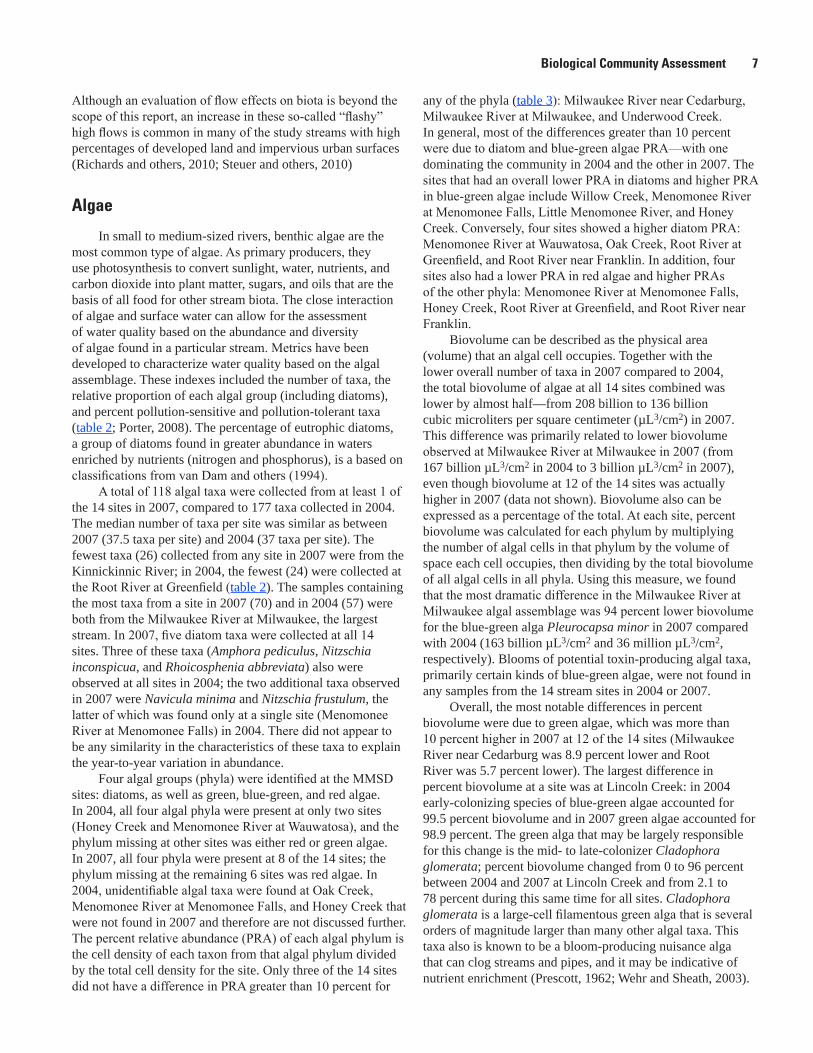
In small to medium-sized rivers, benthic algae are the most common type of algae. As primary producers, they use photosynthesis to convert sunlight, water, nutrients, and carbon dioxide into plant matter, sugars, and oils that are the basis of all food for other stream biota. The close interaction of algae and surface water can allow for the assessment of water quality based on the abundance and diversity of algae found in a particular stream. Metrics have been developed to characterize water quality based on the algal assemblage. These indexes included the number of taxa, the relative proportion of each algal group (including diatoms), and percent pollution-sensitive and pollution-tolerant taxa (table 2; Porter, 2008). The percentage of eutrophic diatoms, a group of diatoms found in greater abundance in waters enriched by nutrients (nitrogen and phosphorus), is a based on classifications from van Dam and others (1994).
A total of 118 algal taxa were collected from at least 1 of the 14 sites in 2007, compared to 177 taxa collected in 2004. The median number of taxa per site was similar as between 2007 (37.5 taxa per site) and 2004 (37 taxa per site). The fewest taxa (26) collected from any site in 2007 were from the Kinnickinnic River; in 2004, the fewest (24) were collected at the Root River at Greenfield (table 2). The samples containing the most taxa from a site in 2007 (70) and in 2004 (57) were both from the Milwaukee River at Milwaukee, the largest stream. In 2007, five diatom taxa were collected at all 14 sites. Three of these taxa (Amphora pediculus, Nitzschia inconspicua, and Rhoicosphenia abbreviata) also were observed at all sites in 2004; the two additional taxa observed in 2007 were Navicula minima and Nitzschia frustulum, the latter of which was found only at a single site (Menomonee River at Menomonee Falls) in 2004. There did not appear to be any similarity in the characteristics of these taxa to explain the year-to-year variation in abundance.
Four algal groups (phyla) were identified at the MMSD sites: diatoms, as well as green, blue-green, and red algae. In 2004, all four algal phyla were present at only two sites (Honey Creek and Menomonee River at Wauwatosa), and the phylum missing at other sites was either red or green algae. In 2007, all four phyla were present at 8 of the 14 sites; the phylum missing at the remaining 6 sites was red algae. In 2004, unidentifiable algal taxa were found at Oak Creek, Menomonee River at Menomonee Falls, and Honey Creek that were not found in 2007 and therefore are not discussed further. The percent relative abundance (PRA) of each algal phylum is the cell density of each taxon from that algal phylum divided by the total cell density for the site. Only three of the 14 sites did not have a difference in PRA greater than 10 percent for
any of the phyla (table 3): Milwaukee River near Cedarburg, Milwaukee River at Milwaukee, and Underwood Creek. In general, most of the differences greater than 10 percent were due to diatom and blue-green algae PRA—with one dominating the community in 2004 and the other in 2007. The sites that had an overall lower PRA in diatoms and higher PRA in blue-green algae include Willow Creek, Menomonee River at Menomonee Falls, Little Menomonee River, and Honey Creek. Conversely, four sites showed a higher diatom PRA: Menomonee River at Wauwatosa, Oak Creek, Root River at Greenfield, and Root River near Franklin. In addition, four sites also had a lower PRA in red algae and higher PRAs of the other phyla: Menomonee River at Menomonee Falls, Honey Creek, Root River at Greenfield, and Root River near Franklin.
Biovolume can be described as the physical area (volume) that an algal cell occupies. Together with the lower overall number of taxa in 2007 compared to 2004, the total biovolume of algae at all 14 sites combined was lower by almost half—from 208 billion to 136 billion cubic microliters per square centimeter (µL3/cm2) in 2007. This difference was primarily related to lower biovolume observed at Milwaukee River at Milwaukee in 2007 (from 167 billion µL3/cm2 in 2004 to 3 billion µL3/cm2 in 2007), even though biovolume at 12 of the 14 sites was actually higher in 2007 (data not shown). Biovolume also can be expressed as a percentage of the total. At each site, percent biovolume was calculated for each phylum by multiplying the number of algal cells in that phylum by the volume of space each cell occupies, then dividing by the total biovolume of all algal cells in all phyla. Using this measure, we found that the most dramatic difference in the Milwaukee River at Milwaukee algal assemblage was 94 percent lower biovolume for the blue-green alga Pleurocapsa minor in 2007 compared with 2004 (163 billion µL3/cm2 and 36 million µL3/cm2, respectively). Blooms of potential toxin-producing algal taxa, primarily certain kinds of blue-green algae, were not found in any samples from the 14 stream sites in 2004 or 2007.
Overall, the most notable differences in percent biovolume were due to green algae, which was more than 10 percent higher in 2007 at 12 of the 14 sites (Milwaukee River near Cedarburg was 8.9 percent lower and Root River was 5.7 percent lower). The largest difference in percent biovolume at a site was at Lincoln Creek: in 2004 early-colonizing species of blue-green algae accounted for 99.5 percent biovolume and in 2007 green algae accounted for 98.9 percent. The green alga that may be largely responsible for this change is the mid- to late-colonizer Cladophora glomerata; percent biovolume changed from 0 to 96 percent between 2004 and 2007 at Lincoln Creek and from 2.1 to 78 percent during this same time for all sites. Cladophora glomerata is a large-cell filamentous green alga that is several orders of magnitude larger than many other algal taxa. This taxa also is known to be a bloom-producing nuisance alga that can clog streams and pipes, and it may be indicative of nutrient enrichment (Prescott, 1962; Wehr and Sheath, 2003).

8 Biological Water-Quality Assessment, Milwaukee Metropolitan Sewerage District Planning Area, Wisconsin, 2007Ta
ble
2.
Alga
l ass
embl
age
info
rmat
ion
from
one
-tim
e su
rvey
s co
nduc
ted
in S
epte
mbe
r 200
7 at
14
stre
ams
in th
e M
ilwau
kee
Met
ropo
litan
Sew
erag
e Di
stric
t pla
nnin
g ar
ea,
Wis
cons
in.
[Per
cent
of e
utro
phic
dia
tom
s is t
he su
m o
f mes
o-eu
troph
ic, e
utro
phic
, pol
ytro
phic
, and
eur
ytro
phic
; µL,
mic
rolit
ers;
cm
2 , squ
are
cent
imet
er]
Site
Num
ber o
f Ta
xa
Bio
volu
me
(µ
L/cm
2 *
106 )
Cell
dens
ity
(cel
ls/c
m2 *
10
6 )
Shan
non
inde
x of
di
vers
ity
Perc
ent o
f nu
isan
ce
alga
e
Perc
ent d
iato
ms
Eutr
ophi
cPo
llutio
n-to
lera
ntPo
llutio
n-m
oder
ate
Pollu
tion-
sens
itive
Milw
auke
e R
iver
nea
r Ced
arbu
rg50
29,
944
811.
570.
041
93.0
23.3
37.3
32.3
Linc
oln
Cre
ek a
t 47t
h St
reet
at M
ilwau
kee
40 5
3,11
8 16
1.49
1.2
92.3
27.7
46.0
19.5
Milw
auke
e R
iver
at M
ilwau
kee
57 2
,607
.5
6.9
1.70
0.65
92.4
11.7
46.1
35.7
Will
ow C
reek
at M
aple
Roa
d ne
ar G
erm
anto
wn
43 4
,170
.4
1.5
1.69
0.39
94.2
16.1
35.4
42.5
Men
omon
ee R
iver
at M
enom
onee
Fal
ls32
506
.6
3.0
1.46
095
.32.
286.
0385
.7Li
ttle
Men
omon
ee R
iver
at M
ilwau
kee
30 3
,307
.2
161.
710
96.2
26.2
31.4
39.0
Und
erw
ood
Cre
ek a
t Wau
wat
osa
35 1
,148
.1
131.
470
93.4
10.6
67.0
15.7
Hon
ey C
reek
at W
auw
atos
a29
21,
965
8.6
1.47
0.38
98.3
8.41
70.5
19.4
Men
omon
ee R
iver
at W
auw
atos
a32
3,7
51.6
12
1.53
8.4
96.8
11.1
76.3
9.42
Kin
nick
inni
c R
iver
at S
. 11t
h St
reet
at M
ilwau
kee
26 4
,417
.0
2.4
1.40
0.26
98.9
15.9
22.6
60.1
Oak
Cre
ek a
t Sou
th M
ilwau
kee
48 3
,565
.1
2.7
2.07
095
.015
.745
.224
.9R
oot R
iver
at G
rang
e Ave
nue
at G
reen
field
30 1
,476
.0
3.2
1.67
098
.93.
7624
.456
.0R
oot R
iver
nea
r Fra
nklin
49 2
,690
.4
6.1
2.20
090
.810
.329
.747
.4Je
wel
Cre
ek a
t Mus
kego
50 4
,074
.9
8.5
1.78
085
.91.
8217
.465
.5

Biological Community Assessment 9Ta
ble
3.
Com
paris
on o
f alg
al-a
ssem
blag
e da
ta fr
om o
ne-ti
me
surv
eys
at 1
4 st
ream
s in
the
Milw
auke
e M
etro
polit
an S
ewer
age
Dist
rict P
lann
ing
area
, Wis
cons
in, 2
004
and
2007
.
[Hig
hlig
hted
val
ues r
epre
sent
a d
iffer
ence
of 1
0 pe
rcen
t or g
reat
er b
etw
een
the
two
sam
plin
g ev
ents
. The
per
cent
rela
tive
abun
danc
e an
d pe
rcen
t tol
eran
ce v
alue
s hav
e be
en u
pdat
ed fr
om o
rigin
al ta
ble.
]
Site
Colle
ctio
n Ye
ar
Perc
ent r
elat
ive
abun
danc
e of
alg
ae
(per
cent
cel
l den
sity
)Pe
rcen
t bio
volu
me
of a
lgae
Perc
ent r
elat
ive
abun
danc
e of
dia
tom
s
Dia
tom
sG
reen
Blu
e-
Gre
enRe
dD
iato
ms
Gre
enB
lue-
G
reen
Red
Pollu
tion-
tole
rant
Pollu
tion-
mod
erat
ePo
llutio
n-se
nsiti
veU
nkno
wn
Tole
ranc
e
Milw
auke
e R
iver
nea
r Ced
arbu
rg20
0416
.10.
483
.50.
011
.886
.51.
80.
01.
316
.563
.219
.020
0711
.03.
086
.00.
014
.777
.67.
70.
023
.337
.332
.37.
0D
iffer
ence
-5.2
2.6
2.5
0.0
2.9
-8.9
6.0
0.0
22.0
20.8
-30.
8-1
2.0
Linc
oln
Cre
ek a
t 47t
h St
reet
at M
ilwau
kee
2004
6.3
3.7
90.1
0.0
0.5
0.1
99.5
0.0
8.9
71.1
12.6
7.4
2007
7.0
14.0
79.0
0.0
0.5
99.0
0.5
0.0
27.7
46.0
19.5
6.9
Diff
eren
ce0.
710
.3-1
1.1
0.0
0.0
98.9
-98.
90.
018
.8-2
5.1
6.8
-0.5
Milw
auke
e R
iver
at M
ilwau
kee
2004
26.4
1.1
72.5
0.0
1.7
0.0
98.3
0.0
5.7
38.1
44.7
11.5
2007
20.1
9.5
70.3
0.0
15.9
79.9
4.2
0.0
11.7
46.1
35.7
6.5
Diff
eren
ce-6
.28.
4-2
.20.
014
.279
.8-9
4.0
0.0
5.9
8.0
-8.9
-5.0
Will
ow C
reek
at M
aple
Roa
d ne
ar G
erm
anto
wn
2004
58.7
1.4
39.8
0.0
53.5
43.7
2.8
0.0
13.2
13.8
65.2
7.8
2007
23.9
5.4
64.9
5.8
2.6
95.3
1.2
1.0
16.1
35.4
42.5
5.9
Diff
eren
ce-3
4.9
4.0
25.1
5.8
-50.
951
.5-1
.61.
03.
021
.6-2
2.7
-1.9
Men
omon
ee R
iver
at M
enom
onee
Fal
ls20
0430
.20.
053
.016
.847
.90.
02.
849
.35.
433
.753
.57.
420
0715
.15.
275
.34.
350
.623
.913
.312
.22.
36.
085
.76.
0D
iffer
ence
-15.
05.
222
.3-1
2.5
2.7
23.9
10.5
-37.
1-3
.1-2
7.7
32.2
-1.4
Littl
e M
enom
onee
Riv
er a
t Milw
auke
e20
0422
.30.
070
.07.
655
.10.
05.
439
.55.
753
.333
.37.
720
0711
.34.
579
.54.
79.
762
.416
.911
.026
.231
.439
.03.
4D
iffer
ence
-11.
04.
59.
4-2
.9-4
5.4
62.4
11.5
-28.
520
.5-2
1.9
5.7
-4.3
Und
erw
ood
Cre
ek a
t Wau
wat
osa
2004
8.1
1.9
90.0
0.0
47.1
4.9
47.9
0.0
9.3
41.5
45.0
4.2
2007
14.7
2.8
82.5
0.0
23.6
19.0
57.4
0.0
10.6
67.0
15.7
6.8
Diff
eren
ce6.
60.
9-7
.60.
0-2
3.6
14.1
9.5
0.0
1.2
25.5
-29.
32.
6
Hon
ey C
reek
at W
auw
atos
a20
0444
.30.
428
.426
.971
.90.
80.
826
.68.
360
.028
.73.
020
0716
.43.
080
.60.
01.
198
.30.
60.
08.
470
.519
.41.
7D
iffer
ence
-27.
92.
652
.2-2
6.9
-70.
897
.5-0
.1-2
6.6
0.1
10.5
-9.2
-1.3
Men
omon
ee R
iver
at W
auw
atos
a20
048.
30.
291
.00.
647
.50.
147
.94.
68.
458
.727
.95.
120
0720
.28.
469
.61.
76.
484
.56.
42.
811
.176
.39.
43.
2D
iffer
ence
12.0
8.2
-21.
41.
2-4
1.1
84.4
-41.
5-1
.82.
717
.6-1
8.4
-1.9
Kin
nick
inni
c R
iver
at S
. 11t
h St
reet
at M
ilwau
kee
2004
12.2
0.6
87.2
0.0
68.0
0.6
31.4
0.0
28.3
41.3
19.3
11.1
2007
21.6
5.9
72.5
0.0
4.6
94.5
0.9
0.0
15.9
22.6
60.1
1.4
Diff
eren
ce9.
45.
3-1
4.7
0.0
-63.
493
.9-3
0.5
0.0
-12.
4-1
8.7
40.8
-9.7

10 Biological Water-Quality Assessment, Milwaukee Metropolitan Sewerage District Planning Area, Wisconsin, 2007Ta
ble
3.
Com
paris
on o
f alg
al-a
ssem
blag
e da
ta fr
om o
ne-ti
me
surv
eys
at 1
4 st
ream
s in
the
Milw
auke
e M
etro
polit
an S
ewer
age
Dist
rict P
lann
ing
area
, Wis
cons
in, 2
004
and
20
07.—
Cont
inue
d
[Hig
hlig
hted
val
ues r
epre
sent
a d
iffer
ence
of 1
0 pe
rcen
t or g
reat
er b
etw
een
the
two
sam
plin
g ev
ents
. The
per
cent
rela
tive
abun
danc
e an
d pe
rcen
t tol
eran
ce v
alue
s hav
e be
en u
pdat
ed fr
om o
rigin
al ta
ble.
]
Site
Colle
ctio
n Ye
ar
Perc
ent r
elat
ive
abun
danc
e of
alg
ae
(per
cent
cel
l den
sity
)Pe
rcen
t bio
volu
me
of a
lgae
Perc
ent r
elat
ive
abun
danc
e of
dia
tom
s
Dia
tom
sG
reen
Blu
e-
Gre
enRe
dD
iato
ms
Gre
enB
lue-
G
reen
Red
Pollu
tion-
tole
rant
Pollu
tion-
mod
erat
ePo
llutio
n-se
nsiti
veU
nkno
wn
Tole
ranc
e
Oak
Cre
ek a
t Sou
th M
ilwau
kee
2004
33.0
0.0
59.2
7.8
59.9
0.0
5.9
34.2
8.8
52.2
31.0
8.1
2007
43.0
8.6
35.0
13.5
46.7
47.6
1.0
4.8
15.7
45.2
24.9
14.2
Diff
eren
ce10
.08.
6-2
4.3
5.7
-13.
247
.6-4
.9-2
9.4
6.9
-7.0
-6.0
6.1
Roo
t Riv
er a
t Gra
nge A
venu
e at
Gre
enfie
ld20
0410
.20.
02.
986
.910
.80.
00.
388
.95.
838
.743
.312
.220
0730
.421
.86.
241
.619
.937
.50.
242
.53.
824
.456
.015
.9D
iffer
ence
20.2
21.8
3.3
-45.
39.
137
.5-0
.1-4
6.4
-2.1
-14.
312
.63.
7
Roo
t Riv
er n
ear F
rank
lin20
0411
.20.
037
.151
.717
.30.
04.
478
.317
.015
.860
.56.
720
0746
.73.
233
.816
.471
.15.
75.
717
.510
.329
.747
.412
.5D
iffer
ence
35.5
3.2
-3.3
-35.
353
.85.
71.
3-6
0.8
-6.7
13.9
-13.
15.
9
Jew
el C
reek
at M
uske
go20
0438
.50.
019
.941
.663
.60.
01.
335
.13.
011
.767
.218
.220
0728
.112
.817
.541
.635
.821
.21.
841
.21.
817
.465
.515
.3D
iffer
ence
-10.
412
.8-2
.30.
0-2
7.8
21.2
0.5
6.1
-1.2
5.7
-1.7
-2.9

Biological Community Assessment 11
In 2004, this taxa was collected only at Milwaukee River near Cedarburg (0.83 percent biovolume) even though its presence was mentioned in field notes for four other sites; however, in 2007, it was collected in samples at six additional sites (Lincoln Creek, Milwaukee River at Milwaukee, Willow Creek, Honey Creek, Menomonee River at Wauwatosa, and Kinnickinnic River), and represented 32 percent of the total biovolume across all sites. Biovolume of green algae at all six of these additional sites was more than 50 percent higher in 2007. Increases in temperature, light, and (or) nutrients could be responsible for these higher percentages of green algae but evaluation of these factors is beyond the scope of this report. Other nuisance algae present in 2007 samples included Stigeoclonium lubricum. Like C. glomerata, this taxa is a green alga that is common in streams and lakes receiving high loads of nutrients, especially phosphorus, in the Great Lakes area (Prescott, 1962; Wehr and Sheath, 2003). S. lubricum was collected at three sites (Lincoln Creek, Milwaukee River at Milwaukee, and Menomonee River at Wauwatosa), but was not found at Underwood Creek, as it had been in 2004.
The relative abundance of diatoms classified as pollution tolerant or pollution sensitive in a stream may be an indicator of water quality (Lange-Bertalot, 1979; Bahls, 1993). In streams with impaired water quality, a greater proportion of diatom taxa would be expected to be comprised of taxa that are tolerant to pollution, with the opposite being true in more pristine streams. For example, fewer pollution-sensitive taxa at a site indicate that, for a given stream, at least one of the variables that make up the pollution-tolerance classes—such as nutrient concentration, saprobic conditions (providing nutrients for nuisance algae), biological oxygen demand (BOD), and toxic chemicals—is elevated and not suited for pollution-sensitive taxa (Bahls, 1993). Most streams have some level of pollution-tolerant taxa, which are usually relatively common and cosmopolitan. However, pollution tolerant taxa that begin to dominate the algal assemblage indicate that water quality is degrading to a point at which the pollution-sensitive taxa cannot survive. Therefore, a difference in the relative proportion of pollution-tolerant or pollution-sensitive taxa can indicate that water quality is better (increased number of sensitive taxa) or worse (increased number of tolerant taxa).
Substantial differences in pollution-tolerant and pollution-sensitive diatoms were noted between 2004 and 2007 for some sites (table 3). Pollution-tolerant diatom abundance in 2007 was 22 percent higher at Milwaukee River near Cedarburg compared to the abundance in 2004; pollution-sensitive diatom abundance in 2007 was 31 percent lower (fig. 4). The percentages of pollution-tolerant taxa at Lincoln Creek and Little Menomonee River were higher in 2007 (19 and 20 percent higher, respectively). The only stream to have a relatively large negative difference in pollution tolerant diatoms was the Kinnickinnic River, from 28 percent in 2004 to 16 percent in 2007. Additionally, the proportion of pollution-sensitive diatoms was 54 percent in 2004 and 86 percent in 2007 at Menomonee River at Menomonee Falls; 19 and 60 percent at Kinnickinnic River; and 43 and 56 percent at the Root River at Greenfield. The proportions of pollution-sensitive diatoms were 65 percent in 2004 and 42 percent in 2007 at Willow Creek, 45 and 16 percent at Underwood Creek, and 28 and 9 percent at Menomonee River at Wauwatosa.
Several streams, including the Milwaukee River near Cedarburg, Lincoln Creek, Little Menomonee River, and Menomonee River at Wauwatosa, indicate high nutrient loading and high concentrations of other pollutants based on the occurrence of nuisance algae and the proportion of diatoms in various pollution classes. Samples from these sites contained taxa that could develop into large blooms of nuisance algae, creating issues of aesthetics, odor, and water quality as they die and begin to decay. Streams with low percentages of pollution-sensitive diatoms indicate that at least one of the variables that are used to determine pollution-sensitivity is elevated and that those rivers cannot sustain a large percentage of pollution-sensitive taxa. Lincoln Creek, Underwood Creek, Honey Creek, Menomonee River at Wauwatosa, and Oak Creek have less than 30 percent pollution-sensitive diatoms. Ten of the 14 sites sampled in the MMSD planning area are of concern for water quality, based on either the occurrence of nuisance algae or a low abundance of pollution-sensitive diatoms. Four streams do not fall into this class: Menomonee River at Menomonee Falls, Root River at Greenfield, Root River at Franklin, and Jewel Creek.

12 Biological Water-Quality Assessment, Milwaukee Metropolitan Sewerage District Planning Area, Wisconsin, 2007
Invertebrates
Invertebrate assemblages were evaluated by the number of their taxa, Shannon Diversity Index, percentage of taxa or individuals in the aquatic insect orders Ephemeroptera-Plecoptera-Trichoptera (EPT; also known as mayflies, stoneflies, and caddisflies), the Hilsenhoff Biotic Index (HBI-10), and the Index of Biotic Integrity (table 4).
The number of taxa and Shannon Diversity Index scores generally decrease with degrading water quality. The highest numbers of invertebrate taxa (42 species and 36 genera) and the highest Shannon diversity score (4.14) in 2007 were found at the Milwaukee River at Milwaukee (table 5).
Figure 4. Diatom classifications for 14 streams sampled for the Milwaukee Metropolitan Sewerage District planning area, Wisconsin, in 2004 and 2007.
Table 4. Water-quality ratings for the invertebrate Hilsenhoff Biotic Index and Index of Biotic Integrity for streams.
[(HBI, Hilsenhoff Biotic Index (Hilsenhoff, 1987); HBI-10, modified HBI (Hilsenhoff, 1998); IBI, Index of Biotic Integrity (Weigel, 2003); >, greater than; <, less than; ≤, less than or equal to]
HBI/HBI-10 value
Water-quality rating
Invertebrate IBI value
≤3.50 Excellent >83.51– 4.50 Very good4.51– 5.50 Good 6 – 85.51– 6.50 Fair 4 – 66.51– 7.50 Fairly poor7.51– 8.50 Poor 2 – 4
8.51– 10.00 Very poor <2
AAXXXX_fig 01
0%
10%
20%
30%
40%
50%
60%
70%
80%
90%
100%M
RC_2
004
MRC
_200
7
LCM
_200
4
LCM
_200
7
MRM
_200
4
MRM
_200
7
WCG
_200
4
WCG
_200
7
MRM
F_20
04
MRM
F_20
07
LMM
_200
4
LMM
_200
7
UCW
_200
4
UCW
_200
7
HCW
_200
4
HCW
_200
7
MRW
_200
4
MRW
_200
7
KRM
_200
4
KRM
_200
7
OCSM
_200
4
OCSM
_200
7
RRG_
2004
RRG_
2007
RRF_
2004
RRF_
2007
JCM
_200
4
JCM
_200
7
Sites, arranged in downstream order
Most-tolerant Moderately tolerant Sensitive UnknownEXPLANATION
Rela
tive
abun
danc
e of
dia
tom
s in
eac
h po
llutio
n-to
lera
nce
clas
s, in
per
cent

Biological Community Assessment 13Ta
ble
5.
Inve
rtebr
ate-
asse
mbl
age
info
rmat
ion
from
one
-tim
e su
rvey
s co
nduc
ted
in S
epte
mbe
r 200
7 at
14
stre
am s
ites
in th
e M
ilwau
kee
Met
ropo
litan
Sew
erag
e Di
stric
t pl
anni
ng a
rea,
Wis
cons
in.
[EPT
, Eph
emer
opte
ra (M
ayfli
es),
Plec
opte
ra (S
tone
flies
), an
d Tr
icho
pter
a (C
addi
sflie
s); H
BI-
10, m
odifi
ed H
ilsen
hoff
Bio
tic In
dex;
IBI,
Inde
x of
Bio
tic In
tegr
ity]
Site
Num
ber o
f sp
ecie
sN
umbe
r of
gene
ra
Shan
non
inde
x of
di
vers
ity
Perc
ent
of
EPT
in
divi
dual
s
Perc
ent
of
EPT
taxa
HB
I-10
1IB
I2
Val
ueRa
ting
Valu
eRa
ting
Milw
auke
e R
iver
nea
r Ced
arbu
rg26
233.
5562
484.
79G
ood
6.25
Goo
dLi
ncol
n C
reek
at 4
7th
Stre
et a
t Milw
auke
e 32
242.
6027
216.
46Fa
ir3.
78Po
orM
ilwau
kee
Riv
er a
t Milw
auke
e42
364.
1458
395.
52Fa
ir7.
94G
ood
Will
ow C
reek
at M
aple
Roa
d ne
ar G
erm
anto
wn
3329
3.94
2621
5.61
Fair
4.99
Fair
Men
omon
ee R
iver
at M
enom
onee
Fal
ls24
223.
2770
324.
77G
ood
3.91
Poor
Littl
e M
enom
onee
Riv
er a
t Milw
auke
e22
182.
5815
176.
57Fa
irly
Poor
3.44
Poor
Und
erw
ood
Cre
ek a
t Wau
wat
osa
2117
2.64
112
6.66
Fairl
y Po
or3.
78Po
orH
oney
Cre
ek a
t Wau
wat
osa
1714
2.96
4736
5.81
Fair
4.12
Fair
Men
omon
ee R
iver
at W
auw
atos
a22
172.
2127
295.
85Fa
ir4.
54Fa
irK
inni
ckin
nic
Riv
er a
t S. 1
1th
Stre
et a
t Milw
auke
e21
162.
0447
316.
09Fa
ir4.
13Fa
irO
ak C
reek
at S
outh
Milw
auke
e32
263.
6138
195.
77Fa
ir4.
34Fa
irR
oot R
iver
at G
rang
e Ave
nue
at G
reen
field
2521
3.38
3019
5.73
Fair
3.75
Poor
Roo
t Riv
er n
ear F
rank
lin27
242.
8667
255.
73Fa
ir3.
56Po
orJe
wel
Cre
ek a
t Mus
kego
3729
3.31
5917
5.79
Fair
2.87
Poor
1 Hils
enho
ff, 1
987
and
1998
.2 W
eige
l, 20
03.

14 Biological Water-Quality Assessment, Milwaukee Metropolitan Sewerage District Planning Area, Wisconsin, 2007
All else being equal, higher numbers of taxa and higher diversity are expected at larger streams compared to smaller streams; however, this may not be the case in disturbed streams. Willow Creek, a much smaller stream, ranked next highest for diversity score (3.94). The lowest numbers of invertebrate taxa (17 species and 14 genera) were found at Honey Creek; however, Underwood Creek (21 species and 17 genera), Kinnickinnic River (21 species and 16 genera), Little Menomonee River (22 species and 18 genera), and Menomonee River at Wauwatosa (22 species and 17 genera) also ranked similarly in number of taxa, underscoring the poor quality invertebrate assemblages at these sites. These findings suggest that the water quality at these sites was more degraded than at other sampled sites.
EPT invertebrates generally are considered to be relatively intolerant of degraded water quality (Lenat, 1988). Intolerant organisms tend to dominate in streams with good water quality, whereas tolerant organisms dominate in streams with degraded water quality; therefore, the percentages of EPT individuals and of EPT genera tend to decrease as water quality degrades. The highest percentages of EPT taxa in samples collected in 2007 were from the Milwaukee River sites near Cedarburg (48 percent) and at Milwaukee (39 percent). Invertebrate assemblages at Underwood Creek and Little Menomonee River had the lowest percentages of EPT taxa (12 and 17 percent, respectively) and individuals (1 and 15 individuals, respectively). The high value for percent EPT taxa at Honey Creek may be misleading because the EPT taxa at this site are known to be relatively pollution-tolerant (Barbour and others, 1999). Historically, the Middle and Lower Root River Phase I subwatersheds had much higher median EPT percentages than the Upper Root River or East Branch Root River subwatersheds, suggesting that water quality was less degraded at the lower subwatersheds (Schneider, Lutz, and others, 2004). The 2004 and 2007 samples for Root River near Franklin (Middle Root River subwatershed) had much lower percentages of EPT taxa (28 and 25 percent, respectively) compared to historical percentages (median of 50 percent EPT taxa) (fig. 5). However, although historical data indicated that EPT taxa were few or absent from the Lincoln Creek subwatershed, samples from 2004 and 2007 indicated a higher percentage of EPT taxa (18 and 21 percent, respectively), suggesting that water quality was better (Lenz and Rheaume, 2000; Schneider, Lutz, and others, 2004).
The two biotic indexes used to assess invertebrate assemblages were the HBI-10 (Hilsenhoff 1987, 1998) and an invertebrate Index of Biotic Integrity (IBI; Weigel, 2003). The original Hilsenhoff Biotic Index (HBI) was designed to
assess oxygen depletion in streams resulting from an excess of organic matter such as manure or sewage (Hilsenhoff, 1987); however, the index also may be sensitive to other types of pollution, such as that from metals or some manmade chemicals. The HBI represents the number of arthropod invertebrates in certain families or species, multiplied by their respective pollution-tolerance score, divided by the number of arthropods in the sample. HBI values can range from 0.00 (“excellent” water quality) to 10.00 (“very poor” water quality). A modification of the HBI, the HBI-10, was used in the Phase II and Phase III analyses because it limits the number of individuals per taxa to 10 for computation of the index. The HBI-10 is thought to be more accurate than the HBI because it is less affected by dominance of a single taxon (Hilsenhoff, 1998). Invertebrate IBI values also can range from 0.00 to 10.00, but its ratings are opposite to those of the HBI (Weigel, 2003). HBI-10 scores for 2007 invertebrate samples ranged from values indicating “fairly poor” water quality at Little Menomonee River and at Underwood Creek, to “good” at two sites (Menomonee River at Menomonee Falls and Milwaukee River near Cedarburg); all other sampled sites had a value indicating “fair” water quality (table 5). The Milwaukee River near Cedarburg was rated “good” using both the HBI-10 and the IBI; however, the Menomonee River at Menomonee Falls dropped from “good” using the HBI-10 to “poor” using the IBI. The reason for the difference in ratings between these two metrics is unclear but could perhaps be due to the fact that the IBI weights the percentage of EPT taxa. IBI ratings at only six sites agreed with HBI ratings; seven sites rated lower for the IBI and received “poor” ratings. However, the HBI-10 rated Milwaukee River at Milwaukee “fair”, while the IBI rated it “good”, and other measures that showed relatively high number of taxa, diversity, and EPT measures for this site supported the “good” IBI rating.
When 2004 and 2007 data are compared, results across invertebrate measures were not entirely consistent for a given site (table 6). Even so, relatively consistent negative differences were found for the Little Menomonee River, for Underwood Creek, and for Honey Creek (fig. 6). Within-site differences in invertebrates and in water quality were not consistent at Menomonee River at Menomonee Falls, despite a higher number of taxa, diversity, and the HBI-10 rating. Additional sampling at these sites could help establish whether these differences reflect improvements in the invertebrate assemblages at these sites. Lincoln Creek received a “fair” rating in 2004 and in 2007, based on the HBI-10. Although Lincoln Creek showed a higher number of taxa in 2007, diversity was lower due to dominance by individuals of only a few species; percent EPT showed no notable difference.

Biological Community Assessment 15
88°10' 87°50'42
°50'
43°1
0'
Lake Michigan
0 42 Miles
0 42 Kilometers
Base composited from Southeastern Wisconsin Regional Planning Commission regional base map, 1:2,000, 1995; U.S. Geological Survey digital line graph hydrography, 1:100,000, 1989;
Wisconsin Department of Natural Resources version 2 hydrography, 1:24,000, 2002. Wisconsin Transverse Mercator Projection, referenced to North American Datum of 1983, 1991 adjustment.
EXPLANATION
Water
Area within the MMSDplanning area
Watershed boundary
Subwatershed boundary
Stream
7–17
18–43
EPT index values, percentages2004 2007
44–51
OCSM
MRW
HCW
UCW
LMM
WCG
LCMMRM
MRMF
RRF
RRG
KRM
JCM
MRCMRC
OCSM
MRW
HCW
UCW
LMM
WCG
LCMMRM
MRMF
RRF
RRG
KRM
JCM
Figure 5. Invertebrate Ephemeroptera-Plecoptera-Trichoptera (EPT) index values at 14 stream sites in the Milwaukee Metropolitan Sewerage District planning area, Wisconsin, 2004 and 2007.
Figure 5. Invertebrate Ephemeroptera-Plecoptera-Trichoptera (EPT) index values at 14 stream sites in the Milwaukee Metropolitan Sewerage District planning area, Wisconsin, 2004 and 2007.

16 Biological Water-Quality Assessment, Milwaukee Metropolitan Sewerage District Planning Area, Wisconsin, 2007Ta
ble
6.
Com
paris
on o
f inv
erte
brat
e-as
sem
blag
e da
ta fr
om o
ne-ti
me
surv
eys
at 1
4 si
tes
in th
e M
ilwau
kee
Met
ropo
litan
Sew
erag
e Di
stric
t Pla
nnin
g ar
ea, W
isco
nsin
, 20
04 a
nd 2
007.
[Hig
hlig
hted
val
ues r
epre
sent
a d
iffer
ence
of 1
0 pe
rcen
t or g
reat
er b
etw
een
the
two
sam
plin
g ev
ents
; EPT
, Eph
emer
opte
ra (M
ayfli
es),
Plec
opte
ra (S
tone
flies
), an
d Tr
icho
pter
a (C
addi
sflie
s); H
BI-
10,
mod
ified
Hils
enho
ff B
iotic
Inde
x] Site
Co
llect
ion
year
Num
ber o
f sp
ecie
sN
umbe
r of
gene
ra
Shan
non
in
dex
of
dive
rsity
1
Pe
rcen
t of
EPT
taxa
HB
I-10
2
Val
ueRa
ting
Milw
auke
e R
iver
nea
r Ced
arbu
rg20
0445
393.
8651
5.01
Goo
d20
0726
233.
5548
4.79
Goo
dD
iffer
ence
-42.
2-4
1.0
-8.0
-3.0
-4.3
9N
o di
ffere
nce
Linc
oln
Cre
ek a
t 47t
h St
reet
at M
ilwau
kee
2004
2017
3.06
186.
30Fa
ir20
0732
242.
6021
6.46
Fair
Diff
eren
ce60
.041
.2-1
5.0
3.0
2.54
No
diffe
renc
e
Milw
auke
e R
iver
at M
ilwau
kee
2004
4641
3.70
395.
20G
ood
2007
4236
4.14
395.
52Fa
irD
iffer
ence
-8.7
-12.
212
.00.
06.
15Lo
wer
Will
ow C
reek
at M
aple
Roa
d ne
ar G
erm
anto
wn
2004
3229
3.94
175.
45G
ood
2007
3329
3.94
215.
61Fa
irD
iffer
ence
3.1
0.0
0.1
4.0
2.94
Low
erM
enom
onee
Riv
er a
t Men
omon
ee F
alls
2004
1816
2.29
445.
56Fa
ir20
0724
223.
2732
4.77
Goo
dD
iffer
ence
33.3
37.5
42.8
-12
-14.
2H
ighe
r
Littl
e M
enom
onee
Riv
er a
t Milw
auke
e20
0423
222.
2823
5.33
Goo
d20
0722
182.
5817
6.57
Fairl
y po
orD
iffer
ence
-4.3
-18.
213
.5-6
.023
.3Lo
wer
Und
erw
ood
Cre
ek a
t Wau
wat
osa
2004
3328
2.71
185.
96Fa
ir20
0721
172.
6412
6.66
Fairl
y po
orD
iffer
ence
-36.
4-3
9.3
-2.6
-6.0
11.7
Low
er
Hon
ey C
reek
at W
auw
atos
a20
0424
242.
7317
5.28
Goo
d20
0717
142.
9636
5.81
Fair
Diff
eren
ce-2
9.2
-41.
78.
4219
.010
.0Lo
wer
Men
omon
ee R
iver
at W
auw
atos
a20
0420
162.
6831
5.86
Fair
2007
2217
2.21
295.
85Fa
irD
iffer
ence
10.0
6.3
-17.
5-2
.0-0
.17
No
diffe
renc
e
Kin
nick
inni
c R
iver
at S
. 11t
h St
reet
at M
ilwau
kee
2004
3427
3.02
7.0
6.52
Fairl
y po
or20
0721
162.
0431
6.09
Fair
Diff
eren
ce-3
8.2
-40.
7-3
2.5
24-6
.60
Hig
her

Biological Community Assessment 17
Site
Co
llect
ion
year
Num
ber o
f sp
ecie
sN
umbe
r of
gene
ra
Shan
non
in
dex
of
dive
rsity
1
Pe
rcen
t of
EPT
taxa
HB
I-10
2
Val
ueRa
ting
Oak
Cre
ek a
t Sou
th M
ilwau
kee
2004
2823
2.86
225.
55Fa
ir20
0732
263.
6119
5.77
Fair
Diff
eren
ce14
.313
.026
.5-3
.03.
96N
o di
ffere
nce
Roo
t Riv
er a
t Gra
nge A
venu
e at
Gre
enfie
ld20
0423
222.
6918
6.15
Fair
2007
2521
3.38
195.
73Fa
irD
iffer
ence
8.7
-4.5
26.0
1.0
-6.8
3N
o di
ffere
nce
Roo
t Riv
er n
ear F
rank
lin20
0431
253.
3528
5.92
Fair
2007
2724
2.86
255.
73Fa
irD
iffer
ence
-12.
9-4
.0-1
4.6
-3.0
-3.2
1N
o di
ffere
nce
Jew
el C
reek
at M
uske
go20
0428
243.
0729
5.58
Fair
2007
3729
3.31
175.
79Fa
irD
iffer
ence
32.1
20.8
7.88
-12
3.76
No
diffe
renc
e1 O
dum
, 197
1.2 H
ilsen
hoff,
198
7 an
d 19
98.
Tabl
e 6.
Co
mpa
rison
of i
nver
tebr
ate-
asse
mbl
age
data
from
one
-tim
e su
rvey
s at
14
site
s in
the
Milw
auke
e M
etro
polit
an S
ewer
age
Dist
rict P
lann
ing
area
, Wis
cons
in,
2004
and
200
7.—
Cont
inue
der
[Hig
hlig
hted
val
ues r
epre
sent
a d
iffer
ence
of 1
0 pe
rcen
t or g
reat
er b
etw
een
the
two
sam
plin
g ev
ents
; EPT
, Eph
emer
opte
ra (M
ayfli
es),
Plec
opte
ra (S
tone
flies
), an
d Tr
icho
pter
a (C
addi
sflie
s); H
BI-
10,
mod
ified
Hils
enho
ff B
iotic
Inde
x]

18 Biological Water-Quality Assessment, Milwaukee Metropolitan Sewerage District Planning Area, Wisconsin, 2007
88°10' 87°50'
42°5
0'43
°10'
Lake Michigan
0 42 Miles
0 42 Kilometers
Base composited from Southeastern Wisconsin Regional Planning Commission regional base map, 1:2,000, 1995; U.S. Geological Survey digital line graph hydrography, 1:100,000, 1989;
Wisconsin Department of Natural Resources version 2 hydrography, 1:24,000, 2002. Wisconsin Transverse Mercator Projection, referenced to North American Datum of 1983, 1991 adjustment.
EXPLANATION
Water
Area within the MMSDplanning area
Watershed boundary
Subwatershed boundary
Stream
5.51–6.50 (fair)
HBI–10 scores and categories
4.77–5.50 (good)
2004 2007
6.51–6.66 (fairly poor)
OCSM
MRW
HCW
UCW
LMM
WCG
LCMMRM
MRMF
RRF
RRG
KRM
JCM
MRCMRC
OCSM
MRW
HCW
UCW
LMM
WCG
LCMMRM
MRMF
RRF
RRG
KRM
JCM
Figure 6. Invertebrate Hilsenhoff Biotic Index (HBI-10) values at 14 stream sites in the Milwaukee Metropolitan Sewerage District planning area, Wisconsin, 2004 and 2007.
Figure 6. Invertebrate Hilsenhoff Biotic Index (HBI-10) values at 14 stream sites in the Milwaukee Metropolitan Sewerage District planning area, Wisconsin, 2004 and 2007.

Biological Community Assessment 19
Fish
Biological integrity is commonly defined as “the capability of supporting and maintaining a balanced, integrated, adaptive community of organisms having a species composition, diversity, and functional organization comparable to that of natural habitat of the region” (Karr and Dudley, 1981; also see Frey, 1977). The use of attributes of fish assemblages has been shown to be a useful means to assess biotic integrity and environmental quality of streams (Karr, 1981; Karr and others, 1986; Lyons, 1992). Fish Index of Biotic Integrity (IBI) scores, which were computed according to Lyons (1992) and can range from 65 or greater (“excellent”) to 0 (“very poor”), are shown in table 7.
A total of 31 fish species were collected at at least 1 of the 14 sites in 2007, compared to 38 species collected in 2004. However, five of the species not collected in 2007 were from the Milwaukee River near Cedarburg, where sampling was limited to a single pass due to weather conditions and thus the sample may be biased low. The most species collected at a single site in 2007 was 19 at Milwaukee River at Milwaukee, compared to 21 species collected in 2004 at the Milwaukee River near Cedarburg (table 8). The largest negative difference in species number was at the Root River where only 4 species were captured in 2007, compared to 12 in 2004. The largest positive difference was at Willow Creek, where the number of species collected in 2007 (12) was twice that collected in 2004 (6). The number of species collected in 2007 was the same or higher at seven sites and lower at seven sites, compared to 2004 results.
The median number of individual fish collected per site in 2007 was 157, compared to a median of 200 fish collected per site in 2004. In 2007, the most individual fish (1,051) were collected at Underwood Creek and the fewest (2) at Kinnickinnic River (table 8). In 2004, the most individual fish (511) were collected at Jewel Creek and the fewest (11) were again collected at Kinnickinnic River. The abundance of fish collected in 2007 was lower at eight sites compared to 2004 sampling efforts. At several sites, the number of fish captured in 2007 was considerably lower than the number captured in 2004. In 2004 at Root River at Greenfield, 179 fish were captured, and near Franklin, 183 fish were captured; in 2007, only 10 fish were captured at the first Root River site, and only 7 fish were caught at the second. At Oak Creek, 218 fish were captured in 2004, while only 35 fish were captured in 2007. Catch also was lower at Jewel Creek from 2004 (511 fish) to 2007 (144 fish). Without additional information, it is not possible to discern whether lower fish abundances at these sites in 2007 were due to degradation or due to area wide storms previously mentioned, that occurred about two and a half weeks prior to sampling of these sites. However, a similar pattern was not seen for algae or invertebrates, which were collected about a week and a half after fish were collected
Table 7. Scores and ratings for the fish Index of Biotic Integrity for warmwater streams.
[IBI, Index of Biotic Integrity (Lyons, 1992)]
IBI score IBI rating
100 – 65 Excellent 64 – 50 Good 49 – 30 Fair 29 – 20 Poor19 – 0 Very poor
No score Very poor
in September. Root River, Jewel Creek, Kinnickinnic River, and Oak Creek are all the sampled basins in the southern part of the MMSD planning area and these streams were consecutively sampled for fish. Captures of individual fish were dramatically higher at several sites, including the Menomonee River at Wauwatosa (119 in 2004, and 449 in 2007); Honey Creek (135 in 2004, and 521 in 2007); and Underwood Creek (256 in 2004, and 1,051 in 2007).
Fish IBI ratings based on 2007 sampling ranged from “excellent” (1 site) to “very poor” (6 sites). Two sites scored “good,” five sites were “fair,” and there were no sites rated “poor.” Compared to 2004 results, the 2007 results are slightly better: 7 sites received “very poor” ratings, 2 rated “poor,” 3 were “fair,” 1 was rated “good,” and 1 was rated “excellent” in 2004 (fig. 7). In 2007, not enough fish were collected at 5 of the 14 sites to compute a fish IBI score (table 8). A minimum of 50 fish must be collected in order for a valid IBI rating (Lyons, 1992); indeed, sites with fewer than the minimum number of individuals receive the IBI rating “very poor”. In 2004 sampling as part of Phase II, at only two sites were fewer than 50 fish collected. Fish IBI scores were worse at 3 sites and were better at 6.
The two Milwaukee River sites had the highest IBI scores for fish of the 14 study sites. The large size, diverse habitats, and good water quality of these sites provide suitable living space for a large number and variety of species, including desirable game fish such as smallmouth bass, northern pike, walleye, and pan fish. The upstream Milwaukee River site, located near the city of Cedarburg, scored an “excellent” IBI rating based samples of its fish population in both 2004 and 2007. At this site the Milwaukee River is a scenic, meandering stream with clear waters, a rocky substrate and habitat that supports a diverse variety of fish species including many sport fish—approximately 28 percent of the fish collected in 2007 were top carnivores such as northern pike, smallmouth bass, rock bass, and bluegill. The Milwaukee River at Milwaukee site had the greatest percentage of fish that were top carnivores (40 percent of the total number of fish captured).

20 Biological Water-Quality Assessment, Milwaukee Metropolitan Sewerage District Planning Area, Wisconsin, 2007Ta
ble
8.
Com
paris
on o
f fis
h-as
sem
blag
e da
ta fr
om o
ne-ti
me
surv
eys
at 1
4 si
tes
in th
e M
ilwau
kee
Met
ropo
litan
Sew
erag
e Di
stric
t Pla
nnin
g ar
ea, W
isco
nsin
, 200
4 an
d 20
07.
[ND
, no
data
; *, t
he W
isco
nsin
war
mw
ater
Inde
x of
Bio
tic In
tegr
ity (L
yons
, 199
2) w
as n
ot u
sed
beca
use
few
er th
an 5
0 in
divi
dual
fish
wer
e co
llect
ed]
Site
Tota
l num
ber o
f fis
h sp
ecie
sTo
tal n
umbe
r of
fish
Inde
x of
Bio
tic In
tegr
ityPe
rcen
t in
tole
rant
sp
ecie
s
Perc
ent
tole
rant
sp
ecie
sSc
ore
Ratin
g
2004
2007
2004
2007
Phas
e I
2004
2007
Phas
e I
2004
2007
2004
2007
2004
2007
Milw
auke
e R
iver
nea
r Ced
arbu
rg21
1432
017
3N
D70
65N
DEx
celle
ntEx
celle
nt10
148
4Li
ncol
n C
reek
at 4
7th
Stre
et a
t Milw
auke
e8
1159
170
1012
57Ve
ry p
oor
Very
poo
rG
ood
140
6619
Milw
auke
e R
iver
at M
ilwau
kee
1819
240
295
6260
57G
ood
Goo
dG
ood
1211
137
Will
ow C
reek
at M
aple
Roa
d ne
ar
Ger
man
tow
n6
1223
814
2N
D29
39N
DPo
orFa
ir0
038
76
Men
omon
ee R
iver
at M
enom
onee
Fal
ls13
929
621
2N
D29
15N
DPo
orVe
ry p
oor
80
7955
Littl
e M
enom
onee
Riv
er a
t Milw
auke
e5
414
14N
D*
*N
DVe
ry p
oor
Very
poo
r6
579
86U
nder
woo
d C
reek
at W
auw
atos
a8
1125
61,
051
1517
37Ve
ry p
oor
Very
poo
rFa
ir0
099
37H
oney
Cre
ek a
t Wau
wat
osa
611
135
521
2016
39Ve
ry p
oor
Very
poo
rFa
ir0
098
60M
enom
onee
Riv
er a
t Wau
wat
osa
88
119
449
ND
1040
ND
Very
poo
rFa
ir0
097
8K
inni
ckin
nic
Riv
er a
t S. 1
1th
Stre
et a
t M
ilwau
kee
12
112
20*
*Ve
ry p
oor
Very
poo
rVe
ry p
oor
00
100
50
Oak
Cre
ek a
t Sou
th M
ilwau
kee
75
218
3517
10*
Very
poo
rVe
ry p
oor
Very
poo
r0
094
97R
oot R
iver
at G
rang
e Ave
nue
at G
reen
field
94
179
10N
D36
*N
DFa
irVe
ry p
oor
00
8350
Roo
t Riv
er n
ear F
rank
lin12
418
37
ND
32*
ND
Fair
Very
poo
r0
069
43Je
wel
Cre
ek a
t Mus
kego
1610
511
144
ND
3142
ND
Fair
Fair
70
5342

Biological Community Assessment 21
88°10' 87°50'42
°50'
43°1
0'
Lake Michigan
0 42 Miles
0 42 Kilometers
Base composited from Southeastern Wisconsin Regional Planning Commission regional base map, 1:2,000, 1995; U.S. Geological Survey digital line graph hydrography, 1:100,000, 1989;
Wisconsin Department of Natural Resources version 2 hydrography, 1:24,000, 2002. Wisconsin Transverse Mercator Projection, referenced to North American Datum of 1983, 1991 adjustment.
EXPLANATION
Water
Area within the MMSDplanning area
Watershed boundary
Subwatershed boundary
Stream
Excellent
Good
Fish IBI score
Fair
2004 2007
Very Poor
Poor
OCSM
MRW
HCW
UCW
LMM
WCG
LCMMRM
MRMF
RRF
RRG
KRM
JCM
MRCMRC
OCSM
MRW
HCW
UCW
LMM
WCG
LCMMRM
MRMF
RRF
RRG
KRM
JCM
Figure 7. Fish Index of Biotic Integrity (IBI) scores at 14 stream sites in the Milwaukee Metropoli-tan Sewerage District planning area, Wisconsin, 2004 and 2007.
Figure 7. Fish Index of Biotic Integrity (IBI) scores at 14 stream sites in the Milwaukee Metropolitan Sewerage District planning area, Wisconsin, 2004 and 2007.

22 Biological Water-Quality Assessment, Milwaukee Metropolitan Sewerage District Planning Area, Wisconsin, 2007
The largest positive difference in IBI score was found at Lincoln Creek, with 12 (“very poor”) in 2004 and 57 (“good”) in 2007. Lincoln Creek was the only site other than the two Milwaukee River sites to score at least a “good” fish IBI rating in 2007, a marked difference compared to its “very poor” rating in 2004. The number of fish collected at Lincoln Creek was 59 in 2004 and 170 in 2007, and the number of species also was higher, with 8 in 2004 and 11 in 2007. The 2004 sample was dominated by golden shiner (26 of 59, or 44 percent), a species tolerant of low dissolved oxygen. In 2007, only 12 golden shiner were collected, or 7 percent of the total. The higher number of fish collected in 2007 was in spite of problems with fish collection at this site because of a large and deep pool and high water conductivity that reduced fish capture efficiency. As noted earlier, channel reconstruction prior to the 2004 sampling year could have contributed to major changes in fish assemblage, independently of any potential effects on water quality. This re-engineering of the entire floodplain has resulted in an increase in suitable habitat for a diversity of fishes. In addition, the removal of shoreline vegetation opened up the canopy, thereby increasing sunlight and increasing algal abundance. Fish-assemblage samples collected at Lincoln Creek during 1992–95 as part of the USGS’s National Water-Quality Assessment (NAWQA) Program scored “very poor” IBI ratings for each of the three years of sampling (Sullivan, 1997). In 1993, five species were collected, in 1994 only two species were collected, and in 1995 a single species was found. Efforts to improve water quality, together with flow and fish habitat, will hopefully lead to a more diverse and abundant fish assemblage in this urban stream in future years.
Comparative Bioassessment Among Algae, Invertebrates, and Fish
Data for selected biological metrics were used to divide the 14 stream sites into groups in order to compare results among algal, invertebrate, and fish assemblages and to ensure a more complete assessment of water quality at sites. Metric values were chosen to be most representative of water quality for each biotic assemblage. Values for each
metric were standardized (ranked, lowest rank indicating best water quality) and averaged for each biotic assemblage. The averages of these ranks were taken across all biota to yield aggregate bioassessment rankings for each site. Based on these aggregate bioassessment rankings, sites were divided into four groups: (1) less than the 25th percentile; (2) between the 25th and 49th percentiles; (3) between the 50th and 74th percentiles; and (4) greater than the 75th percentile. Group 1 contained sites at which aggregate bioassessment rankings indicated the least degraded water quality among those sampled, and Group 4 contained sites at which rankings indicated the most degraded water quality.
Results of aggregate bioassessment rankings placed four sites in Group 1 for 2007, suggesting that the water quality at these sites is among the least degraded of all 14 sampled sites: Milwaukee River at Milwaukee, Milwaukee River near Cedarburg, Jewel Creek, and Menomonee River at Menomonee Falls (table 9). These sites were the same ones in the least degraded group for 2004 (Thomas, Lutz, and others, 2007). These rankings are averages for the three biotic assemblages, and as such, results for each assemblage may vary. For example, although the aggregate assessment for the Milwaukee River near Cedarburg placed it in Group 1, the 2007 results for algae alone would have placed it in the most-degraded category. In general, algal assemblages are more sensitive to water-quality changes occurring on shorter time scales than are invertebrate or fish assemblages. For this reason, algae may be the first to show improvement or degradation in the water quality at a site. The aggregate assessment rankings for Oak Creek and Little Menomonee suggests that water quality was worse in 2007 than in 2004 and place these two sites together with Kinnickinnic River and Underwood Creek in Group 4, indicating the most degraded water quality. Rankings for Honey Creek and Lincoln Creek suggest that water quality at these sites was better in 2007 than in 2004; however, the difference in ranking at Lincoln Creek in 2007 primarily was due to a better fish IBI ranking that countered algal and invertebrate rankings that, without including the fish ranking, would have indicated degraded water quality. As was mentioned earlier, improvements for Lincoln Creek fish may be the result of restoration of the habitat completed in 2002.

Toxicity and Chemical Assessment Using SPMDS 23
Toxicity and Chemical Assessment Using SPMDS
Toxicity and chemical assessment using SPMDs provided valuable information about potential chemical stressors on stream biota at a subset of six sites: Milwaukee River near Cedarburg, Lincoln Creek, Little Menomonee, Honey Creek, Kinnickinnic River, and Oak Creek. Replicate SPMD samples from each site were evaluated using two toxicity tests, Microtox and P450RGS, and also by using a chemical screen for PAHs and for selected other manmade chemicals. PAHs represent the largest class of suspected human carcinogens and are common urban contaminants, formed mainly during incomplete burning of fuel, primarily petroleum, oil, coal, and wood (Björseth and Ramdahl, 1985; Van Metre and
others, 2000, 2009). Urban sources include not only emissions and wastes from these processes but also commonly used pavement sealants (Mahler and others, 2005; Van Metre and others, 2009). Many PAHs are persistent in the environment. Some animals, including human beings, metabolize PAHs very slowly or not at all and can accumulate them to toxic levels in their tissues from low levels in food, sediment, and water (Neff, 1985). Most fish tend to rapidly metabolize and excrete PAHs; for this reason, fish tissues may be inadequate for characterizing concentrations of PAHs in streams. Thomas, Lutz, and others (2007), Bryant and Goodbred (2009), and Richards and others (2010) describe USGS studies on the effects of urbanization on stream ecosystems, including the results for SPMDs deployed in the Milwaukee area during 2004.
Table 9. Average trophic-level rankings and aggregate bioassessment rankings for stream sites in the Milwaukee Metropolitan Sewerage District planning area, Wisconsin, in 2007 and 2004.
[IBI, Index of Biotic Integrity; EPT, Ephemeroptera, Plecoptera, and Trichoptera; HBI, Hilsenhoff Biotic Index; fill color indicates the quartile based on percentiles of the ranked data (blue, less than the 25th percentile, least degraded; light blue, between the 25th and 49th percentile/median; yellow, between the 50th to 74th percentile; orange, greater than the 75th percentile, most degraded; each average bioassessment ranking is assessed independently)]
Site
2007 Average bioassessment ranking 2007 2004
Algae1 Invertebrates2 Fish33Aggregate
bioassessment ranking
Aggregate bioassessment
ranking
Group 1
Milwaukee River at Milwaukee 8.00 2.00 2.5 4.17 3.56Milwaukee River near Cedarburg 10.50 2.33 1 4.61 1.44Jewel Creek at Muskego 1.50 8.83 4 4.78 4.17Menomonee River at Menomonee Falls 1.50 4.00 9 4.83 4.78
Group 2
<—B
etter water quality
Willow Creek at Maple Road near Germantown 8.50 4.83 6.5 6.61 5.72Honey Creek at Wauwatosa 7.50 6.67 6.5 6.89 9.39Root River at Grange Avenue at Greenfield 3.50 7.00 12 7.50 8.50
Group 3Root River near Franklin 5.50 7.17 12 8.22 7.06Menomonee River at Wauwatosa 10.50 9.67 5 8.39 8.61Lincoln Creek at 47th Street at Milwaukee 12.50 10.50 2.5 8.50 11.56
Group 4Kinnickinnic River at S. 11th Street at Milwaukee 6.00 10.00 12 9.33 12.72Oak Creek at South Milwaukee 10.00 6.83 12 9.61 8.78Underwood Creek at Wauwatosa 9.00 12.67 8 9.89 9.44Little Menomonee River at Milwaukee 10.50 12.50 12 11.67 9.28
1 Averaged bioassessment rankings for algae included percent of most-tolerant diatoms and percent of sensitive diatoms.2 Averaged bioassessment rankings for invertebrates included Shannon index of diversity scores, percent of EPT taxa, and HBI-10 scores.3 Averaged bioassessment rankings for fish included only IBI scores.

24 Biological Water-Quality Assessment, Milwaukee Metropolitan Sewerage District Planning Area, Wisconsin, 2007
SPMD Toxicity Tests
There was little to no Microtox toxicity at the six streams where SPMDs were deployed in 2007. Results are given in terms of toxicity units (TU50), computed by dividing 100 by the concentration at which the production of light is reduced by one-half for photoluminescent test bacteria; the larger the calculated TU50 value, the more toxic the sample. Only SPMD replicate sample A from Lincoln Creek had a TU50 value that was higher than the reporting limit for that set; replicate sample B also had the highest TU50 among that set but it was still slightly lower than the reporting limit (table 10).
Based on results from P450RGS tests, potential toxicity from certain manmade chemicals, such PCBs, PAHs, dioxins, and furans, was indicated at all six sites (table 10). Results are given as toxic equivalents (TEQs); the higher the TEQ, the higher the potential toxicity of these chemicals in the stream water. As was found with Microtox tests, the highest potential toxicity for the P450RGS tests was found at Lincoln Creek; however, P450RGS tests also found that potential toxicity at Little Menomonee River, Honey Creek, and Kinnickinnic River also was relatively high compared to Milwaukee River at Cedarburg and Oak Creek. Cedar Creek at Cedarburg, a tributary to the Milwaukee River upstream of the MMSD Cedarburg site, is a Superfund site due mostly to PCBs in bed sediment (U.S. Environmental Protection Agency, 2006b). For SPMDs deployed at seven sites in 2004, Thomas, Lutz, and others (2007) reported that the P450RGS tests indicated the highest potential toxicity at Lincoln Creek, Little Menomonee River, Honey Creek, Oak Creek, and Root River at Greenfield when compared to Menomonee River at Menomonee Falls and Underwood Creek.
SPMD Chemical Screening
The patterns of total PAH concentrations in SPMDs correlated positively with Microtox test results for those sites where the TU50 values were greater than estimated analytical detection limits. The highest TU50 values and total PAH concentrations were from Lincoln Creek for both SPMD replicate extracts (table 11). Total PAH concentrations for Lincoln Creek were 520 and 560 ng/L from replicate sets A and B, respectively. SPMDs from the Milwaukee River near
Table 10. Toxicity test results for passive sampling devices (SPMDs, semi-permeable membrane devices) deployed during July–August 2007, for a subset of six Phase III stream sites in the Milwaukee Metropolitan Sewerage District planning area, Wisconsin.
[A, B, replicate sample sets; TU50, toxicity units for Microtox toxicity tests; TEQ, toxic equivalents for Cytochrome-P450 tests; P450RGS, Cytochrome P450 tests; each value represents the average of three sample analyses that has been standardized to 30-day exposure times (higher values indicate greater potential toxicity); pg TEQ/mL, picograms TEQ per milliliter; <, less than minimum detection limits of 1.2 for set A and 5.2 for set B]
Site
Microtox P450RGS
Sample sets Sample setsA B A B
TU50 TU50 TEQ TEQ
(pg TEQ/mL)
Milwaukee River near Cedarburg <1.2 < 5.2 491 547Lincoln Creek at 47th Street, at Milwaukee 5.5 12.2 2,430 2,490Little Menomonee River at Milwaukee <1.2 < 5.2 1,980 2,660Honey Creek at Wauwatosa <1.2 < 5.2 2,280 1,900Kinnickinnic River at S. 11th Street, at Milwaukee <1.2 < 5.2 970 3,360Oak Creek at South Milwaukee <1.2 < 5.2 457 2,000
Cedarburg had the lowest concentrations in both sets (35 ng/L for A and 44 ng/L for B). In 2004, concentrations of PAHs in SPMDs from Lincoln Creek, Honey Creek, Oak Creek, and Root River at Greenfield were high compared to other sampled sites (Thomas, Lutz, and others, 2007). However, the highest concentrations of PAHs found in 2004 were at Little Menomonee River and Menomonee River at Menomonee Falls, with concentrations at Little Menomonee River nearly twice those found at the Menomonee River at Menomonee Falls. PAHs and volatile organic compounds in bed sediment are the reason for a Superfund site upstream of the Little Menomonee River site (U.S. Environmental Protection Agency, 2006a; Thomas, Lutz, and others, 2007).
Van Metre and others (2000) measured PAHs in sediment cores from lakes and reservoirs in the United States, and they found a positive relation between PAH concentrations and automobile use. In the 2004 Milwaukee area study, Richards and others (2010) found that results for P450RGS toxicity tests and concentrations of PAHs in SPMDs were correlated positively with measures of urbanization, such as road infrastructure and the percentage of impervious surface and developed urban land in a stream’s watershed. The use of coal-tar sealants (also known as sealcoats) on roads, driveways, and parking lots has been identified as a significant source of PAHs to urban areas (Mahler and others, 2005; Van Metre and others, 2009). The PAHs benzo(a)pyrene, fluoranthene, phenanthrene, and pyrene are components of coal-tar sealants. The results of these studies suggest that that automobiles and their supporting infrastructure are a significant source of PAHs to streams.

Toxicity and Chemical Assessment Using SPMDS 25
Table 11. Estimated concentration in water, in nanograms per liter, of polycyclic aromatic hydrocarbons (PAHs) computed from results for passive sampling devices (SPMDs, semi-permeable membrane devices) deployed at 6 of 14 stream sites in the Milwaukee Metropolitan Sewerage District planning area of Wisconsin, July–August, 2007. Values were estimated using 37 days, the average number of days all SPMDs were deployed.
[ng/L, nanograms per liter; bracketed value is greater than the method detection limit (varies according to compound) but below the reporting limit (varies according to compound), indicating that the compound was detected but the exact value of the measurement is uncertain; concentrations of total PAHs were computed , based on the sum of all measured PAH concentrations in replicate sample sets of SPMDs and SPMD uptake kinetics for pyrene]
Site nameMilwaukee River near Cedarburg
Lincoln Creek at Milwaukee
Little Menominee River, at
Milwaukee
Honey Creek at Wauwatosa
Oak Creek at South Milwaukee
Kinnickinnic River at
Milwaukee
Chemical compound1Set A Set B Set A Set B Set A Set B Set A Set B Set A Set B Set A Set B
(ng/L) (ng/L) (ng/L) (ng/L) (ng/L) (ng/L)
Acenaphthene <0.23 <0.23 15 <0.23 2.5 13 <0.23 <0.23 <0.23 <0.23 <0.23 <0.23Anthracene <0.12 1.2 <0.12 100 1.3 3.7 <0.12 <0.12 1.3 <0.12 <0.12 <0.12Benz[a]anthracene 0.23 0.28 3.2 <0.01 1.6 3.1 1.6 <0.01 0.82 <0.01 1.1 <0.01Benzo[a]pyrene 0.09 0.13 0.36 <0.01 0.47 0.89 0.35 <0.01 0.36 <0.01 0.34 <0.01Benzo[b]fluoranthene 0.49 0.35 2.8 <0.01 2.7 4 2.6 <0.01 1.4 <0.01 2.3 <0.01Benzo[g,h,i]perylene 0.2 0.19 1.1 <0.02 1.3 1.7 0.78 <0.02 0.53 <0.02 1 <0.02Benzo[k]fluoranthene 0.32 0.31 2.1 <0.01 1 1.3 1.8 <0.01 1.1 <0.01 1.6 <0.01Chrysene 2.4 2.5 26 <0.20 17 24 18 <0.20 8.8 <0.20 14 <0.20Dibenz[a,h]anthracene <0.02 <0.02 0.21 <0.02 0.17 [0.08] 0.21 <0.02 <0.02 <0.02 0.2 <0.02Fluoranthene 14 15 220 250 76 120 115 <2.4 47 34 70 76Fluorene <0.16 1.7 25 34 1.8 9.3 3.6 0.85 1.8 <0.16 <0.16 <0.16Indeno[1,2,3-c,d]pyrene 0.1 [0.05] 0.42 <0.01 0.33 0.42 0.54 <0.01 0.14 <0.01 0.39 0.56Naphthalene <24 [42] <24 2,000 <24 [35] <24 <16 <24 1,500 <24 69Phenanthrene [15] [25] 370 560 33 86 81 <25 29 [38] 33 [54]Pyrene 7.6 <18 130 130 56 86 60 <18 32 [26] 45 [45]1,2-dimethylnaphthalene <0.17 0.87 <0.17 <0.17 <0.17 1.7 1.8 0.87 <0.17 <0.17 <0.17 <0.171-methylfluorene <0.05 <0.05 <0.05 <0.05 <0.05 <0.05 2.4 <0.05 1.8 <0.05 2.4 <0.051-methylnaphthalene <6.5 [13] <6.5 [23] <6.5 [16] <6.5 <13 <6.5 [26] <6.5 <132-methylfluoranthene 0.15 0.22 1.8 2.7 1.1 1.6 0.96 <0.01 0.54 <0.01 0.84 0.732-methylnaphthalene <8.9 [26] <8.9 [39] <8.9 [34] [11] <26 <8.9 [49] <8.9 <262-methylphenanthrene 0.89 <1.3 18 <1.3 2.2 4.9 8 <1.3 2.7 <1.3 4 4.23,6-dimethylphenanthrene <0.02 <0.02 <0.02 <0.02 <0.02 1.1 <0.02 <0.02 <0.02 <0.02 <0.02 <0.02Benzo[e]pyrene 0.79 0.75 6 <0.03 5.8 7.3 4.8 <0.03 3.2 <0.03 4.6 <0.03Dibenzothiophene 1.8 [1.7] 21 <1.4 1.8 6.8 5.4 <1.4 1.8 <1.4 1.8 4.2
Total PAHs 35 [44] 520 560 200 320 260 260 120 105 170 1401Analyzed for but not detected in any sample: acenaphthylene, benzo[b]naphtho[2,1-d]thiophene, benzo[b]thiophene, biphenyl, 4-methylbiphenyl, perylene,
2,3,5-trimethylnaphthalene, 1-ethylnaphthalene, 9-methylanthracene.

26 Biological Water-Quality Assessment, Milwaukee Metropolitan Sewerage District Planning Area, Wisconsin, 2007
Summary and ConclusionsStream biota—algal, invertebrate, and fish assemblages—
were sampled at 14 stream sites in the Milwaukee area as part of the MMSD Corridor Study by the U.S. Geological Survey in 2004 and 2007. In addition, SPMDs were deployed at a subset of six sites to assess potential toxicity to biota from certain manmade chemicals. The objectives of biological community sampling were to assess the water quality of selected stream sites as part of a larger water-quality study that began in 2000.
In 2007, the highest numbers of algal, invertebrate, and fish taxa were found at the Milwaukee River at Milwaukee, the largest of all sampled sites. The small streams Jewel Creek and Willow Creek were second highest to the Milwaukee River at Milwaukee for number of invertebrate taxa. Milwaukee River near Cedarburg was second highest to the Milwaukee site in number of fish species. The fewest algal taxa were found at the Kinnickinnic River, and the fewest invertebrate taxa (all similar numbers of taxa) were collected at Honey Creek, Underwood Creek, Kinnickinnic River, Little Menomonee River, and Menomonee River at Wauwatosa. The sites with the fewest fish species (less than or equal to 5, starting with fewest) were: Kinnickinnic River, Root River (both sites), Little Menomonee River, and Oak Creek.
Results from the 2007 biological sampling were compared to results of the 2004 biological sampling, and that comparison was evaluated together with historical data in Schneider, Lutz, and others (2004) and Thomas, Lutz, and others (2007); however, data are insufficient for assessment of the significance of these differences and may not represent statistically significant trends. Additional sampling would be required to evaluate any trends (or lack of trends). Comparing 2004 to 2007, total algal biovolume was higher at 12 of the 14 sites, primarily because of higher amounts of nuisance green algae. For algal assemblages, water quality at 10 of the 14 sites sampled was of concern based on the occurrence of nuisance algal species or less than 30 percent pollution-sensitive algal species. Four streams that did not have nuisance algae or less than 30 percent pollution sensitive algae include Milwaukee River at Milwaukee, Willow Creek, Root River at Franklin, and Jewel Creek. Invertebrate metrics suggest poorer quality invertebrate assemblages in 2007 than 2004 in the Little Menomonee River, Underwood Creek, and Honey Creek. Based on IBIs for invertebrates and fish, the highest rated sites were generally the two Milwaukee River mainstem sites, at Milwaukee and near Cedarburg; Cedarburg received a “good” HBI-10 rating for invertebrates in 2004 and 2007, despite a relatively large negative difference in invertebrate taxa compared to 2004. In 2007, the number of fish species was higher or the same at seven sites and lower at seven sites.
The lowest fish IBI scores tended to be qualitatively lower, with six “very poor” fish IBI ratings compared to just two “fairly poor” invertebrate HBI-10 ratings. Fish IBI scores were the same in 2007 and 2004 at three sites; at 5 sites fish IBI scores were higher in 2007 than in 2004; and at 6 sites fish IBI scores were lower in 2007 than in 2004. Relatively large negative differences in fish abundance were seen between 2004 and 2007 at both Root River sites, at Jewel Creek, and at Oak Creek. Some signs of improvement in the fish assemblage were found at Lincoln Creek (from “very poor” in 2004 to “good” in 2007), possibly reflecting recent changes from restoration of stream habitat completed in 2002.
Aggregate bioassessment rankings across all groups of biota indicated least degraded water quality at Milwaukee River at Milwaukee and near Cedarburg, at Jewel Creek, and at Menomonee River at Menomonee Falls for 2004 and 2007. The rankings for Oak Creek and Little Menomonee River suggest worse water quality in 2007 compared to 2004, thereby placing these two sites together with Kinnickinnic River and Underwood Creek as indicating the most degraded water quality among all sampled sites. The aggregate ranking for Lincoln Creek was higher in 2007, primarily due to improved higher fish IBI score.
Potential toxicity was found at all six SPMD sites. As was found in 2004, Lincoln Creek showed the highest potential toxicity in 2007, and subsequent chemical screening indicated the highest total PAH concentrations; however, toxicity at Little Menomonee River, Honey Creek, and Kinnickinnic River was also relatively high compared to Milwaukee near Cedarburg. The high PAHs at Lincoln Creek might help explain low rankings for algae and invertebrate assemblages despite apparent improvement in the quality of the fish assemblage, which may be able to relocate and recolonize from stream sites with less degraded water quality. Although toxicity and chemical results did not agree with aggregate rankings for Lincoln Creek or Honey Creek, the results did agree with aggregate rankings at four of the six sites.
Evaluation of the condition of algal, invertebrate, and fish assemblages together with toxicity and chemical screening using SPMDs provided an integrated assessment of the ecological condition and water quality at these 14 sites in the Milwaukee area. Despite somewhat variable results among the different assemblages, our evaluations suggest good water quality at some sites and degraded water quality at others. Some of the variability in the results may be attributable to frequent high stream flows (characterized by rapid rise and fall) that are known to have adverse effects on biota in many of these streams. Resampling that is planned for 2010, together with physical and chemical assessments, will contribute toward our understanding of the overall integrity of these streams.

References Cited 27
References Cited
Allen, A.P., Whittier, T.R., Larsen, D.P., Kaufmann, P.R., O’Connor, R.J., Hughes, R.M., Stemberger, R.S., Dixit, S.S., Brinkhurst, R.O., Herlihy, A.T., and Paulsen, S.G., 1999, Concordance of taxonomic composition patterns across multiple lake assemblages—Effects of scale, body size, and land use: Canadian Journal of Fisheries and Aquatic Sciences, v. 56, no. 11, p. 2029–2040.
Alvarez, D.A, Cranor, W.L., Perkins, S.D., Clark, R.C., and Smith, S.B., 2008, Chemical and toxicological assessment of organic contaminants in surface water using passive samplers: Journal of Environmental Quality, v. 37, p. 1024–1033.
Ang, C.Y., Inouye, L.S., McCant, D.D., and McFarland, V.A., 2000, Protocols for a rapid clean-up/extraction procedure and an improved P450RGS dioxin screening assay for sediments: DOER Technical Notes Collection (ERDC TN-DOER-C10), U.S. Army Engineer Research and Development Center, Vicksburg, Miss.
Bahls, L.L., 1993, Periphyton bioassessment methods for Montana streams: Montana Water Quality Bureau, Department of Health and Environmental Sciences, Helena, Mont., 69 p.
Barbour, M.T., Gerritsen, J., Snyder, B.D., and Stribling, J.B., 1999, Rapid bioassessment protocols for use in wadeable streams and rivers—Periphyton, benthic macroinvertebrates and fish (2d ed.): Washington, D.C., U.S. Environmental Protection Agency, Office of Water, EPA 841–B–99–002, variously paged.
Bjørseth, Alf, and Ramdahl, Thomas, 1985, Sources and emissions of PAH, chap. 1 of Bjørseth, Alf, and Ramdahl, Thomas, (eds.), Handbook of polycyclic aromatic hydrocarbons—Emission sources and recent progress in analytical chemistry, v. 2: New York, Marcel Dekker, Inc., p. 1–20.
Bryant, W.L., Jr., and Goodbred, S.L., 2009, The response of hydrophobic organics and potential toxicity in streams to urbanization of watersheds in six metropolitan areas of the United States: Environmental Monitoring and Assessment, v. 157, p. 419–447.
Bryant, W.L., Goodbred, S.L., Leiker, T.L., Inouye, L., and Johnson, B.T., 2007, Use of chemical analysis and assays of semipermeable membrane devices extracts to assess the response of bioavailable organic pollutants in streams to urbanization in six metropolitan areas of the United States: U.S. Geological Survey Scientific Investigations Report 2007–5113, 47 p.
Data Description Inc., 1996, Data Desk, Version 6.1: Data Description Inc., Ithaca, N.Y.
Fitzpatrick, F.A., Scudder, B.C., Lenz, B.N., and Sullivan, D.J., 2001. Effects of multi-scale environmental characteristics on agricultural stream biota in eastern Wisconsin: Journal of the American Water Resources Association, v. 37 no. 6, p. 1489–1507.
Fore, L.S., 2003, Developing biological indicators—Lessons learned from the Mid-Atlantic streams: U.S. Environmental Protection Agency, EPA/903/R–03/003, 41 p.
Frey, D.G., 1977, Biological integrity of water – an historical approach, in The Integrity of Water, Proceedings of a Symposium, Washington, D.C., March 10-12, 1975, p. 127–140.
Goodbred, S.L., Bryant, W.L., Rosen, M.R., Alvarez, David, and Spencer, Terri, 2009, How useful are the “other” semipermeable membrane devices (SPMDs)—the mini-unit (15.2 cm long)?: Science of the Total Environment, v. 407, p. 4149–4156.
Hambrook Berkman, J.A., Scudder, B.C., Lutz, M.A., and Harris, M.A., 2010, Evaluation of aquatic biota in relation to environmental characteristics measured at multiple scales in agricultural streams of the Midwest, 1993–2004: U.S. Geological Survey Scientific Investigations Report, 2010-5051, 24 p.
Hilsenhoff, W.L., 1987, An improved biotic index of organic stream pollution: The Great Lakes Entomologist, v. 20, no. 1, p. 31–39.
Hilsenhoff, W.L., 1998, A modification of the biotic index of organic stream pollution to remedy problems and permit its use throughout the year: The Great Lakes Entomologist, v. 31, no. 1, p. 1–12.
Karr, J.R., 1981, Assessment of biotic integrity using fish communities: Fisheries, v. 6, no. 6, p. 21–27.
Karr, J.R., and Dudley, D.R., 1981, Ecological perspectives on water quality goals: Environmental Management, v. 5, p. 55–68.
Karr, J.R., Fausch, K.D., Angermeier, P.L., Yant, P.R., and Schlosser, I.J., 1986, Assessing biological integrity in running waters: A method and its rationale: Illinois Natural History Survey, Special Publication 5, Champaign, Illinois, 28 p.
Kennen, J.G., Riva-Murray, Karen, Beaulieu, K.M., 2010, Determining hydrologic factors that influence stream macroinvertebrate assemblages in the northeastern US: Ecohydrology, v. 3, p. 88-106.
Lange-Bertalot, H., 1979, Pollution tolerance of diatoms as a criterion for water quality estimation: Nova Hedwigia, v. 64, p. 285–304.

28 Biological Water-Quality Assessment, Milwaukee Metropolitan Sewerage District Planning Area, Wisconsin, 2007
Lenat, D.R., 1988, Water quality assessment of streams using a qualitative collection method for benthic macroinvertebrates: Journal of the North American Benthological Society, v. 7, no. 3, 222–233.
Lenz, B.N., and Rheaume, S.J., 2000, Benthic invertebrates of fixed sites in the Western Lake Michigan Drainages, Wisconsin and Michigan, 1993–1995: U.S. Geological Survey Water Resources Investigations Report 95–4211–D, 30 p.
Lyons, J., 1992, Using the Index of Biotic Integrity (IBI) to measure environmental quality in warmwater streams of Wisconsin, General Technical Report NC-149: U.S. Department of Agriculture, Forest Service, North Central Experiment Station, St. Paul, Minn., 51 p.
Mahler, B.J., Van Metre, P.C., Bashara, T.J., Wilson, J.T., and Johns, D.A., 2005, Parking lot sealcoat—An unrecognized source of urban polycyclic aromatic hydrocarbons: Environmental Science and Technology, v. 39, no. 15, p. 5,560–5,566.
Moulton, S.R.,II, Kennen, J.G., Goldstein, R.M., and Hambrook, J.A., 2002, Revised protocols for sampling algal, invertebrate, and fish communities as part of the National Water-Quality Assessment Program: U.S. Geological Survey Open-File Report 02–150, 75 p.
Neff, J.M., 1985, Polycyclic aromatic hydrocarbons, chap. 14 of Rand, G.M., and Petrocelli, S.R., (eds.), Fundamentals of aquatic toxicology: New York, Hemisphere Publishing Corporation, 433 p.
Paul, M.J., and Meyer, J.L., 2001, Streams in the urban landscape: Annual Review of Ecology and Systematics, v. 32, p. 333-365.
Poff, N.L., Zimmerman, J.K.H., 2010, Ecological responses to altered flow regimes: a literature review to inform the science and management of environmental flows: Freshwater Biology, v. 55, p. 194-205.
Prescott, G.W., 1962, Algae of the Western Great Lakes area: Dubuque, Iowa, W.C. Brown, 977 p.
Porter, S.D., 2008, Algal attributes—An autecological classification of algal taxa: Reston, Va., U.S. Geological Survey Data Series 329, 22 p.
Richards, K.D., Scudder, B.C., Fitzpatrick, F.A., Steuer, J.J., Bell, A.H., Peppler, M.C., Stewart, J.S., Harris, M.A., 2010, Effects of urbanization on stream ecosystems along an agriculture-to-urban land-use gradient, Milwaukee to Green Bay, Wisconsin, 2003–2004, chap. E of Effects of Urbanization on Steam Ecosystems in Six Metropolitan Areas of the United States: U.S. Geological Survey Scientific Investigations Report 2006–5101E, 212 p.
Schneider, M.A., Lutz, M.A., and others, 2004, Water-resources-related information for the Milwaukee Metropolitan Sewerage District planning area, Wisconsin, 1970–2002: U.S. Geological Survey Water-Resources Investigations Report 2003–4240, 288 p.
Steuer, J.J., Stensvold, K.A., and Gregory, M.B., 2010, Determination of biologically significant hydrologic condition metrics in urbanizing watersheds: an empirical analysis over a range of environmental settings: Hydrobiologia, v. 654, no. 1, p. 27–55.
Sullivan, D.J., 1997, Fish communities of fixed sites in the Western Lake Michigan Drainages, Wisconsin and Michigan, 1993–95: U.S. Geological Survey Water-Resources Investigations Report 95-4211-C, 23 p.
Thomas, J.C., Lutz, M.A., Bruce, J.L., Graczyk, D.J., Richards, K.D., Krabbenhoft, D.P., Westenbroek, S.M., Scudder, B.C., Sullivan, D.J., and Bell, A.H., 2007, Water-quality characteristics for selected sites within the Milwaukee Metropolitan Sewerage District planning area, Wisconsin, February 2004–September 2005: U.S. Geological Survey Scientific Investigations Report 2007-5084, 187 p.
U.S. Environmental Protection Agency, 2006a, Superfund information systems—Superfund site progress profile Moss-American Co., Inc. (Kerr-McGee Oil Co.): U.S. Environmental Protection Agency, accessed January 18, 2007, at http://cfpub.epa.gov/supercpad/cursites/csitinfo.cfm?id=0505024.
U.S. Environmental Protection Agency, 2006b, Region 5 cleanup sites—Cedar Creek site: U.S. Environmental Protection Agency, accessed January 18, 2007, at http://www.epa.gov/Region5/sites/cedarcreek/index.htm.
Van Dam, H., Mertens, A., and Sinkeldam, J., 1994, A coded checklist and ecological indicator values of freshwater diatoms from the Netherlands: Netherlands Journal of Aquatic Ecology, v. 28, no. 1, p. 117–133.
Van Metre, P.C., Mahler, B.J., and Furlong, E.T., 2000, Urban sprawl leaves its PAH signature: Environmental Science and Technology, v. 34, no. 19, p. 4,064–4,070.
Van Metre, P.C., Mahler, B.J., and Wilson, J.T., 2009, PAHs underfoot: contaminated dust from coal-tar sealcoated pavement is widespread in the United States: Environmental Science and Technology, v. 43, no. 1, p. 20–25.
Wehr, J.D., and Sheath, R.G., 2003, Freshwater algae of North America: Ecology and classification: San Diego, Calif., Academic Press, 918 p.
Weigel, B.M., 2003, Development of stream macroinvertebrate models that predict watershed and local stressors in Wisconsin: Journal of the North American Benthological Society, v. 22, no. 1, p. 123–142.

Publishing support provided by the U.S. Geological SurveyPublishing Network, Columbus and Tacoma Publishing Service Centers
For more information concerning the research in this report, contact the Director, Wisconsin Water Science Center
U.S. Geological Survey 8505 Research Way Middleton, Wisconsin 53562 http://wi.water.usgs.gov/

Scudder Eikenberry and others— B
iological Water-Q
uality Assessm
ent, Milw
aukee Metropolitan Sew
erage District Planning A
rea, Wisconsin, 2007—
SIR 2010–5166, ver. 1.1