biology 196 laboratory enzyme activity · table 2. absorbance values for standards standard amount...
TRANSCRIPT

CSN - Biology 196 Laboratory - Enzymes
Biology 196 Laboratory Enzyme Activity
Preparation and Background
Students should study or review the core concepts of chapter 8 in their textbook (Campbell Biology, 9th ed.). A basic comprehension of Gibb’s free energy changes (∆G) will greatly increase understanding of the laboratory background.
Enzymes Enzymes are biological macromolecules (usually proteins) that facilitate biochemical reactions by dramatically increasing the rate of a reaction. Specifically, they function by lowering the energy of activation (Ea) of a reaction. Enzymes are catalysts - they are neither a reactant nor product, and are not used up in the reaction process. The reactants in an enzyme reaction are referred to as substrates. The shape and properties of each enzyme make it very specific to the type of substrate(s) it can convert into product. In addition to the specificity of substrates, most enzymes are extremely sensitive to environmental conditions. In this exercise we will test varying conditions on the rate of an enzymatic reaction.
The enzyme used for this exercise is cellobiase, which catalyzes the hydrolysis of glucose ß 1-4 glycosidic bonds (Fig. 1). This is the last step in the hydrolysis of cellulose, the most prominent structural carbohydrate of plants. This enzyme is crucial to the life cycles of any organism that obtains energy by hydrolyzing cellulose (termites, for example). This is also a potentially important commercial enzyme, since breaking down cellulose to glucose is the first step in turning plant material into ethanol for fuel.
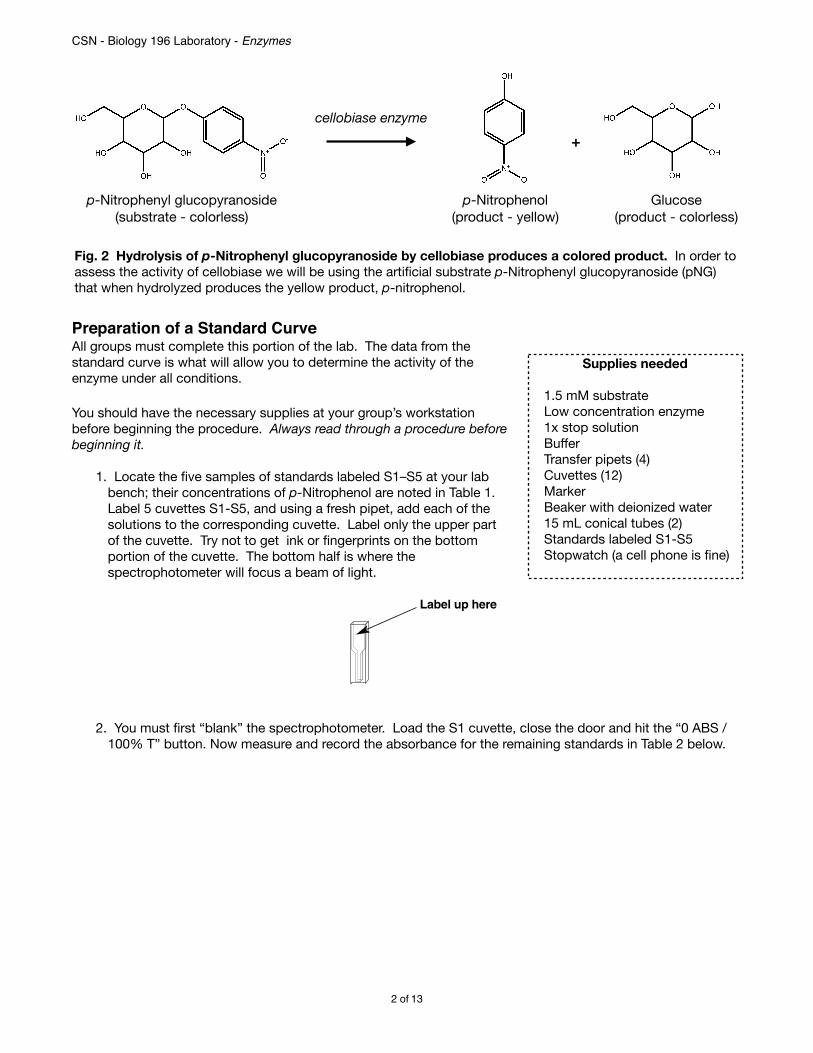
Cellobiase Substrates and DetectionCellulose and cellobiose (substrate) and glucose (product) are colorless in solution. Therefore, to to make it easier to detect the activity of the enzyme this exercise will use an artificial substrate, p-Nitrophenyl glucopyranoside, (pNG) that produces a colored product when exposed to a solution that is basic in pH (Fig. 2). It is important to realize that the enzyme is still catalyzing the same reaction, but by using this substrate we can measure its activity easier.
The yellow color of the p-nitrophenol can be quantified using a spectrophotemeter. Since p-nitrophenol absorbs light at the wavelength of 410 nm, the spectrophotometer will transmit a beam of light at 410 nm through the substance and measures how much of the light is absorbed. Since more product will produce a darker yellow color, this will allow us to quantitate how much product is formed and also the rate of our enzyme reaction. You will use a set of known quantities of product (standards) to create a standard curve, which is a graphical plot of the absorbance vs. concentration. The absorbance values of your experimental group can then be interpolated to concentrations by using this standard curve.Experimental Activities
of 1 13
Fig. 1 The cellobiase reaction. Cellobiase has two active sites that bind to cellobiose (cellulose) and catalyzes the hydrolysis of the ß 1-4 glycosidic bond. Notice that the enzyme is unchanged by the reaction and is free to bind to another cellobiose molecule and repeat the process again.
active sites
substrate(cellobiose)
cellobiase enzyme
product(glucose)
enzyme-substrate complex
CSN - Biology 196 Laboratory - Enzymes
Preparation of a Standard CurveAll groups must complete this portion of the lab. The data from the standard curve is what will allow you to determine the activity of the enzyme under all conditions.
You should have the necessary supplies at your group’s workstation before beginning the procedure. Always read through a procedure before beginning it.
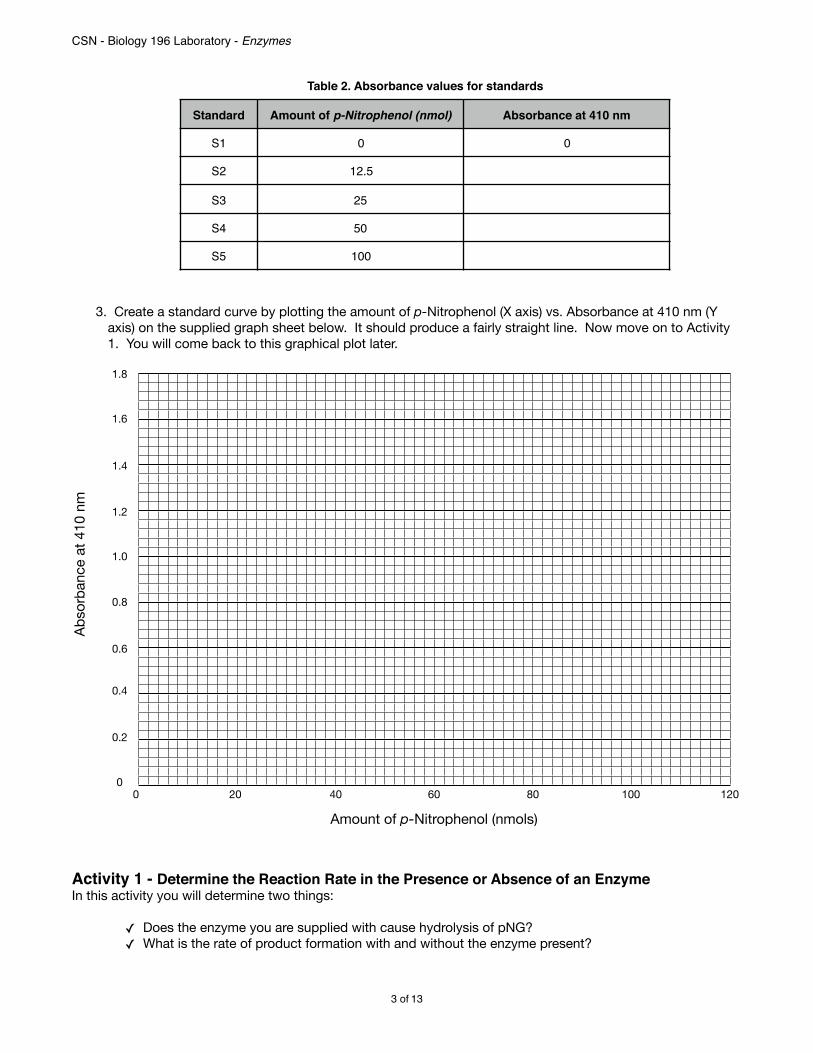
1. Locate the five samples of standards labeled S1–S5 at your lab bench; their concentrations of p-Nitrophenol are noted in Table 1. Label 5 cuvettes S1-S5, and using a fresh pipet, add each of the solutions to the corresponding cuvette. Label only the upper part of the cuvette. Try not to get ink or fingerprints on the bottom portion of the cuvette. The bottom half is where the spectrophotometer will focus a beam of light.
2. You must first “blank” the spectrophotometer. Load the S1 cuvette, close the door and hit the “0 ABS /
100% T” button. Now measure and record the absorbance for the remaining standards in Table 2 below.
of 2 13
Fig. 2 Hydrolysis of p-Nitrophenyl glucopyranoside by cellobiase produces a colored product. In order to assess the activity of cellobiase we will be using the artificial substrate p-Nitrophenyl glucopyranoside (pNG) that when hydrolyzed produces the yellow product, p-nitrophenol.
p-Nitrophenyl glucopyranoside(substrate - colorless)
p-Nitrophenol(product - yellow)
Glucose(product - colorless)
+cellobiase enzyme
Supplies needed
1.5 mM substrateLow concentration enzyme1x stop solutionBufferTransfer pipets (4)Cuvettes (12)MarkerBeaker with deionized water15 mL conical tubes (2)Standards labeled S1-S5Stopwatch (a cell phone is fine)
Quick Guide
Activity 1: Determine the ReactionRate in the Presence or Absenceof an Enzyme
1. Find your 15 ml conical tubes labeled“Stop Solution”, “1.5 mM Substrate”,“Enzyme” and “Buffer”. Write your initialson each tube.
2. Label five cuvettes E1–E5.
3. Label the two remaining cuvettes “Start”and “End”.
4. Using a clean DPTP, pipet 500 µl of stopsolution into each labeled cuvette. Rinsethe DPTP well with water.
5. Label one empty 15 ml conical tube“Enzyme Reaction” and the other“Control”.
6. Using a clean DPTP, pipet 2 ml of 1.5 mMsubstrate into the 15 ml conical tubelabeled “Enzyme Reaction”. Use thesame DPTP and pipet 1 ml of 1.5 mMsubstrate into the conical tube labeled“Control”. Rinse the DPTP well withwater.
7. Label one DPTP “E” for enzyme and theother “C” for control. Only use the DPTPlabeled “E” for the enzyme reaction tubeand the DPTP labeled “C” for the controlreaction tube.
26Quick Guide
QU
ICK
GU
IDE
Label up here
Stop Solution
1.5 mM Substrate ControlEnzyme reaction
Start End E1 E2 E3 E4 E5
CSN - Biology 196 Laboratory - Enzymes
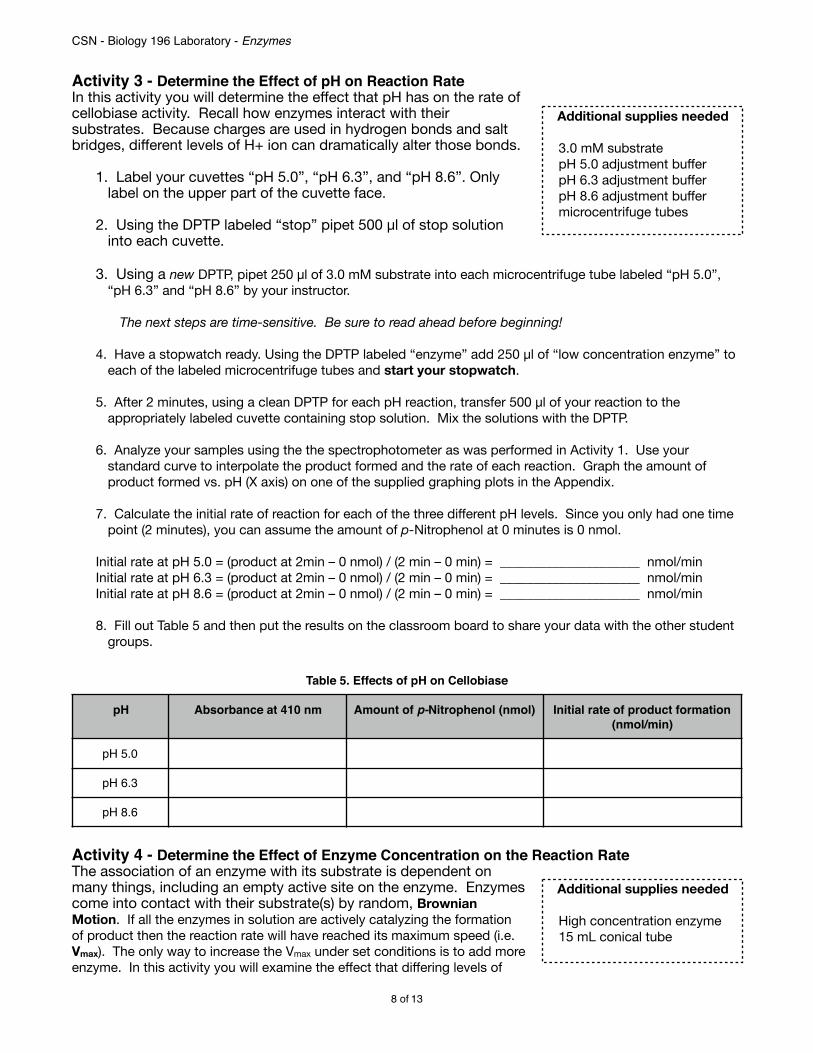
3. Create a standard curve by plotting the amount of p-Nitrophenol (X axis) vs. Absorbance at 410 nm (Y axis) on the supplied graph sheet below. It should produce a fairly straight line. Now move on to Activity 1. You will come back to this graphical plot later.
Activity 1 - Determine the Reaction Rate in the Presence or Absence of an EnzymeIn this activity you will determine two things:
✓ Does the enzyme you are supplied with cause hydrolysis of pNG?✓ What is the rate of product formation with and without the enzyme present?
Table 2. Absorbance values for standards
Standard Amount of p-Nitrophenol (nmol) Absorbance at 410 nm
S1 0 0
S2 12.5
S3 25
S4 50
S5 100
Amount of p-Nitrophenol (nmols)
Abso
rban
ce a
t 410
nm
0 20 40 60 80 100 1200
0.2
0.4
0.6
0.8
1.0
1.2
1.4
1.6
1.8
Saturday, January 26, 13
of 3 13

CSN - Biology 196 Laboratory - Enzymes
1. Locate the 15 ml conical tubes labeled “Stop Solution”, “1.5 mM Substrate”, “Low enzyme concentration” and “Buffer”. Label each of the tubes with your initials.
2. Label five cuvettes E1–E5 (for five time points). Label only the upper part of the cuvette face.
3. Label the two remaining cuvettes “Start” and “End” on the upper part of the cuvette. These two cuvettes will serve as control time points at the start and end of the reaction and neither cuvette will contain any enzyme.
4. Label a new disposable plastic transfer pipet (DPTP) as “stop” for stop solution, and pipet 500 μl of stop solution into each of the seven labeled cuvettes. The stop solution is a strong base, so avoid getting it on your skin or clothes.
5. Locate two empty 15 ml conical tubes. Label one “Enzyme Reaction” and the other “Control”.
6. Using a new DPTP, label it as “substrate”, and pipet 2 ml of 1.5 mM substrate into the 15 ml conical tube labeled “Enzyme Reaction”. Use the same DPTP and pipet 1 ml of 1.5 mM substrate into the conical tube labeled “Control”.
7. Label one new DPTP “E” for enzyme and another “C” for control. Only use the DPTP labeled “E” for the enzyme reaction tube and the DPTP labeled “C” for the control reaction tube.
The next steps are time-sensitive. Be sure to read ahead before beginning!
8. Using the DPTP labeled “C”, pipet 500 μl of buffer into the 15 ml conical tube labeled “Control” and gently mix. Once you have mixed the buffer with the substrate, remove 500 μl of this solution and add it to your cuvette labeled “Start”.
of 4 13 10Instructor’s Manual
INS
TRU
CTO
R'S
MA
NU
AL
BA
CK
GR
OU
ND
An Independent Inquiry ExperimentThis kit can also be used for a guided independent inquiry experiment to determine theability of naturally occurring (or manufactured) sources of cellobiase, such as an extractfrom a mushroom sample, to break down the model substrate included in the kit. Extensiveresearch is currently being performed by the biofuel industry to find and study naturalsources of cellulase enzymes that might be more stable at extreme conditions for degradingplant sources of cellulose. Bacteria from hot springs or fungi that can live at high or low pHconditions are being found and their enzyme activity tested. Your students can test theenzymatic ability of a common fungus to break down the provided substrate and determinehow efficient they are when compared to the enzyme in the kit.
Volume MeasurementsSterile graduated disposable plastic transfer pipets (DPTPs) are supplied with this kit andcan be used for volumes of 100, 250, 500, 750, and 1,000 µl. The illustration shows themarks on the DPTP corresponding to the volumes to be measured. Volumes over 1 ml willrequire multiple additions. It is recommended that students practice using the DPTPs topipet water before actually beginning the laboratory activities.
Mortars and PestlesIf running Activity 6 to test the ability of mushroom extracts to increase the reaction rate,mushrooms will be ground using a mortar and pestle. Please ensure that the mortar andpestles have been thoroughly washed and rinsed to remove any residual chemicals thatmay interfere with the ability of extracted cellobiase to function. Soap followed by a thoroughrinsing with water to remove any remaining soap should be sufficient.
1 ml
750 µl500 µl
250 µl
100 µl
Disposable plastic transfer pipet (DPTP) volumes
Quick Guide
Activity 1: Determine the ReactionRate in the Presence or Absenceof an Enzyme
1. Find your 15 ml conical tubes labeled“Stop Solution”, “1.5 mM Substrate”,“Enzyme” and “Buffer”. Write your initialson each tube.
2. Label five cuvettes E1–E5.
3. Label the two remaining cuvettes “Start”and “End”.
4. Using a clean DPTP, pipet 500 µl of stopsolution into each labeled cuvette. Rinsethe DPTP well with water.
5. Label one empty 15 ml conical tube“Enzyme Reaction” and the other“Control”.
6. Using a clean DPTP, pipet 2 ml of 1.5 mMsubstrate into the 15 ml conical tubelabeled “Enzyme Reaction”. Use thesame DPTP and pipet 1 ml of 1.5 mMsubstrate into the conical tube labeled“Control”. Rinse the DPTP well withwater.
7. Label one DPTP “E” for enzyme and theother “C” for control. Only use the DPTPlabeled “E” for the enzyme reaction tubeand the DPTP labeled “C” for the controlreaction tube.
26Quick Guide
QU
ICK
GU
IDE
Label up here
Stop Solution
1.5 mM Substrate ControlEnzyme reaction
Start End E1 E2 E3 E4 E5
Protocol
1. Locate the 15 ml conical tubes labeled “Stop Solution”, “1.5 mM Substrate”, “Enzyme”and “Buffer”. Label each of the tubes with your initials.
2. Label five cuvettes E1–E5 (for five time points). Label only the upper part of the cuvetteface.
3. Label the two remaining cuvettes “Start” and “End” on the upper part of the cuvette.The cuvettes will serve as control time points at the start and end of the reaction andneither cuvette will contain enzyme.
4. Using a clean DPTP, pipet 500 µl of stop solution into each of the seven labeledcuvettes. The stop solution is a strong base, so avoid getting it on your skin or clothes.Rinse the DPTP well with water and save it for future activities.
Stop solution Start End E1 E2 E3 E4 E5
5. Locate two empty 15 ml conical tubes. Label one “Enzyme Reaction” and the other “Control”.
6. Using a clean DPTP, pipet 2 ml of 1.5 mM substrate into the 15 ml conical tube labeled“Enzyme Reaction”. Use the same DPTP and pipet 1 ml of 1.5 mM substrate into theconical tube labeled “Control”. Rinse the DPTP well with water and save it for futureactivities.
1.5 mM Substrate Control Enzyme Reaction
43
STU
DE
NT
MA
NU
AL
AC
TIV
ITY
1
Student Manual
Label up here

CSN - Biology 196 Laboratory - Enzymes
9. Using the DPTP labeled “E”, pipet 1 ml of “Low enzyme concentration” into the 15 ml conical tube labeled “Enzyme Reaction”. Gently mix, then START YOUR TIMER. This marks the beginning of the enzymatic reaction.
10. At the times indicated below, use the DPTP labeled “E” to remove 500 μl of the solution from the “Enzyme Reaction” tube and add it to the appropriately labeled cuvette containing the stop solution.
11. After all the enzyme samples have been collected, use the DPTP labeled “C” to remove 500 μl of the solution from the “C” reaction tube and add it to the cuvette labeled “End”.
Quantitative determination of product formed in Activity 1
4. Measure the absorbance of your enzyme-catalyzed reaction cuvettes (E1–E5) and your control cuvettes (Start, End) at 410 nm, and record your results in Table 3.
5. Refer back to your standard curve and interpolate the amount of product formed in cuvettes E1-E5. Record your data in Table 3.
Determine the initial rate of product formation in Activity 1
At the beginning of the reaction there is a large amount of substrate present, but as the reaction proceeds there is less substrate available for the enzyme. To determine the initial rate you must first graph the amount of product formed vs. time. The slope of the linear portion of the line will be the rate. Use the supplied graphing plot below.
Table 3. Determining p-nitrophenol produced using a standard curve.
Time (minutes)
Cuvette Absorbance at 410 nm Amount of p-Nitrophenol (nmol)
0 Start
8 End
1 E1
2 E2
4 E3
6 E4
8 E5
of 5 13
7. Label one DPTP “E” for enzyme and the other “C” for control. Only use the DPTPlabeled “E” for the enzyme reaction tube and the DPTP labeled “C” for the controlreaction tube.
Read and understand steps 8–11 fully before proceeding. These steps are time sensitive!
8. Using the DPTP labeled “C”, pipet 500 µl of buffer into the 15 ml conical tube labeled“Control” and gently mix. Once you have mixed the buffer with the substrate, remove500 µl of this solution and add it to your cuvette labeled “Start”.
Buffer Control Control Start
9. Using the DPTP labeled “E”, pipet 1 ml of enzyme into the 15 ml conical tube labeled“Enzyme Reaction”. Gently mix, then START YOUR TIMER. This marks the beginningof the enzymatic reaction.
Enzyme Enzyme Reaction
10. At the times indicated below, use the DPTP labeled “E” to remove 500 µl of the solutionfrom the “Enzyme Reaction” tube and add it to the appropriately labeled cuvette containing the stop solution.
Enzyme Reaction E1, 1 min E2, 2 min E3, 4 min E4, 6 min E5, 8 min
44
STU
DE
NT M
AN
UA
LA
CTIV
ITY 1
Student Manual

CSN - Biology 196 Laboratory - Enzymes
Finally, to figure out the initial rate of the enzymatic reaction using the above graph we use the simple formula for slope.
Rate = Slope of the line = (change in Y) / (change in X) also known as “rise/run” in algebra.
Look at the portion of your graph that is linear (straight line). It will probably consist of times 1min to 8min. We’ll use only the linear portion of the line to figure out the rate.
Rate = (product at 8min – product at 1min) / (8 min – 1 min) = _____________________ nmol/min
Activity 2 - Determine the Effect of Temperature on the Reaction RateIn this activity you will determine the effect that temperatures have on the rate of cellobiase activity. Remember that every enzyme has different properties, so it isn’t always obvious which temperatures are optimal for a particular enzyme.
1. Label your cuvettes “0°C”, “22°C”, “37°C” and “100ºC”. Only label on the upper part of the cuvette face.
2. Using the DPTP labeled “stop” pipet 500 μl of stop solution into each cuvette.
3. Label four 1.5 ml microcentrifuge tubes with “0°C Enzyme”, “22°C Enzyme”, “37°C Enzyme” and “100ºC Enzyme”. Label a new DPTP “enzyme” and pipet 250 μl of enzyme into each microcentrifuge tube.
4. Label four 1.5 ml microcentrifuge tubes with “0°C Substrate”, “22°C Substrate”, “37°C Substrate” and “100ºC Substrate”. Using the DPTP labeled “substrate” pipet 500 μl of the 1.5 mM substrate into each microcentrifuge tube.
Time (min)0 2 4 6 8 10
0
Amou
nt o
f p-N
itrop
heno
l (nm
ols)
20
40
60
80
100
120
Saturday, January 26, 13
of 6 13
Additional supplies needed
Boiling water bath (100ºC)Ice bath (4ºC)Water bath at 37ºCmicrocentrifuge tubes

CSN - Biology 196 Laboratory - Enzymes
5. Place the microcentrifuge tubes labeled “0°C Enzyme” and “0°C Substrate” on ice. Place the microcentrifuge tubes labeled “22°C Enzyme” and “22°C Substrate” on your lab bench. Place the microcentrifuge tubes labeled “37°C Enzyme”, the “37°C Substrate” in the water bath at 37°C and place the tubes labeled “100ºC Enzyme” and “100ºC Substrate” in the boiling water bath. Allow the tubes to equilibrate to their respective temperatures for at least 5 minutes.
The next steps are time-sensitive. Be sure to read ahead before beginning!
6. Have a stopwatch ready. Using the DPTP labeled “E” pipet the 250 μl of enzyme from the tube labeled “0°C Enzyme” into the tube labeled “0°C Substrate”, and then place the tube now containing your enzyme and substrate mix back on ice. Use the same DPTP to combine the room temperature enzyme and substrate solutions, and place that tube back on the lab bench. Using the same DPTP, combine your 37°C substrate and enzyme solutions, and put that tube back into the 37ºC water bath. Using the same DPTP, combine your 100°C substrate and enzyme solutions, and put that tube back into the boiling water bath. Start your stopwatch.
7. After 2 minutes use a clean DPTP for each reaction to transfer 500 μl of your reactions to the appropriately labeled cuvettes containing stop solution. Mix the solutions gently with the DPTP. Allow all solutions in the cuvettes to reach room temperature for approximately 5 minutes. During this time you can move all of your enzymatic reactions from their temperature locations (boiling water bath, ice bath, etc.) to your table top.
8. Analyze your samples using the the spectrophotometer as was performed in Activity 1. Use your standard curve to interpolate the product formed and the rate of each reaction. Graph the amount of product formed vs. temperature (X axis) on one of the supplied graphing plots in the Appendix.
9. Calculate the initial rate of reaction for each of the three different temperatures. Since you only had one time point (2 minutes), you can assume the amount of p-Nitrophenol at 0 minutes is 0 nmol.
Initial rate at 0ºC = (product at 2min – 0 nmol) / (2 min – 0 min) = _____________________ nmol/minInitial rate at 22ºC = (product at 2min – 0 nmol) / (2 min – 0 min) = _____________________ nmol/minInitial rate at 37ºC = (product at 2min – 0 nmol) / (2 min – 0 min) = _____________________ nmol/minInitial rate at 100ºC = (product at 2min – 0 nmol) / (2 min – 0 min) = _____________________ nmol/min
10. Fill out Table 4 and then put the results on the classroom board to share your data with the other student groups
Table 4. Effects of temperature on cellobiase
Temperature Absorbance at 410 nm Amount of p-Nitrophenol (nmol)
Initial rate of product formation (nmol/min)
0ºC
~22ºC (room temperature)
37ºC
100ºC
of 7 13
CSN - Biology 196 Laboratory - Enzymes
Activity 3 - Determine the Effect of pH on Reaction RateIn this activity you will determine the effect that pH has on the rate of cellobiase activity. Recall how enzymes interact with their substrates. Because charges are used in hydrogen bonds and salt bridges, different levels of H+ ion can dramatically alter those bonds.
1. Label your cuvettes “pH 5.0”, “pH 6.3”, and “pH 8.6”. Only label on the upper part of the cuvette face.
2. Using the DPTP labeled “stop” pipet 500 μl of stop solution into each cuvette.
3. Using a new DPTP, pipet 250 μl of 3.0 mM substrate into each microcentrifuge tube labeled “pH 5.0”, “pH 6.3” and “pH 8.6” by your instructor.
The next steps are time-sensitive. Be sure to read ahead before beginning!
4. Have a stopwatch ready. Using the DPTP labeled “enzyme” add 250 μl of “low concentration enzyme” to each of the labeled microcentrifuge tubes and start your stopwatch.
5. After 2 minutes, using a clean DPTP for each pH reaction, transfer 500 μl of your reaction to the appropriately labeled cuvette containing stop solution. Mix the solutions with the DPTP.
6. Analyze your samples using the the spectrophotometer as was performed in Activity 1. Use your standard curve to interpolate the product formed and the rate of each reaction. Graph the amount of product formed vs. pH (X axis) on one of the supplied graphing plots in the Appendix.
7. Calculate the initial rate of reaction for each of the three different pH levels. Since you only had one time point (2 minutes), you can assume the amount of p-Nitrophenol at 0 minutes is 0 nmol.
Initial rate at pH 5.0 = (product at 2min – 0 nmol) / (2 min – 0 min) = _____________________ nmol/minInitial rate at pH 6.3 = (product at 2min – 0 nmol) / (2 min – 0 min) = _____________________ nmol/minInitial rate at pH 8.6 = (product at 2min – 0 nmol) / (2 min – 0 min) = _____________________ nmol/min
8. Fill out Table 5 and then put the results on the classroom board to share your data with the other student groups.
Activity 4 - Determine the Effect of Enzyme Concentration on the Reaction RateThe association of an enzyme with its substrate is dependent on many things, including an empty active site on the enzyme. Enzymes come into contact with their substrate(s) by random, Brownian Motion. If all the enzymes in solution are actively catalyzing the formation of product then the reaction rate will have reached its maximum speed (i.e. Vmax). The only way to increase the Vmax under set conditions is to add more enzyme. In this activity you will examine the effect that differing levels of
Table 5. Effects of pH on Cellobiase
pH Absorbance at 410 nm Amount of p-Nitrophenol (nmol) Initial rate of product formation (nmol/min)
pH 5.0
pH 6.3
pH 8.6
of 8 13
Additional supplies needed
3.0 mM substratepH 5.0 adjustment bufferpH 6.3 adjustment bufferpH 8.6 adjustment buffermicrocentrifuge tubes
Additional supplies needed
High concentration enzyme15 mL conical tube

CSN - Biology 196 Laboratory - Enzymes
enzyme have on a steady-state substrate concentration.
1. Obtain a tube of “High Concentration Enzyme”. Transfer the contents to a clean 15 ml conical tube and label it “High Concentration Enzyme”.
Label one, clean 15 ml conical tube “Low Concentration Enzyme”. Using a clean DPTP, pipet 1 ml of buffer into this tube. Then pipet 1 ml of the high concentration enzyme to your tube labeled “Low Concentration Enzyme” and swirl to mix.
2. Label three cuvettes “H1–H3” (for high enzyme concentration time points) and the remaining three
cuvettes “L1–L3” (for low enzyme concentration time points). Only label on the upper part of the cuvette face.
3. Using the DPTP labeled “stop” pipet 500 μl of stop solution into each cuvette.
4. Label one clean DPTP with an “H” for high enzyme concentration and a second clean DPTP with an “L” for low enzyme concentration.
The next steps are time-sensitive. Be sure to read ahead before beginning!
5. Using the DPTP labeled with an “H”, pipet 250 μl of 1.5 mM substrate into your 15 ml conical tube containing enzyme labeled “High Concentration Enzyme”.
6. Using the DPTP labeled with an “L”, pipet 250 μl of 1.5 mM substrate into your 15 ml conical tube containing enzyme labeled “Low Concentration Enzyme”. START YOUR TIMER.
7. At the times indicated in the figure below, use the correctly labeled DPTP to remove 500 μl from the 15 ml conical tubes labeled “High Concentration Enzyme” and “Low Concentration Enzyme”, and add it to the appropriately labeled cuvette that already contains the stop solution.
of 9 13
6. Using the DPTP labeled with an “L”, pipet 250 µl of 1.5 mM substrate into your 15 mlconical tube containing enzyme labeled “Low Concentration Enzyme”. START YOURTIMER.
1.5 mM Substrate Low concentration enzyme
7. At the times indicated in the table below, use the correctly labeled DPTP to remove 500 µl from the 15 ml conical tubes labeled “High Concentration Enzyme” and “LowConcentration Enzyme”, and add it to the appropriately labeled cuvette that alreadycontains the stop solution.
High concentration H1, 1 min H2, 2 min H3, 8 minenzyme reaction
Low concentration L1, 1 min L2, 2 min L3, 8 minenzyme reaction
Make sure to use only the DPTP labeled “H” for the high enzyme concentration reaction tube and the DPTP labeled “L” for the low enzyme concentration reaction tube.
Time Cuvette (High Concentration Enzyme) Cuvette (Low Concentration Enzyme)
1 min H1 L1
2 min H2 L28 min H3 L3
65
STU
DE
NT
MA
NU
AL
AC
TIV
ITY
4
Student Manual

CSN - Biology 196 Laboratory - Enzymes
8. Analyze your samples using the the spectrophotometer as was performed in Activity 1. Use your
standard curve to interpolate the product formed.
9. Calculate the initial rate of reaction for the two different concentrations of enzyme. Assume the amount of p-Nitrophenol at 0 minutes is 0 nmol, and use the amount of product after 1 minute for your calculations.
Initial rate of low enzyme concentration = (product at 1min – 0 nmol) / (1 min – 0 min) = _______________ nmol/min
Initial rate of high enzyme concentration = (product at 1min – 0 nmol) / (1 min – 0 min) = _______________ nmol/min
10. Fill out Table 6 and then put the results on the classroom board to share your data with the other student groups.
Activity 5 - Determine the Effect of Substrate Concentration on the Reaction RateAs discussed in the previous activity, enzymes come into contact with their substrate(s) by random, Brownian Motion. When concentrations of substrate are high the chances that the enzyme will collide with a substrate is much more likely than when substrate levels are low. In this activity you will examine the effect that differing substrate concentrations have on the reaction rate of the cellobiase enzyme.
1. Label one clean 15 ml conical tube “Low Concentration Substrate” and one clean 15 ml conical tube “High Concentration Substrate”.
2. Label a new DPTP “high substrate” and pipet 1.5 ml of 1.5 mM substrate into the 15 ml conical tube labeled “High Concentration Substrate”.
3. Label a new DPTP “buffer” and pipet 1.25 ml of buffer into the 15 ml conical tube labeled “Low Concentration Substrate”. Label a new DPTP “low substrate” and then pipet 250 μl of 1.5 mM substrate into the 15 ml conical tube labeled “Low Concentration Substrate” and mix.
4. Label your cuvettes “H1–H3” (for high concentration substrate time points) and “L1–L3” (for low concentration substrate time points). Only label on the upper part of the cuvette face.
5. Using the DPTP labeled “stop” pipet 500 μl of stop solution into each cuvette.
Table 6. Effects of Enzyme Concentration on Cellobiase
Cuvette Absorbance at 410 nm Amount of p-Nitrophenol (nmol)
H1
H2
H3
L1
L2
L3
of 10 13
Additional supplies needed
2 x 15 mL conical tube
CSN - Biology 196 Laboratory - Enzymes
The next steps are time-sensitive. Be sure to read ahead before beginning!
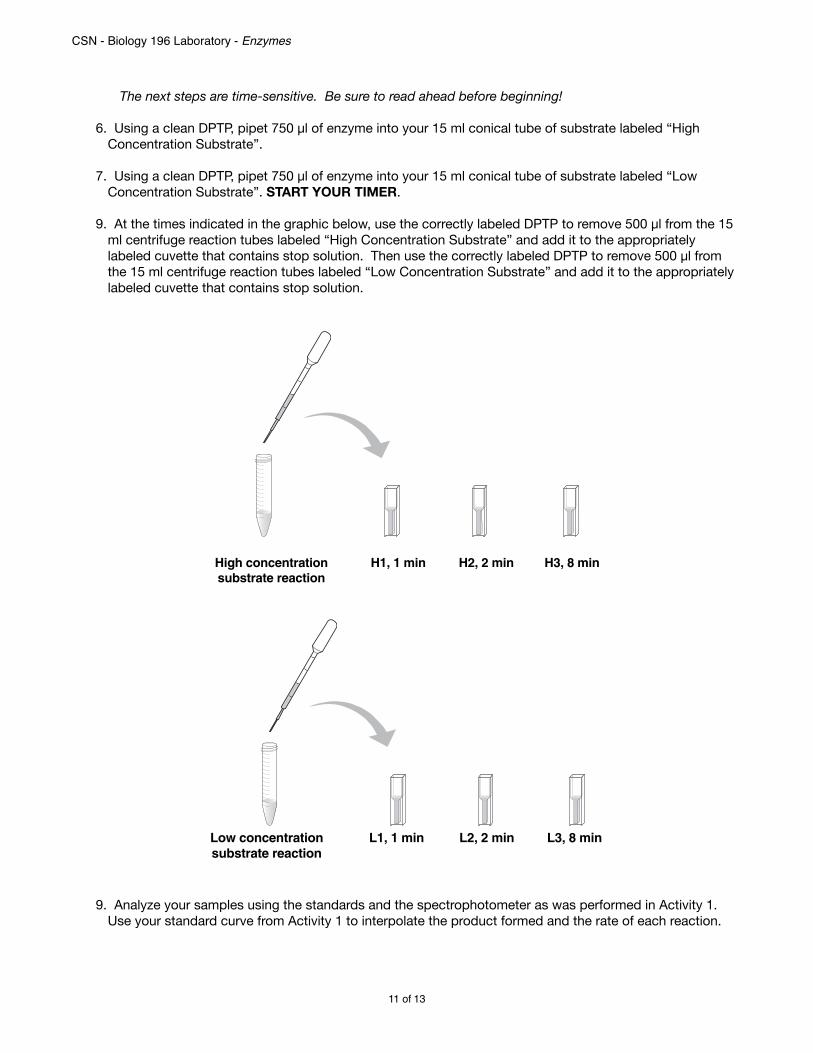
6. Using a clean DPTP, pipet 750 μl of enzyme into your 15 ml conical tube of substrate labeled “High Concentration Substrate”.
7. Using a clean DPTP, pipet 750 μl of enzyme into your 15 ml conical tube of substrate labeled “Low Concentration Substrate”. START YOUR TIMER.
9. At the times indicated in the graphic below, use the correctly labeled DPTP to remove 500 μl from the 15 ml centrifuge reaction tubes labeled “High Concentration Substrate” and add it to the appropriately labeled cuvette that contains stop solution. Then use the correctly labeled DPTP to remove 500 μl from the 15 ml centrifuge reaction tubes labeled “Low Concentration Substrate” and add it to the appropriately labeled cuvette that contains stop solution.
9. Analyze your samples using the standards and the spectrophotometer as was performed in Activity 1. Use your standard curve from Activity 1 to interpolate the product formed and the rate of each reaction.
of 11 13
9. At the times indicated in the table below, use the correctly labeled DPTP to remove 500 µl from the 15 ml centrifuge reaction tubes labeled “High Concentration Substrate”and “Low Concentration Substrate” and add it to the appropriately labeled cuvette thatcontains stop solution.
High concentration H1, 1 min H2, 2 min H3, 8 minsubstrate reaction
Low concentration L1, 1 min L2, 2 min L3, 8 minsubstrate reaction
Make sure to only use the DPTP labeled “H” for the high substrate concentrationreaction tube and the DPTP labeled “L” for the low substrate concentration reactiontube.
Time Cuvette (High Substrate) Cuvette (Low Substrate)1 min H1 L12 min H2 L28 min H3 L3
10. Rinse out all DPTPs with copious amounts of water and save them for later activities.After you have finished your analysis, rinse out your 2 reaction (conical) tubes and 6 cuvettes with copious water and save them for later activities.
Note: Do not discard the unused stock solutions or cuvettes containing standards. They willbe used for the next activity.
Qualitative Analysis of the Amount of Product Formed at Different SubstrateConcentrations
1. You should have five cuvettes of standards labeled S1–S5 at your lab bench. Takeyour H1–H3 and L1–L3 cuvette samples and make a note of the standard that bestmatches each cuvette color. Write down the concentration of that standard (from Table 14) into Table 15 for each of your reaction time point samples.
72
STU
DE
NT M
AN
UA
LA
CTIV
ITY 5
Student Manual

CSN - Biology 196 Laboratory - Enzymes
10. Calculate the initial rate of reaction for the two different concentrations of substrate. Assume the amount of p-Nitrophenol at 0 minutes is 0 nmol, and use the amount of product after 1 minute for your calculations.
Initial rate of low substrate concentration = (product at 1min – 0 nmol) / (1 min – 0 min) = _______________ nmol/min
Initial rate of high substrate concentration = (product at 1min – 0 nmol) / (1 min – 0 min) = _______________ nmol/min
11. Fill out Table 7 and then put the results on the classroom board to share your data with the other student groups.
Table 7. Effects of Substrate Concentration on Cellobiase
Cuvette Absorbance at 410 nm Amount of p-Nitrophenol (nmol)
H1
H2
H3
L1
L2
L3
of 12 13
CSN - Biology 196 Laboratory - Enzymes
Extra graph plots
Time (min)0 2 4 6 8 10
0
Amou
nt o
f p-N
itrop
heno
l (nm
ols)
20
40
60
80
100
120
Saturday, January 26, 13
Time (min)0 2 4 6 8 10
0
Amou
nt o
f p-N
itrop
heno
l (nm
ols)
20
40
60
80
100
120
Saturday, January 26, 13 of 13 13