biology option g: ecology & conservation - ib revision option g: ecology & conservation (hl...
TRANSCRIPT
Biology Option G: Ecology & Conservation
(HL & SL)
2014
Compiled from the IB Biology Guide for examinations beginning 2009, IB Past Papers, and the Bioninja Website for the non-commercial private use of M.H. Tan and friends.

G.1.1 Outline the factors that affect the distribution of plant species,
including temperature, water, light, soil pH, salinity and mineral nutrients. (3m)
plant distribution closely linked to levels of abiotic factors in the environment;
given organism can survive only within a certain temperature range to which it is adapted;
water is a limiting factor in most terrestrial ecosystems and plants are classified
according to ability to tolerate water shortage;
most plants can only tolerate narrow pH range;
light intensity/quality/wavelength and duration/photoperiod are important for
photosynthesis;
most plants cannot tolerate large fluctuations in salinity/high salinity;
mineral nutrients affect plant fertility/soil structure/water retention;
reference to herbivore activity;
G.1.2 Explain the factors that affect the distribution of animal species,
including temperature, water, breeding sites, food supply and territory. (3m)
animal distribution is related to abiotic and biotic (niche) requirements;
temperature must be within viable range based upon the adaptations of the animal;
water must be available in species-specific quantities (Gila lizards require less water than
elephants);
breeding sites are required for maintenance of the species;
food supply must be of the right kind for the species (e.g. nuts for squirrels and leaves for
rabbits);
territory is required for some species for breeding/feeding;
dissolved oxygen affects aquatic species as some organisms can tolerate low levels of
oxygen;
salinity affects distribution as some species are more sensitive than others to salt;
G.1.3 Describe one method of random sampling, based on quadrat methods, that is
used to compare the population size of two plant or two animal species.(6m)
G.1.4 Outline the use of a transect to correlate the distribution of plant or
animal species with an abiotic variable. (2m)
transect used when there is a transition in habitats and populations;
description of use of a line or belt transect;
height variation/light intensity/salinity/various abiotic factors can be recorded;
along the transect, along with sampling of plant species present;

G.1.5 Explain what is meant by the niche concept, including an organism’s
spatial habitat, its feeding activities and its interactions with other species.
(2m)
(ecological niche is) mode of existence/role of an organism within its ecosystem;
(ecological niche includes) its habitat/abiotic factors of the environment;
what the species eats / how the species obtains food;
interactions with other species;
the set of all ranges of limiting factors an organism tolerates
G.1.6 Outline the following interactions between species, giving two examples of
each: competition, herbivory, predation, parasitism and mutualism.
G.1.7 Explain the principle of competitive exclusion.
G.1.8 Distinguish between fundamental and realized niches. (2m)
Fundamental niche: the potential niche
Realized niche: the actual niche
the realized niche is often smaller than the fundamental niche(of a species);
competition/predation is reason for the differences (between fundamental and realized
niches);
G.1.9 Define biomass.
the total dry organic matter of living organisms/ecosystems
G.1.10 Describe one method for the measurement of biomass of different trophic
levels in an ecosystem. (3m)
organism/sample is cleaned of any other material (e.g. plant is pulled free of soil and
roots washed);
measure wet mass of organism/sample;
organism/sample is dried in an incubator/drying oven to constant mass;
biomass calculated based on wet mass of sample;
biomass is largest in lowest trophic level / lowest in highest trophic
levels / decreases from lower to higher trophic levels;
only 10–20% organic material/biomass passes up each tropic level;
organic material used for respiration / activity / lost as heat;
G.2.1 Define gross production, net production and biomass.
gross production:
amount of organic matter/biomass produced by plants / plant respiration
and net production;
net production:
amount of gross production of an ecosystem remaining after subtracting
the amount used in respiration/gross production — respiration;

G.2.2 Calculate values for gross production and net production using the equation:
gross production – respiration = net production.
GP – R = NP
G.2.3 Discuss the difficulties of classifying organisms into trophic levels.
G.2.4 Explain the small biomass and low numbers of organisms in higher trophic
levels. (2m)
energy transfer along the food chain is less than 100% efficient;
10% energy transfer between trophic levels;
nutrient transfer is less than 100% efficient;
each carnivore needs to consume many prey organisms;
tendency for size of organisms to increase as trophic level increases;
G.2.5 Construct a pyramid of energy, given appropriate information.
The units are kJ m–2 yr–1.
G.2.6 Distinguish between primary and secondary succession, using an example of
each.
Primary succession occurs on a surface lacking organic soil eg bare rock, whereas
secondary succession occurs on a surface stripped of plants but already having an
organic component.
G.2.7 Outline the changes in species diversity and production during primary
succession. (2m)
one/few species/lichens/moss at the start;
pioneer community slowly increases in species diversity;
production gradually increases as more soil develops/better conditions/
more diversity;
G.2.8 Explain the effects of living organisms on the abiotic environment, with
reference to the changes occurring during primary succession.
Include soil development, accumulation of minerals and reduced erosion. (3m)
named type of habitat; (e.g. land left after lava flow/glacier retreat /sand dune)
primary succession occurs on bare/lifeless substrate;
organisms move into an area and change its nature/pioneers colonize;
pioneers are simple autotrophs; (e.g. lichens grow first)
break down substrate; (e.g. to form organic soil)
leads to an eventual climax ecosystem; (e.g. forest)
stages in the succession follow a set sequence;
G.2.9 Distinguish between biome and biosphere.

a biome is a geographical region where similar climate conditions give rise to similar
vegetation (whereas) the biosphere refers to all areas of the Earth (atmosphere, hydrosphere,
lithosphere) where living things can be found
G.2.10 Explain how rainfall and temperature affect the distribution of biomes.
A climograph showing the biomes can be used to illustrate the interaction between
these two factors.
G.2.11 Outline the characteristics of six major biomes.
correctly named biome;
temperature range;
dominant plant/ecosystem characteristics;
Biome Temperature Moisture Vegetation
tropical rain forest hot;
little fluctuation
wet evergreen / stratified
/epiphytes
desert variable daily and
seasonally / extreme
daily variations /
some deserts cold and
some deserts hot
very dry, very low
rainfall/long
periods without
rain
few/scattered (with
bare ground) /
xerophytes
savanna high/little seasonal
fluctuations
dry/low
rainfall/long dry
season
grasses with
scattered trees
grassland cold to warm /
seasonal
fluctuations
medium dry /
moderate rainfall /
rainfall seasonal
mainly grasses
broadleaf /
deciduous forest
moderate,
seasonal variations /
cool winters, warm
summers
moist/moderate
rainfall / rain
throughout year
trees with broad
leaves/deciduous /
trees shed leaves (in
winter)
coniferous forest /
taïga
low temperatures,
seasonal variation /
very cold winters,
short cool summers
moist / moderate
rainfall / irregular
rainfall
conifers
tundra low temperatures /
very long cold winters
little precipitation,
mainly snow /
higher for alpine
herbaceous with
lichens and mosses /
shrubs / dwarf trees
G.3.1 Calculate the Simpson diversity index for two local communities.
D =
N = total number of organisms of all species found;
n = number of individuals of a particular species/per species;
)1(
)1(
nn
NN

G.3.2 Analyse the biodiversity of the two local communities using the Simpson
index.
G.3.3 Discuss reasons for the conservation of biodiversity using rainforests as
an example. (5m)
name of ecosystem:
e.g. (tropical) rainforest;
ethical reason:
every species has a right to life, regardless of whether it is useful/non
useful to humans;
potential of undiscovered medicines;
ecological reasons:
better use of the rainforest may occur by respecting the existing balance
in concert with the indigenous people;
native species are adapted to local conditions whereas invasive species are less likely to
be in balance;
species in the rainforest are interdependent so loss of species threatens the rest of the
community;
deforestation of rainforests increases soil erosion/silting of rivers/flooding/ CO2
atmospheric levels;
economic reasons:
ecotourism is a potential source of income;
aesthetic reasons:
loss of beauty of the system;
artists are inspired by the images/flowers/animals of rainforests;
heritage/cultural reasons:
maintenance of the rainforest preserves human cultural diversity;
G.3.4 List three examples of the introduction of alien species that have had
significant impacts on ecosystems.
Accidental: rats accidentally introduced to mainland of New Zealand from visiting
ships

G.3.5 Discuss the impacts of alien species on ecosystems.(3m)
alien species have characteristics that may enable them to out-compete native species;
lack of predators may allow alien species to reproduce more rapidly;
alien species may utilize areas or resources that native species cannot;
predation by invasive species can cause loss of biodiversity;
can lead to species extinction, especially of endangered species;
alien species may introduce new diseases;
use of alien species for biological control can be ineffective or negative;
G.3.6 Outline one example of biological control of invasive species.
G.3.7 Define biomagnification.
Biomagnification is a process in which chemical substances become more concentrated at
each trophic level.
G.3.8 Explain the cause and consequences of biomagnification, using a named
example.
biomagnification is a process in which chemical substances become more concentrated
at each trophic level;
certain toxins will accumulate in the body;
fat soluble toxins have a longer half life/will accumulate in body tissues;
examples are: DDT/TBT/organophosphates/mercury/other;
effects of toxins can be magnified up the food chain;
top predators/consumers/carnivores have highest concentrations stored in
their body;
For named example include:
source of toxin e.g. TBT anti-fouling paint used on ships;
how it enters food chain e.g. taken up by filter feeders;
links in food chain;
effect on top consumer;
ecosystem/community affected;

G.3.9 Outline the effects of ultraviolet (UV) radiation on living tissues and
biological productivity.
ultraviolet/UV light penetrates tissues;
damages DNA / causes gene mutation;
can lead to uncontrolled cell division/mitosis;
stimulates the production of vitamin D;
stimulates the synthesis of pigments/melanin;
can cause skin cancer / cataracts;
affects photosynthesis;
small amount beneficial
used to kill microbes/water purification;
used to treat jaundice in newborn infants;
G.3.10 Outline the effect of chlorofluorocarbons (CFCs) on the ozone layer(4-6m).
UV light causes CFCs to release chlorine;
CFCs cause ozone to form oxygen (by chlorine atoms reacting);
causes a reduction in ozone concentration (allowing more UV to enter);
increases the ozone hole;
particularly effective in the Antarctic spring;
effective in very low concentrations / a small amount of CFC can destroy a large amount
of ozone;
G.3.11 State that ozone in the stratosphere absorbs UV radiation.
G.4.1 Explain the use of biotic indices and indicator species in monitoring
environmental change. (6m)
indicator species sensitive to specific environmental conditions needed to survive;
monitor population size of indicator species over time;
biotic index can be calculated;
low overall score when abundance of tolerant species / lack of indicator species / vice
versa;
represent summation of factors/overall assessment of environmental conditions;
time consuming / species not easy to identify (need keys) / species may not be present for
other reasons such as season / another disadvantage
methodology is simple / minimum equipment needed;
needs a reference study/guide to compare;

example of variable e.g. oxygen level / temperature / heavy metals / sulphur dioxide in
air / other;
example of appropriate indicator species e.g. Tubifex to heavy metals /
Chironomis to low oxygen levels / lichens to sulphur dioxide / other;
G.4.2 Outline the factors that contributed to the extinction of one named animal
species.
passenger pigeon (became extinct when) hunted as a source of food
G.4.3 Outline the biogeographical features of nature reserves that promote the
conservation of diversity. (3m)
size;
edge effect;
example of edge effect;
habitat corridor;
example of habitat corridor;
habitat/niche diversity;
human management; 3 max
e.g. size:
large reserves usually promote diversity more effectively than small ones;
habitat corridor:
permit organisms to move between different parts of a fragmented habitat;
example of habitat corridor:
tunnels under roads;
habitat/niche diversity:
functioning reserve requires a diversity of niches to support the ecosystem
structure;
human management:
banning hunting/lumbering/petroleum exploitation;
example of edge effect:
cowbird lays eggs in nests of other birds near edges of forests / fragmentation
of forests increased cowbirds as more edges;
edge effect:
cause different ecology of central areas compared to edges;
edge effect is the contrast between different environments/from central area of reserve;
small reserves have more edge effect;
as fragmentation increases so does edge (effect);
example of edge effect (e.g. cowbirds that lay eggs in edge will
increase);
G.4.4 Discuss the role of active management techniques in conservation.
G.4.5 Discuss the advantages of in situ conservation of endangered species
(terrestrial and aquatic nature reserves).
a. in situ conservation is carried out in nature reserves/natural habitats;
b. named example of a species that is being conserved in situ;
c. in situ conservation reduces possibility that habitat disappears and the whole
community is lost / may prevent the total number of species that become endangered
from increasing;
d. allows species to live in an environment for which they are adapted / they are able to
fit into their normal food chains;
e. threatened species in a reserve may be monitored for further deterioration in numbers
/ remedial steps can be taken;
f. offspring acquire skills from parents/peers around them / offspring acquire natural
behaviour;
g. reserves and protected areas in various parts of the world can share experience on
how to manage them successfully;
h. nature reserves are popular sites for the public to visit maintaining
awareness/education/scientific study;
i. reserves are places to return endangered individuals from breeding programmes as
they provide realistic conditions for re-adaptation / OWTTE; [6 max]
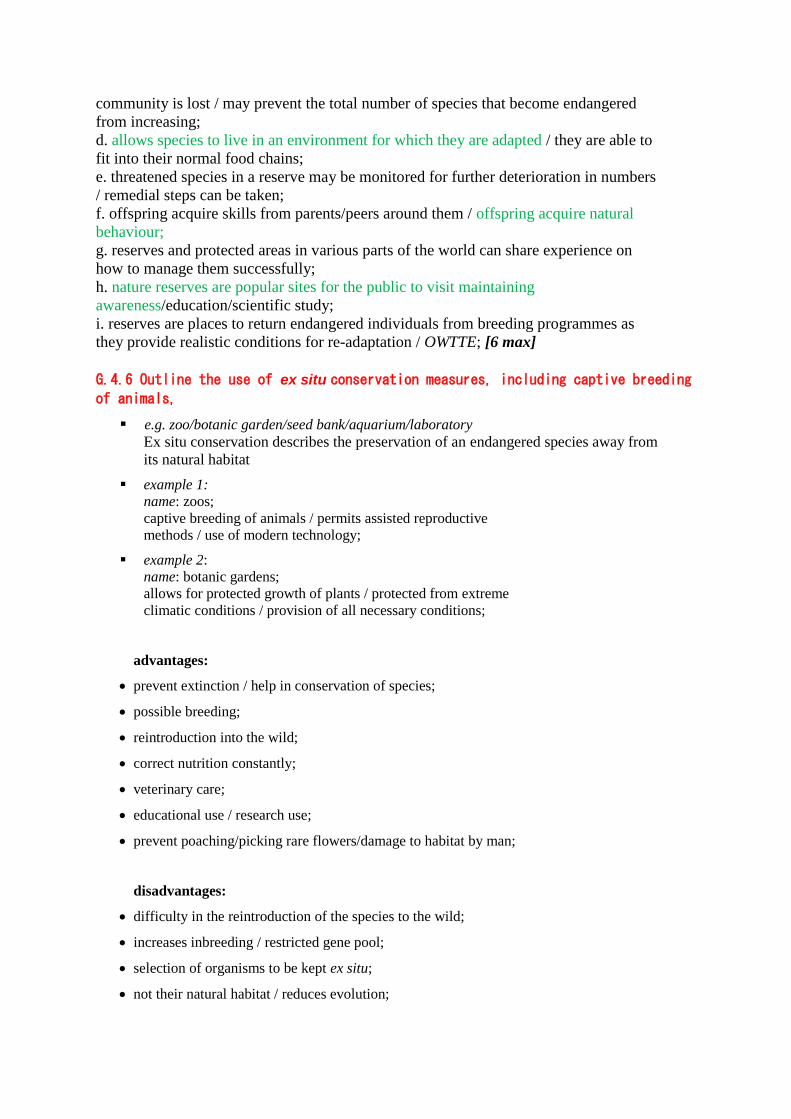
G.4.6 Outline the use of ex situ conservation measures, including captive breeding
of animals,
e.g. zoo/botanic garden/seed bank/aquarium/laboratory
Ex situ conservation describes the preservation of an endangered species away from
its natural habitat
example 1:
name: zoos;
captive breeding of animals / permits assisted reproductive
methods / use of modern technology;
example 2:
name: botanic gardens;
allows for protected growth of plants / protected from extreme
climatic conditions / provision of all necessary conditions;
advantages:
prevent extinction / help in conservation of species;
possible breeding;
reintroduction into the wild;
correct nutrition constantly;
veterinary care;
educational use / research use;
prevent poaching/picking rare flowers/damage to habitat by man;
disadvantages:
difficulty in the reintroduction of the species to the wild;
increases inbreeding / restricted gene pool;
selection of organisms to be kept ex situ;
not their natural habitat / reduces evolution;

does not solve the cause/problem e.g. habitat loss;
G.5.1 Distinguish between r-strategies and K-strategies. (6m)
r-strategy K-strategy
Many offspring at a time Few offspring at a time
Little care of offspring Much care of offspring
High mortality rate Low mortality rate
Small body size Large body size
Short lifespan Long lifespan
Reproduce only once Reproduce repeatedly
Favoured by unstable/changing environments Favoured by stable/consistent environments
Pioneer species Climax species
Variable population size Stable population size
G.5.2 Discuss the environmental conditions that favour either r-strategies or K-
strategies (6m)
r-strategy occurs in unstable environment/where there are ecological disruptions;
resources used to maximize reproducing (once);
for example in coastal rock pools / other example;
pathogens/pest species have r-strategies / other example of r-strategy organism;
in stable/predictable environments K-strategy predominates;
more resources are invested for long-term survival
are large so require large habitats;
slow maturation requiring longer protection from predators
perform better in an environment with high levels of competition
for example in forests / other example;
trees / humans / whales / other example of K-strategy organism;
difficult to determine strategy / r- and K-strategies represent two extremes in a range of
strategies;
G.5.3 Describe one technique used to estimate the population size of an animal
species based on a capture– mark–release–recapture method. (4m)
capture–mark–release–recapture method;
marked unit area;
apply a paint spot/ear tag/leg ring/radio transmitter to the captured rabbits;
sufficient time must elapse to allow mixing of population to occur;
second capture must be from same marked area;
calculate the Lincoln index / population size = ; 3
21
n
nn
n1 = first capture, n2 = second capture, n3 = number marked in
second capture;
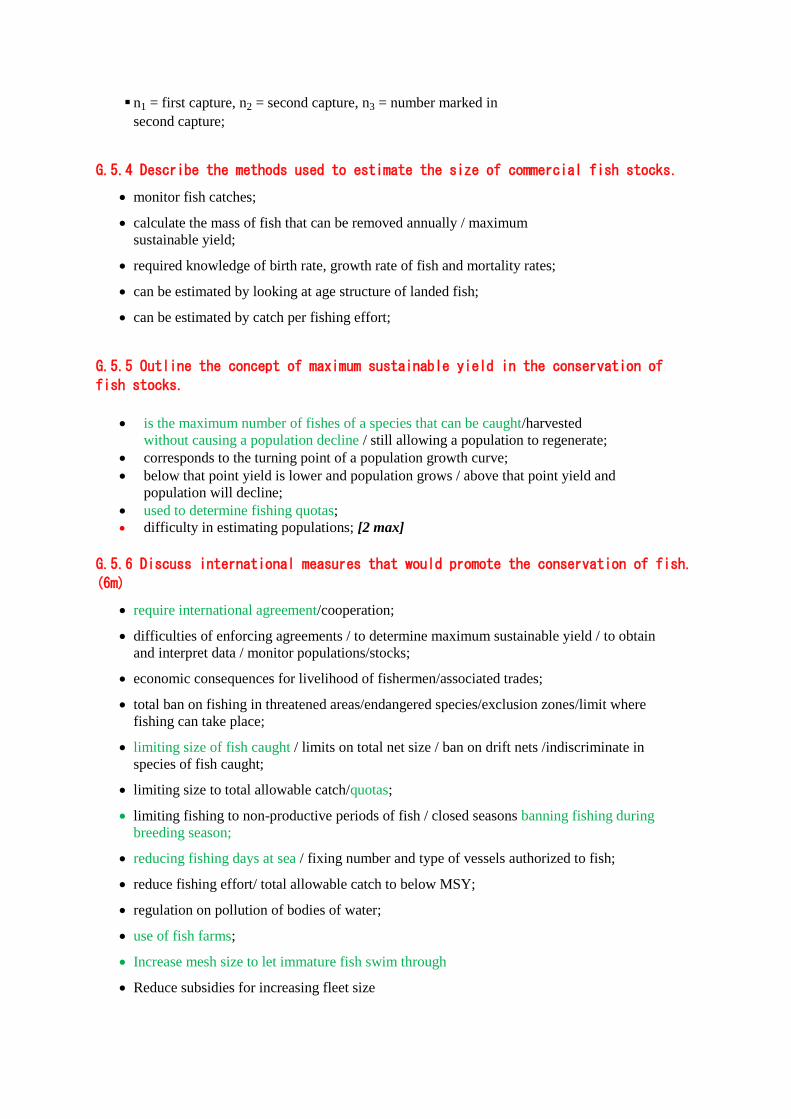
G.5.4 Describe the methods used to estimate the size of commercial fish stocks.
monitor fish catches;
calculate the mass of fish that can be removed annually / maximum
sustainable yield;
required knowledge of birth rate, growth rate of fish and mortality rates;
can be estimated by looking at age structure of landed fish;
can be estimated by catch per fishing effort;
G.5.5 Outline the concept of maximum sustainable yield in the conservation of
fish stocks.
is the maximum number of fishes of a species that can be caught/harvested
without causing a population decline / still allowing a population to regenerate;
corresponds to the turning point of a population growth curve;
below that point yield is lower and population grows / above that point yield and
population will decline;
used to determine fishing quotas;
difficulty in estimating populations; [2 max]
G.5.6 Discuss international measures that would promote the conservation of fish.
(6m)
require international agreement/cooperation;
difficulties of enforcing agreements / to determine maximum sustainable yield / to obtain
and interpret data / monitor populations/stocks;
economic consequences for livelihood of fishermen/associated trades;
total ban on fishing in threatened areas/endangered species/exclusion zones/limit where
fishing can take place;
limiting size of fish caught / limits on total net size / ban on drift nets /indiscriminate in
species of fish caught;
limiting size to total allowable catch/quotas;
limiting fishing to non-productive periods of fish / closed seasons banning fishing during
breeding season;
reducing fishing days at sea / fixing number and type of vessels authorized to fish;
reduce fishing effort/ total allowable catch to below MSY;
regulation on pollution of bodies of water;
use of fish farms;
Increase mesh size to let immature fish swim through
Reduce subsidies for increasing fleet size