biomass and bioenergy - wur › upload_mm › d › a › a › 93e1b953-a777-43f6-a42… · in...
TRANSCRIPT

Contents lists available at ScienceDirect
Biomass and Bioenergy
journal homepage: www.elsevier.com/locate/biombioe
Research paper
The potential role of waste biomass in the future urban electricity system
Yu Jianga, Edwin van der Werfb,1, Ekko C. van Ierlandb, Karel J. Keesmana,∗
a Biobased Chemistry and Technology, Wageningen University & Research, PO Box 17, 6700 AA, Wageningen, The Netherlandsb Environmental Economics and Natural Resources Group, Wageningen University & Research, Hollandseweg 1, 6706 KN, Wageningen, The Netherlands
A R T I C L E I N F O
Keywords:Urban electricity systemBiomassBioenergyPower system modellingIntermittent renewable energyWaste stream
A B S T R A C T
The share of intermittent renewable electricity (IRE) in the future urban electricity system is expected to increasesignificantly. Sufficient back-up capacity is needed in the period when IRE output is low. Bioenergy is bothdispatchable and carbon-neutral, and can hence be a promising option to back up IRE. The objective of this studyis to explore the potential of urban waste biomass in backing up IRE in an urban electricity system. An urbanelectricity system model is developed to project future electricity generation configurations. Given the projectedelectricity generation configuration, the potential demand for bioenergy as back-up capacity is estimated bysimulating hourly electricity demand and the supply of IRE for a whole year. The estimated potential demand forbioenergy is then compared with the potential supply of bioenergy from the urban waste stream. We apply ourmodel using data for the city of Amsterdam, the Netherlands. The complementarity of wind and solar energy isfound to reduce the demand for back-up capacity from bioenergy. An extreme weather day with hardly any windand solar energy supply requires about 2800 tonne waste biomass per day in an emission reduction scenario and1300 tonne waste biomass per day in a renewable energy quota scenario, respectively. The average daily wastebiomass generated in the city is about 1400 tonne. Bioenergy storage as a buffer is found to be necessary due tothe monthly fluctuations in both the supply and demand of waste biomass.
1. Introduction
The Paris Agreement set a target of achieving a global net-zero carboneconomy within this century [1]. The transition of urban electricity systems,as part of the low-carbon city development, is essential in cutting carbonemissions, since cities account for 75% of global energy consumption and80% of global greenhouse gas (GHG) emissions [2]. An urban electricitysystem can be defined as a system that combines different processes ofelectricity production to meet the electricity demand of a given urban area[3,4]. Megacities in the world are leading the transition and taking actionsto reduce GHG emissions (e.g. the formation of C40 Cities, which is anetwork of the world's megacities taking actions to reduce the emissions), toachieve sustainability, self-sufficiency and climate-resilience. The share ofintermittent renewable energy (IRE) is expected to increase significantly ina decarbonized urban electricity system. The consequence is that in theperiod when the IRE output is low, sufficient back-up capacity is required tomeet the demand. According to [5], the increasing penetration of inter-mittent renewable energy will lead to an increasing demand for grid bal-ance. Flexible bioenergy supply has the potential to contribute to gridbalance and decarbonization considering its advantages in being both dis-patchable and carbon-neutral [6–8].
An open question is how much bioenergy will be required as back-up capacity in the future electricity system of cities. It is of high interestto answer this question in order to make robust energy policies andstrategies. The future demand for flexible bioenergy will be affected byrenewable energy policy measures. Currently, in some regions incon-sistency between the renewable energy policy ambitions and biomassavailability exists [9]. Furthermore, strategies for securing a sustainablebiomass supply are absent from most national strategies [10]. A relatedquestion is how much back-up capacity can be obtained from the urbanwaste stream. There is an increasing interest in developing biomassfeedstock from the urban waste stream to avoid the food versus fueltrade-off [11] and the sustainability disputes of first generation bioe-nergy [12,13]. Furthermore, using biomass from the waste stream forelectricity generation can contribute to more effective urban wastemanagement. In this paper, biomass feedstock from the waste streamwill be addressed as ”waste biomass”. Waste biomass in cities includesthe organic part of municipal solid wastes, urban green residues, foodprocessing wastes and manures.
The objective of this paper is to develop a framework to assess thelow-carbon electricity system for cities and the potential role of wastebiomass in backing up intermittent renewable energy. We apply the
http://dx.doi.org/10.1016/j.biombioe.2017.10.001Received 6 March 2017; Received in revised form 29 September 2017; Accepted 5 October 2017
∗ Corresponding author.
1 Van der Werf is a CESifo Research Network Fellow.E-mail address: [email protected] (K.J. Keesman).
Biomass and Bioenergy 107 (2017) 182–190
0961-9534/ © 2017 Elsevier Ltd. All rights reserved.
MARK
framework using data for the city of Amsterdam, the Netherlands. Theresearch questions studied in this paper include: (1) What are low-carbon electricity generation configurations in Amsterdam in 2050? (2)What is the required back-up capacity in the urban electricity systemfor these low-carbon scenarios? (3) How much of this back-up capacitycan be obtained from the urban waste stream in the city?
This paper contributes to the biomass and bioenergy literature byusing an energy system modelling approach to provide insights into thepotential of bioenergy from urban waste streams in balancing the futureelectricity system. The novelty added is the focus on the city level, andthe linking of demand for bioenergy to the biomass availability in theurban waste stream. The methodological framework and analysis cansupport policy-makers in cities in making robust policies and strategiesand in avoiding inconsistencies between urban bioenergy policy am-bitions and local biomass availability.
From the biomass resource availability perspective, a number ofstudies have estimated the bioenergy potential at the global level[14–17]; the regional level, such as the EU [18]; or the national level[19–21]. Only a few focused on the city level [22–24]. The link to thedemand for bioenergy from the urban electricity system has not yetbeen studied. The potential of bioenergy has been analysed using a cost-supply analysis [25,26] or an energy system modelling approach[27–29] at regional level (e.g. the EU) or national level. To the bestknowledge of the authors, no study has investigated the bioenergypotential from the waste stream on a city level using an energy systemmodelling approach.
The rest of this paper is structured as follows: Section 2 introducesthe research method. Section 3 gives an overview of the data requiredand introduces the case study of Amsterdam. Sections 4 and 5 introducethe model scenarios and present results. Section 6 and section 7 give thediscussion and the conclusions, respectively.
2. Methodology
2.1. Methodological framework
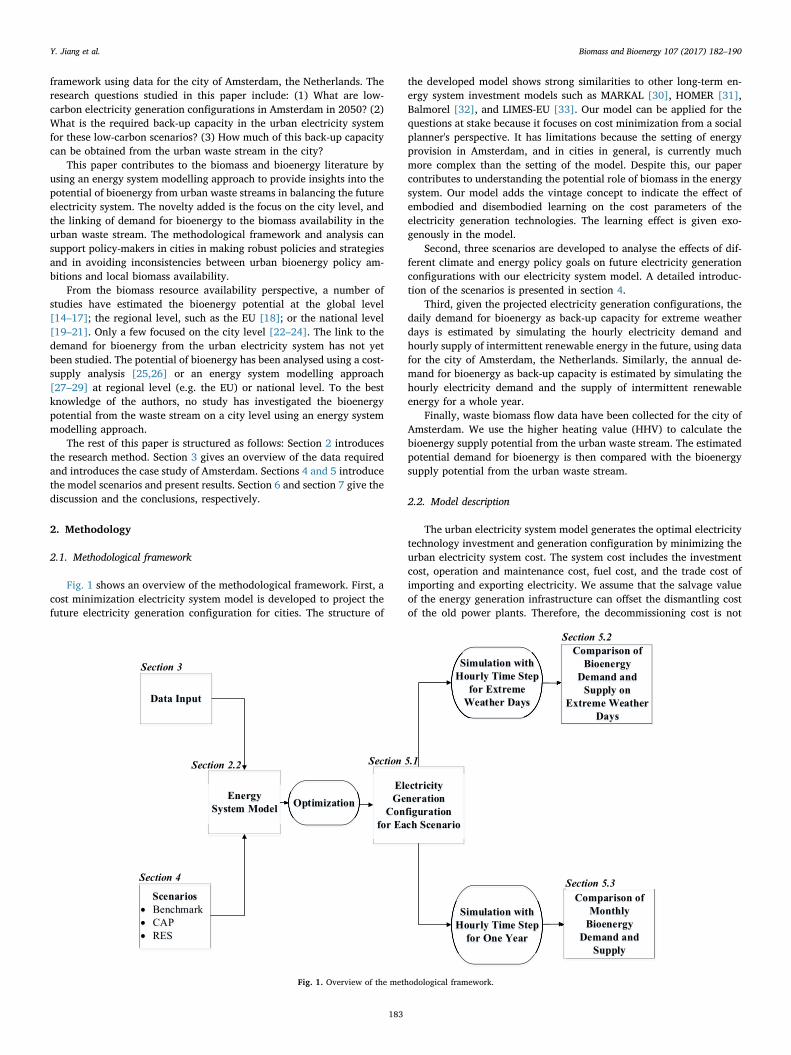
Fig. 1 shows an overview of the methodological framework. First, acost minimization electricity system model is developed to project thefuture electricity generation configuration for cities. The structure of
the developed model shows strong similarities to other long-term en-ergy system investment models such as MARKAL [30], HOMER [31],Balmorel [32], and LIMES-EU [33]. Our model can be applied for thequestions at stake because it focuses on cost minimization from a socialplanner's perspective. It has limitations because the setting of energyprovision in Amsterdam, and in cities in general, is currently muchmore complex than the setting of the model. Despite this, our papercontributes to understanding the potential role of biomass in the energysystem. Our model adds the vintage concept to indicate the effect ofembodied and disembodied learning on the cost parameters of theelectricity generation technologies. The learning effect is given exo-genously in the model.
Second, three scenarios are developed to analyse the effects of dif-ferent climate and energy policy goals on future electricity generationconfigurations with our electricity system model. A detailed introduc-tion of the scenarios is presented in section 4.
Third, given the projected electricity generation configurations, thedaily demand for bioenergy as back-up capacity for extreme weatherdays is estimated by simulating the hourly electricity demand andhourly supply of intermittent renewable energy in the future, using datafor the city of Amsterdam, the Netherlands. Similarly, the annual de-mand for bioenergy as back-up capacity is estimated by simulating thehourly electricity demand and the supply of intermittent renewableenergy for a whole year.
Finally, waste biomass flow data have been collected for the city ofAmsterdam. We use the higher heating value (HHV) to calculate thebioenergy supply potential from the urban waste stream. The estimatedpotential demand for bioenergy is then compared with the bioenergysupply potential from the urban waste stream.
2.2. Model description
The urban electricity system model generates the optimal electricitytechnology investment and generation configuration by minimizing theurban electricity system cost. The system cost includes the investmentcost, operation and maintenance cost, fuel cost, and the trade cost ofimporting and exporting electricity. We assume that the salvage valueof the energy generation infrastructure can offset the dismantling costof the old power plants. Therefore, the decommissioning cost is not
Fig. 1. Overview of the methodological framework.
Y. Jiang et al. Biomass and Bioenergy 107 (2017) 182–190
183
explicitly considered in this paper. The spatial heterogeneity of theinvestment cost within the city of Amsterdam is taken into account toallow for location-dependent investment decisions, therefore, the city isdivided into several districts to reflect spatial heterogeneity. The in-vestment and generation decisions are based on perfect foresight.Transmission and distribution costs between the districts, however, areignored. The constraints of the model include the electricity supply anddemand balance, the electricity generation capacity constraint and theenvironmental policy constraint reflected in the scenarios.
The dynamics of the electricity demand and the fluctuations of thewind and solar electricity generation are reflected in the model by usinga time slices approach, where one year is divided into four seasons. Arepresentative day of each season is selected and then divided into sixtime slices to take the daily temporal dynamics into consideration.Electricity supply and demand should balance at each point in time.The time horizon for the evaluation is set from 2010 through 2050. Toavoid an end-of-time-horizon effect, the model planning horizon isextended to 2150. The investment and model time step is 5 years. Theinvestment in each period occurs at the beginning with the resultinginstalled capacity available throughout the entire period. The modelhas been written in the General Algebraic Modelling System (GAMSVersion 24.6) and solved by the CPLEX solver.
Equation (1) describes the objective of the cost minimization model,which is to minimize the discounted system cost of the urban electricitysystem. The decision variables of the model are Q t( ), the electricitygeneration capacity expanded in year t in MW and G t( ), the activeelectricity generation capacity in year t in MW. We suppress technologyand district subscripts here to ease notation. The cost variables in theobjective function at the right-hand side of Equation (1) are all de-termined by the decision variables.
∑= + + +
+
=
− −ρ C t C t C t
C t
minimize NPV (1 ) ( ( ) ( ) ( )
( ))
Q t G t t T
Tt T
( ), ( )( )
inv om fuel
trade
0
0
(1)
NPV is the net present value of urban energy system cost in M€; t istime in years; T0 is the start of the investment time horizon; T is the endof the investment time horizon; ρ is the discount rate; C t( )inv is theinvestment cost in M€ in year t; C t( )om is the operation and main-tenance (O &M) cost in M€ in year t; C t( )fuel is the fuel cost with unitM€ in year t; C t( )trade is the import cost minus export revenue in M€ inyear t. All variables are positive except C t( )trade , which may be negative.
The investment cost function is given by
∑ ∑= ⋅ ∀ =C t α v Q v t v( ) ( ( ) ( ))r
R
i
I
r i r iinv ( , ) ( , )(2)
where α v( )r i( , ) is the unit investment cost of technology i of vintage v indistrict r in M€/MW; and Q v( )r i( , ) is the expanded electricity generationcapacity of technology i of vintage v in district r in MW.
The O&M cost function is given by
∑ ∑ ∑
∑ ∑ ∑ ∑
=
+
=
=
C t β t K t
γ t l G t
( ) ( ( )· ( ))
( ( )·( · ( )))
r
R
i
I
v
t
r i v r i v
r
R
i
I
v
t
τ
N
r i v τ r i v τ
om0
( , , ) ( , , )
0( , , ) ( , , , )
τ
(3)
where β t( )r i v( , , ) is the unit fixed O &M cost for technology i of vintage vin period t in district r in M€/MW; K t( )r i v( , , ) is the total installed ca-pacity of technology i of vintage v in period t in district r in MW; γ t( )r i v( , , )is the unit variable O &M cost of electricity generation technology i ofvintage v in period t in district r in M€/MWh; lτ is the length of timeslices in hours; G t( )r i v τ( , , , ) is the active capacity of technology i of vin-tage v in time slice τ in period t in MW in district r. This equationcalculates the sum of fixed O&M cost and variable O &M cost. As weconsider a city system, transmission and distribution costs are ignoredin our model.
The fuel cost function is given by
∑ ∑ ∑ ∑ ∑=C t σ t P t( ) ( )· ( )r
R
j
J
v
t
τ
N
f
N
f r j v τ ffuel ( ) ( , , , , )
τ f
(4)
where σ t( )f( ) is the fuel f price in period t in M€/GJ; and P t( )r j v τ f( , , , , ) isthe primary energy consumption of technology j of vintage v that usesfuel f in time slice τ in period t in district r in GJ.
The trade cost function is given by
∑ ∑= −C t pi t I t po t O t( ) ( ( )· ( ) ( )· ( ))r
R
τ
N
r τ r τtrade ( , ) ( , )
τ
(5)
where pi t( ) is the import price of electricity in period t in M€/MWh;I t( )r τ( , ) is the imported electricity from outside of the city territory intodistrict r in time slice τ in period t in MWh; po t( ) is the export price ofelectricity in year t in M€/MWh; O t( )r τ( , ) is the exported electricity fromdistrict r to outside of the city territory in time slice τ in period t withunit MWh. This equation calculates the positive or negative net incomeof trading electricity in the city.
The electricity supply and demand balance equation is given by
∑ ∑ ∑ ∑+ = ⎛
⎝⎜ + ⎞
⎠⎟
=
D t l O t G t l I t( )· ( ) ( ( )· ) ( )τ τr
R
r τr
R
i
I
v
t
r i v τ τ r τ( ) ( , )0
( , , , ) ( , )(6)
where D t( )τ( ) is the power load in the city in time slice τ in period t inMW.
The fuel consumption equation is given by
∑ = ⋅ ∀ ≤η v P t ε G t l v t( )· ( ) · ( )f
N
j f r j v τ f r j v τ τ( , ) ( , , , , ) ( , , , )
f
(7)
where η v( )j f( , ) is the fuel conversion efficiency ( < <η v0 ( ) 1j f( , ) ) oftechnology j of vintage v that consumes fuel f; ε is the unit conversionscalar to convert electricity consumption (MWh) to fuel consumption(GJ) and has a value of 3.6. Fuel conversion efficiency is defined as thetotal delivery of electricity to the grid divided by the fuel consumption.
The capacity constraint equation is given by
≤G t w K t( ) · ( )r i v τ i τ r i v( , , , ) ( , ) ( , , ) (8)
where w i τ( , ) is the availability factor ( < <w0 1i τ( , ) ) of technology i intime slice τ. This equation introduces the constraint for each energygeneration technology of each vintage.
The GHG emission equation is given by
∑ ∑ ∑==
E r t e ζ l G t( , , ) · · ( )i
I
v
t
τ
N
i e τ r i v τ0
( , ) ( , , , )
τ
(9)
where E r t e( , , ) is the quantity emitted of pollutant e in district r inperiod t in kt; ζ i e( , ) is the emission coefficient in kt/MWh. The emissioncoefficient uses the results of life cycle assessment of various energytechnologies.
In one of the scenarios we introduce a CO2 emission target. Theemission constraint equation is given by
∑ ≤E r t e E t e( , , ) ( , )r
R
max(10)
where E t e( , )max is the emission ceiling of emission type e (e.g. CO2
emission in our case study) in kt.Capacity degradation varies by vintage and develops as follows:
= =− ≤ < + = −
≤ − =
v t K t Q vt ψ v i v t K t κ K t
v t ψ v i K tK T
for , ( ) ( )for ( , ) , ( 1) (1 )· ( )
for ( , ), ( ) 0( ) given.
r i v r i
r i v r i v
r i v
r i v
( , , ) ( , )
( , , ) ( , , )
( , , )
( , , ) 0 (11)
ψ v i( , ) is the life time of technology i of vintage v. When vintage v isinstalled, =v t and K t( )r i v( , , ) is equal to the capacity invested, Q v( )r i( , ) .
Y. Jiang et al. Biomass and Bioenergy 107 (2017) 182–190
184
The vintage concept is used to indicate when a certain amount ofgeneration capacity is deployed. Combining the vintage concept withthe technology life time parameter, the decommissioning and new ca-pacity investment are calculated. Investment in new capacity of thetechnology will take place if it leads to the optimal solution of the costminimization model. When the technology is within the physical lifetime of its vintage, the technology capacity decreases at rate κ. Whenphysical life time is reached, the technology is decommissioned.Installed capacity at the start of the planning horizon is given.
3. Case study and data collection
Amsterdam, the capital of the Netherlands, is selected as the city forour case study, as the city is pursuing to become a sustainable, self-sufficient and climate-resilient city [34]. In 2015, Amsterdam had apopulation of 821 752 [35]. It is located 52.3702°N, 4.8952°E, and hasa temperate maritime climate. The city has set ambitious goals in re-ducing GHG emissions. In addition, it aims at increasing the amount ofrenewable energy production per capita with 20% relative to 2013 by2020 by producing more wind and solar energy [34].
In this paper, we assume that the electricity system for Amsterdamis isolated from its surrounding electricity network and operated in anisland mode. This specific setting reflects the vision and the local de-termination of the city of Amsterdam to become energy self-sufficient inthe future. This specific setting is also useful to many other cities, suchas Barcelona, that are taking steps towards energy self-sufficiency. Self-sufficiency is a political issue emerging as a key energy policy goal as itwould help reduce electricity transmission loss, improve local elec-tricity supply security, stimulate the local economy, and strengthen thelocal control of energy production, which gives all stakeholders astronger local identity.
The data of the electricity demand, with a temporal resolution of15 min, were obtained from Alliander, a Dutch energy network com-pany. These electricity demand data are from two transformer stationsin Amsterdam and do not represent the total electricity demand of thewhole city. The total electricity demand of Amsterdam in 2014 wastherefore collected to scale up the electricity demand data from the twotransformer stations to the whole city. A scaling coefficient was ob-tained by dividing the total electricity demand in 2014 by the sum ofthe electricity demand of the two transformer stations in 2014. Thenthe scaling coefficient was used to scale up the electricity demand datafrom two transformer stations to the city scale, assuming that the pat-tern of the two transformer stations are representative for the city. Infurther studies this assumption can be relaxed if more detailed energydemand data are available. Based on the demand pattern, 24 time slicesare used in a year to represent the temporal dynamics.
Energy technologies selected include pulverized coal, natural gasbased combined cycle gas turbine (CCGT), onshore wind turbines, andsolar PV. The techno-economic details of these technologies that areused as the model inputs are shown in Table S1 in the supplementarymaterial. The projected fuel cost is shown in Table S2. Our model al-lows for cost decreases for new vintages through exogenous learning.The parameters affected by the learning effect are the unit investmentcost for each electricity generation technology in this case study (seeEquation (2)). They are calculated by + = −α v CR α v( 1) (1 )· ( )r i i r i( , ) ( ) ( , ) ,where CR i( ) indicates the relative cost reduction per vintage for tech-nology i.
In this study, flexible biogas supply is selected to represent theflexible bioenergy technology as back-up capacity. Instead of biogas, itis also feasible to use solid biomass and liquid biofuels [36]. The benefitof using biogas compared with using other back-up renewable elec-tricity sources is cost saving as existing natural gas pipelines in the cityinfrastructure to transport biogas to the power plant can be used. Thischoice still requires a certain level of biogas cleaning and upgradingwith corresponding costs. Sun et al. (2015) recently reviewed the state-of-the-art of the biogas cleaning and upgrading technologies and the
associated costs [37]. We assume a 36% efficiency rate to represent theperformance of biomass gasification technology [38,39].
Apart from studying the back-up capacity, the storage of the surpluselectricity produced by wind and solar energy on an extreme weatherday is also considered. The emerging power-to-gas technology is se-lected for storage of electricity on those extreme weather days.
In order to compare the potential supply of bioenergy from theurban waste stream with the estimated demand, we collected dataabout organic waste flows in Amsterdam from AEB, a waste-to-energycompany in Amsterdam. The share of organic waste in the total wasteflow is 36% [40]. We use a HHV of 7.65 GJ/t to calculate the potentialenergy in the waste biomass [41]. Currently, a part of the waste bio-mass is also used for heat generation. The share of the waste biomassthat goes into electricity production is assumed to be 30%, based onliterature [42]. Furthermore, the waste biomass data that we collect donot cover all the waste biomass in the city. Some waste biomass (e.g.food waste) is currently not fully collected in Amsterdam. A discussionof the effect of waste policy on waste biomass quantity is presented inSection 6.
4. Scenarios
We used our urban electricity system model to find the optimalelectricity generation configuration for three different scenarios. Thesescenarios allow us to analyse the effect of different climate and energypolicy goals on the potential for waste biomass in the electricity systemof cities. The policies of Amsterdam are used for illustration purposes.
The benchmark scenario is developed to present the electricitygeneration configurations in Amsterdam in the absence of climate andenergy policies. The presently existing wind and solar energy capacitiesare small compared to the other generation capacities. In this scenario,there will be no investment in wind and solar energy due to relativelyhigh costs and lack of investment incentives. Therefore, the presentlyexisting wind and solar energy capacities are ignored for simplicity.
Although there is an energy conservation program in Amsterdam,the increasing electrification, due to the penetration of heat pumps andelectric vehicles, population growth [43] and rebound effects [44], maylead to an increase in electricity demand. Considering the large un-certainties associated with the future electricity demand in Amsterdam,it is assumed that the electricity demand will be constant until 2050 inall three scenarios. This assumption will be relaxed in a sensitivityanalysis.
The CAP scenario was developed to compute the electricity gen-eration configuration in the presence of a city-level cap on CO2 emis-sions. The city of Amsterdam has set a goal of emitting 40 and 75% lessCO2 by 2025 and 2040, respectively, compared to the 1990 level [34].The emission reduction goal for the electricity sector is usually moreambitious than the economy wide objective. For example, a GHGemission reduction of 80% for 2050 would imply an emission reductionof 93–99% for the EU electricity sector [45]. Therefore, the CO2
emission reduction goal of the Amsterdam electricity system is assumedto be more ambitious than the general goal stated in the agenda of theMunicipality of Amsterdam [34]. The official agenda of Amsterdamonly mentioned the emission reduction goals for 2025 and 2040. Sincethe time horizon in this study is until 2050, we assume that the goal in2050 is higher than that in 2040 based on the trend of Dutch nationalpolicy targets. The Dutch national targets are to reduce GHG emissionby at least 40% by 2030 and by 80–95% by 2050 [46]. The specificassumptions on emission reduction goals in the CAP scenario are pre-sented in Table 1.
The RES scenario was developed to present the electricity genera-tion configuration under the influence of the ambition to increase thecapacity of renewable energy in Amsterdam. The official agenda inAmsterdam [34] specified an energy policy goal of increasing renew-able energy capacity in the city until 2040, which is also shown inTable 1. In this paper, the policy-driven Solar-PV capacity in 2050 is
Y. Jiang et al. Biomass and Bioenergy 107 (2017) 182–190
185

assumed to be the technical potential of solar energy in Amsterdam,which is 1300 MW [34]. Since no data have been found on the tech-nical potential of wind energy capacity in 2050 and considering thelimited space for building wind turbines in Amsterdam, the policy-driven wind turbine capacity in 2050 is assumed to be the same as in2040. Table 1 summarizes the characteristics of the three scenarios.
5. Results
In this section, we first present the constrained cost-minimizingelectricity generation configurations for the three scenarios.Subsequently the results for the demand for bioenergy back-up capacityon extreme weather days are presented. This is followed by the resultsof monthly requirements for back-up capacity in a whole year and thecomparison with potential supply from the urban waste stream.
5.1. Future electricity generation configurations
Fig. S1 in the supplementary material shows the electricity gen-eration configuration in the benchmark scenario. In this scenario, theurban electricity system is planned based on the cost minimizationprinciple without consideration of environmental aspects or the policygoal of increasing the use of wind and solar energy.
As shown in Fig. S1 (a), initially there is overcapacity in the systembecause our model considers the existing capacity of the coal (630 MW)and CCGT (435 MW) in Amsterdam. The phenomenon of overcapacityin the city of Amsterdam is also stated in a report by energy companyNuon [47]. The installed capacities of coal and CCGT are almost thesame. As shown in Fig. S1 (b), coal power generation is functioning asbaseload, and CCGT power generation is functioning as peakload.
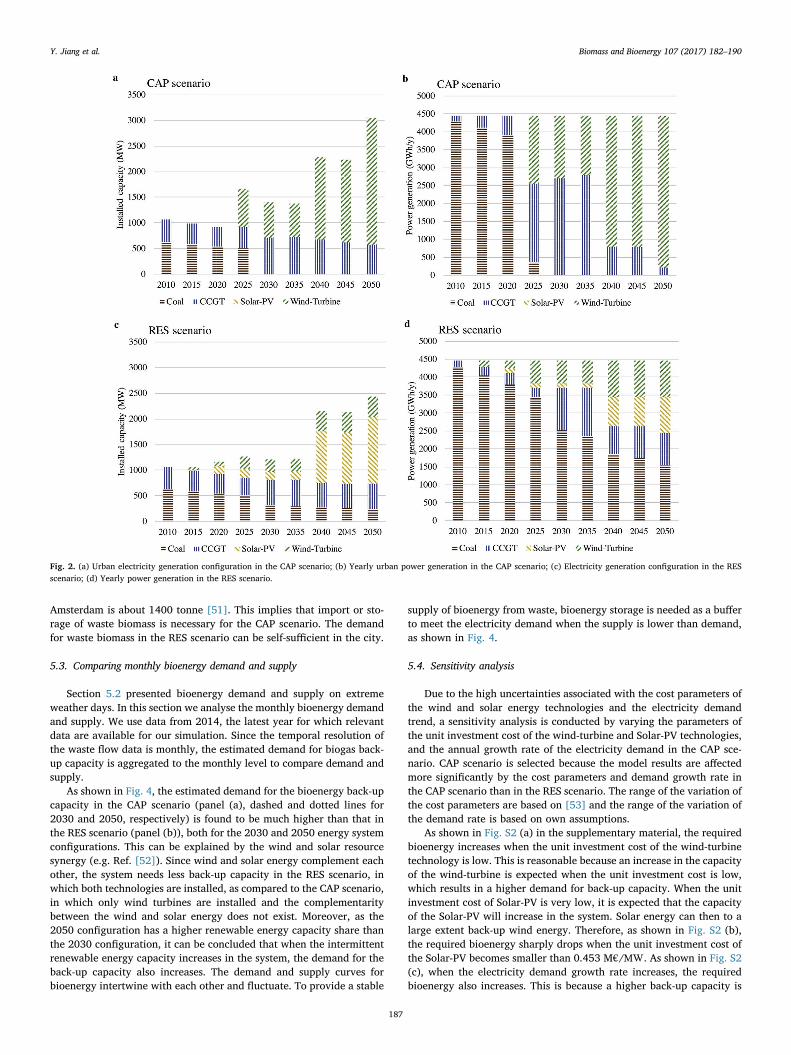
Fig. 2 (a) and Fig. 2 (b) show the electricity generation configura-tion in the CAP scenario. Installed capacity of Solar-PV is zero in thisscenario. This can be explained by the high investment cost of Solar-PV,in the absence of subsidies. The share of wind turbines in the systemincreases over time, which is driven by the CO2 emission reductiontarget. Its share in total installed capacity grows from 45% in 2025 to81% in 2050. The generation share of wind energy increases to 95% in2050 in Fig. 2 (b). Coal energy is phased out by 2030.
Fig. 2(c) and (d) show the electricity generation configuration forthe RES scenario. In this scenario policy targets impose minimum ca-pacity for solar and wind energy. The installed capacity of Solar-PVtakes a 53% share of total installed capacity in 2050. However, thegeneration share of Solar-PV in 2050 is only 23%. This is due to the factthat the solar irradiance in Amsterdam is low and hence the capacityfactor of the Solar-PV is low as well, with an average value of 9%. The
capacity factor is defined as the ratio of an energy generation techno-logy's actual electricity output over a period of time to its potentialoutput if it operates at a full capacity continuously over the same periodof time. The capacity factor is calculated using the meteorological datain the region of Amsterdam. We use the method in Haller et al. [48] toconvert the meteorological data into the capacity factor.
5.2. Demand for bioenergy back-up capacity on extreme weather days
In order to explore the demand for bioenergy back-up capacity on aday with extreme weather conditions, we developed two extremeweather scenarios for each season. The assumptions for the extremevalues of wind speed and solar irradiance are based on historical me-teorological data from 2005 to 2015 from the Schiphol weather stationin Amsterdam [49]. The electricity generation configurations fromsection 5.1 are used here for the simulation. Winter days have thehighest demand for back-up capacity, therefore only the results of thewinter season are presented here, the results of other three seasons canbe found in the supplementary materials.
Fig. 3 (a) and Fig. 3 (b) show the hourly power flow in the extremeweather scenarios on a winter day in the CAP scenario. Fig. 3 (a) showsthe situation of a winter day with extremely strong wind and solar ir-radiance, but a low demand for electricity. The result of the power-to-gas conversion shows that there is a large excess of electricity in thesystem. Assuming a power-to-gas technology efficiency of 55% [50], atotal of 0.1 PJ can be stored. Fig. 3 (b) shows the situation of a winterday with extremely low wind and solar irradiance, but a high demandfor electricity. As can be seen from the demand for biogas, a total of0.021 PJ net bioenergy is required as flexible back-up supply.
Fig. 3 (c) and Fig. 3 (d) show the hourly power flow in the extremeweather scenarios on a winter day in the RES scenario. Fig. 3 (c) showsthe situation of a winter day with extremely strong wind and solar ir-radiance, but a low demand for electricity. As in the CAP scenario, theresult of the power-to-gas conversion shows that there is also a largeexcess of electricity in the system. A total of 0.053 PJ energy can bestored by power-to-gas technology. Fig. 3 (d) shows the situation of awinter day with extremely low wind and solar irradiance, but a highdemand for electricity. The result shows that there is a total of about0.002 PJ excess electricity from midnight to 6 a.m. After 6 a.m., there isa requirement for a total of about 0.01 PJ biogas back-up capacity in thesystem.
To cover the biogas supply using urban waste, an extreme weatherday in 2050 requires about 2800 tonne waste biomass per day in theCAP scenario and 1300 tonne waste biomass per day in the RES sce-nario, respectively. The average daily waste biomass generated in
Table 1Summary of the characteristics of the three scenarios.
Scenario name Installed capacity CO2 emission reduction goalsa Urban electricity demand
Benchmark – – ConstantCAP – 50 by 2025 Constant
85% by 204095% by 2050
RES Solar-PV Constant9 MW in 2015160 MW in 20201000 MW in 20401300 MW in 2050Wind-Turbine67 MW in 201585 MW in 2020250 MW in 2025400 MW in 2040400 MW in 2050
a The CO2 emission level in 1990 is used as the baseline in the policy goal.
Y. Jiang et al. Biomass and Bioenergy 107 (2017) 182–190
186
Amsterdam is about 1400 tonne [51]. This implies that import or sto-rage of waste biomass is necessary for the CAP scenario. The demandfor waste biomass in the RES scenario can be self-sufficient in the city.
5.3. Comparing monthly bioenergy demand and supply
Section 5.2 presented bioenergy demand and supply on extremeweather days. In this section we analyse the monthly bioenergy demandand supply. We use data from 2014, the latest year for which relevantdata are available for our simulation. Since the temporal resolution ofthe waste flow data is monthly, the estimated demand for biogas back-up capacity is aggregated to the monthly level to compare demand andsupply.
As shown in Fig. 4, the estimated demand for the bioenergy back-upcapacity in the CAP scenario (panel (a), dashed and dotted lines for2030 and 2050, respectively) is found to be much higher than that inthe RES scenario (panel (b)), both for the 2030 and 2050 energy systemconfigurations. This can be explained by the wind and solar resourcesynergy (e.g. Ref. [52]). Since wind and solar energy complement eachother, the system needs less back-up capacity in the RES scenario, inwhich both technologies are installed, as compared to the CAP scenario,in which only wind turbines are installed and the complementaritybetween the wind and solar energy does not exist. Moreover, as the2050 configuration has a higher renewable energy capacity share thanthe 2030 configuration, it can be concluded that when the intermittentrenewable energy capacity increases in the system, the demand for theback-up capacity also increases. The demand and supply curves forbioenergy intertwine with each other and fluctuate. To provide a stable
supply of bioenergy from waste, bioenergy storage is needed as a bufferto meet the electricity demand when the supply is lower than demand,as shown in Fig. 4.
5.4. Sensitivity analysis
Due to the high uncertainties associated with the cost parameters ofthe wind and solar energy technologies and the electricity demandtrend, a sensitivity analysis is conducted by varying the parameters ofthe unit investment cost of the wind-turbine and Solar-PV technologies,and the annual growth rate of the electricity demand in the CAP sce-nario. CAP scenario is selected because the model results are affectedmore significantly by the cost parameters and demand growth rate inthe CAP scenario than in the RES scenario. The range of the variation ofthe cost parameters are based on [53] and the range of the variation ofthe demand rate is based on own assumptions.
As shown in Fig. S2 (a) in the supplementary material, the requiredbioenergy increases when the unit investment cost of the wind-turbinetechnology is low. This is reasonable because an increase in the capacityof the wind-turbine is expected when the unit investment cost is low,which results in a higher demand for back-up capacity. When the unitinvestment cost of Solar-PV is very low, it is expected that the capacityof the Solar-PV will increase in the system. Solar energy can then to alarge extent back-up wind energy. Therefore, as shown in Fig. S2 (b),the required bioenergy sharply drops when the unit investment cost ofthe Solar-PV becomes smaller than 0.453 M€/MW. As shown in Fig. S2(c), when the electricity demand growth rate increases, the requiredbioenergy also increases. This is because a higher back-up capacity is
Fig. 2. (a) Urban electricity generation configuration in the CAP scenario; (b) Yearly urban power generation in the CAP scenario; (c) Electricity generation configuration in the RESscenario; (d) Yearly power generation in the RES scenario.
Y. Jiang et al. Biomass and Bioenergy 107 (2017) 182–190
187

needed when both the electricity demand and the intermittent renew-able energy capacity in the system are high.
6. Discussion
We calculated the theoretical potential supply of bioenergy from anurban waste stream, and evaluated whether this potential supply couldmeet the demand for back-up capacity in different scenarios. However,the economic aspect of waste biomass energy is not included in theanalysis. Here we provide a discussion on the cost and benefit of theflexible biogas supply from urban waste biomass. The levelized cost ofelectricity (LCOE) is used as an economic indicator. We collected datafrom the literature and report them expressed in euros in constant va-lues for 2016. The LCOE of a biogas plant with the flexible energysupply ((0.158–0.269) €/kWh) is lower than that of a battery system(above 0.2 €/kWh), but not as low as that of a natural gas system((0.075–0.098) €/kWh) in the Netherlands [54–58]. The LCOE offlexible biogas supply using urban waste biomass is highly influencedby the waste pretreatment cost, storage cost and full load hours. Due to
the heterogeneous nature of the waste biomass, a pretreatment such asgrinding for particle size reduction, separation for contaminants re-moval and alkali treatment is needed for efficient biogas production[59]. Waste pretreatment leads to extra cost compared with homo-geneous substrates, but the homogeneous biomass feedstock costs(80–150) €/t [60]. Hence, the urban waste as a biomass feedstock canbe cost competitive compared with a homogeneous biomass feedstock.Ariunbaatar et al. [61] suggested that the best options for waste bio-mass pretreatment are thermal pretreatment at low temperatures andtwo-stage anaerobic digestion. Making existing biogas plants moreflexible will increase costs due to required larger storage capacities andreduced full-load hours [62,63]. Compared to non-flexible electricitygeneration, the flexibilization of biogas plants leads to further costsamounting to (0.020–0.050) €/kWh [58].
However, the extra costs mentioned previously can be compensatedby the waste gate fee, which is about (15–60) €/t in the Netherlands[60]; by a renewable energy support mechanism such as feed-in pre-mium, which is 0.055 €/kWh in 2016 under the subsidy scheme SDE+in the Netherlands; by selling the digestate as a fertilizer; and by
Fig. 3. (a) High urban renewable energy generation and low urban electricity demand on a winter day in 2050 in the CAP scenario; (b) Low urban renewable energy generation and highurban electricity demand on a winter day in 2050 in the CAP scenario; (c) High urban renewable energy generation and low urban electricity demand on a winter day in 2050 in the RESscenario; (d) Low urban renewable energy generation and high urban electricity demand on a winter day in 2050 in the RES scenario.
Y. Jiang et al. Biomass and Bioenergy 107 (2017) 182–190
188

avoiding the external cost from using natural gas. Furthermore, futurepolicy measures that incentivize the flexible biogas supply could fi-nancially compensate the extra cost incurred by changing the operationmode of the biogas plant.
In this study we used historical data to represent the potentialsupply of the bioenergy from the waste stream. By doing this, we as-sumed that the waste generation will not change in the time frame from2010 to 2050. However, waste generation can change under differentpolicy drivers. Studies have shown that the decoupling of waste gen-eration from economic growth is far from being reached in Europe[64,65], which implies that the increasing urbanization and economicgrowth will most likely lead to an increased waste generation. But onthe other hand, waste prevention policy such as increasing efforts onfood waste prevention may reduce the generation of waste biomass inthe cities. Given these uncertainties, in further studies a quantitativeforecasting of future urban waste biomass is needed, including explicitpolicy and technology scenarios.
7. Conclusion
This study is driven by three main questions: (1) What are the futureelectricity generation configurations in Amsterdam in 2050 with andwithout policy interventions? (2) What is the demand for back-up ca-pacity in the urban electricity system of Amsterdam in 2050? (3) Howmuch of this back-up capacity can be obtained from the urban wastestream in the city?
• We find that, in the absence of climate and energy policy targets,renewable energy is dominated by conventional energy in the urbanelectricity system. In the CAP scenario, in which we cap CO2 emis-sions, coal-fired power plants are phased out by 2030 while thewind energy capacity increases from 45% in 2025 to 81% in 2050and the generation share of wind increases to 95% in 2050. In theRES scenario, in which we impose a target on installed capacity forwind and solar, the generation share of the Solar-PV is found to below despite its high share in the installed capacity because of its lowcapacity factor.
• Our main finding is that on extreme weather days in 2050 withhardly any wind and solar energy supply, about 2800 tonne wastebiomass per day is required in the CAP scenario to back up the in-termittent renewable electricity using urban waste. In the RES sce-nario 1300 tonne waste biomass per day is required. The average
daily waste biomass generated in the city of Amsterdam is about1400 tonne [51]. This implies that import or storage of waste bio-mass is necessary for the CAP scenario. The demand for waste bio-mass in the RES scenario can be self-sufficient in the city.
• Analysis from the comparison of monthly demand and supply ofbioenergy shows that the demand for the bioenergy back-up capa-city in the CAP scenario is higher than that in the RES scenario dueto the synergies of wind and solar energy in the RES scenario.
Our analysis has shown that the flexible bioenergy supply from theurban waste stream has a high potential in backing up intermittentrenewable energy in cities. The methodological framework and analysispresented in this paper can support policy-makers in exploring thepotential of bioenergy from urban waste streams in balancing the futuresustainable urban electricity system and avoiding inconsistencies be-tween urban bioenergy policy ambitions and local biomass availability.
Acknowledgements
This work has been financially supported by the EU Climate-KICprogram. We would like to thank the energy network companyAlliander and waste-to-energy company AEB for providing the data.
Appendix A. Supplementary data
Supplementary data related to this article can be found at http://dx.doi.org/10.1016/j.biombioe.2017.10.001.
References
[1] UNFCCC, Adoption of the Paris Agreement, Report No. FCCC/CP/2015/L.9/Rev.1(2015) http://unfccc.int/resource/docs/2015/cop21/eng/l09r01.pdf.
[2] U.N. Habitat, Cities and Climate Change: Global Report on Human Settlements,Earthscan, London, 2011.
[3] A. Ramaswami, A. Chavez, J. Ewing-Thiel, K.E. Reeve, Two approaches to green-house gas emissions foot-printing at the city scale, Environ. Sci. Technol. 45 (10)(2011) 4205–4206.
[4] J. Keirstead, M. Jennings, A. Sivakumar, A review of urban energy system models:approaches, challenges and opportunities, Renew. Sustain. Energy Rev. 16 (6)(2012) 3847–3866.
[5] H. Kondziella, T. Bruckner, Flexibility requirements of renewable energy basedelectricity systems–a review of research results and methodologies, Renew. Sustain.Energy Rev. 53 (2016) 10–22.
[6] J. Fargione, J. Hill, D. Tilman, S. Polasky, P. Hawthorne, Land clearing and thebiofuel carbon debt, Science 319 (5867) (2008) 1235–1238.
[7] R. Kothari, V. Tyagi, A. Pathak, Waste-to-energy: a way from renewable energy
Fig. 4. (a) Estimated monthly demand for bioenergy compared with the monthly potential supply in the CAP scenario for 2030 and 2050; (b) Estimated monthly demand for bioenergycompared with the monthly potential supply in the RES scenario for 2030 and 2050.
Y. Jiang et al. Biomass and Bioenergy 107 (2017) 182–190
189

sources to sustainable development, Renew. Sustain. Energy Rev. 14 (9) (2010)3164–3170.
[8] M. Kranert, R. Gottschall, C. Bruns, G. Hafner, Energy or compost from greenwaste?–A CO2-based assessment, Waste Manage 30 (4) (2010) 697–701.
[9] E. Özcan, M. Arentsen, Nonconformity of policy ambitions with biomass potentialsin regional bioenergy transition: a Dutch example, Energy Policy 65 (2014)212–222.
[10] L. Staffas, M. Gustavsson, K. McCormick, Strategies and policies for the bioeconomyand bio-based economy: an analysis of official national approaches, Sustainability 5(6) (2013) 2751–2769.
[11] M.W. Rosegrant, S. Msangi, Consensus and contention in the food-versus-fuel de-bate, Annu. Rev. Environ. Resour. 39 (2014) 271–294.
[12] T. Searchinger, R. Heimlich, R.A. Houghton, F. Dong, A. Elobeid, J. Fabiosa,S. Tokgoz, D. Hayes, T.-H. Yu, Use of US croplands for biofuels increases greenhousegases through emissions from land-use change, Science 319 (5867) (2008)1238–1240.
[13] D. Tilman, R. Socolow, J.A. Foley, J. Hill, E. Larson, L. Lynd, S. Pacala, J. Reilly,T. Searchinger, C. Somerville, R. Williams, Beneficial biofuels-the food, energy, andenvironment trilemma, Science 325 (5938) (2009) 270–271.
[14] H. Haberl, T. Beringer, S.C. Bhattacharya, K.-H. Erb, M. Hoogwijk, The globaltechnical potential of bio-energy in 2050 considering sustainability constraints,Curr. Opin. Environ. Sustain. 2 (5) (2010) 394–403.
[15] M. Hoogwijk, A. Faaij, B. Eickhout, B. de Vries, W. Turkenburg, Potential of biomassenergy out to 2100, for four IPCC SRES land-use scenarios, Biomass Bioenergy 29(4) (2005) 225–257.
[16] R. Offermann, T. Seidenberger, D. Thrän, M. Kaltschmitt, S. Zinoviev, S. Miertus,Assessment of global bioenergy potentials, Mitig. Adapt. Strategies Glob. Change 16(1) (2011) 103–115.
[17] E.M. Smeets, A.P. Faaij, I.M. Lewandowski, W.C. Turkenburg, A bottom-up as-sessment and review of global bio-energy potentials to 2050, Prog. Energy Combust.Sci. 33 (1) (2007) 56–106.
[18] N.S. Bentsen, C. Felby, Biomass for energy in the European Union-A review ofbioenergy resource assessments, Biotechnol. Biofuels 5 (1) (2012) 25.
[19] L.P. Koh, H.T. Tan, N.S. Sodhi, Biofuels: waste not want not, Science 320 (5882)(2008) 1419.
[20] N. Scarlat, J.-F. Dallemand, O.J. Skjelhaugen, D. Asplund, L. Nesheim, An overviewof the biomass resource potential of Norway for bioenergy use, Renew. Sustain.Energy Rev. 15 (7) (2011) 3388–3398.
[21] J.J. Roberts, A.M. Cassula, P.O. Prado, R.A. Dias, J.A.P. Balestieri, Assessment ofdry residual biomass potential for use as alternative energy source in the party ofGeneral Pueyrredón, Argentina, Renew. Sustain. Energy Rev. 41 (2015) 568–583.
[22] J. Cai, R. Liu, C. Deng, An assessment of biomass resources availability in Shanghai:2005 analysis, Renew. Sustain. Energy Rev. 12 (7) (2008) 1997–2004.
[23] D.W. MacFarlane, Potential availability of urban wood biomass in Michigan: im-plications for energy production, carbon sequestration and sustainable forestmanagement in the USA, Biomass Bioenergy 33 (4) (2009) 628–634.
[24] F. Kraxner, K. Aoki, G. Kindermann, S. Leduc, F. Albrecht, J. Liu, Y. Yamagata,Bioenergy and the city–what can urban forests contribute? Appl. Energy 165 (2016)990–1003.
[25] E. Smeets, M. Junginger, A. Faaij, A. Walter, P. Dolzan, W. Turkenburg, The sus-tainability of Brazilian ethanol-an assessment of the possibilities of certified pro-duction, Biomass Bioenergy 32 (8) (2008) 781–813.
[26] E.M. Smeets, A.P. Faaij, The impact of sustainability criteria on the costs and po-tentials of bioenergy production–Applied for case studies in Brazil and Ukraine,Biomass Bioenergy 34 (3) (2010) 319–333.
[27] G. Berndes, J. Hansson, Bioenergy expansion in the EU: cost-effective climatechange mitigation, employment creation and reduced dependency on importedfuels, Energy Policy 35 (12) (2007) 5965–5979.
[28] S. Jablonski, N. Strachan, C. Brand, A. Bauen, The role of bioenergy in the UK'senergy future formulation and modelling of long-term UK bioenergy scenarios,Energy Policy 38 (10) (2010) 5799–5816.
[29] V. Krishnan, J.D. McCalley, The role of bio-renewables in national energy andtransportation systems portfolio planning for low carbon economy, Renew. Energy91 (2016) 207–223.
[30] L.G. Fishbone, H. Abilock, Markal, a linear-programming model for energy sys-tems:technical description of the bnl version, Int. J. Energy Res. 5 (4) (1981)353–375.
[31] T. Givler, P. Lilienthal, Using HOMER Software, NREL's Micropower OptimizationModel, to Explore the Role of Gen-sets in Small Solar Power Systems; Case Study: SriLanka, Tech. rep. National Renewable Energy Lab., Golden, CO (US), 2005.
[32] K. Karlsson, P. Meibom, Optimal investment paths for future renewable based en-ergy systems - using the optimisation model balmorel, Int. J. Hydrogen Energy 33(7) (2008) 1777–1787.
[33] P. Nahmmacher, E. Schmid, B. Knopf, Documentation of LIMES-EU-a Long-termElectricity System Model for Europe, Potsdam Institute of Climate Impact Research(PIK), 2014, https://www.pik-potsdam.de/members/paulnah/limes-eu-documentation-2014.pdf.
[34] Municipality of Amsterdam, Sustainable Amsterdam-Agenda for Renewable Energy,Clear Air, a Circular Economy and a Climate-resilient City, (2015) https://www.amsterdam.nl/bestuur-organisatie/organisatie/ruimte-economie/ruimte-duurzaamheid/making-amsterdam/sustainability/.
[35] CBS, Population dynamics; birth, death and migration per region, (2015) http://
statline.cbs.nl.[36] D. Thrän, Smart Bioenergy: Technologies and Concepts for a More Flexible
Bioenergy Provision in Future Energy Systems, Springer, Leipzig, 2015.[37] Q. Sun, H. Li, J. Yan, L. Liu, Z. Yu, X. Yu, Selection of appropriate biogas upgrading
technology-a review of biogas cleaning, upgrading and utilisation, Renew. Sustain.Energy Rev. 51 (2015) 521–532.
[38] International Renewable Energy Agency, Renewable Power Generation Costs in2014, (2015) http://www.irena.org/menu/index.aspx?mnu=Subcat&PriMenuID=36&CatID=141&SubcatID=494.
[39] L.A. Hadidi, M.M. Omer, A financial feasibility model of gasification and anaerobicdigestion waste-to-energy (WTE) plants in Saudi Arabia, Waste Manage. Oxf. 59(2017) 90–101.
[40] J. de Bruijn, Domestic Waste in Amsterdam, (2014) http://www.municipalwasteeurope.eu/sites/default/files/Benchmarking%20big%20cities%20-%20Amsterdam.pdf.
[41] ECN, Phyllis 2-Database for Biomass and Waste, (2016) https://www.ecn.nl/phyllis2/.
[42] P. Tafarte, S. Das, M. Eichhorn, M. Dotzauer, D. Thrän, The potential of flexiblepower generation from biomass: a case study for a German region, Smart Bioenergy,Springer, Leipzig, 2015, pp. 141–159.
[43] CBS, Population Growth Rate Major Cities above Average, (2011) https://www.cbs.nl/en-gb/news/2011/28/population-growth-rate-major-cities-above-average.
[44] K. Gillingham, D. Rapson, G. Wagner, The rebound effect and energy efficiencypolicy, Rev. Environ. Econ. Policy 10 (1) (2016) 68–88.
[45] EC, A Roadmap for Moving to a Competitive Low Carbon Economy in 2050,European Commission, Brussels, 2011http://eur-lex.europa.eu/legal-content/EN/ALL/?uri=CELEX:52011DC0112.
[46] PBL, Monitoring Climate Targets in the Netherlands, (2014) http://pubdocs.worldbank.org/en/123941484255893633/pbl-monitoring-climate-targets-netherlands.pdf.
[47] N.V. Nuon, Nuon Energy Annual Report 2014-Towards Sustainable and FlexibleEnergy, (2014) https://www.nuon.com/globalassets/nederland/bedrijf/publicaties/nuon-annual-report-2014.pdf.
[48] M. Haller, S. Ludig, N. Bauer, Decarbonization scenarios for the EU and MENApower system: considering spatial distribution and short term dynamics of renew-able generation, Energy Policy 47 (2012) 282–290.
[49] KNMI, Hourly Data of the Weather in the Netherlands, (2016) http://projects.knmi.nl/klimatologie/uurgegevens/selectie.cgi.
[50] M. Götz, J. Lefebvre, F. Mörs, A.M. Koch, F. Graf, S. Bajohr, R. Reimert, T. Kolb,Renewable Power-to-Gas: a technological and economic review, Renew. Energy 85(2016) 1371–1390.
[51] M. Spiller, S. Stremke, URBAN PULSE: Understanding the Dynamics of ResourceFlows in Amsterdam, (2015) https://www.wur.nl/en/project/Urban-Pulse.htm.
[52] A.A. Prasad, R.A. Taylor, M. Kay, Assessment of solar and wind resource synergy inAustralia, Appl. Energy 190 (2017) 354–367.
[53] A.S. Brouwer, M. van den Broek, A. Seebregts, A. Faaij, Operational flexibility andeconomics of power plants in future low-carbon power systems, Appl. Energy 156(2015) 107–128.
[54] C. Kost, J.N. Mayer, J. Thomsen, N. Hartmann, C. Senkpiel, S. Philipps, S. Nold,S. Lude, N. Saad, T. Schlegl, Levelized Cost of Electricity Renewable EnergyTechnologies, Fraunhofer Institute for Solar Energy Systems ISE, 2013.
[55] IEA/NEA, Projected Costs of Generating Electricity, International Energy Agency(IEA) and Nuclear Energy Agency (NEA), Paris, France, 2015.
[56] IRENA, Renewable Power Generation Costs in 2014, International RenewableEnergy Agency, Abu Dhabi, 2015.
[57] N.B.D. Thi, C.-Y. Lin, G. Kumar, Electricity generation comparison of food waste-based bioenergy with wind and solar powers: a mini review, Sustain. Environ. Res.26 (5) (2016) 197–202.
[58] M. Lauer, D. Thrän, Biogas plants and surplus generation: cost driver or reducer inthe future German electricity system? Energy Policy 109 (2017) 324–336.
[59] R. Zhang, H.M. El-Mashad, K. Hartman, F. Wang, G. Liu, C. Choate, P. Gamble,Characterization of food waste as feedstock for anaerobic digestion, Bioresour.Technol. 98 (4) (2007) 929–935.
[60] H. Balcazar, C.M. Fougret, K.P. Geigle, S. Gust, E. Hagen, A. Lappas, K. Lenz,J. Maier, E. Papadopoulou, R. Parton, Biomass based energy intermediates boostingbiofuel production-bioboost, Proceedings of 21st European Biomass Conference,2013.
[61] J. Ariunbaatar, A. Panico, G. Esposito, F. Pirozzi, P.N. Lens, Pretreatment methodsto enhance anaerobic digestion of organic solid waste, Appl. Energy 123 (2014)143–156.
[62] N. Szarka, F. Scholwin, M. Trommler, H.F. Jacobi, M. Eichhorn, A. Ortwein,D. Thrän, A novel role for bioenergy: a flexible, demand-oriented power supply,Energy 61 (2013) 18–26.
[63] M. Lauer, M. Dotzauer, C. Hennig, M. Lehmann, E. Nebel, J. Postel, N. Szarka,D. Thrän, Flexible power generation scenarios for biogas plants operated inGermany: impacts on economic viability and GHG emissions, Int. J. Energy Res. 41(1) (2017) 63–80.
[64] M. Mazzanti, Is waste generation de-linking from economic growth? Empiricalevidence for Europe, Appl. Econ. Lett. 15 (4) (2008) 287–291.
[65] F. Montevecchi, Policy mixes to achieve absolute decoupling: a case study of mu-nicipal waste management, Sustainability 8 (5) (2016) 442.
Y. Jiang et al. Biomass and Bioenergy 107 (2017) 182–190
190