biomass for greenhouse gas emission reduction
TRANSCRIPT
Biomass for greenhouse gas emissionREDuction
(BRED)
Agriculture as a source of biomass in WesternEurope
Emmanuel G. Koukios & Nick D. DiamantidisBioresource Technology Unit
National Technical University of AthensAthens, Greece
Athens, 1998
Table of contents
page
Background and Objectives i
Chapter 1 - Introduction 1
Chapter 2 - Methodological approach 3
2.1 Basic data 3
2.2 Input data 3
2.3 Economic data 4
Chapter 3 - Current biomass production and use in Europe 5
3.1 Presentation by crop 5
3.1.1 Wheat 5
3.1.2 Maize 6
3.1.3 Rape 7
3.1.4 Sunflower 10
3.1.5 Potato 11
3.1.6 Sugar beet 13
3.1.7 Sweet sorghum 14
3.1.8 Miscanthus 15
3.1.9 Poplar 16
3.1.10 Eucalyptus 17
3.1.11 Willow 18
3.1.12 Agricultural residues 19
3.2 Biomass yields and production costs 20
3.2.1 Current and projected yields of biomass 20
3.2.2 Current and projected input requirements 21
3.23. Biomass production costs 22
Chapter 4. Discussion 24
5. References 26
Annex 1. Yield’s projection 29
Annex 2. MARKAL datasheets 30
i
BACKGROUND AND OBJECTIVES
BRED is an acronym for Biomass for greenhouse gas emission REDuction. This project isfunded by the Environment and Climate research programme of the European Union. Theproject started in January 1998 and will last until December 1999.
A number of strategies have been proposed to reduce greenhouse gas emissions (GHGs). Oneimportant strategy is based on the introduction of more plant biomass as a substitute for fossilenergy carriers and for materials. Biomass can be used to produce energy, e.g. heat, electricityor transportation fuels (called “bioenergy”), or it can serve as feedstock for synthetic organicmaterials and for structural materials such as timber (called “biomaterials”). Biomass can alsobe used in a sequence of both applications: first as a material, second as an energy source. Theavailability of biomass (i.c. bioenergy and biomaterial crops) in Western Europe is limited bythe land availability and the biomass yields per square kilometre. This limits the potential ofthe biomass strategy for GHG emission reduction. The BRED project focuses on the cost-effective allocation of limited biomass resources for GHG emission reduction in order toassess its attractiveness. Competition with other strategies for GHG emission reduction istaken into account.
Starting from the EU policy goal for greenhouse gas emission reduction, the objective of theproject is to analyse the optimal use of indigenous biomass for energy and materials "from cradleto grave" in the Western European (EU+EFTA) economy in order to achieve cost-effectivegreenhouse gas emission reduction on the long term (period 2000-2050). The goal is to provide aconsistent and scientifically well founded set of recommendations for RD&D and investmentpolicies for policy makers and for industry.
The following problems will be analysed:1 Which prospective crops and prospective markets can be discerned for biomass in
Western Europe for the period 2000-2050 ?2 Which combination of bioenergy and biomaterials crops should European agriculture
focus upon from the point of view of cost-effective GHG emission reduction policies ?3 Which conversion technologies, which markets and which biomass waste technologies
must be developed ?4 How compare the emission reduction potentials and the costs of bioenergy and bio-
material options for GHG emission reduction to other technological improvementoptions that compete for the same product and service markets ?
5 Should a biomass-for-carbon-storage or a biomass-for-energy-and-materials strategy beapplied to the limited European land resources ?
6 What is the impact of a changing energy and materials system configuration anddifferent scenarios for energy prices, CO2 storage, energy conservation, and renewables,on the future cost-effectiveness of biomaterial and bioenergy options for GHG emissionreduction ?
A systems modelling approach will be applied in the study. The economic system ischaracterised by the energy and material flows and by the "technologies", that represent theconversion process of one material flow to another. Technologies are modelled as "blackboxes", characterised by a linear relation between their physical inputs and outputs and bytheir costs. The analysis will be based on calculations with an extended version of a Western
ii
European integrated energy and materials systems model.. The biomass technology databaseof the Western European MATTER1.0 MARKAL systems engineering model [1] will beextended and improved based on detailed information regarding energy and material flowsand future potential biomass applications.
The BRED project research tasks are:1 Quantification of current biomass production and use in Europe2 Assessment of land availability3 Assessment of biomass yield and production costs for regions4 Identification of options for substituting other materials5 Techno-economic characterisation of material production and recycling options6 Techno-economic characterisation of product assembly, utilisation and separation7 Techno-economic characterisation of energy recovery and disposal options8 Analysis of the information from the task 5-7 in the MARKAL analytical framework
This report is a product of task 1 and task 3. It focuses on the biomass production byagriculture.
1 [1] D.J. Gielen, T. Gerlagh, A.J.M. Bos: MATTER1.0. A MAKAL Energy and Materials System
Model Characterisation. ECN-C—98-065. Netherlands Energy Research Foundation ECN,Petten, the Netherlands, September 1998.
1
CHAPTER 1. INTRODUCTION
Agriculture, as defined according to Spedding (1988), is “an activity carried out primarily toproduce food and fibre (as well as many other materials) by the deliberate and controlled useof (mainly terrestrial) plants and animals”. Since its inception, agriculture has undergonevarious modifications to meet the demands of the rapidly growing human population.Nowadays, the highly mechanised and energy consuming agriculture shares with traditionalfarming only the fact that they both make use of the fundamental process of photosynthesis inorder to utilise solar radiation and inorganic elements from air and soil and so produce a widerange of products.
Within the last decade, the range of potential products based on agricultural raw materials hasbeen dramatically increased. Among the factors responsible for the enlargement of agriculture,one can identify
• new developments in various scientific and technical areas, such as biotechnology andprocess engineering;
• the increasing consumer concerns with the environment, leading to an increased demandfor environmentally friendly products and services; and
• significant trends in environmental and agricultural policy developments, such as thereform of CAP, which now allows for a number of new industrial crops to be grown on set-aside land with a full hectare premium (only for European Union).
At the European Union level, the future of non-food uses of agricultural feedstocks, such asthe production of bioenergy and various biomaterials (e.g., fibres, lubricants, bioplastics,speciality and bulk chemicals, etc.) from old and new industrial crops (e.g., oil and starchcrops, sorghum, miscanthus) and agricultural residues (e.g., cereal straws), should be takenunder serious consideration within the debate on the most promising strategies for cost-effective CO2 emission reduction in the long run.
Since biomass availability in Western Europe is limited by a number of factors, including landavailability, food consumption and biomass yields per hectare, the limited agriculturalresources need to be optimally allocated.
The present report outlines the current physical flows of the main EU agro-bioresources andtheir non-food products based on their current yields and costs within the broader context of athe study aiming to identify
• the most promising agricultural systems for non-food biomass uses in the period 2000-2050; and
• which combination of bioenergy and biomaterials crops should European economies andsocieties focus upon from the point of view of cost-effective future greenhouse gasemission reduction.
2
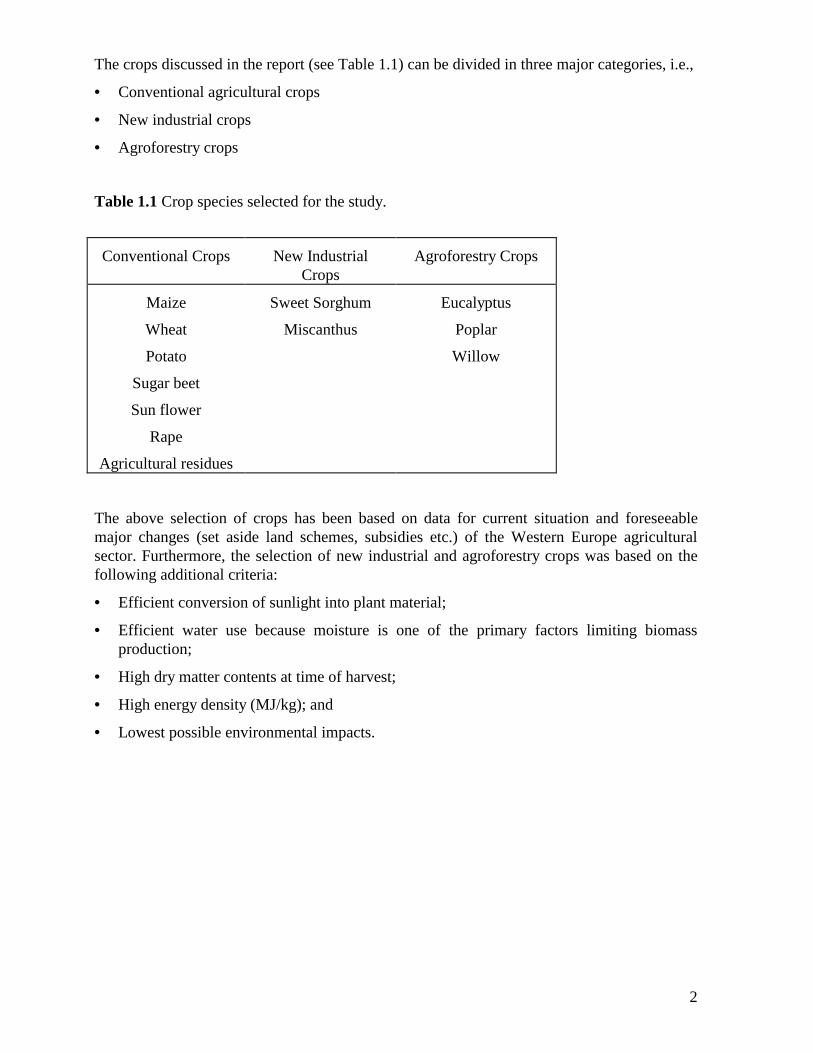
The crops discussed in the report (see Table 1.1) can be divided in three major categories, i.e.,
• Conventional agricultural crops
• New industrial crops
• Agroforestry crops
Table 1.1 Crop species selected for the study.
Conventional Crops New IndustrialCrops
Agroforestry Crops
Maize
Wheat
Potato
Sugar beet
Sun flower
Rape
Agricultural residues
Sweet Sorghum
Miscanthus
Eucalyptus
Poplar
Willow
The above selection of crops has been based on data for current situation and foreseeablemajor changes (set aside land schemes, subsidies etc.) of the Western Europe agriculturalsector. Furthermore, the selection of new industrial and agroforestry crops was based on thefollowing additional criteria:
• Efficient conversion of sunlight into plant material;
• Efficient water use because moisture is one of the primary factors limiting biomassproduction;
• High dry matter contents at time of harvest;
• High energy density (MJ/kg); and
• Lowest possible environmental impacts.
3
CHAPTER 2 - METHODOLOGICAL APPROACH
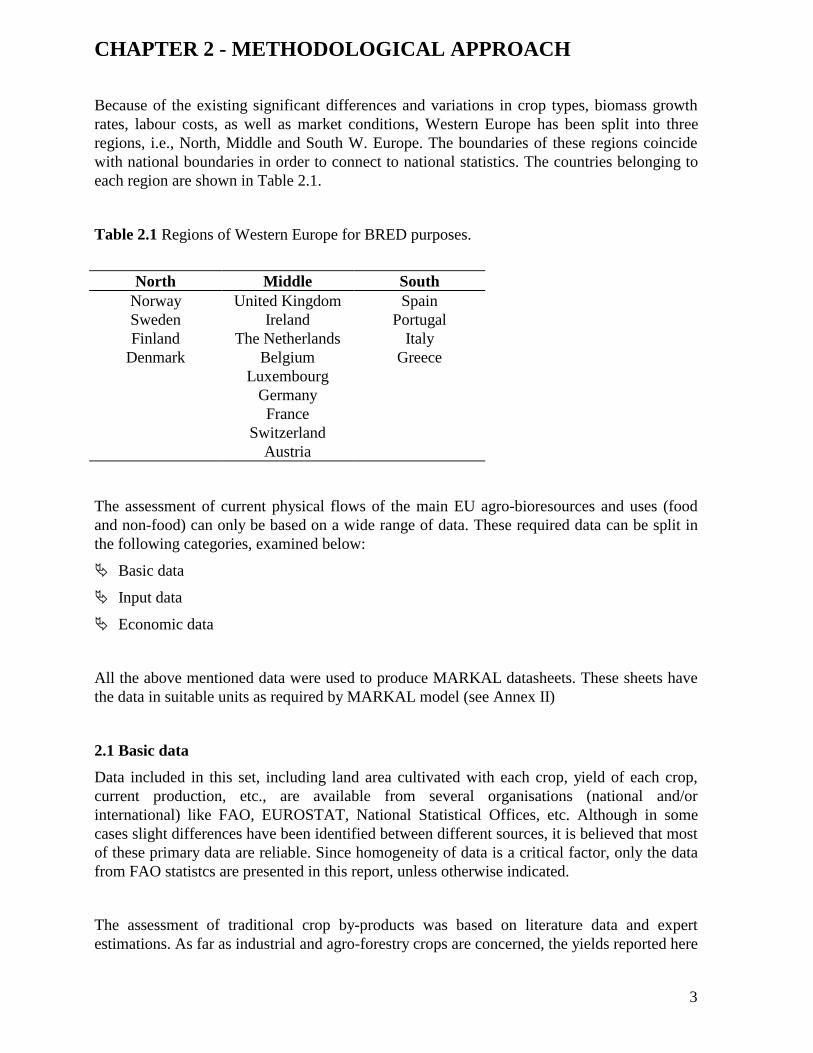
Because of the existing significant differences and variations in crop types, biomass growthrates, labour costs, as well as market conditions, Western Europe has been split into threeregions, i.e., North, Middle and South W. Europe. The boundaries of these regions coincidewith national boundaries in order to connect to national statistics. The countries belonging toeach region are shown in Table 2.1.
Table 2.1 Regions of Western Europe for BRED purposes.
North Middle SouthNorway United Kingdom SpainSweden Ireland PortugalFinland The Netherlands Italy
Denmark Belgium GreeceLuxembourg
GermanyFrance
SwitzerlandAustria
The assessment of current physical flows of the main EU agro-bioresources and uses (foodand non-food) can only be based on a wide range of data. These required data can be split inthe following categories, examined below:
ª Basic data
ª Input data
ª Economic data
All the above mentioned data were used to produce MARKAL datasheets. These sheets havethe data in suitable units as required by MARKAL model (see Annex II)
2.1 Basic data
Data included in this set, including land area cultivated with each crop, yield of each crop,current production, etc., are available from several organisations (national and/orinternational) like FAO, EUROSTAT, National Statistical Offices, etc. Although in somecases slight differences have been identified between different sources, it is believed that mostof these primary data are reliable. Since homogeneity of data is a critical factor, only the datafrom FAO statistcs are presented in this report, unless otherwise indicated.
The assessment of traditional crop by-products was based on literature data and expertestimations. As far as industrial and agro-forestry crops are concerned, the yields reported here
4
refer to the total above ground biomass. Finally, data on yields for the period 1970-1995 (withfive years intervals) were used to estimate the future yields of crops.
2.2 Input data
This set of data include
• nitrogen fertiliser requirements,
• energy inputs, as well as
• labour requirements.
Most of these data are related to the desirable yields and to various site-dependent factors.Such site-dependent factors include
- climate (i.e. precipitation amount and distribution), and
- soil (i.e. soil texture).
Thus in most cases a range of values is presented. Data presented in the report were mainlyobtained from literature and in some cases through discussions with experts.
2.3 Economic dataBiomass production costs include* land rent,* establishment of plantation,* machinery,* inputs (fuel, fertiliser, etc.),* transport, etc.All these costs are site-depended and, as such, can not be presented by a single value.Furthermore, the scarcity of literature data did not allow the precise estimation of productioncosts.
The estimation of production costs was based on data on (A) producer prices for each crop;and (B) the share of inputs in production. The so obtained values can be seen as upper (A) andlower (B), respectively, limits of the unknown production costs.
Production cost figures of industrial and agro-forestry crops are based either on modelcalculations or on data reported from experimental plantations.
5
CHAPTER 3 - CURRENT BIOMASS PRODUCTION AND USEIN EUROPE
3.1 PRESENTATION BY CROP
3.1.1 WHEAT
Wheat is an annual grass belonging to the family of cereals and can be seen as a representativefor several grains (barley, rice etc). Worldwide, it is the most important cereal crop with atotal grain production of 585 Mt/year (FAO, 1996). The comparatively high protein content ofwheat grain makes it the most important source of human nutrition in the world. Moreover,several by-products of wheat-based food industries have created outlets for technical andindustrial applications, namely wheat germ oil, wheat gluten and wheat starch. Morespecifically, starch is consumed as a component of bread, pasta, rice, breakfast cereals, cakes,etc. Another large part is also consumed after conversion to ethanol in beverages.
In Western Europe, wheat is one of the most widely cultivated crops and serves as a majorsource for food and feed. The cultivated area with wheat in 1995 was about 16.5 Mha and thetotal production 89 Mt/y of fresh matter (FAO, 1995). Although the cultivated area with wheathas been reduced during the period 1990-1995, wheat grain production has remained ratherconstant, thus indicating a slight increase in land productivity.
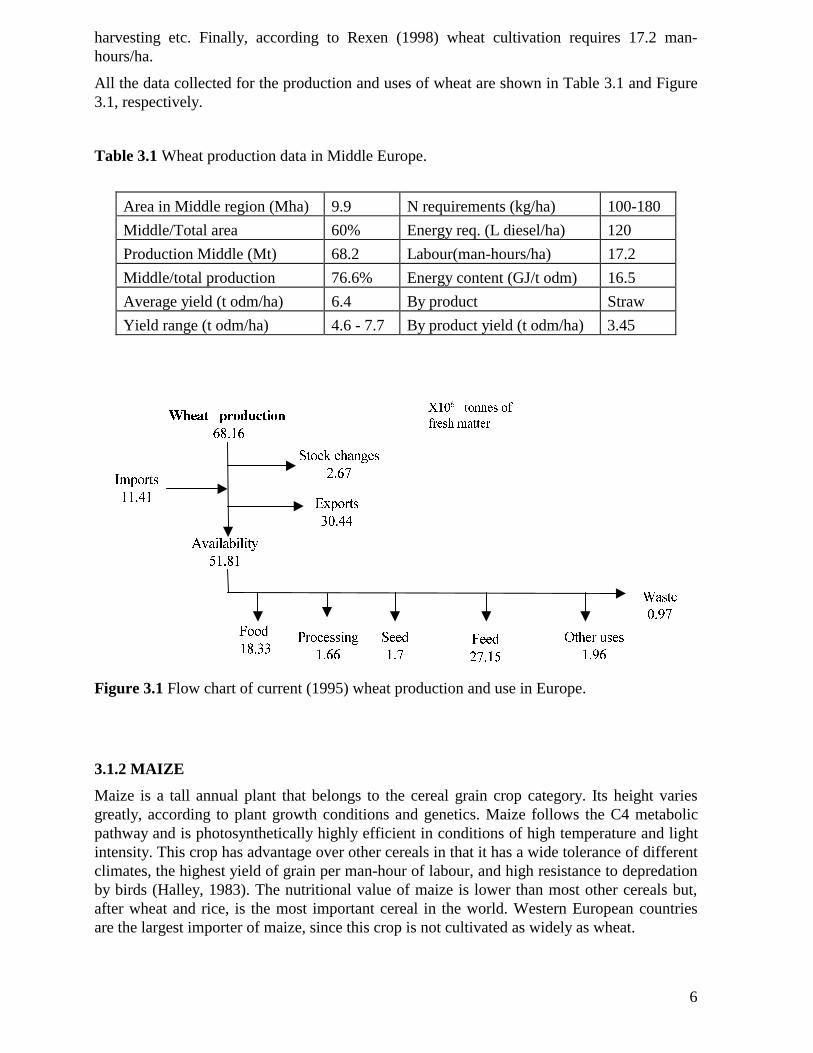
More specifically, in 1995, the cultivated area with wheat in Middle European countries was9.9 Mha with a total production of 68.2 Mt/y of fresh matter (FAO, 1995). By taking intoaccount imports, exports and stock changes the total usable production was 51.8 Mt/y of freshmatter (FAO, 1995).
Yields depend upon climatic and soil conditions, as well as other factors, such as variety ofcultivar, size of kernel, etc. According to FAO (1995), the average productivity of wheat inMiddle European countries was 7.1 t/ha fresh matter. The lowest and highest yields wereachieved in Austria and the Netherlands, respectively (FAO, 1995; EC, 1997). According toSalunkhe (1992), the moisture content of grain is about 10%, thus the estimated average dryyield of wheat in Middle Europe was 6.4 odt/ha.
Straw is the major by-product of wheat production, constituting one of the principal biomasssources arising from present agricultural activities in Europe. Based on the wheat harvestindex, which is about 0.6 (Bassam, 1998), the estimated yield of straw is 3.45 odt/ha(assuming a 10% moisture).
Wheat propagates by seeds and requires a minimum number of tillage operations to helpprevent soil compaction and restriction of root and water penetration. Rates of seeding differwith the type of wheat, size of seed and locality. Generally, the use of 33 kg of seeds/ha isrecommended (Duke, 1983). A critical factor for the wheat yield is fertilisation; according toHarris (1998), nitrogen requirements for wheat cultivation in Western Europe range between100 and 180 kg N/ha.
According to Briggle (1980), the direct energy requirements for wheat cultivation are 3.23GJ/ha for spring wheat, and 4.46 GJ/ha for winter wheat. These figures refer to the energyrequired for several operations like planting, fertiliser and pesticide application, irrigation,
6
harvesting etc. Finally, according to Rexen (1998) wheat cultivation requires 17.2 man-hours/ha.
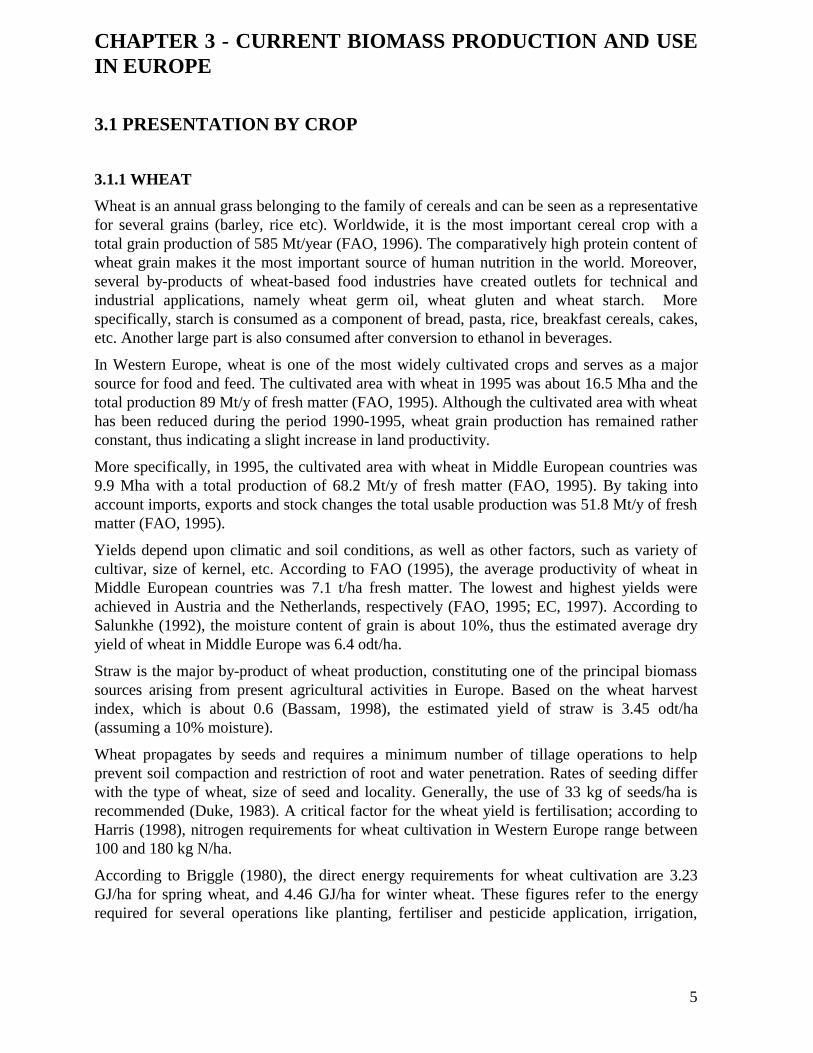
All the data collected for the production and uses of wheat are shown in Table 3.1 and Figure3.1, respectively.
Table 3.1 Wheat production data in Middle Europe.
Area in Middle region (Mha) 9.9 N requirements (kg/ha) 100-180
Middle/Total area 60% Energy req. (L diesel/ha) 120
Production Middle (Mt) 68.2 Labour(man-hours/ha) 17.2
Middle/total production 76.6% Energy content (GJ/t odm) 16.5
Average yield (t odm/ha) 6.4 By product Straw
Yield range (t odm/ha) 4.6 - 7.7 By product yield (t odm/ha) 3.45
:KHDW SURGXFWLRQ
�����
$YDLODELOLW\
�����
,PSRUWV
�����
)HHG
�����
6HHG
���
)RRG
�����3URFHVVLQJ
����
:DVWH
����
2WKHU XVHV
����
([SRUWV
�����
6WRFN FKDQJHV
����
;��� WRQQHV RI
IUHVK PDWWHU
Figure 3.1 Flow chart of current (1995) wheat production and use in Europe.
3.1.2 MAIZE
Maize is a tall annual plant that belongs to the cereal grain crop category. Its height variesgreatly, according to plant growth conditions and genetics. Maize follows the C4 metabolicpathway and is photosynthetically highly efficient in conditions of high temperature and lightintensity. This crop has advantage over other cereals in that it has a wide tolerance of differentclimates, the highest yield of grain per man-hour of labour, and high resistance to depredationby birds (Halley, 1983). The nutritional value of maize is lower than most other cereals but,after wheat and rice, is the most important cereal in the world. Western European countriesare the largest importer of maize, since this crop is not cultivated as widely as wheat.
7
The highest proportion of maize production (60.3%) is directly used for animal feed (FAO,1995). Furthermore, significant amounts of corn are yearly used for human food, in vegetable,fresh, canned or frozen forms. Finally, maize corn can be converted into various industrialproducts, including starch, syrup, dextrin, corn oil, etc. These substances are used in theprinting, confectionery, tanning leather, plastics, food, brewing, soap, paint, and textileindustries.
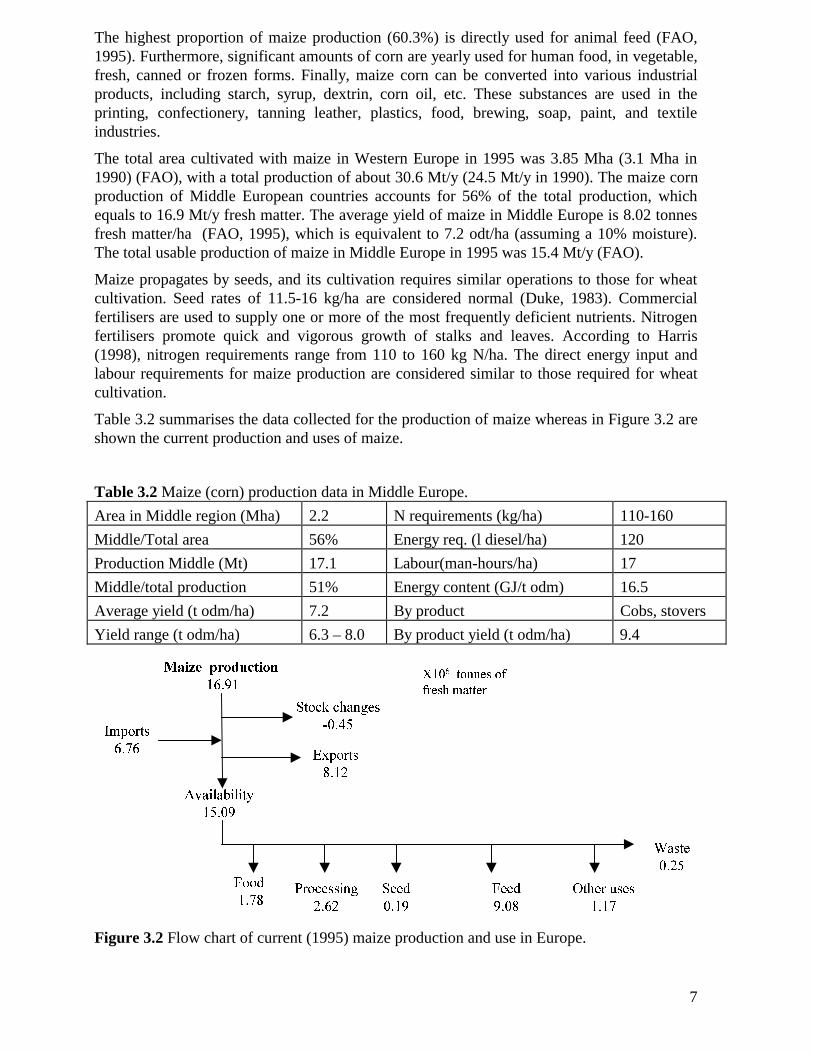
The total area cultivated with maize in Western Europe in 1995 was 3.85 Mha (3.1 Mha in1990) (FAO), with a total production of about 30.6 Mt/y (24.5 Mt/y in 1990). The maize cornproduction of Middle European countries accounts for 56% of the total production, whichequals to 16.9 Mt/y fresh matter. The average yield of maize in Middle Europe is 8.02 tonnesfresh matter/ha (FAO, 1995), which is equivalent to 7.2 odt/ha (assuming a 10% moisture).The total usable production of maize in Middle Europe in 1995 was 15.4 Mt/y (FAO).
Maize propagates by seeds, and its cultivation requires similar operations to those for wheatcultivation. Seed rates of 11.5-16 kg/ha are considered normal (Duke, 1983). Commercialfertilisers are used to supply one or more of the most frequently deficient nutrients. Nitrogenfertilisers promote quick and vigorous growth of stalks and leaves. According to Harris(1998), nitrogen requirements range from 110 to 160 kg N/ha. The direct energy input andlabour requirements for maize production are considered similar to those required for wheatcultivation.
Table 3.2 summarises the data collected for the production of maize whereas in Figure 3.2 areshown the current production and uses of maize.
Table 3.2 Maize (corn) production data in Middle Europe.
Area in Middle region (Mha) 2.2 N requirements (kg/ha) 110-160
Middle/Total area 56% Energy req. (l diesel/ha) 120
Production Middle (Mt) 17.1 Labour(man-hours/ha) 17
Middle/total production 51% Energy content (GJ/t odm) 16.5
Average yield (t odm/ha) 7.2 By product Cobs, stovers
Yield range (t odm/ha) 6.3 – 8.0 By product yield (t odm/ha) 9.4
0DL]H SURGXFWLRQ
�����
$YDLODELOLW\
�����
,PSRUWV
����
)HHG
����
6HHG
����
)RRG
����3URFHVVLQJ
����
:DVWH
����
2WKHU XVHV
����
([SRUWV
����
6WRFN FKDQJHV
�����
;��� WRQQHV RI
IUHVK PDWWHU
Figure 3.2 Flow chart of current (1995) maize production and use in Europe.
8
3.1.3 RAPE
The rape plant, in general, is grown as forage, for livestock feed, and as a source of vegetableoil. The rapeseed oil can be used in the food industry, as an illuminant and lubricant, for soapmanufacture, and as a fuel in diesel engines. Residual rapeseed cake, though low in foodvalue, is used as livestock feed. Rapeseed oil has potential markets in the production ofdetergents, lubrication oils, emulsifying agents, as well as polyamide fibres (Duke, 1983).According to the same author, the share of rapeseed oil in edible oilseed market, where itcompetes with soybeans, peantuts, safflower and sunflower seeds, is increasing.
The cultivated land with rapeseed in EU-15 was 2.83 Mha (1995), 85% of which in theMiddle European countries. Of the 2.4 Mha of land used in Middle Europe for cultivationwith rapeseed, 1.95 Mha were used for food purposes and the remaining 0.45 Mha for non-food purposes (EC, 1997). During the period 1990-1995, the area dedicated to rapeseedcultivation has increased by 0.35 Mha (FAO).
A slight increase has occurred to the yields of rapeseed between 1990 and 1995. The averageyield of seeds in Middle Europe was 3.0 t/ha of fresh matter, which increased to 3.3 t/ha freshmatter in 1995 (FAO). The 1995 average yield in the Middle European countries was 2.9 t/hafresh matter (EC, 1997). According to Salunkhe et.al. (1992), the moisture content of rapeseedis 10%. So, the average dry matter yield of rapeseed is estimated at 2.61 odt/ha.yr.
The total production of rapeseed in the Middle European region in 1995 was 7.8 Mt,accounting for more than 90% of EU-15 rapeseed production.
The main processed products of rapeseed are rapeseed oil for human consumption andrapeseed cake for animal feed. A small amount of the oil is actually used for the productionof biodiesel.
According to Smith et al. (1997), both annual (spring-sown) and biennial (winter-sown) typesare cultivated. A fine, firm seedbed is necessary for the small seeds to germinate evenly.Seedrates of 6-8 kg/ha are considered normal. Nitrogen fertilisation ranges from 50 to 100kg/ha, depending on the type (annual or biennial) and the development of the crop (Bassam,1998).
The total energy input for rape production according to Bassam (1998) is 7.62 GJ/ha, whereasthe direct energy requirements is 80.6 L diesel/ha (Spirinckx & Ceuterick 1996). According toRexen (1998), the rape seed cultivation requires 13.9 man-hours/ha.
The major by-product of rape cultivation is rape straw. According to Graef et. al. (1994), thewhole rape plant biomass consists of 63% of straw and 37% of seed. By taking into accountthe moisture content of straw (50%, according to Spirinckx & Ceuterick, 1996), the dry yieldof straw can be calculated at 2.8 odt/ha.yr.
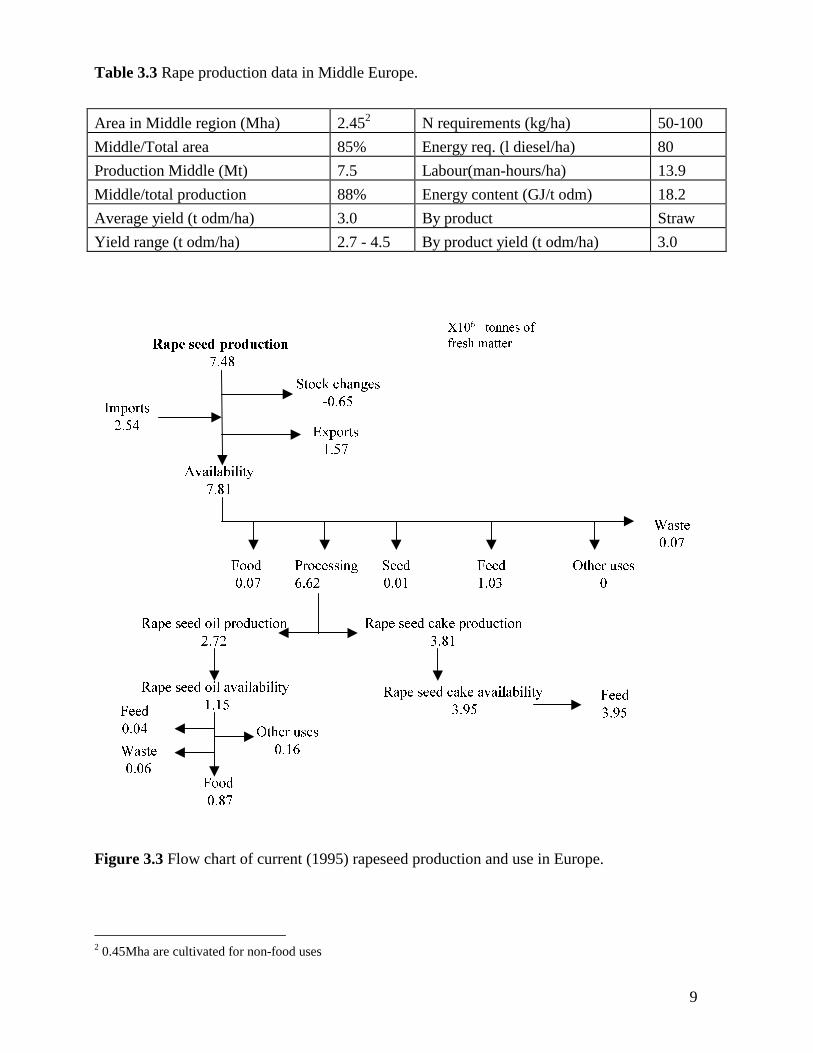
The following Table 3.3 and Figure 3.3 summarise the production and use data for rape.
9
Table 3.3 Rape production data in Middle Europe.
Area in Middle region (Mha) 2.452 N requirements (kg/ha) 50-100
Middle/Total area 85% Energy req. (l diesel/ha) 80
Production Middle (Mt) 7.5 Labour(man-hours/ha) 13.9
Middle/total production 88% Energy content (GJ/t odm) 18.2
Average yield (t odm/ha) 3.0 By product Straw
Yield range (t odm/ha) 2.7 - 4.5 By product yield (t odm/ha) 3.0
5DSH VHHG SURGXFWLRQ
����
$YDLODELOLW\
����
,PSRUWV
����
)HHG
����
6HHG
����
)RRG
����
3URFHVVLQJ
����
:DVWH
����
2WKHU XVHV
�
([SRUWV
����
6WRFN FKDQJHV
�����
5DSH VHHG FDNH SURGXFWLRQ
����
5DSH VHHG FDNH DYDLODELOLW\
����)HHG
����
5DSH VHHG RLO SURGXFWLRQ
����
5DSH VHHG RLO DYDLODELOLW\
����
)RRG
����
2WKHU XVHV
����
)HHG
����
:DVWH
����
;��� WRQQHV RI
IUHVK PDWWHU
Figure 3.3 Flow chart of current (1995) rapeseed production and use in Europe.
2 0.45Mha are cultivated for non-food uses
10
3.1.4 SUNFLOWER
Sunflower is cultivated primarily for its seeds, which yield one of the world’s most importantsources of edible oil. Sunflower oil is used for cooking, in margarine production, as saladdressings, for lubrication, soap production, etc. In addition, it is suitable for a range of otherindustrial uses.
Austria, France and Germany are the only Middle European countries were sunflower iscultivated. The total area cultivated with sunflower in these countries in 1995 was 1.04 Mhaconstituting about 40% of the total area cultivated with sunflower in EU-15 (FAO).
The total production of sunflower seeds in the Middle region countries was 2.16 Mt (about65% of the EU-15 production), which are mainly processed for the production of sunfloweroil (edible) and sunflower cake (for animal feed).
Sunflower is a well-adapted crop under various climatic and soil conditions, but it performsbest on freely drained and deeply worked soils. Seedrates of 8-10 kg/ha (Smith et al., 1997)are considered normal. A critical factor for high yields is irrigation. Grown on the same field,irrigated sunflower yields have been observed to increase up to 100% or more in comparisonto non-irrigated plants (Bassam, 1998). However, water use efficiency depends onfertilisation. Nitrogen requirements range from 50 to 75 kg/ha (Smith et al., 1997).
Energy and labour inputs are considered similar to those for rape cultivation.
The currently cultivated hybrids achieve an average yield of 2.5 t/ha of fresh matter (FAO),which equals to 2.25 odt/ha, considering a 10% moisture of seeds (Salunkhe et.al., 1992).
The sunflower crop generates annually significant amount of plant residues, mainly stalks,which remain in the field. On the average, stalk residues are estimated as twice as much as theseed production (Bassam, 1998). Additionally, the non-seed part of the heads is also animportant biomass source that is almost equal to the seed production. These residues have ahigh gross heating value of about 17 to 18 MJ/kg.
According to Smith et al. (1997), the total area of sunflower growth in Europe has beenexpanding steadily and seems likely to continue to do so; within that total, the industrial croparea is also expected to rise.
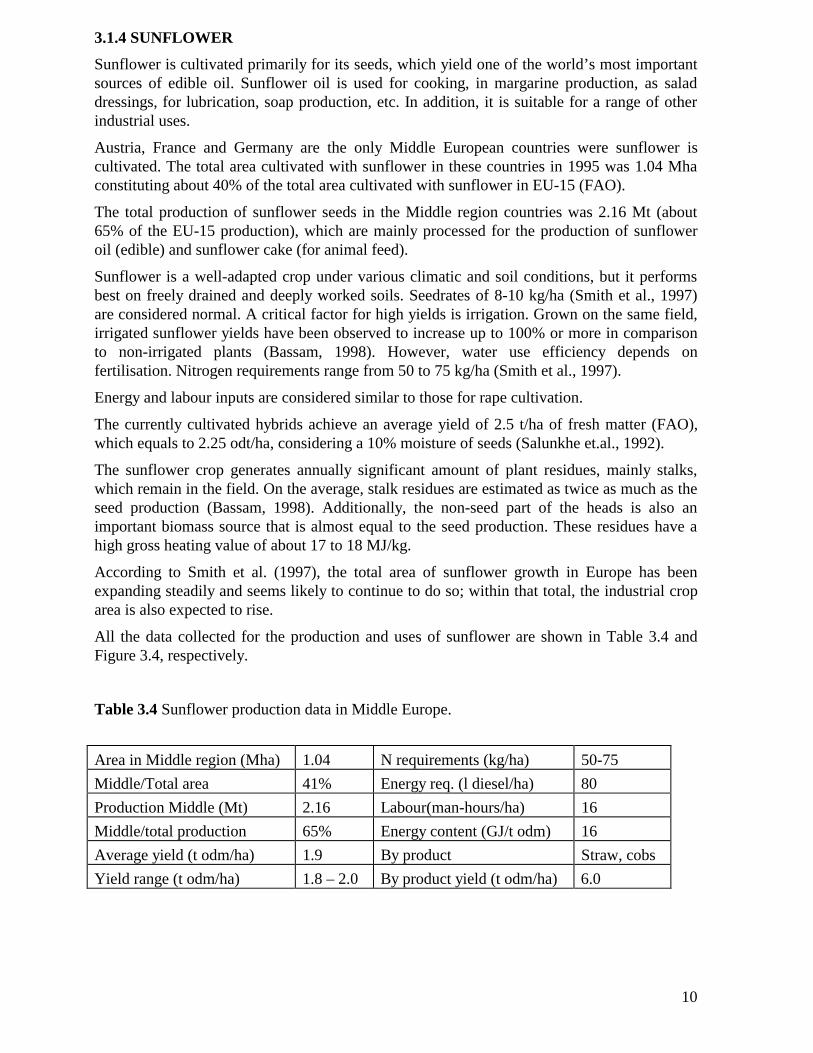
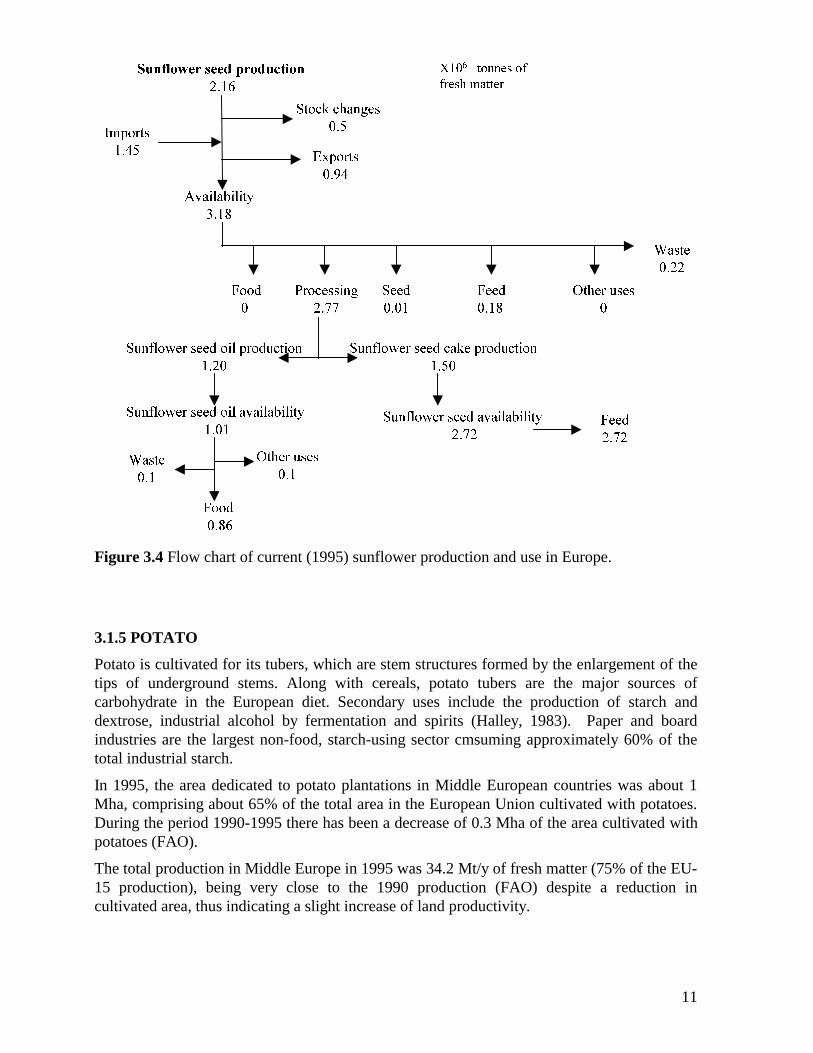
All the data collected for the production and uses of sunflower are shown in Table 3.4 andFigure 3.4, respectively.
Table 3.4 Sunflower production data in Middle Europe.
Area in Middle region (Mha) 1.04 N requirements (kg/ha) 50-75
Middle/Total area 41% Energy req. (l diesel/ha) 80
Production Middle (Mt) 2.16 Labour(man-hours/ha) 16
Middle/total production 65% Energy content (GJ/t odm) 16
Average yield (t odm/ha) 1.9 By product Straw, cobs
Yield range (t odm/ha) 1.8 – 2.0 By product yield (t odm/ha) 6.0
11
6XQIORZHU VHHG SURGXFWLRQ
����
$YDLODELOLW\
����
,PSRUWV
����
)HHG
����
6HHG
����
)RRG
�
3URFHVVLQJ
����
:DVWH
����
2WKHU XVHV
�
([SRUWV
����
6WRFN FKDQJHV
���
6XQIORZHU VHHG FDNH SURGXFWLRQ
����
6XQIORZHU VHHG DYDLODELOLW\
����)HHG
����
6XQIORZHU VHHG RLO SURGXFWLRQ
����
6XQIORZHU VHHG RLO DYDLODELOLW\
����
)RRG
����
2WKHU XVHV
���:DVWH
���
;��� WRQQHV RI
IUHVK PDWWHU
Figure 3.4 Flow chart of current (1995) sunflower production and use in Europe.
3.1.5 POTATO
Potato is cultivated for its tubers, which are stem structures formed by the enlargement of thetips of underground stems. Along with cereals, potato tubers are the major sources ofcarbohydrate in the European diet. Secondary uses include the production of starch anddextrose, industrial alcohol by fermentation and spirits (Halley, 1983). Paper and boardindustries are the largest non-food, starch-using sector cmsuming approximately 60% of thetotal industrial starch.
In 1995, the area dedicated to potato plantations in Middle European countries was about 1Mha, comprising about 65% of the total area in the European Union cultivated with potatoes.During the period 1990-1995 there has been a decrease of 0.3 Mha of the area cultivated withpotatoes (FAO).
The total production in Middle Europe in 1995 was 34.2 Mt/y of fresh matter (75% of the EU-15 production), being very close to the 1990 production (FAO) despite a reduction incultivated area, thus indicating a slight increase of land productivity.
12
The average yield in 1995 in the Middle European countries was 34.2 t of fresh matter/ha. Thelowest and highest yields have been recorded in Austria and Netherlands, respectively (FAO).Based on the its high moisture content, i.e., 80% (Rexen and Munck, 1984), the dry matteryield of potato is estimated at 6.9 odt/ha/yr.
Nitrogen fertilisation requirements range from 75 to 110 kg N/ha, according to Martin et al.(1976), whereas the energy requirements are considered to be similar to those for sugar beetcultivation. According to Rexen (1998), labour requirements for potato cultivation are ratherhigh (45.8 man-hours/ha)
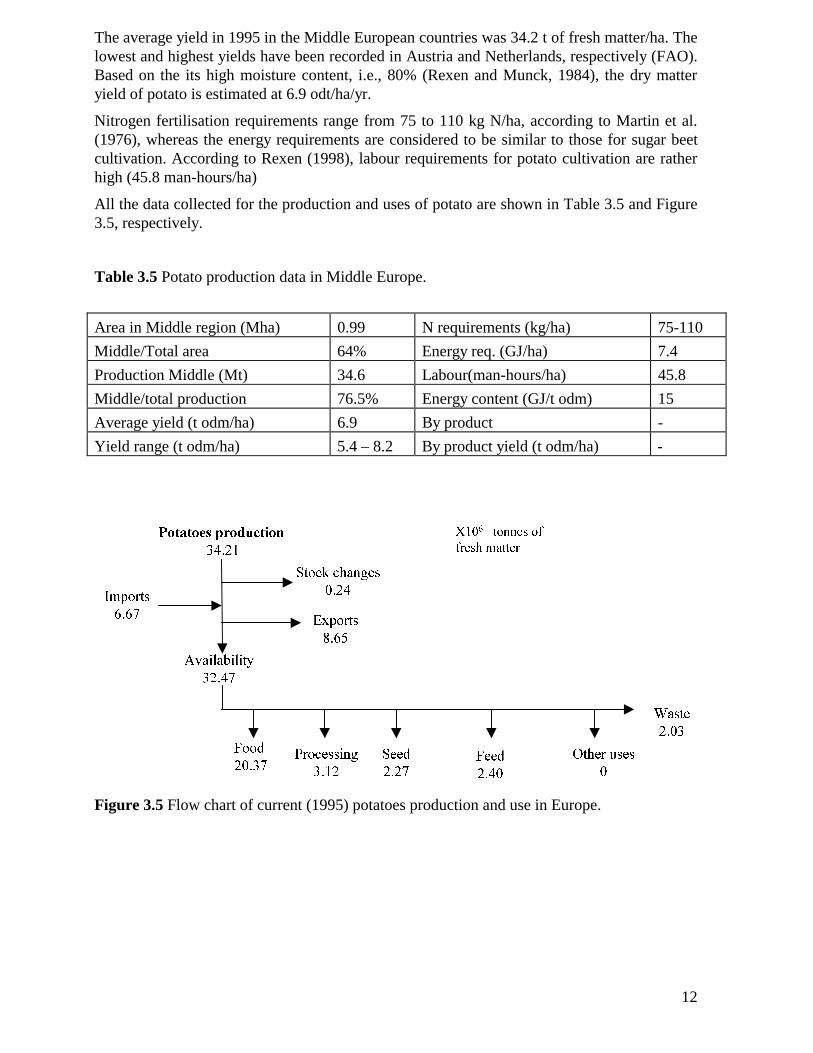
All the data collected for the production and uses of potato are shown in Table 3.5 and Figure3.5, respectively.
Table 3.5 Potato production data in Middle Europe.
Area in Middle region (Mha) 0.99 N requirements (kg/ha) 75-110
Middle/Total area 64% Energy req. (GJ/ha) 7.4
Production Middle (Mt) 34.6 Labour(man-hours/ha) 45.8
Middle/total production 76.5% Energy content (GJ/t odm) 15
Average yield (t odm/ha) 6.9 By product -
Yield range (t odm/ha) 5.4 – 8.2 By product yield (t odm/ha) -
3RWDWRHV SURGXFWLRQ
�����
$YDLODELOLW\
�����
,PSRUWV
����
)HHG
����
6HHG
����
)RRG
�����3URFHVVLQJ
����
:DVWH
����
2WKHU XVHV
�
([SRUWV
����
6WRFN FKDQJHV
����
;��� WRQQHV RI
IUHVK PDWWHU
Figure 3.5 Flow chart of current (1995) potatoes production and use in Europe.
13
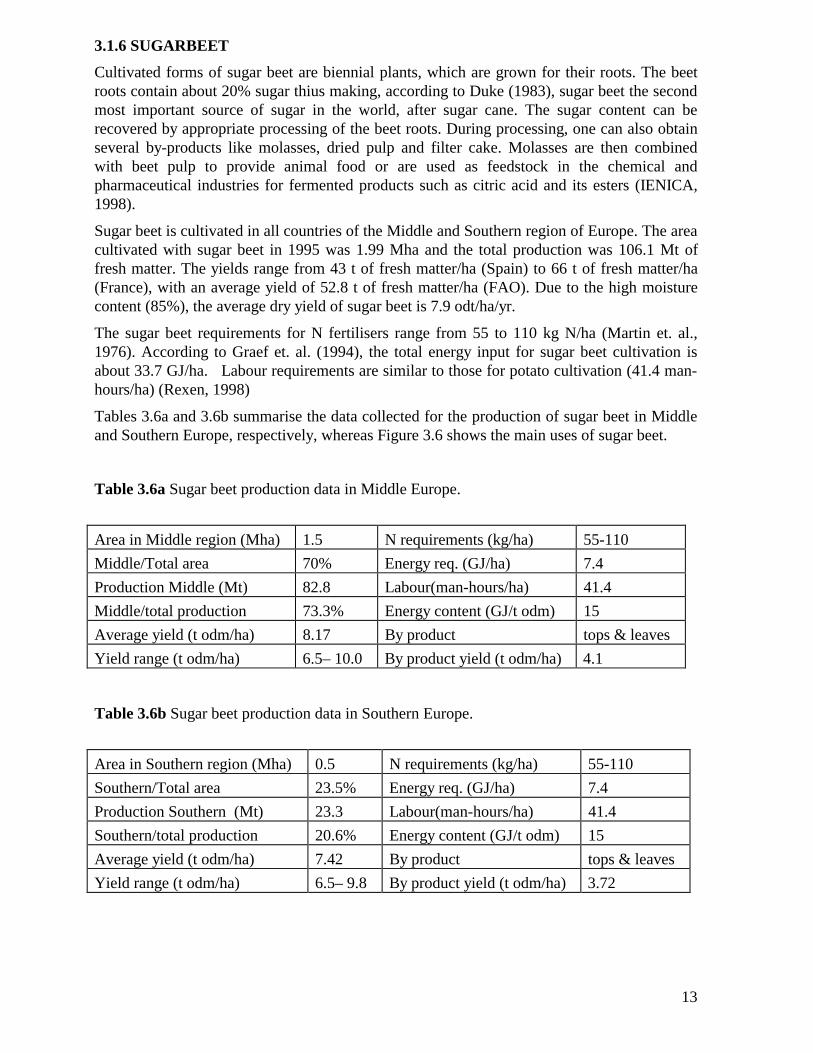
3.1.6 SUGARBEET
Cultivated forms of sugar beet are biennial plants, which are grown for their roots. The beetroots contain about 20% sugar thius making, according to Duke (1983), sugar beet the secondmost important source of sugar in the world, after sugar cane. The sugar content can berecovered by appropriate processing of the beet roots. During processing, one can also obtainseveral by-products like molasses, dried pulp and filter cake. Molasses are then combinedwith beet pulp to provide animal food or are used as feedstock in the chemical andpharmaceutical industries for fermented products such as citric acid and its esters (IENICA,1998).
Sugar beet is cultivated in all countries of the Middle and Southern region of Europe. The areacultivated with sugar beet in 1995 was 1.99 Mha and the total production was 106.1 Mt offresh matter. The yields range from 43 t of fresh matter/ha (Spain) to 66 t of fresh matter/ha(France), with an average yield of 52.8 t of fresh matter/ha (FAO). Due to the high moisturecontent (85%), the average dry yield of sugar beet is 7.9 odt/ha/yr.
The sugar beet requirements for N fertilisers range from 55 to 110 kg N/ha (Martin et. al.,1976). According to Graef et. al. (1994), the total energy input for sugar beet cultivation isabout 33.7 GJ/ha. Labour requirements are similar to those for potato cultivation (41.4 man-hours/ha) (Rexen, 1998)
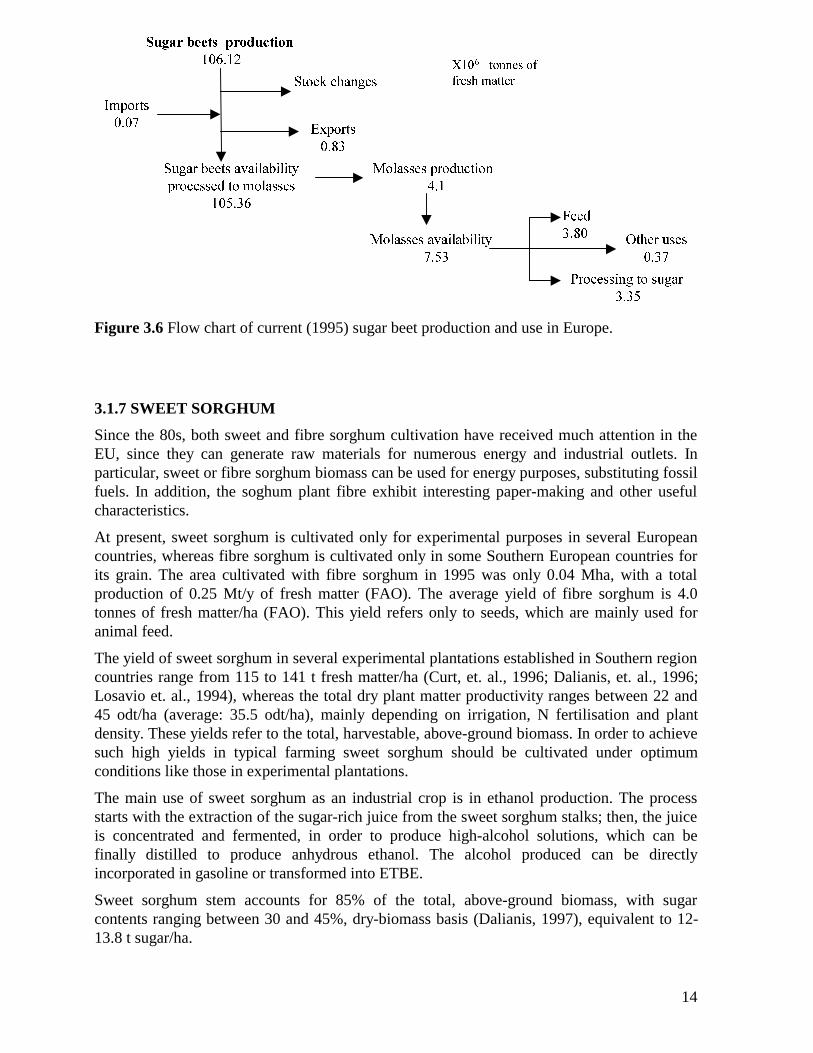
Tables 3.6a and 3.6b summarise the data collected for the production of sugar beet in Middleand Southern Europe, respectively, whereas Figure 3.6 shows the main uses of sugar beet.
Table 3.6a Sugar beet production data in Middle Europe.
Area in Middle region (Mha) 1.5 N requirements (kg/ha) 55-110
Middle/Total area 70% Energy req. (GJ/ha) 7.4
Production Middle (Mt) 82.8 Labour(man-hours/ha) 41.4
Middle/total production 73.3% Energy content (GJ/t odm) 15
Average yield (t odm/ha) 8.17 By product tops & leaves
Yield range (t odm/ha) 6.5– 10.0 By product yield (t odm/ha) 4.1
Table 3.6b Sugar beet production data in Southern Europe.
Area in Southern region (Mha) 0.5 N requirements (kg/ha) 55-110
Southern/Total area 23.5% Energy req. (GJ/ha) 7.4
Production Southern (Mt) 23.3 Labour(man-hours/ha) 41.4
Southern/total production 20.6% Energy content (GJ/t odm) 15
Average yield (t odm/ha) 7.42 By product tops & leaves
Yield range (t odm/ha) 6.5– 9.8 By product yield (t odm/ha) 3.72
14
6XJDU EHHWV SURGXFWLRQ
������
6XJDU EHHWV DYDLODELOLW\
SURFHVVHG WR PRODVVHV
������
,PSRUWV
����
0RODVVHV SURGXFWLRQ
���
([SRUWV
����
6WRFN FKDQJHV
0RODVVHV DYDLODELOLW\
����
)HHG
����
3URFHVVLQJ WR VXJDU
����
2WKHU XVHV
����
;��� WRQQHV RI
IUHVK PDWWHU
Figure 3.6 Flow chart of current (1995) sugar beet production and use in Europe.
3.1.7 SWEET SORGHUM
Since the 80s, both sweet and fibre sorghum cultivation have received much attention in theEU, since they can generate raw materials for numerous energy and industrial outlets. Inparticular, sweet or fibre sorghum biomass can be used for energy purposes, substituting fossilfuels. In addition, the soghum plant fibre exhibit interesting paper-making and other usefulcharacteristics.
At present, sweet sorghum is cultivated only for experimental purposes in several Europeancountries, whereas fibre sorghum is cultivated only in some Southern European countries forits grain. The area cultivated with fibre sorghum in 1995 was only 0.04 Mha, with a totalproduction of 0.25 Mt/y of fresh matter (FAO). The average yield of fibre sorghum is 4.0tonnes of fresh matter/ha (FAO). This yield refers only to seeds, which are mainly used foranimal feed.
The yield of sweet sorghum in several experimental plantations established in Southern regioncountries range from 115 to 141 t fresh matter/ha (Curt, et. al., 1996; Dalianis, et. al., 1996;Losavio et. al., 1994), whereas the total dry plant matter productivity ranges between 22 and45 odt/ha (average: 35.5 odt/ha), mainly depending on irrigation, N fertilisation and plantdensity. These yields refer to the total, harvestable, above-ground biomass. In order to achievesuch high yields in typical farming sweet sorghum should be cultivated under optimumconditions like those in experimental plantations.
The main use of sweet sorghum as an industrial crop is in ethanol production. The processstarts with the extraction of the sugar-rich juice from the sweet sorghum stalks; then, the juiceis concentrated and fermented, in order to produce high-alcohol solutions, which can befinally distilled to produce anhydrous ethanol. The alcohol produced can be directlyincorporated in gasoline or transformed into ETBE.
Sweet sorghum stem accounts for 85% of the total, above-ground biomass, with sugarcontents ranging between 30 and 45%, dry-biomass basis (Dalianis, 1997), equivalent to 12-13.8 t sugar/ha.
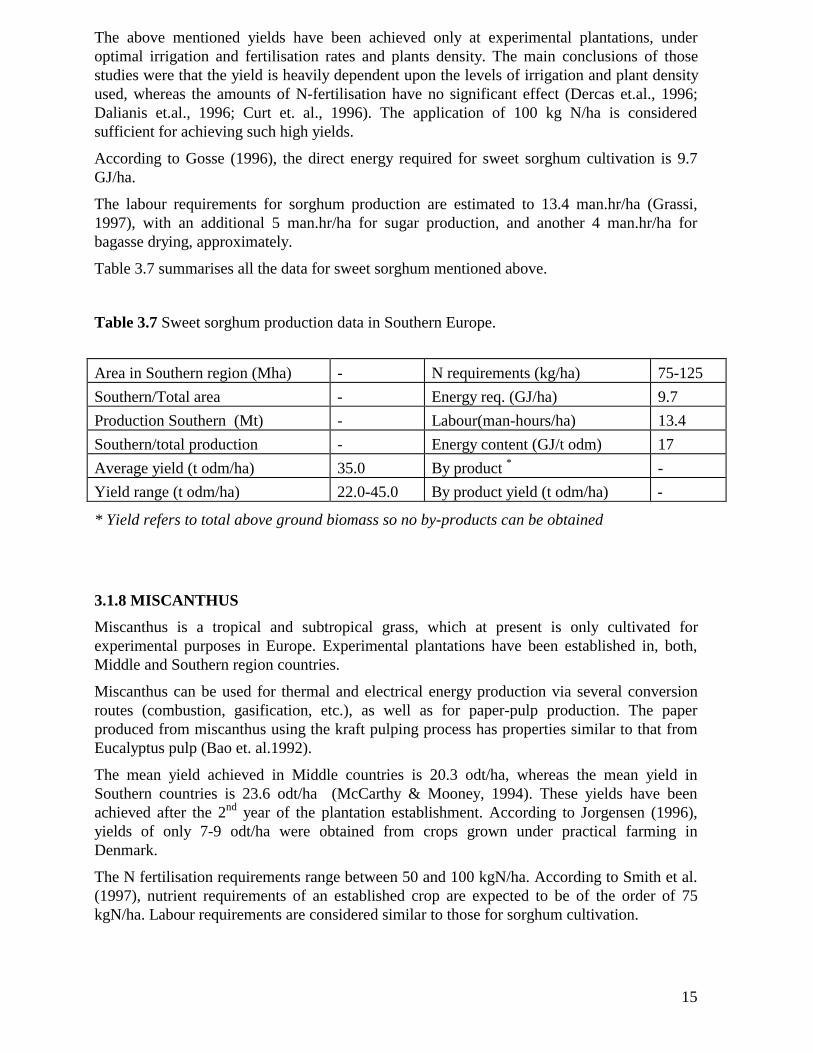
15
The above mentioned yields have been achieved only at experimental plantations, underoptimal irrigation and fertilisation rates and plants density. The main conclusions of thosestudies were that the yield is heavily dependent upon the levels of irrigation and plant densityused, whereas the amounts of N-fertilisation have no significant effect (Dercas et.al., 1996;Dalianis et.al., 1996; Curt et. al., 1996). The application of 100 kg N/ha is consideredsufficient for achieving such high yields.
According to Gosse (1996), the direct energy required for sweet sorghum cultivation is 9.7GJ/ha.
The labour requirements for sorghum production are estimated to 13.4 man.hr/ha (Grassi,1997), with an additional 5 man.hr/ha for sugar production, and another 4 man.hr/ha forbagasse drying, approximately.
Table 3.7 summarises all the data for sweet sorghum mentioned above.
Table 3.7 Sweet sorghum production data in Southern Europe.
Area in Southern region (Mha) - N requirements (kg/ha) 75-125
Southern/Total area - Energy req. (GJ/ha) 9.7
Production Southern (Mt) - Labour(man-hours/ha) 13.4
Southern/total production - Energy content (GJ/t odm) 17
Average yield (t odm/ha) 35.0 By product * -
Yield range (t odm/ha) 22.0-45.0 By product yield (t odm/ha) -
* Yield refers to total above ground biomass so no by-products can be obtained
3.1.8 MISCANTHUS
Miscanthus is a tropical and subtropical grass, which at present is only cultivated forexperimental purposes in Europe. Experimental plantations have been established in, both,Middle and Southern region countries.
Miscanthus can be used for thermal and electrical energy production via several conversionroutes (combustion, gasification, etc.), as well as for paper-pulp production. The paperproduced from miscanthus using the kraft pulping process has properties similar to that fromEucalyptus pulp (Bao et. al.1992).
The mean yield achieved in Middle countries is 20.3 odt/ha, whereas the mean yield inSouthern countries is 23.6 odt/ha (McCarthy & Mooney, 1994). These yields have beenachieved after the 2nd year of the plantation establishment. According to Jorgensen (1996),yields of only 7-9 odt/ha were obtained from crops grown under practical farming inDenmark.
The N fertilisation requirements range between 50 and 100 kgN/ha. According to Smith et al.(1997), nutrient requirements of an established crop are expected to be of the order of 75kgN/ha. Labour requirements are considered similar to those for sorghum cultivation.
16
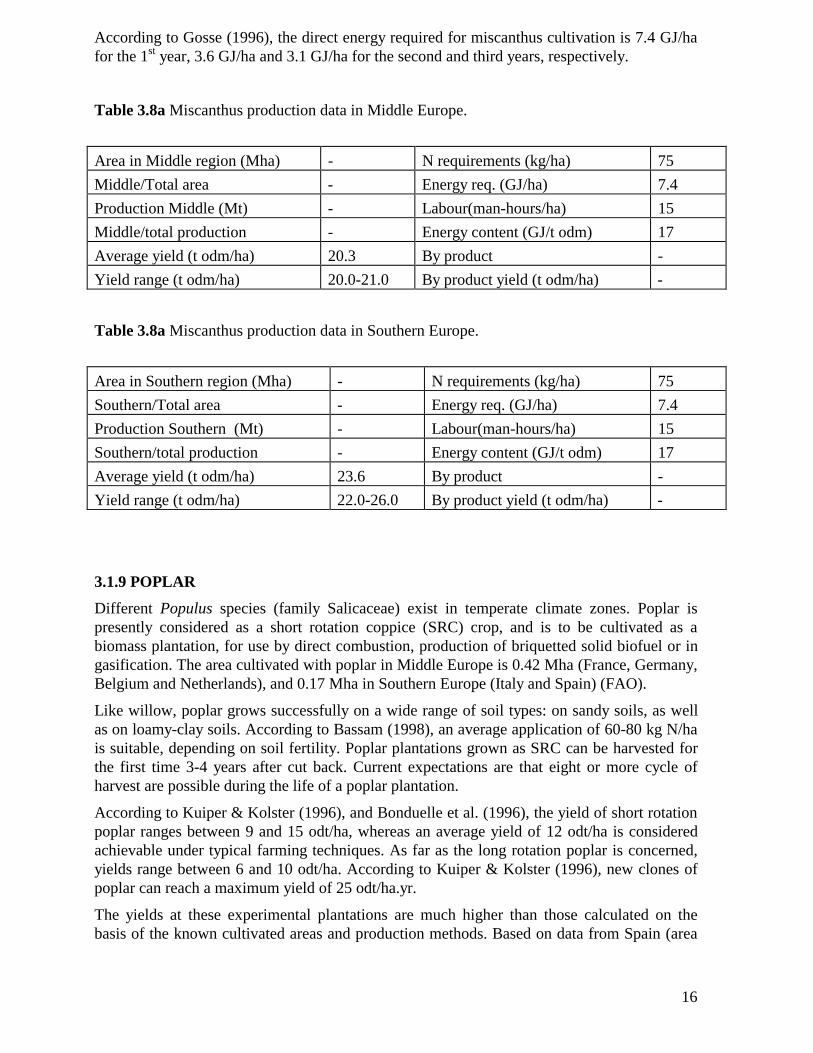
According to Gosse (1996), the direct energy required for miscanthus cultivation is 7.4 GJ/hafor the 1st year, 3.6 GJ/ha and 3.1 GJ/ha for the second and third years, respectively.
Table 3.8a Miscanthus production data in Middle Europe.
Area in Middle region (Mha) - N requirements (kg/ha) 75
Middle/Total area - Energy req. (GJ/ha) 7.4
Production Middle (Mt) - Labour(man-hours/ha) 15
Middle/total production - Energy content (GJ/t odm) 17
Average yield (t odm/ha) 20.3 By product -
Yield range (t odm/ha) 20.0-21.0 By product yield (t odm/ha) -
Table 3.8a Miscanthus production data in Southern Europe.
Area in Southern region (Mha) - N requirements (kg/ha) 75
Southern/Total area - Energy req. (GJ/ha) 7.4
Production Southern (Mt) - Labour(man-hours/ha) 15
Southern/total production - Energy content (GJ/t odm) 17
Average yield (t odm/ha) 23.6 By product -
Yield range (t odm/ha) 22.0-26.0 By product yield (t odm/ha) -
3.1.9 POPLAR
Different Populus species (family Salicaceae) exist in temperate climate zones. Poplar ispresently considered as a short rotation coppice (SRC) crop, and is to be cultivated as abiomass plantation, for use by direct combustion, production of briquetted solid biofuel or ingasification. The area cultivated with poplar in Middle Europe is 0.42 Mha (France, Germany,Belgium and Netherlands), and 0.17 Mha in Southern Europe (Italy and Spain) (FAO).
Like willow, poplar grows successfully on a wide range of soil types: on sandy soils, as wellas on loamy-clay soils. According to Bassam (1998), an average application of 60-80 kg N/hais suitable, depending on soil fertility. Poplar plantations grown as SRC can be harvested forthe first time 3-4 years after cut back. Current expectations are that eight or more cycle ofharvest are possible during the life of a poplar plantation.
According to Kuiper & Kolster (1996), and Bonduelle et al. (1996), the yield of short rotationpoplar ranges between 9 and 15 odt/ha, whereas an average yield of 12 odt/ha is consideredachievable under typical farming techniques. As far as the long rotation poplar is concerned,yields range between 6 and 10 odt/ha. According to Kuiper & Kolster (1996), new clones ofpoplar can reach a maximum yield of 25 odt/ha.yr.
The yields at these experimental plantations are much higher than those calculated on thebasis of the known cultivated areas and production methods. Based on data from Spain (area
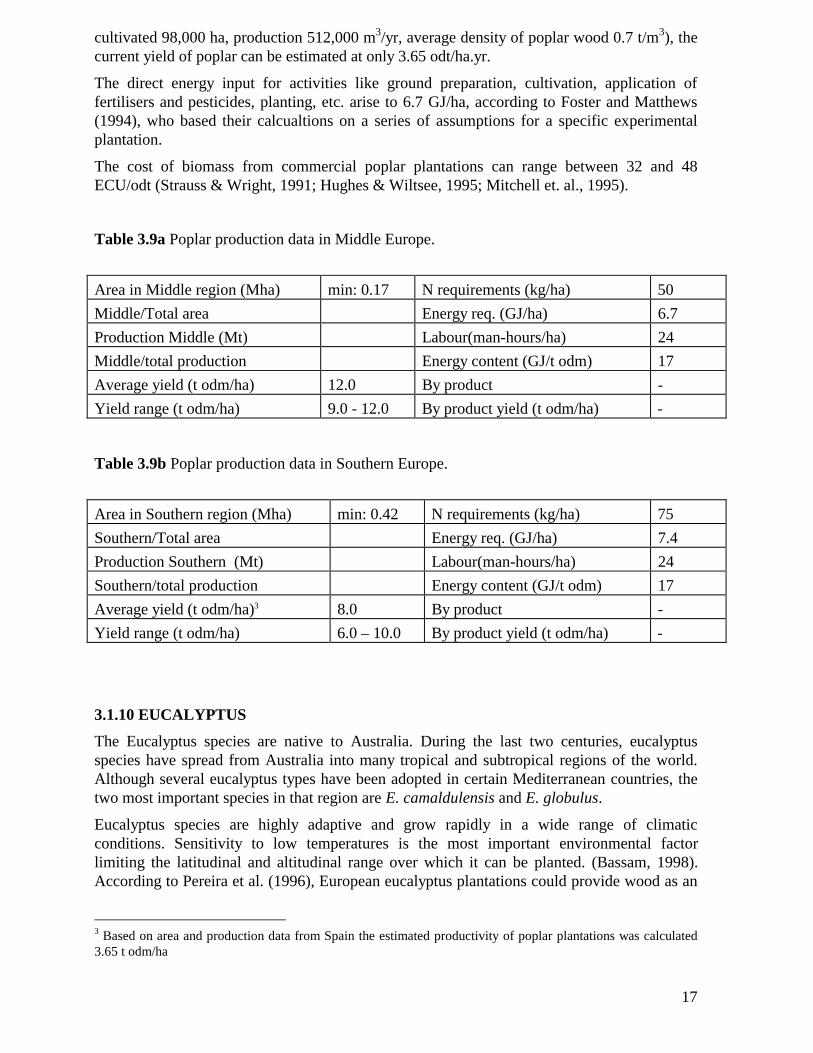
17
cultivated 98,000 ha, production 512,000 m3/yr, average density of poplar wood 0.7 t/m3), thecurrent yield of poplar can be estimated at only 3.65 odt/ha.yr.
The direct energy input for activities like ground preparation, cultivation, application offertilisers and pesticides, planting, etc. arise to 6.7 GJ/ha, according to Foster and Matthews(1994), who based their calcualtions on a series of assumptions for a specific experimentalplantation.
The cost of biomass from commercial poplar plantations can range between 32 and 48ECU/odt (Strauss & Wright, 1991; Hughes & Wiltsee, 1995; Mitchell et. al., 1995).
Table 3.9a Poplar production data in Middle Europe.
Area in Middle region (Mha) min: 0.17 N requirements (kg/ha) 50
Middle/Total area Energy req. (GJ/ha) 6.7
Production Middle (Mt) Labour(man-hours/ha) 24
Middle/total production Energy content (GJ/t odm) 17
Average yield (t odm/ha) 12.0 By product -
Yield range (t odm/ha) 9.0 - 12.0 By product yield (t odm/ha) -
Table 3.9b Poplar production data in Southern Europe.
Area in Southern region (Mha) min: 0.42 N requirements (kg/ha) 75
Southern/Total area Energy req. (GJ/ha) 7.4
Production Southern (Mt) Labour(man-hours/ha) 24
Southern/total production Energy content (GJ/t odm) 17
Average yield (t odm/ha)3 8.0 By product -
Yield range (t odm/ha) 6.0 – 10.0 By product yield (t odm/ha) -
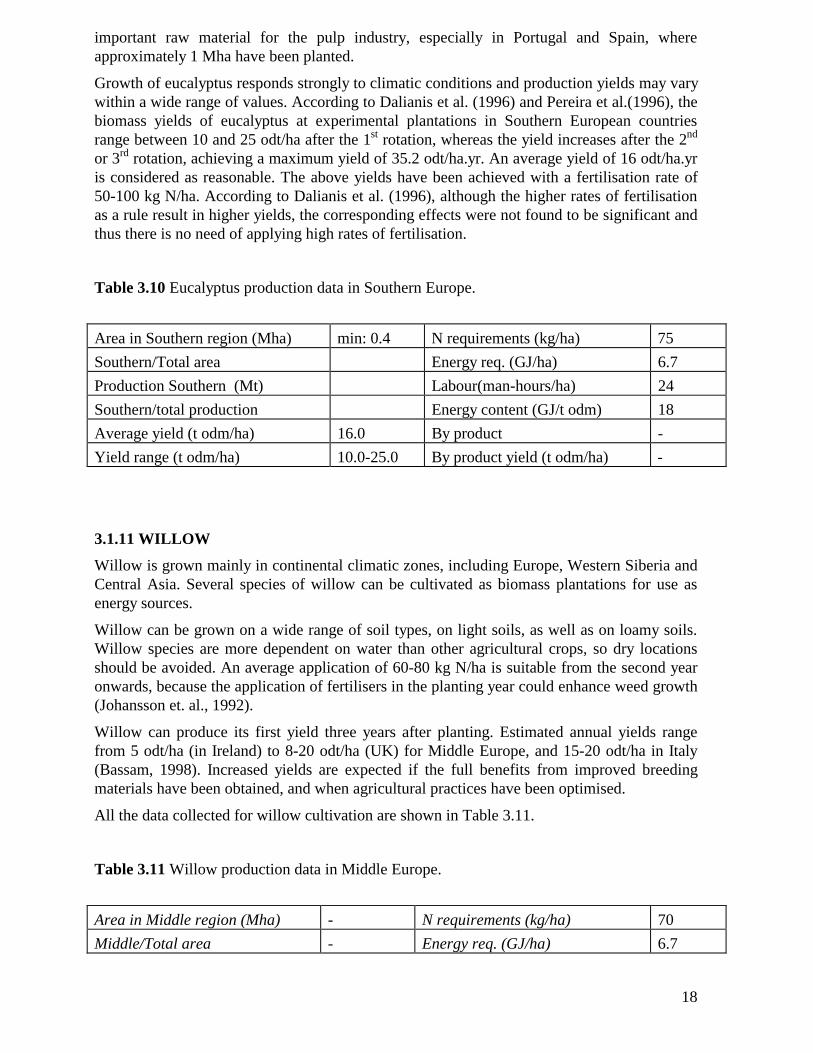
3.1.10 EUCALYPTUS
The Eucalyptus species are native to Australia. During the last two centuries, eucalyptusspecies have spread from Australia into many tropical and subtropical regions of the world.Although several eucalyptus types have been adopted in certain Mediterranean countries, thetwo most important species in that region are E. camaldulensis and E. globulus.
Eucalyptus species are highly adaptive and grow rapidly in a wide range of climaticconditions. Sensitivity to low temperatures is the most important environmental factorlimiting the latitudinal and altitudinal range over which it can be planted. (Bassam, 1998).According to Pereira et al. (1996), European eucalyptus plantations could provide wood as an
3 Based on area and production data from Spain the estimated productivity of poplar plantations was calculated3.65 t odm/ha
18
important raw material for the pulp industry, especially in Portugal and Spain, whereapproximately 1 Mha have been planted.
Growth of eucalyptus responds strongly to climatic conditions and production yields may varywithin a wide range of values. According to Dalianis et al. (1996) and Pereira et al.(1996), thebiomass yields of eucalyptus at experimental plantations in Southern European countriesrange between 10 and 25 odt/ha after the 1st rotation, whereas the yield increases after the 2nd
or 3rd rotation, achieving a maximum yield of 35.2 odt/ha.yr. An average yield of 16 odt/ha.yris considered as reasonable. The above yields have been achieved with a fertilisation rate of50-100 kg N/ha. According to Dalianis et al. (1996), although the higher rates of fertilisationas a rule result in higher yields, the corresponding effects were not found to be significant andthus there is no need of applying high rates of fertilisation.
Table 3.10 Eucalyptus production data in Southern Europe.
Area in Southern region (Mha) min: 0.4 N requirements (kg/ha) 75
Southern/Total area Energy req. (GJ/ha) 6.7
Production Southern (Mt) Labour(man-hours/ha) 24
Southern/total production Energy content (GJ/t odm) 18
Average yield (t odm/ha) 16.0 By product -
Yield range (t odm/ha) 10.0-25.0 By product yield (t odm/ha) -
3.1.11 WILLOW
Willow is grown mainly in continental climatic zones, including Europe, Western Siberia andCentral Asia. Several species of willow can be cultivated as biomass plantations for use asenergy sources.
Willow can be grown on a wide range of soil types, on light soils, as well as on loamy soils.Willow species are more dependent on water than other agricultural crops, so dry locationsshould be avoided. An average application of 60-80 kg N/ha is suitable from the second yearonwards, because the application of fertilisers in the planting year could enhance weed growth(Johansson et. al., 1992).
Willow can produce its first yield three years after planting. Estimated annual yields rangefrom 5 odt/ha (in Ireland) to 8-20 odt/ha (UK) for Middle Europe, and 15-20 odt/ha in Italy(Bassam, 1998). Increased yields are expected if the full benefits from improved breedingmaterials have been obtained, and when agricultural practices have been optimised.
All the data collected for willow cultivation are shown in Table 3.11.
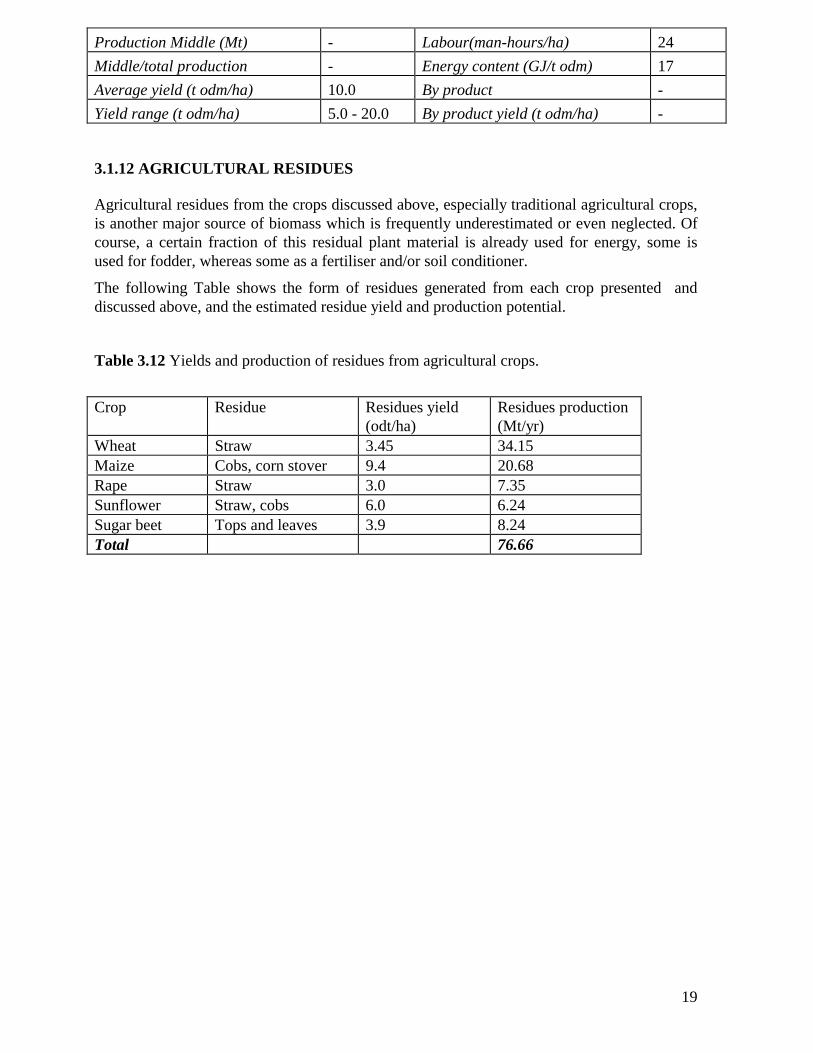
Table 3.11 Willow production data in Middle Europe.
Area in Middle region (Mha) - N requirements (kg/ha) 70
Middle/Total area - Energy req. (GJ/ha) 6.7
19
Production Middle (Mt) - Labour(man-hours/ha) 24
Middle/total production - Energy content (GJ/t odm) 17
Average yield (t odm/ha) 10.0 By product -
Yield range (t odm/ha) 5.0 - 20.0 By product yield (t odm/ha) -
3.1.12 AGRICULTURAL RESIDUES
Agricultural residues from the crops discussed above, especially traditional agricultural crops,is another major source of biomass which is frequently underestimated or even neglected. Ofcourse, a certain fraction of this residual plant material is already used for energy, some isused for fodder, whereas some as a fertiliser and/or soil conditioner.
The following Table shows the form of residues generated from each crop presented anddiscussed above, and the estimated residue yield and production potential.
Table 3.12 Yields and production of residues from agricultural crops.
Crop Residue Residues yield(odt/ha)
Residues production(Mt/yr)
Wheat Straw 3.45 34.15Maize Cobs, corn stover 9.4 20.68Rape Straw 3.0 7.35Sunflower Straw, cobs 6.0 6.24Sugar beet Tops and leaves 3.9 8.24Total 76.66
20
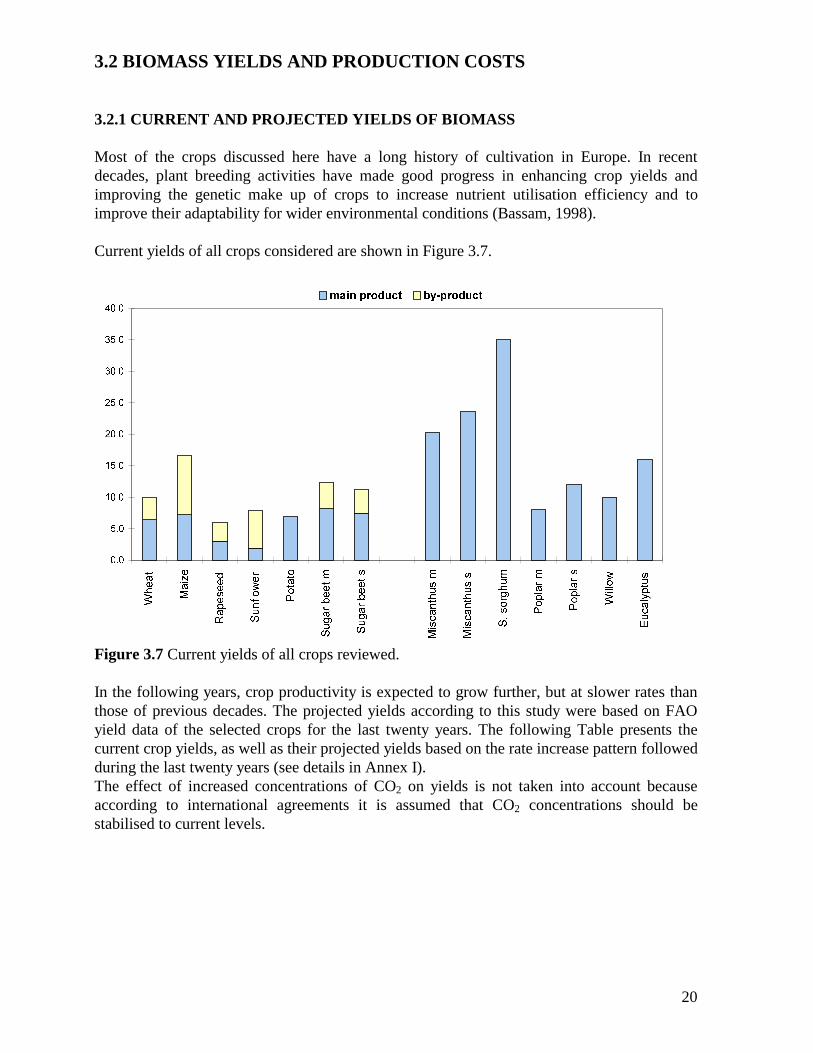
3.2 BIOMASS YIELDS AND PRODUCTION COSTS
3.2.1 CURRENT AND PROJECTED YIELDS OF BIOMASS
Most of the crops discussed here have a long history of cultivation in Europe. In recentdecades, plant breeding activities have made good progress in enhancing crop yields andimproving the genetic make up of crops to increase nutrient utilisation efficiency and toimprove their adaptability for wider environmental conditions (Bassam, 1998).
Current yields of all crops considered are shown in Figure 3.7.
���
���
����
����
����
����
����
����
����
:KHDW
0DL]H
5DSHVHHG
6XQIORZHU
3RWDWR
6XJDUEHHWP
6XJDUEHHWV
0LVFDQWKXVP
0LVFDQWKXVV
6�VRUJKXP
3RSODUP
3RSODUV
:LOORZ
(XFDO\SWXV
PDLQ SURGXFW E\�SURGXFW
Figure 3.7 Current yields of all crops reviewed.
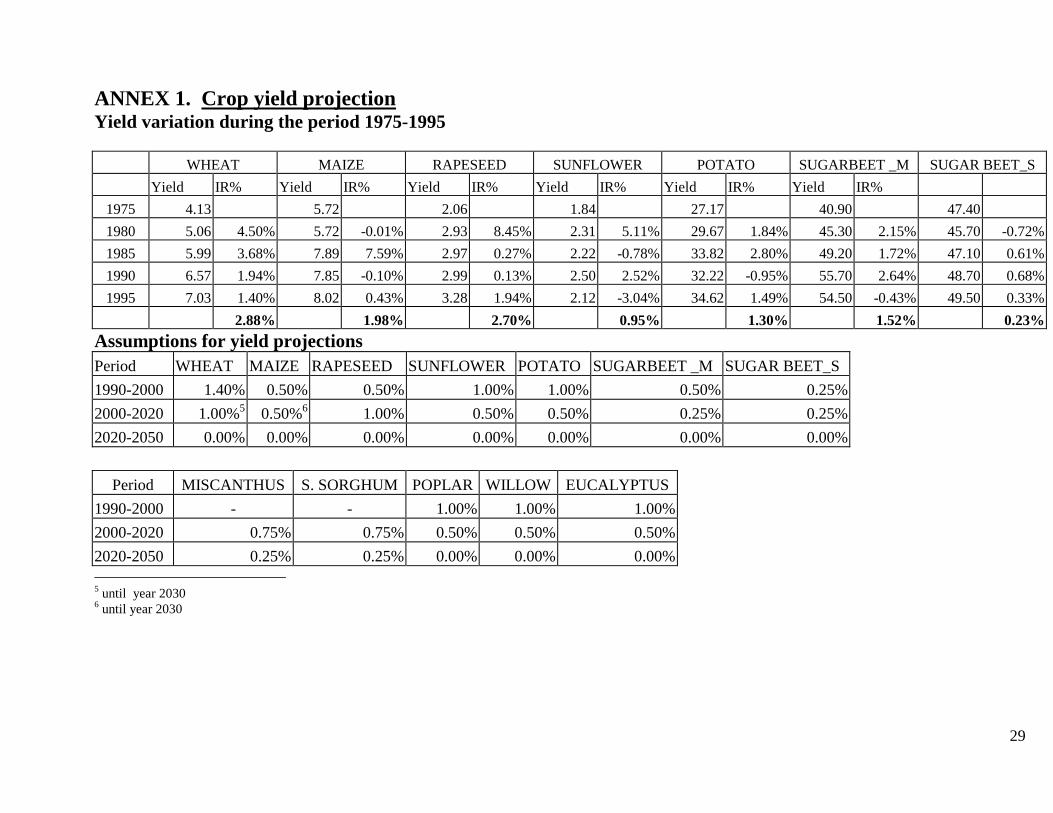
In the following years, crop productivity is expected to grow further, but at slower rates thanthose of previous decades. The projected yields according to this study were based on FAOyield data of the selected crops for the last twenty years. The following Table presents thecurrent crop yields, as well as their projected yields based on the rate increase pattern followedduring the last twenty years (see details in Annex I).The effect of increased concentrations of CO2 on yields is not taken into account becauseaccording to international agreements it is assumed that CO2 concentrations should bestabilised to current levels.
21
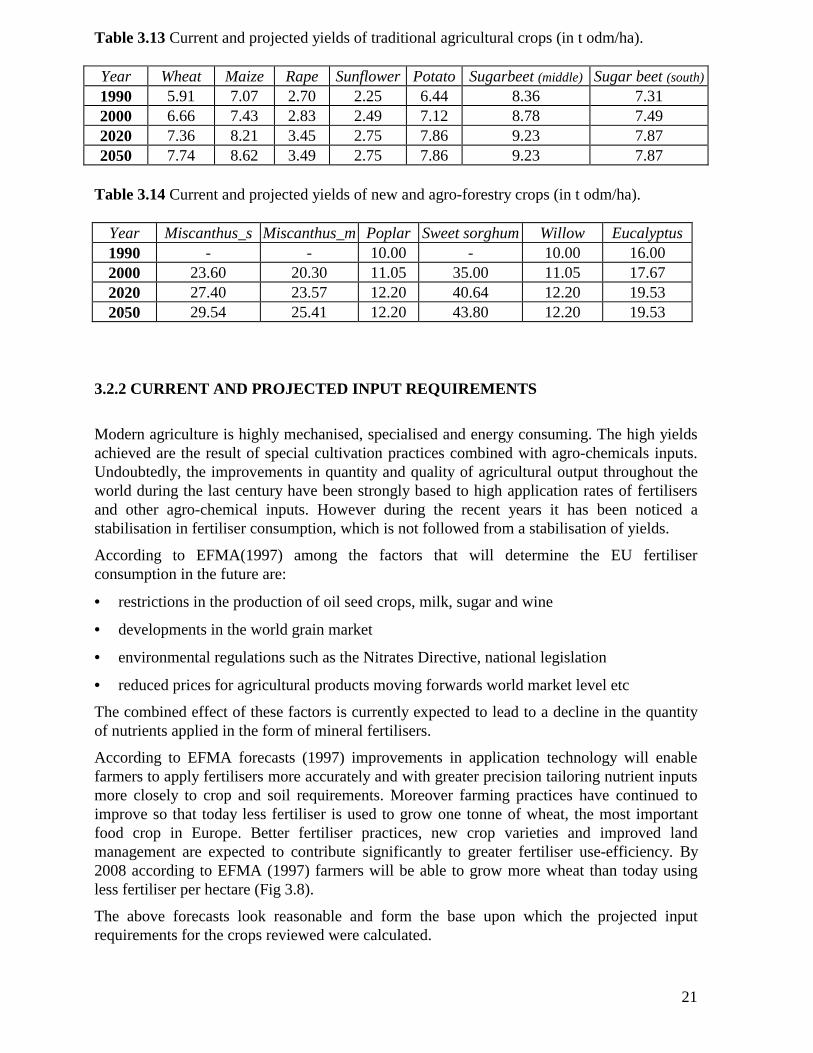
Table 3.13 Current and projected yields of traditional agricultural crops (in t odm/ha).
Year Wheat Maize Rape Sunflower Potato Sugarbeet (middle) Sugar beet (south)
1990 5.91 7.07 2.70 2.25 6.44 8.36 7.312000 6.66 7.43 2.83 2.49 7.12 8.78 7.492020 7.36 8.21 3.45 2.75 7.86 9.23 7.872050 7.74 8.62 3.49 2.75 7.86 9.23 7.87
Table 3.14 Current and projected yields of new and agro-forestry crops (in t odm/ha).
Year Miscanthus_s Miscanthus_m Poplar Sweet sorghum Willow Eucalyptus1990 - - 10.00 - 10.00 16.002000 23.60 20.30 11.05 35.00 11.05 17.672020 27.40 23.57 12.20 40.64 12.20 19.532050 29.54 25.41 12.20 43.80 12.20 19.53
3.2.2 CURRENT AND PROJECTED INPUT REQUIREMENTS
Modern agriculture is highly mechanised, specialised and energy consuming. The high yieldsachieved are the result of special cultivation practices combined with agro-chemicals inputs.Undoubtedly, the improvements in quantity and quality of agricultural output throughout theworld during the last century have been strongly based to high application rates of fertilisersand other agro-chemical inputs. However during the recent years it has been noticed astabilisation in fertiliser consumption, which is not followed from a stabilisation of yields.
According to EFMA(1997) among the factors that will determine the EU fertiliserconsumption in the future are:
• restrictions in the production of oil seed crops, milk, sugar and wine
• developments in the world grain market
• environmental regulations such as the Nitrates Directive, national legislation
• reduced prices for agricultural products moving forwards world market level etc
The combined effect of these factors is currently expected to lead to a decline in the quantityof nutrients applied in the form of mineral fertilisers.
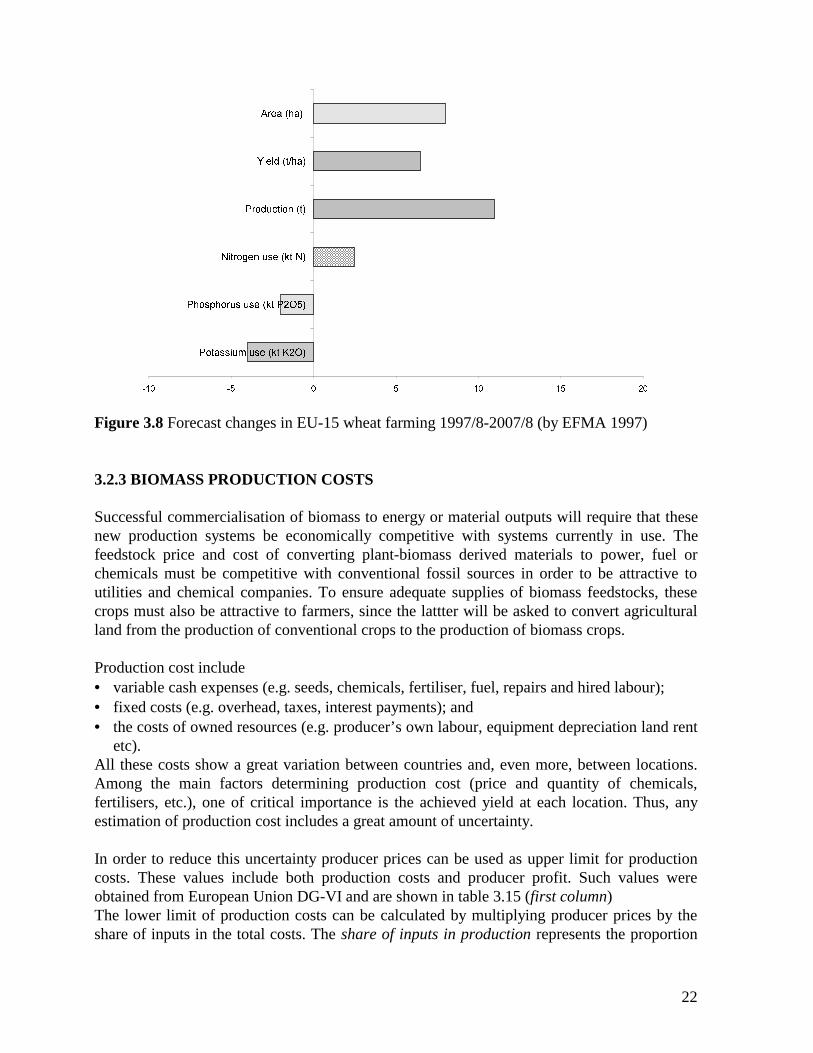
According to EFMA forecasts (1997) improvements in application technology will enablefarmers to apply fertilisers more accurately and with greater precision tailoring nutrient inputsmore closely to crop and soil requirements. Moreover farming practices have continued toimprove so that today less fertiliser is used to grow one tonne of wheat, the most importantfood crop in Europe. Better fertiliser practices, new crop varieties and improved landmanagement are expected to contribute significantly to greater fertiliser use-efficiency. By2008 according to EFMA (1997) farmers will be able to grow more wheat than today usingless fertiliser per hectare (Fig 3.8).
The above forecasts look reasonable and form the base upon which the projected inputrequirements for the crops reviewed were calculated.
22
��� �� � � �� �� ��
3RWDVVLXP XVH �NW .�2�
3KRVSKRUXV XVH �NW 3�2��
1LWURJHQ XVH �NW 1�
3URGXFWLRQ �W�
<LHOG �W�KD�
$UHD �KD�
Figure 3.8 Forecast changes in EU-15 wheat farming 1997/8-2007/8 (by EFMA 1997)
3.2.3 BIOMASS PRODUCTION COSTS
Successful commercialisation of biomass to energy or material outputs will require that thesenew production systems be economically competitive with systems currently in use. Thefeedstock price and cost of converting plant-biomass derived materials to power, fuel orchemicals must be competitive with conventional fossil sources in order to be attractive toutilities and chemical companies. To ensure adequate supplies of biomass feedstocks, thesecrops must also be attractive to farmers, since the lattter will be asked to convert agriculturalland from the production of conventional crops to the production of biomass crops.
Production cost include• variable cash expenses (e.g. seeds, chemicals, fertiliser, fuel, repairs and hired labour);• fixed costs (e.g. overhead, taxes, interest payments); and• the costs of owned resources (e.g. producer’s own labour, equipment depreciation land rent
etc).All these costs show a great variation between countries and, even more, between locations.Among the main factors determining production cost (price and quantity of chemicals,fertilisers, etc.), one of critical importance is the achieved yield at each location. Thus, anyestimation of production cost includes a great amount of uncertainty.
In order to reduce this uncertainty producer prices can be used as upper limit for productioncosts. These values include both production costs and producer profit. Such values wereobtained from European Union DG-VI and are shown in table 3.15 (first column)The lower limit of production costs can be calculated by multiplying producer prices by theshare of inputs in the total costs. The share of inputs in production represents the proportion
23
of all the inputs required for growing a crop (i.e. fertilisers, chemicals, diesel, labour etc). Thelower limit for the production costs is shown in table 3.15 (second column)The values in MARKAL datasheets are based on the production costs and do not include theseinputs as far as they are described in physical units.
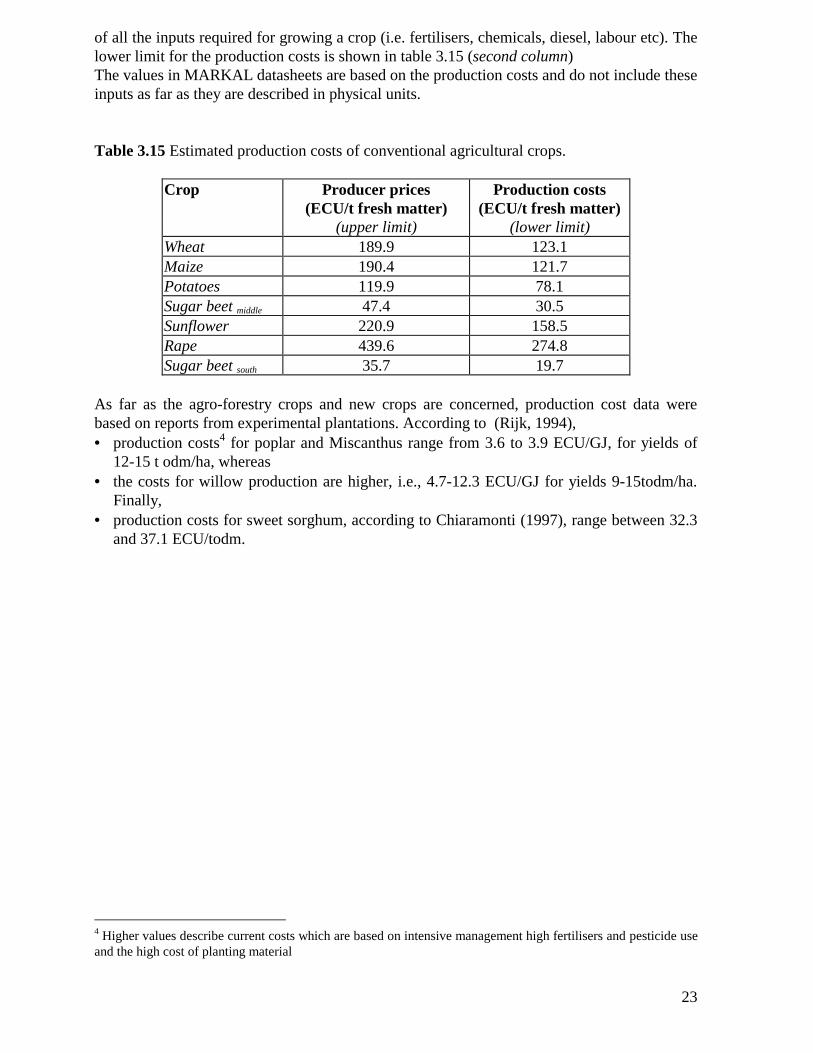
Table 3.15 Estimated production costs of conventional agricultural crops.
Crop Producer prices(ECU/t fresh matter)
Production costs(ECU/t fresh matter)
(upper limit) (lower limit)Wheat 189.9 123.1Maize 190.4 121.7Potatoes 119.9 78.1Sugar beet middle 47.4 30.5Sunflower 220.9 158.5Rape 439.6 274.8Sugar beet south 35.7 19.7
As far as the agro-forestry crops and new crops are concerned, production cost data werebased on reports from experimental plantations. According to (Rijk, 1994),• production costs4 for poplar and Miscanthus range from 3.6 to 3.9 ECU/GJ, for yields of
12-15 t odm/ha, whereas• the costs for willow production are higher, i.e., 4.7-12.3 ECU/GJ for yields 9-15todm/ha.
Finally,• production costs for sweet sorghum, according to Chiaramonti (1997), range between 32.3
and 37.1 ECU/todm.
4 Higher values describe current costs which are based on intensive management high fertilisers and pesticide useand the high cost of planting material
24
4. DISCUSSION
One of the main objectives of the Common Agricultural Policy reform, that took place in1992, was “to protect the environment and develop the natural potential of the countryside”.Environmental protection should not only include local or regional aspects, like soil erosionand groundwater contamination from fertilisers leaching, but even global aspects likegreenhouse effect mitigation. Agriculture can play an active role in greenhouse gases emissionreduction, since the derived new products of agricultural activities can act either as CO2 sinksor as substitutes of fossil fuels.
Since European agricultural land sources are limited, they must be optimally allocated to,both, old and new uses in order to ensure the production of adequate quantities of foodproducts, while protecting the environment at local and regional level, and to produce severalnon-food products, especially novel ones, which will contribute to the net reduction of CO2
emissions.
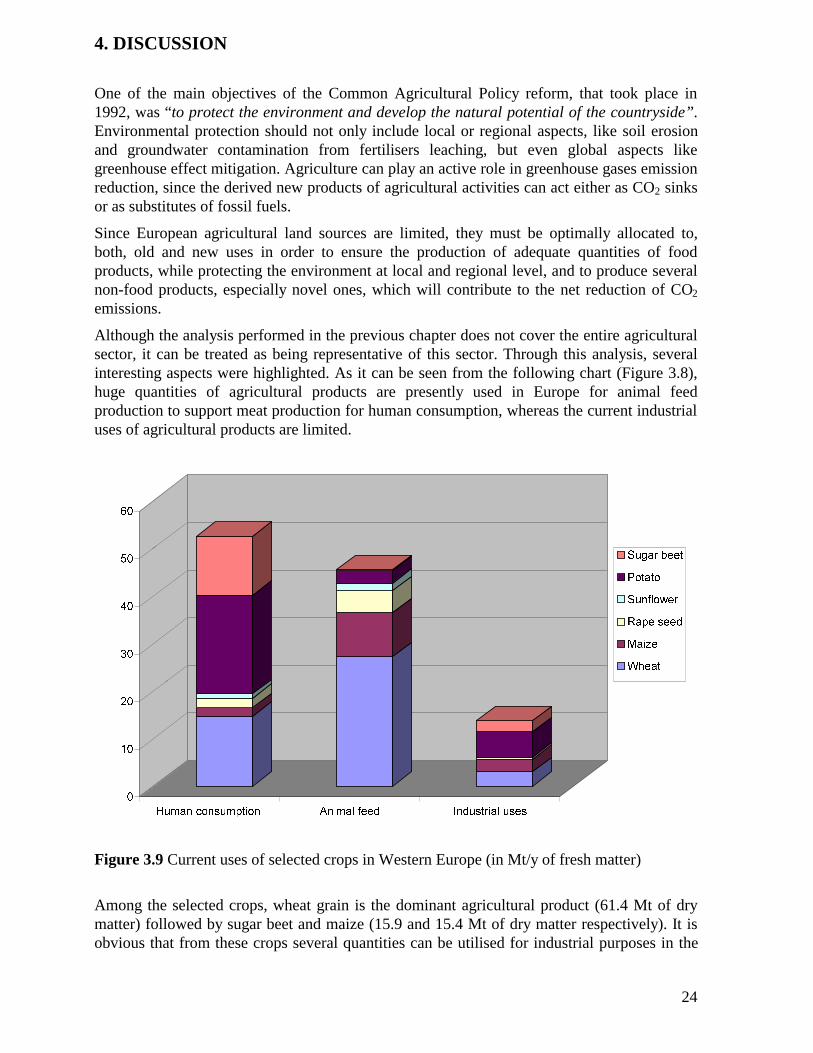
Although the analysis performed in the previous chapter does not cover the entire agriculturalsector, it can be treated as being representative of this sector. Through this analysis, severalinteresting aspects were highlighted. As it can be seen from the following chart (Figure 3.8),huge quantities of agricultural products are presently used in Europe for animal feedproduction to support meat production for human consumption, whereas the current industrialuses of agricultural products are limited.
�
��
��
��
��
��
��
+XPDQ FRQVXPSWLRQ $QLPDO IHHG ,QGXVWULDO XVHV
6XJDU EHHW
3RWDWR
6XQIORZHU
5DSH VHHG
0DL]H
:KHDW
Figure 3.9 Current uses of selected crops in Western Europe (in Mt/y of fresh matter)
Among the selected crops, wheat grain is the dominant agricultural product (61.4 Mt of drymatter) followed by sugar beet and maize (15.9 and 15.4 Mt of dry matter respectively). It isobvious that from these crops several quantities can be utilised for industrial purposes in the

25
following years. Additionally, agro-residues constitute another major source of biomass (76.6M odt/y) for industrial purposes.
26
5. REFERENCES
Bao, M., et. al., (1992) Preliminary research of experimental cultura of M. sinensis inGalicia. In Hall, D.O. et. al. (eds.) Biomass for Energy and Industry, Ponte Press Bochum,Bassam, N.El. (1998) Energy Plant Species. Their use and impact on environment anddevelopment. James & James Ltd., London.
Bonduelle, et. al. (1996) Short rotation poplar coppice, a common approach to producepulpwood and fuelwood. In: Biomass for Energy and the Environment. Proceedings of the 9th
European Bioenergy Conference Eds.: Chartier, R., et. al. Pergamon Press, Oxford, UK pp.712-714.
Briggle, L.W. (1980) Introduction to energy use in wheat production p.109-116 In: Pimenter,D. (ed.), handbook of energy utilisation in agriculture. CRC Press, Inc. Boca Raton, FL.
Chiaramonti, D & Taviani M. (1997) Small scale combined heat and power through sweetsorghum crop. In: Proceedings of the 1st International sweet sorghum conference. Ed: DajueLi, pp. 614-622.
Curt M. D., et. al. 1996. Effect of nitrogen fertilisation on biomass production andmacronutrients extraction of sweet sorghum cv. Keller. In: Biomass for Energy and theEnvironment. Proceedings of the 9th European Bioenergy Conference Eds.: Chartier, R., et. al.Pergamon Press, Oxford, UK pp. 473-478.
Dalianis C., et. al.1996. Very short rotation and dense eucalypt plantations for energy In:Biomass for energy and the environment. Proceedings of the 9th European BioenergyConference. Eds.: Chartier, R., et. al. Pergamon Press, Oxford, UK pp.725-732.
Dalianis, C. (1997) Productivity, sugar yields, ethanol potential and bottlenecks of sweetsorghum in European Union In: Proceedings of the 1st International sweet sorghumconference. Ed: Dajue Li, pp. 65-79.
Dalianis, C. et. al. (1996) Comparative studies of fiber and sweet sorghum. In: Biomass forEnergy and the Environment. Proceedings of the 9th European Bioenergy Conference Eds.:Chartier, R., et. al. Pergamon Press, Oxford, UK pp. 577-581.
Dercas, N. et. al. (1996) Water and nitrogen effects on sweet sorghum growth andproductivity. In: Biomass for energy and the environment. Proceedings of the 9th EuropeanBioenergy Conference Eds.: Chartier, R., et. al. Pergamon Press, Oxford, UK pp. 54-60.Duke, J.A. (1983) Handbook of energy crops. Unpublished. At:http://www.purdue.edu/newcrop/duke_energy/ (20/6/1998).
European Fertiliser Manufacturers Association (EFMA) (1997). Forecast of Food, Farmingand Fertiliser Use to 2008.
European Fertiliser Manufacturers Association (EFMA) (1997). The fertiliser industry of theEuropean Union – The issues of today, the outlook for tomorrow.
European Commission (1997) Situation and Outlook - Cereals, Oilseeds and Protein Crops.European Commission Directorate General for Agriculture (DG VI).
Food and Agriculture Organisation. FAOSTAT database collection At: http://apps.fao.org/
Foster C., & Matthews R., 1994 Assessing the energy yield and carbon reduction potential ofshort rotation coppice fuelwood. In: Biomass foe energy, Environment, Agriculture andIndustry. Proceedings of the 8th EC Conference Eds.: Chartier Ph., et. al. (editors).
27
Gosse, G. (1996) Lignocellulosic energy crops in different agricultural scenarios - technicalevaluation, energetic evaluation and environmental assessment European Commission, DGXII, Luxembourg.
Graef, M. et. al. (1994) Fuel from sugar beet and rape seed oil - Mass and energy balancesfor evaluation. In: Biomass for Energy, Environment, Agriculture and Industry. Proceedingsof the 8th European Bioenergy Conference Eds. Chartier, R., et. al. Pergamon Press, Oxford,UK pp. 1159-1164.
Grassi G., 1997. Sweet Sorghum promising industrial crop: a global view In: Proceedings ofthe 1st International Sweet Sorghum Conference. Ed: Dajue Li, pp.132-142.
Halley, R.J (1983). The Agricultural Notebook 17th Edition. Butterworths.
Harris G. (1998) An analysis of global fertiliser application rates for major crops. Paperpresent at IFA annual conference, Toronto.
Hughes, E.E. and Wiltsee, G.A. (1995) Comparative evaluation of fuel costs from energycrops. In Proceedings Second Biomass Conference of the Americas, Portland, pp.1291-1301.
Johansson, H. et. al. (1992) Practical energy forestry in Sweden: A commercial alternative forfarmers. In Hall, D.O. et. al. (eds.) Biomass for Energy and Industry, Ponte Press Bochum, pp.117-26.
Jorgensen, U. (1996) Miscanthus yields in Denmark. In: Biomass for Energy and theEnvironment. Proceedings of the 9th European Bioenergy Conference Eds.: Chartier, R., et. al.Pergamon Press, Oxford, UK pp. 48-53.
Interactive European Network for Industrial Crops and their Applications (IENICA) (1998)Crops database.
Kuiper L.C. & Kolster H.W. Twenty years on poplar biomass production in the Netherlands.In: Biomass for Energy and the Environment. Proceedings of the 9th European BioenergyConference Eds. Chartier, R., et. al. Pergamon Press, Oxford, UK pp. 96-102.
Losavio, N et.al. (1994) Sweet sorghum in the Mediterranean region: Productivity and wateruse efficiency. In: Biomass for Energy, Environment, Agriculture and Industry. Proceedings ofthe 8th European Bioenergy Conference Eds. Chartier, R., et. al. Pergamon Press, Oxford, UKpp. 640-645.
Martin et. al., (1976). Principles of field production. 3rd Edition, Macmillan Publishing Co.,New York, 1976.
McCarthy, S. & Mooney, M. (1994) European Miscanthus Network In: Biomass for Energy,Environment, Agriculture and Industry. Proceedings of the 8th EC Conference Eds.: ChartierPh., et. al. Pergamon Press, Oxford, UK pp. 380-388.
Mitchell, C.P., et.al. (1995). Technoeconomic assessment of biomass to energy. Biomass andBioenergy, Vol. 9, 205-226.
Pereira, H. et. al. (1996). Eucalypt plantations for production of raw material for industry andenergy in Europe In: Biomass for energy and the environment. Proceedings of the 9th
European Bioenergy Conference Eds.: Chartier, R., et. al. pp. 84-89.
Rexen, F. and Munck, L. (1984) Cereal crops for industrial use in Europe. Report prepared forthe commission of the European Communities. Luxembourg, 1984.
Salunkhe, D.K. et. al. (1992) World oilseeds: Chemistry, Technology and Utilisation. VanNostrand publications, New York, 1992.
Smith, N.O. et. al. (1997). Crops for industry and energy in Europe. European Commission,DG XIIE-2 Agro-Industrial Research Unit, Luxembourg.
28
Spirinckx, C. & Ceuterick, D. (1996). Comparative LCA of diesel and biodiesel. In:Proceedings of the International Conference on application of Life Cycle Assessment inagriculture, food and non-food agro-industry and forestry: Achievements and prospects Ed:Ceuterick D., Brussels, 1996.
Strauss, C.H. and Wright, L. (1990) Woody biomass production costs in the United States: aneconomic summary of commercial poplar plantation systems. Solar Energy, Vol. 45, No. 2,Pergamon Press Inc.Rexen, F. (1998). National co-ordinator for Interactive European Network for IndustrialCrops and their Applications (IENICA) in Denmark. Personal communication (October,1998).
Rijk P., (1994) The costs and benefits of willow (Salix) in short rotation for niche energymarkets in the Netherlands, Agricultural Economics Institute, the Hague, 1994.
29
ANNEX 1. Crop yield projectionYield variation during the period 1975-1995
WHEAT MAIZE RAPESEED SUNFLOWER POTATO SUGARBEET _M SUGAR BEET_S
Yield IR% Yield IR% Yield IR% Yield IR% Yield IR% Yield IR%
1975 4.13 5.72 2.06 1.84 27.17 40.90 47.40
1980 5.06 4.50% 5.72 -0.01% 2.93 8.45% 2.31 5.11% 29.67 1.84% 45.30 2.15% 45.70 -0.72%
1985 5.99 3.68% 7.89 7.59% 2.97 0.27% 2.22 -0.78% 33.82 2.80% 49.20 1.72% 47.10 0.61%
1990 6.57 1.94% 7.85 -0.10% 2.99 0.13% 2.50 2.52% 32.22 -0.95% 55.70 2.64% 48.70 0.68%
1995 7.03 1.40% 8.02 0.43% 3.28 1.94% 2.12 -3.04% 34.62 1.49% 54.50 -0.43% 49.50 0.33%
2.88% 1.98% 2.70% 0.95% 1.30% 1.52% 0.23%
Assumptions for yield projectionsPeriod WHEAT MAIZE RAPESEED SUNFLOWER POTATO SUGARBEET _M SUGAR BEET_S
1990-2000 1.40% 0.50% 0.50% 1.00% 1.00% 0.50% 0.25%
2000-2020 1.00%5 0.50%6 1.00% 0.50% 0.50% 0.25% 0.25%
2020-2050 0.00% 0.00% 0.00% 0.00% 0.00% 0.00% 0.00%
Period MISCANTHUS S. SORGHUM POPLAR WILLOW EUCALYPTUS
1990-2000 - - 1.00% 1.00% 1.00%
2000-2020 0.75% 0.75% 0.50% 0.50% 0.50%
2020-2050 0.25% 0.25% 0.00% 0.00% 0.00% 5 until year 20306 until year 2030

30
ANNEX 2.
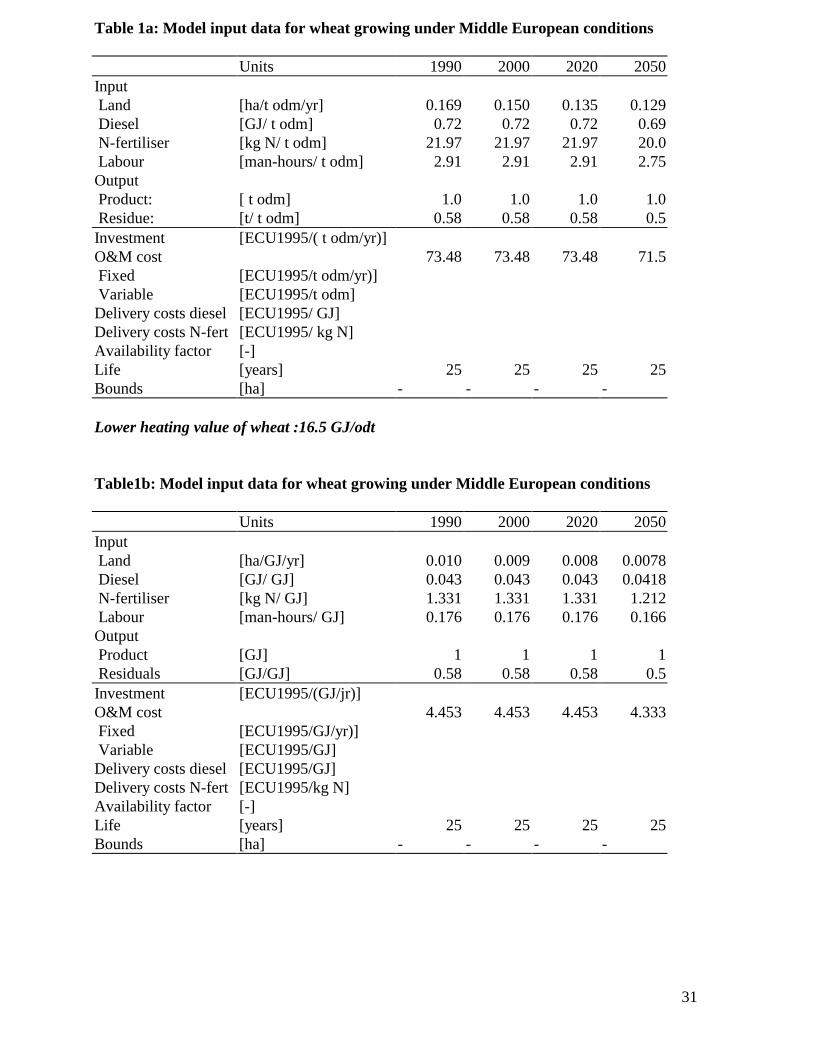
MARKAL DATASHEETS
31
Table 1a: Model input data for wheat growing under Middle European conditions
Units 1990 2000 2020 2050Input Land [ha/t odm/yr] 0.169 0.150 0.135 0.129 Diesel [GJ/ t odm] 0.72 0.72 0.72 0.69 N-fertiliser [kg N/ t odm] 21.97 21.97 21.97 20.0 Labour [man-hours/ t odm] 2.91 2.91 2.91 2.75Output Product: [ t odm] 1.0 1.0 1.0 1.0 Residue: [t/ t odm] 0.58 0.58 0.58 0.5Investment [ECU1995/( t odm/yr)]O&M cost 73.48 73.48 73.48 71.5 Fixed [ECU1995/t odm/yr)] Variable [ECU1995/t odm]Delivery costs diesel [ECU1995/ GJ]Delivery costs N-fert [ECU1995/ kg N]Availability factor [-]Life [years] 25 25 25 25Bounds [ha] - - - -
Lower heating value of wheat :16.5 GJ/odt
Table1b: Model input data for wheat growing under Middle European conditions
Units 1990 2000 2020 2050Input Land [ha/GJ/yr] 0.010 0.009 0.008 0.0078 Diesel [GJ/ GJ] 0.043 0.043 0.043 0.0418 N-fertiliser [kg N/ GJ] 1.331 1.331 1.331 1.212 Labour [man-hours/ GJ] 0.176 0.176 0.176 0.166Output Product [GJ] 1 1 1 1 Residuals [GJ/GJ] 0.58 0.58 0.58 0.5Investment [ECU1995/(GJ/jr)]O&M cost 4.453 4.453 4.453 4.333 Fixed [ECU1995/GJ/yr)] Variable [ECU1995/GJ]Delivery costs diesel [ECU1995/GJ]Delivery costs N-fert [ECU1995/kg N]Availability factor [-]Life [years] 25 25 25 25Bounds [ha] - - - -
32
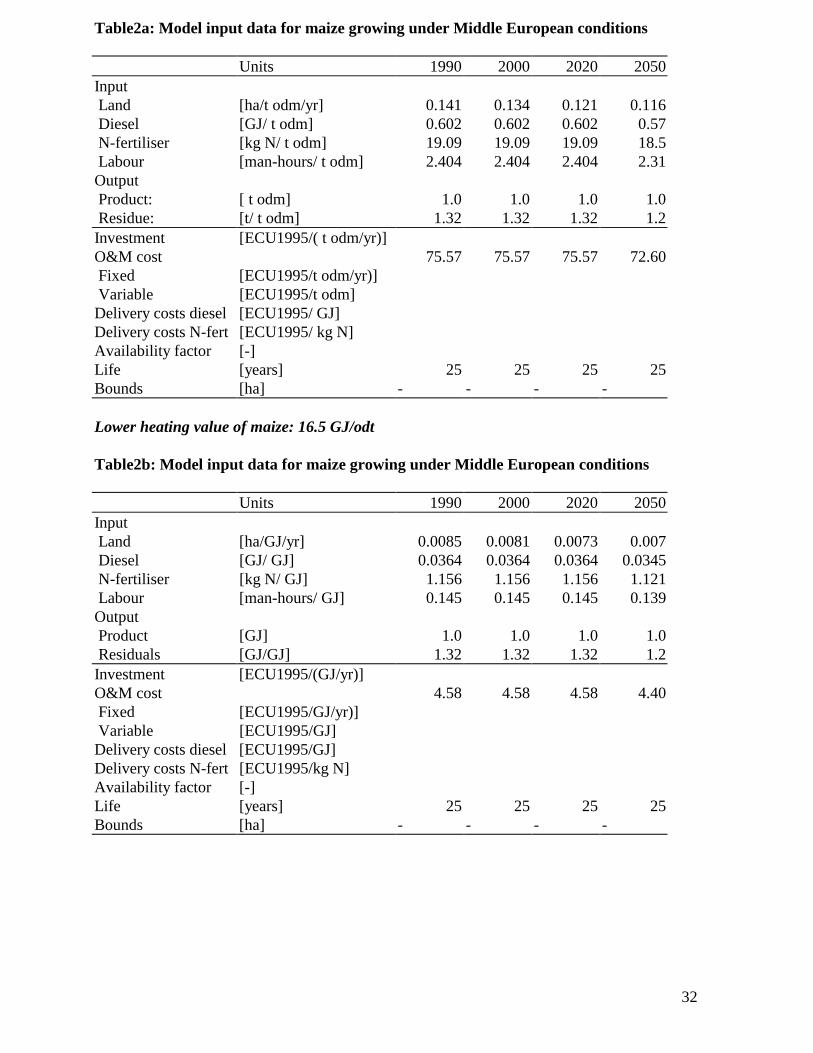
Table2a: Model input data for maize growing under Middle European conditions
Units 1990 2000 2020 2050Input Land [ha/t odm/yr] 0.141 0.134 0.121 0.116 Diesel [GJ/ t odm] 0.602 0.602 0.602 0.57 N-fertiliser [kg N/ t odm] 19.09 19.09 19.09 18.5 Labour [man-hours/ t odm] 2.404 2.404 2.404 2.31Output Product: [ t odm] 1.0 1.0 1.0 1.0 Residue: [t/ t odm] 1.32 1.32 1.32 1.2Investment [ECU1995/( t odm/yr)]O&M cost 75.57 75.57 75.57 72.60 Fixed [ECU1995/t odm/yr)] Variable [ECU1995/t odm]Delivery costs diesel [ECU1995/ GJ]Delivery costs N-fert [ECU1995/ kg N]Availability factor [-]Life [years] 25 25 25 25Bounds [ha] - - - -
Lower heating value of maize: 16.5 GJ/odt
Table2b: Model input data for maize growing under Middle European conditions
Units 1990 2000 2020 2050Input Land [ha/GJ/yr] 0.0085 0.0081 0.0073 0.007 Diesel [GJ/ GJ] 0.0364 0.0364 0.0364 0.0345 N-fertiliser [kg N/ GJ] 1.156 1.156 1.156 1.121 Labour [man-hours/ GJ] 0.145 0.145 0.145 0.139Output Product [GJ] 1.0 1.0 1.0 1.0 Residuals [GJ/GJ] 1.32 1.32 1.32 1.2Investment [ECU1995/(GJ/yr)]O&M cost 4.58 4.58 4.58 4.40 Fixed [ECU1995/GJ/yr)] Variable [ECU1995/GJ]Delivery costs diesel [ECU1995/GJ]Delivery costs N-fert [ECU1995/kg N]Availability factor [-]Life [years] 25 25 25 25Bounds [ha] - - - -
33
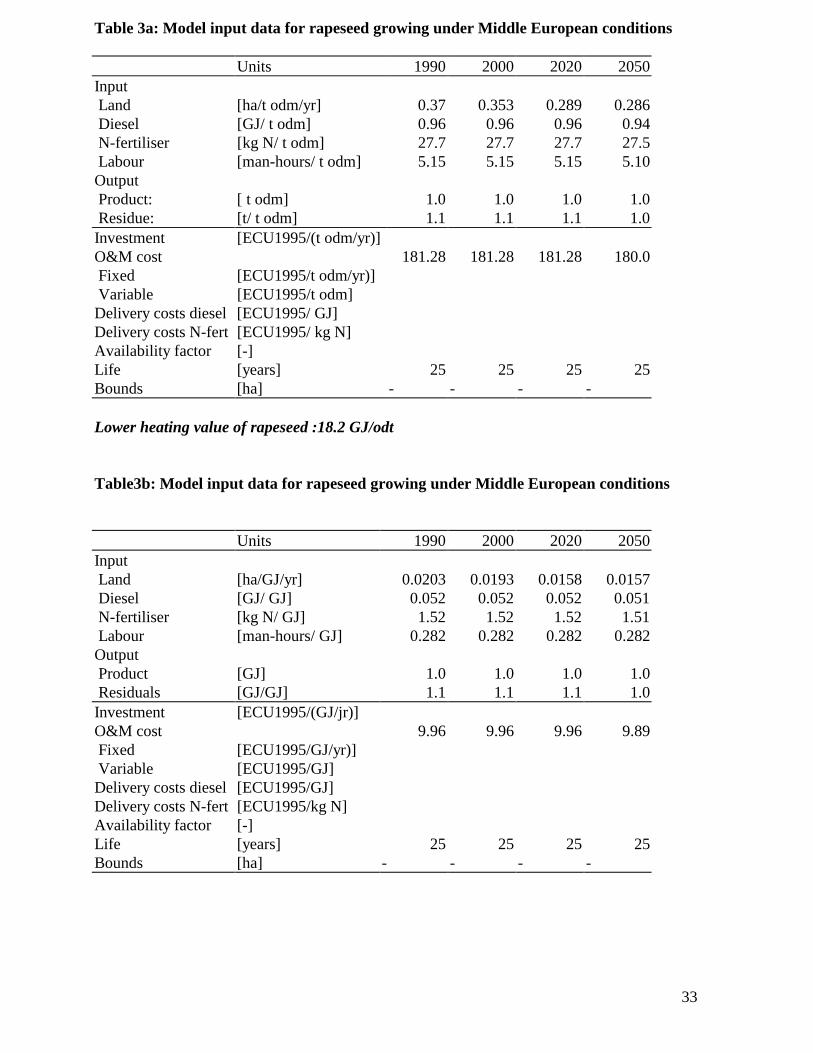
Table 3a: Model input data for rapeseed growing under Middle European conditions
Units 1990 2000 2020 2050Input Land [ha/t odm/yr] 0.37 0.353 0.289 0.286 Diesel [GJ/ t odm] 0.96 0.96 0.96 0.94 N-fertiliser [kg N/ t odm] 27.7 27.7 27.7 27.5 Labour [man-hours/ t odm] 5.15 5.15 5.15 5.10Output Product: [ t odm] 1.0 1.0 1.0 1.0 Residue: [t/ t odm] 1.1 1.1 1.1 1.0Investment [ECU1995/(t odm/yr)]O&M cost 181.28 181.28 181.28 180.0 Fixed [ECU1995/t odm/yr)] Variable [ECU1995/t odm]Delivery costs diesel [ECU1995/ GJ]Delivery costs N-fert [ECU1995/ kg N]Availability factor [-]Life [years] 25 25 25 25Bounds [ha] - - - -
Lower heating value of rapeseed :18.2 GJ/odt
Table3b: Model input data for rapeseed growing under Middle European conditions
Units 1990 2000 2020 2050Input Land [ha/GJ/yr] 0.0203 0.0193 0.0158 0.0157 Diesel [GJ/ GJ] 0.052 0.052 0.052 0.051 N-fertiliser [kg N/ GJ] 1.52 1.52 1.52 1.51 Labour [man-hours/ GJ] 0.282 0.282 0.282 0.282Output Product [GJ] 1.0 1.0 1.0 1.0 Residuals [GJ/GJ] 1.1 1.1 1.1 1.0Investment [ECU1995/(GJ/jr)]O&M cost 9.96 9.96 9.96 9.89 Fixed [ECU1995/GJ/yr)] Variable [ECU1995/GJ]Delivery costs diesel [ECU1995/GJ]Delivery costs N-fert [ECU1995/kg N]Availability factor [-]Life [years] 25 25 25 25Bounds [ha] - - - -
34
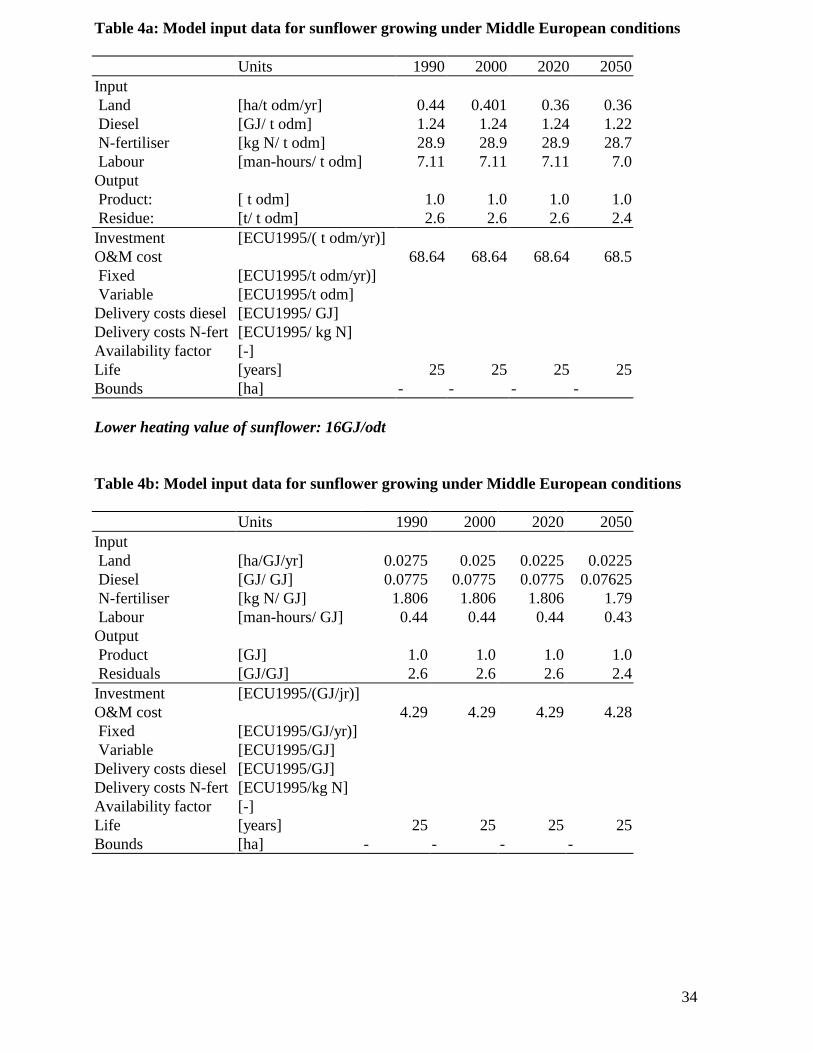
Table 4a: Model input data for sunflower growing under Middle European conditions
Units 1990 2000 2020 2050Input Land [ha/t odm/yr] 0.44 0.401 0.36 0.36 Diesel [GJ/ t odm] 1.24 1.24 1.24 1.22 N-fertiliser [kg N/ t odm] 28.9 28.9 28.9 28.7 Labour [man-hours/ t odm] 7.11 7.11 7.11 7.0Output Product: [ t odm] 1.0 1.0 1.0 1.0 Residue: [t/ t odm] 2.6 2.6 2.6 2.4Investment [ECU1995/( t odm/yr)]O&M cost 68.64 68.64 68.64 68.5 Fixed [ECU1995/t odm/yr)] Variable [ECU1995/t odm]Delivery costs diesel [ECU1995/ GJ]Delivery costs N-fert [ECU1995/ kg N]Availability factor [-]Life [years] 25 25 25 25Bounds [ha] - - - -
Lower heating value of sunflower: 16GJ/odt
Table 4b: Model input data for sunflower growing under Middle European conditions
Units 1990 2000 2020 2050Input Land [ha/GJ/yr] 0.0275 0.025 0.0225 0.0225 Diesel [GJ/ GJ] 0.0775 0.0775 0.0775 0.07625 N-fertiliser [kg N/ GJ] 1.806 1.806 1.806 1.79 Labour [man-hours/ GJ] 0.44 0.44 0.44 0.43Output Product [GJ] 1.0 1.0 1.0 1.0 Residuals [GJ/GJ] 2.6 2.6 2.6 2.4Investment [ECU1995/(GJ/jr)]O&M cost 4.29 4.29 4.29 4.28 Fixed [ECU1995/GJ/yr)] Variable [ECU1995/GJ]Delivery costs diesel [ECU1995/GJ]Delivery costs N-fert [ECU1995/kg N]Availability factor [-]Life [years] 25 25 25 25Bounds [ha] - - - -
35
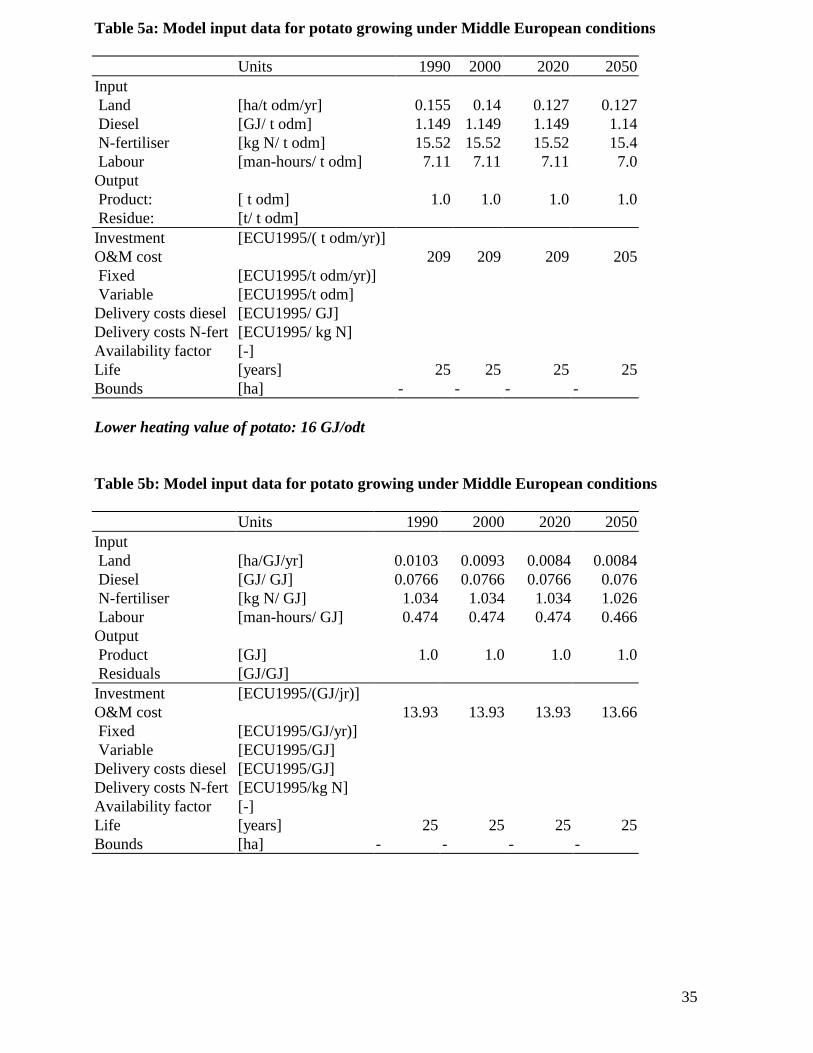
Table 5a: Model input data for potato growing under Middle European conditions
Units 1990 2000 2020 2050Input Land [ha/t odm/yr] 0.155 0.14 0.127 0.127 Diesel [GJ/ t odm] 1.149 1.149 1.149 1.14 N-fertiliser [kg N/ t odm] 15.52 15.52 15.52 15.4 Labour [man-hours/ t odm] 7.11 7.11 7.11 7.0Output Product: [ t odm] 1.0 1.0 1.0 1.0 Residue: [t/ t odm]Investment [ECU1995/( t odm/yr)]O&M cost 209 209 209 205 Fixed [ECU1995/t odm/yr)] Variable [ECU1995/t odm]Delivery costs diesel [ECU1995/ GJ]Delivery costs N-fert [ECU1995/ kg N]Availability factor [-]Life [years] 25 25 25 25Bounds [ha] - - - -
Lower heating value of potato: 16 GJ/odt
Table 5b: Model input data for potato growing under Middle European conditions
Units 1990 2000 2020 2050Input Land [ha/GJ/yr] 0.0103 0.0093 0.0084 0.0084 Diesel [GJ/ GJ] 0.0766 0.0766 0.0766 0.076 N-fertiliser [kg N/ GJ] 1.034 1.034 1.034 1.026 Labour [man-hours/ GJ] 0.474 0.474 0.474 0.466Output Product [GJ] 1.0 1.0 1.0 1.0 Residuals [GJ/GJ]Investment [ECU1995/(GJ/jr)]O&M cost 13.93 13.93 13.93 13.66 Fixed [ECU1995/GJ/yr)] Variable [ECU1995/GJ]Delivery costs diesel [ECU1995/GJ]Delivery costs N-fert [ECU1995/kg N]Availability factor [-]Life [years] 25 25 25 25Bounds [ha] - - - -
36
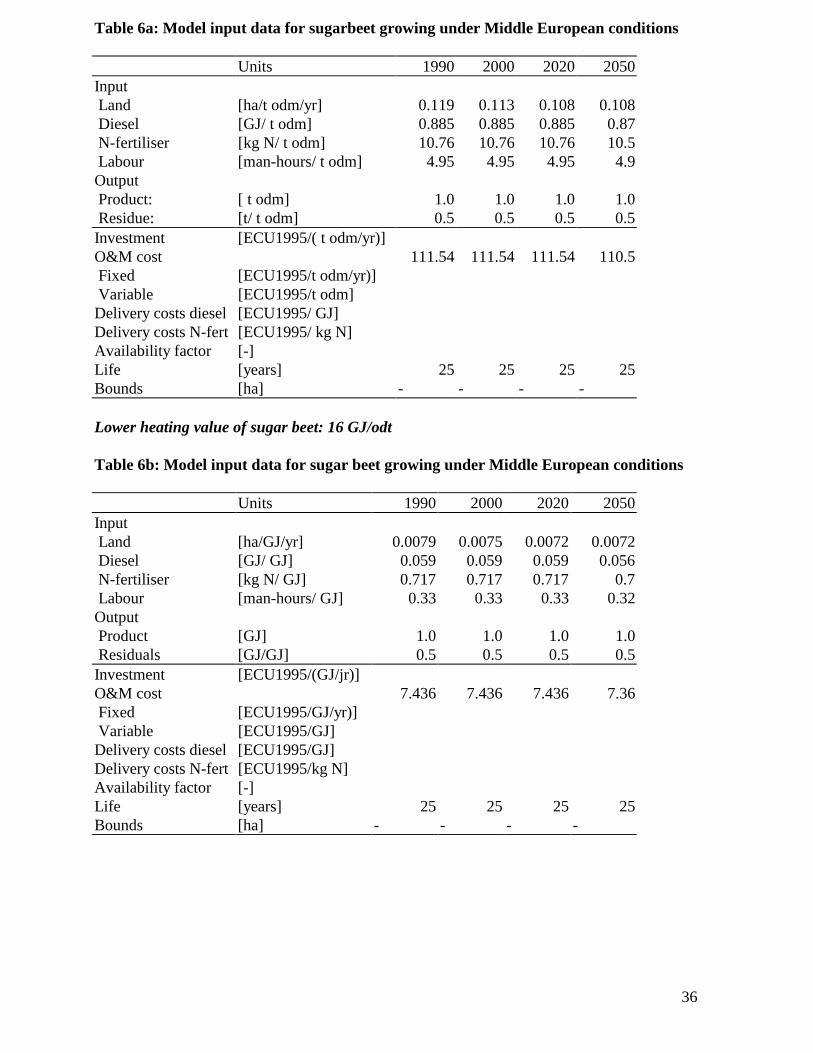
Table 6a: Model input data for sugarbeet growing under Middle European conditions
Units 1990 2000 2020 2050Input Land [ha/t odm/yr] 0.119 0.113 0.108 0.108 Diesel [GJ/ t odm] 0.885 0.885 0.885 0.87 N-fertiliser [kg N/ t odm] 10.76 10.76 10.76 10.5 Labour [man-hours/ t odm] 4.95 4.95 4.95 4.9Output Product: [ t odm] 1.0 1.0 1.0 1.0 Residue: [t/ t odm] 0.5 0.5 0.5 0.5Investment [ECU1995/( t odm/yr)]O&M cost 111.54 111.54 111.54 110.5 Fixed [ECU1995/t odm/yr)] Variable [ECU1995/t odm]Delivery costs diesel [ECU1995/ GJ]Delivery costs N-fert [ECU1995/ kg N]Availability factor [-]Life [years] 25 25 25 25Bounds [ha] - - - -
Lower heating value of sugar beet: 16 GJ/odt
Table 6b: Model input data for sugar beet growing under Middle European conditions
Units 1990 2000 2020 2050Input Land [ha/GJ/yr] 0.0079 0.0075 0.0072 0.0072 Diesel [GJ/ GJ] 0.059 0.059 0.059 0.056 N-fertiliser [kg N/ GJ] 0.717 0.717 0.717 0.7 Labour [man-hours/ GJ] 0.33 0.33 0.33 0.32Output Product [GJ] 1.0 1.0 1.0 1.0 Residuals [GJ/GJ] 0.5 0.5 0.5 0.5Investment [ECU1995/(GJ/jr)]O&M cost 7.436 7.436 7.436 7.36 Fixed [ECU1995/GJ/yr)] Variable [ECU1995/GJ]Delivery costs diesel [ECU1995/GJ]Delivery costs N-fert [ECU1995/kg N]Availability factor [-]Life [years] 25 25 25 25Bounds [ha] - - - -
37
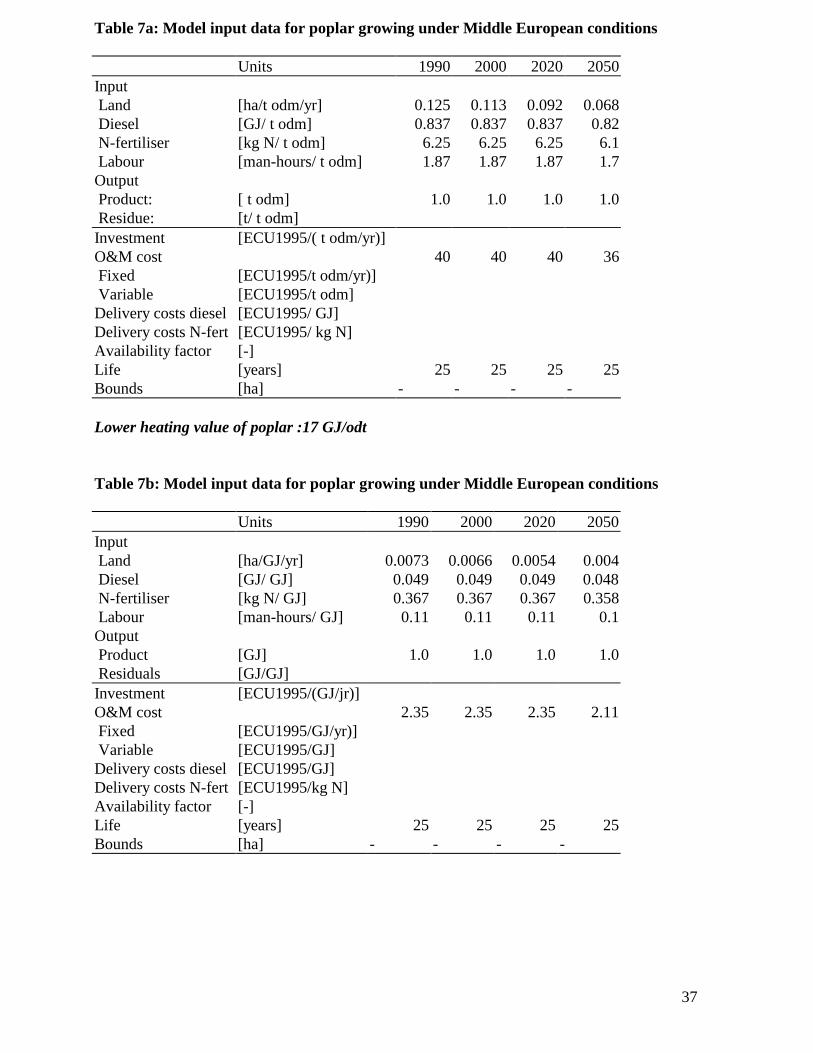
Table 7a: Model input data for poplar growing under Middle European conditions
Units 1990 2000 2020 2050Input Land [ha/t odm/yr] 0.125 0.113 0.092 0.068 Diesel [GJ/ t odm] 0.837 0.837 0.837 0.82 N-fertiliser [kg N/ t odm] 6.25 6.25 6.25 6.1 Labour [man-hours/ t odm] 1.87 1.87 1.87 1.7Output Product: [ t odm] 1.0 1.0 1.0 1.0 Residue: [t/ t odm]Investment [ECU1995/( t odm/yr)]O&M cost 40 40 40 36 Fixed [ECU1995/t odm/yr)] Variable [ECU1995/t odm]Delivery costs diesel [ECU1995/ GJ]Delivery costs N-fert [ECU1995/ kg N]Availability factor [-]Life [years] 25 25 25 25Bounds [ha] - - - -
Lower heating value of poplar :17 GJ/odt
Table 7b: Model input data for poplar growing under Middle European conditions
Units 1990 2000 2020 2050Input Land [ha/GJ/yr] 0.0073 0.0066 0.0054 0.004 Diesel [GJ/ GJ] 0.049 0.049 0.049 0.048 N-fertiliser [kg N/ GJ] 0.367 0.367 0.367 0.358 Labour [man-hours/ GJ] 0.11 0.11 0.11 0.1Output Product [GJ] 1.0 1.0 1.0 1.0 Residuals [GJ/GJ]Investment [ECU1995/(GJ/jr)]O&M cost 2.35 2.35 2.35 2.11 Fixed [ECU1995/GJ/yr)] Variable [ECU1995/GJ]Delivery costs diesel [ECU1995/GJ]Delivery costs N-fert [ECU1995/kg N]Availability factor [-]Life [years] 25 25 25 25Bounds [ha] - - - -
38
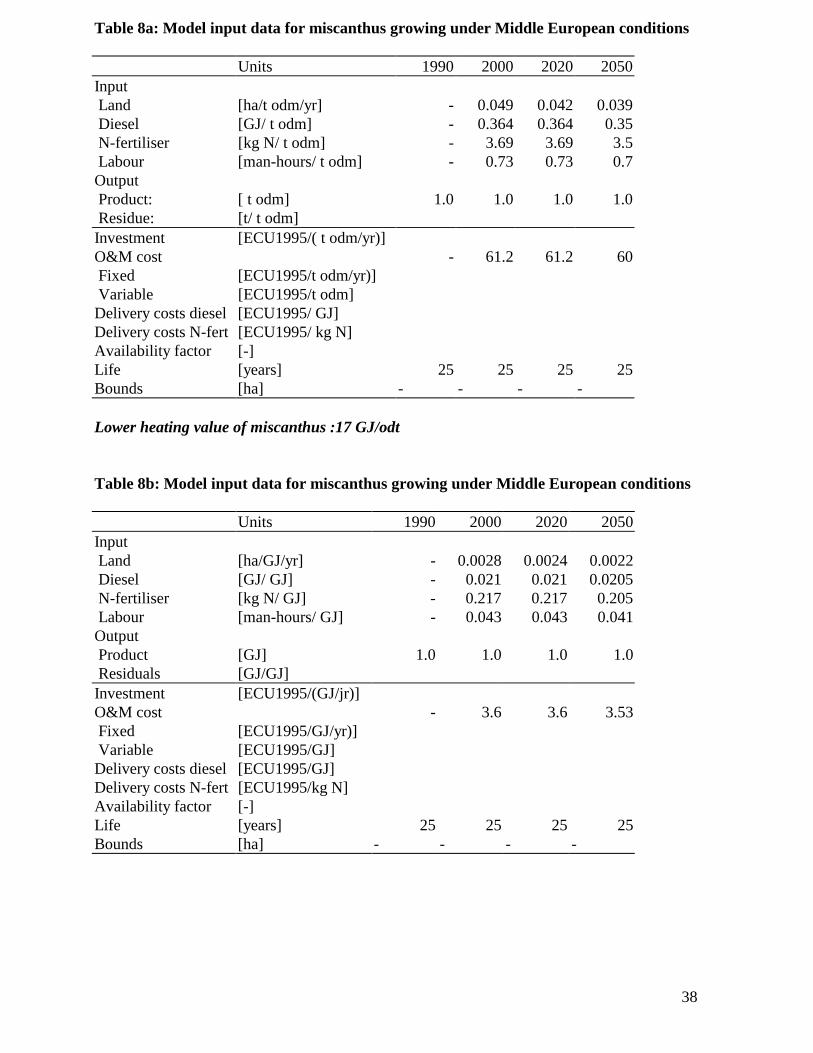
Table 8a: Model input data for miscanthus growing under Middle European conditions
Units 1990 2000 2020 2050Input Land [ha/t odm/yr] - 0.049 0.042 0.039 Diesel [GJ/ t odm] - 0.364 0.364 0.35 N-fertiliser [kg N/ t odm] - 3.69 3.69 3.5 Labour [man-hours/ t odm] - 0.73 0.73 0.7Output Product: [ t odm] 1.0 1.0 1.0 1.0 Residue: [t/ t odm]Investment [ECU1995/( t odm/yr)]O&M cost - 61.2 61.2 60 Fixed [ECU1995/t odm/yr)] Variable [ECU1995/t odm]Delivery costs diesel [ECU1995/ GJ]Delivery costs N-fert [ECU1995/ kg N]Availability factor [-]Life [years] 25 25 25 25Bounds [ha] - - - -
Lower heating value of miscanthus :17 GJ/odt
Table 8b: Model input data for miscanthus growing under Middle European conditions
Units 1990 2000 2020 2050Input Land [ha/GJ/yr] - 0.0028 0.0024 0.0022 Diesel [GJ/ GJ] - 0.021 0.021 0.0205 N-fertiliser [kg N/ GJ] - 0.217 0.217 0.205 Labour [man-hours/ GJ] - 0.043 0.043 0.041Output Product [GJ] 1.0 1.0 1.0 1.0 Residuals [GJ/GJ]Investment [ECU1995/(GJ/jr)]O&M cost - 3.6 3.6 3.53 Fixed [ECU1995/GJ/yr)] Variable [ECU1995/GJ]Delivery costs diesel [ECU1995/GJ]Delivery costs N-fert [ECU1995/kg N]Availability factor [-]Life [years] 25 25 25 25Bounds [ha] - - - -

39
Table 9a: Model input data for willow growing under Middle European conditions
Units 1990 2000 2020 2050Input Land [ha/t odm/yr] 0.1 0.0904 0.074 0.055 Diesel [GJ/ t odm] 0.67 0.67 0.67 0.6 N-fertiliser [kg N/ t odm] 7 7 7 6.5 Labour [man-hours/ t odm] 1.5 1.5 1.5 1.2Output Product: [ t odm] 1.0 1.0 1.0 1.0 Residue: [t/ t odm]Investment [ECU1995/( t odm/yr)]O&M cost 40 40 40 36 Fixed [ECU1995/t odm/yr)] Variable [ECU1995/t odm]Delivery costs diesel [ECU1995/ GJ]Delivery costs N-fert [ECU1995/ kg N]Availability factor [-]Life [years] 25 25 25 25Bounds [ha] - - - -
Lower heating value of willow :17 GJ/odt
Table 9b: Model input data for willow growing under Middle European conditions
Units 1990 2000 2020 2050Input Land [ha/GJ/yr] 0.0058 0.0053 0.0043 0.0032 Diesel [GJ/ GJ] 0.039 0.039 0.039 0.035 N-fertiliser [kg N/ GJ] 0.41 0.41 0.41 0.38 Labour [man-hours/ GJ] 0.088 0.088 0.088 0.07Output Product [GJ] 1.0 1.0 1.0 1.0 Residuals [GJ/GJ]Investment [ECU1995/(GJ/jr)]O&M cost 2.35 2.35 2.35 2.11 Fixed [ECU1995/GJ/yr)] Variable [ECU1995/GJ]Delivery costs diesel [ECU1995/GJ]Delivery costs N-fert [ECU1995/kg N]Availability factor [-]Life [years] 25 25 25 25Bounds [ha] - - - -
40
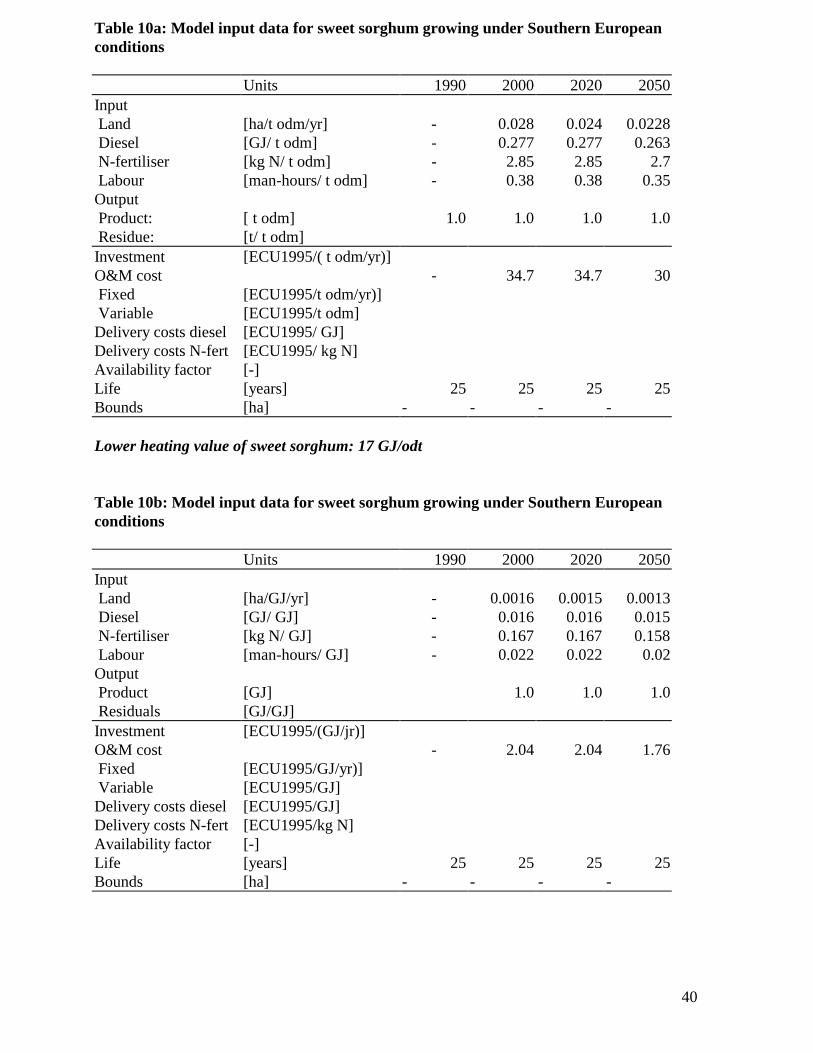
Table 10a: Model input data for sweet sorghum growing under Southern Europeanconditions
Units 1990 2000 2020 2050Input Land [ha/t odm/yr] - 0.028 0.024 0.0228 Diesel [GJ/ t odm] - 0.277 0.277 0.263 N-fertiliser [kg N/ t odm] - 2.85 2.85 2.7 Labour [man-hours/ t odm] - 0.38 0.38 0.35Output Product: [ t odm] 1.0 1.0 1.0 1.0 Residue: [t/ t odm]Investment [ECU1995/( t odm/yr)]O&M cost - 34.7 34.7 30 Fixed [ECU1995/t odm/yr)] Variable [ECU1995/t odm]Delivery costs diesel [ECU1995/ GJ]Delivery costs N-fert [ECU1995/ kg N]Availability factor [-]Life [years] 25 25 25 25Bounds [ha] - - - -
Lower heating value of sweet sorghum: 17 GJ/odt
Table 10b: Model input data for sweet sorghum growing under Southern Europeanconditions
Units 1990 2000 2020 2050Input Land [ha/GJ/yr] - 0.0016 0.0015 0.0013 Diesel [GJ/ GJ] - 0.016 0.016 0.015 N-fertiliser [kg N/ GJ] - 0.167 0.167 0.158 Labour [man-hours/ GJ] - 0.022 0.022 0.02Output Product [GJ] 1.0 1.0 1.0 Residuals [GJ/GJ]Investment [ECU1995/(GJ/jr)]O&M cost - 2.04 2.04 1.76 Fixed [ECU1995/GJ/yr)] Variable [ECU1995/GJ]Delivery costs diesel [ECU1995/GJ]Delivery costs N-fert [ECU1995/kg N]Availability factor [-]Life [years] 25 25 25 25Bounds [ha] - - - -
41
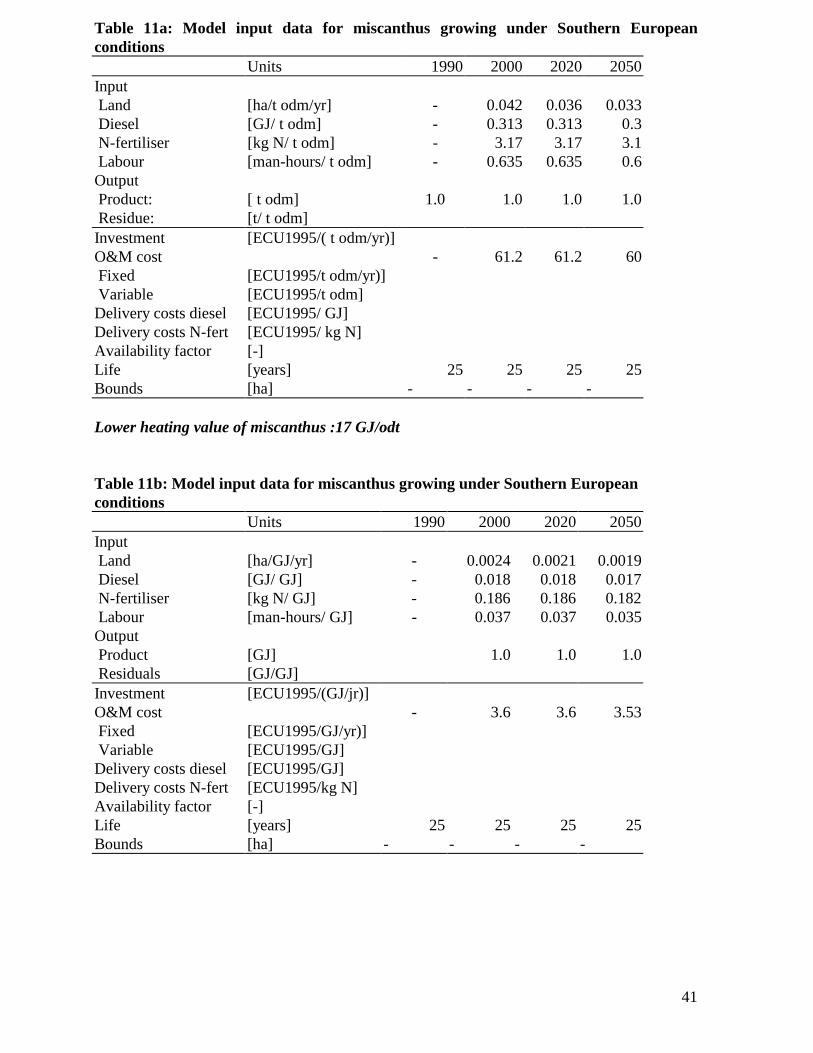
Table 11a: Model input data for miscanthus growing under Southern Europeanconditions
Units 1990 2000 2020 2050Input Land [ha/t odm/yr] - 0.042 0.036 0.033 Diesel [GJ/ t odm] - 0.313 0.313 0.3 N-fertiliser [kg N/ t odm] - 3.17 3.17 3.1 Labour [man-hours/ t odm] - 0.635 0.635 0.6Output Product: [ t odm] 1.0 1.0 1.0 1.0 Residue: [t/ t odm]Investment [ECU1995/( t odm/yr)]O&M cost - 61.2 61.2 60 Fixed [ECU1995/t odm/yr)] Variable [ECU1995/t odm]Delivery costs diesel [ECU1995/ GJ]Delivery costs N-fert [ECU1995/ kg N]Availability factor [-]Life [years] 25 25 25 25Bounds [ha] - - - -
Lower heating value of miscanthus :17 GJ/odt
Table 11b: Model input data for miscanthus growing under Southern Europeanconditions
Units 1990 2000 2020 2050Input Land [ha/GJ/yr] - 0.0024 0.0021 0.0019 Diesel [GJ/ GJ] - 0.018 0.018 0.017 N-fertiliser [kg N/ GJ] - 0.186 0.186 0.182 Labour [man-hours/ GJ] - 0.037 0.037 0.035Output Product [GJ] 1.0 1.0 1.0 Residuals [GJ/GJ]Investment [ECU1995/(GJ/jr)]O&M cost - 3.6 3.6 3.53 Fixed [ECU1995/GJ/yr)] Variable [ECU1995/GJ]Delivery costs diesel [ECU1995/GJ]Delivery costs N-fert [ECU1995/kg N]Availability factor [-]Life [years] 25 25 25 25Bounds [ha] - - - -
42
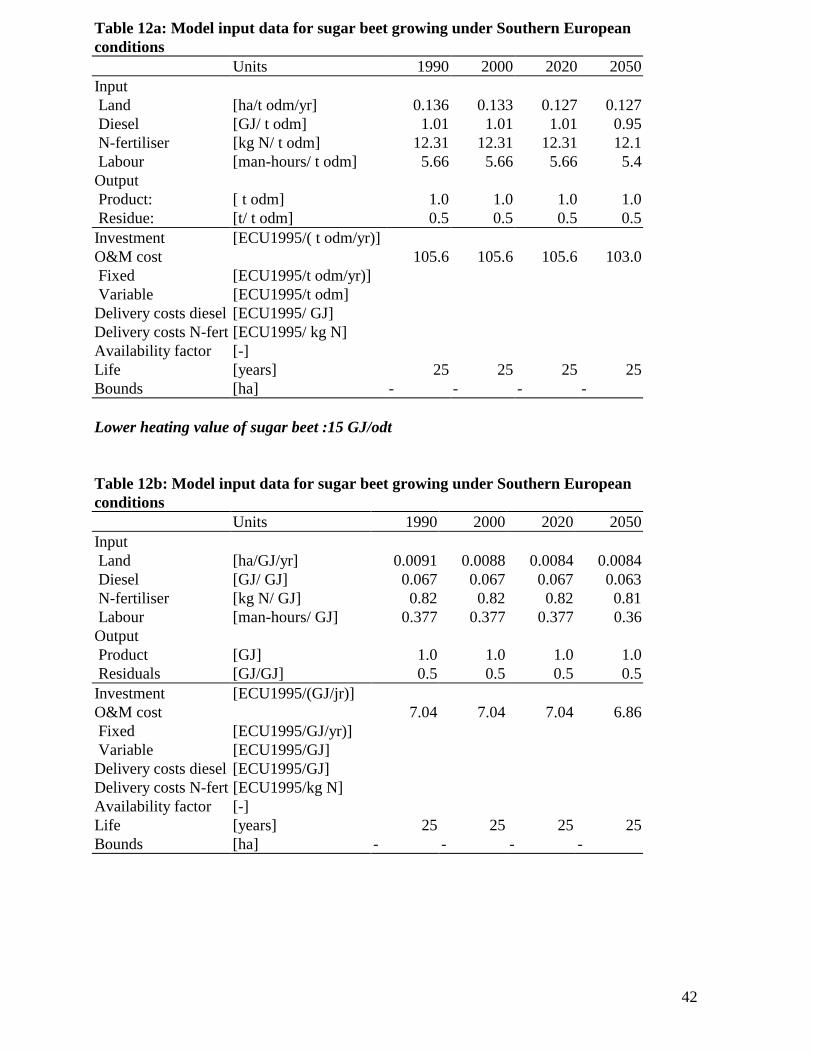
Table 12a: Model input data for sugar beet growing under Southern Europeanconditions
Units 1990 2000 2020 2050Input Land [ha/t odm/yr] 0.136 0.133 0.127 0.127 Diesel [GJ/ t odm] 1.01 1.01 1.01 0.95 N-fertiliser [kg N/ t odm] 12.31 12.31 12.31 12.1 Labour [man-hours/ t odm] 5.66 5.66 5.66 5.4Output Product: [ t odm] 1.0 1.0 1.0 1.0 Residue: [t/ t odm] 0.5 0.5 0.5 0.5Investment [ECU1995/( t odm/yr)]O&M cost 105.6 105.6 105.6 103.0 Fixed [ECU1995/t odm/yr)] Variable [ECU1995/t odm]Delivery costs diesel [ECU1995/ GJ]Delivery costs N-fert [ECU1995/ kg N]Availability factor [-]Life [years] 25 25 25 25Bounds [ha] - - - -
Lower heating value of sugar beet :15 GJ/odt
Table 12b: Model input data for sugar beet growing under Southern Europeanconditions
Units 1990 2000 2020 2050Input Land [ha/GJ/yr] 0.0091 0.0088 0.0084 0.0084 Diesel [GJ/ GJ] 0.067 0.067 0.067 0.063 N-fertiliser [kg N/ GJ] 0.82 0.82 0.82 0.81 Labour [man-hours/ GJ] 0.377 0.377 0.377 0.36Output Product [GJ] 1.0 1.0 1.0 1.0 Residuals [GJ/GJ] 0.5 0.5 0.5 0.5Investment [ECU1995/(GJ/jr)]O&M cost 7.04 7.04 7.04 6.86 Fixed [ECU1995/GJ/yr)] Variable [ECU1995/GJ]Delivery costs diesel [ECU1995/GJ]Delivery costs N-fert [ECU1995/kg N]Availability factor [-]Life [years] 25 25 25 25Bounds [ha] - - - -
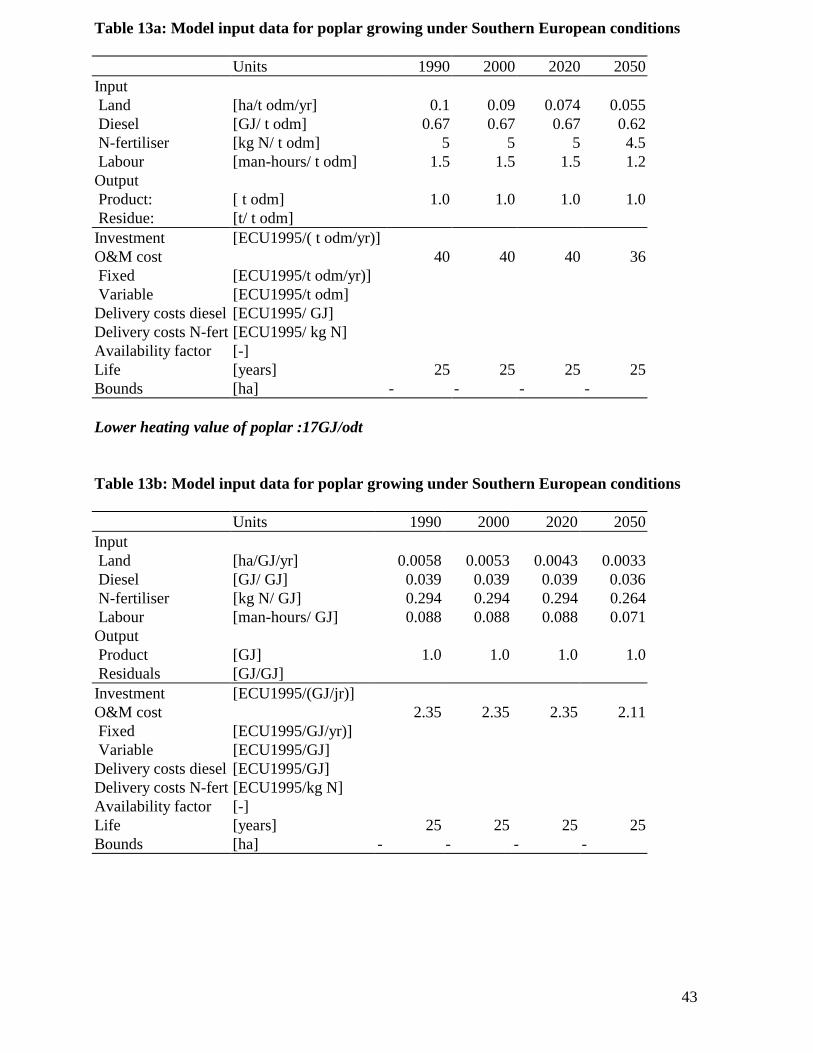
43
Table 13a: Model input data for poplar growing under Southern European conditions
Units 1990 2000 2020 2050Input Land [ha/t odm/yr] 0.1 0.09 0.074 0.055 Diesel [GJ/ t odm] 0.67 0.67 0.67 0.62 N-fertiliser [kg N/ t odm] 5 5 5 4.5 Labour [man-hours/ t odm] 1.5 1.5 1.5 1.2Output Product: [ t odm] 1.0 1.0 1.0 1.0 Residue: [t/ t odm]Investment [ECU1995/( t odm/yr)]O&M cost 40 40 40 36 Fixed [ECU1995/t odm/yr)] Variable [ECU1995/t odm]Delivery costs diesel [ECU1995/ GJ]Delivery costs N-fert [ECU1995/ kg N]Availability factor [-]Life [years] 25 25 25 25Bounds [ha] - - - -
Lower heating value of poplar :17GJ/odt
Table 13b: Model input data for poplar growing under Southern European conditions
Units 1990 2000 2020 2050Input Land [ha/GJ/yr] 0.0058 0.0053 0.0043 0.0033 Diesel [GJ/ GJ] 0.039 0.039 0.039 0.036 N-fertiliser [kg N/ GJ] 0.294 0.294 0.294 0.264 Labour [man-hours/ GJ] 0.088 0.088 0.088 0.071Output Product [GJ] 1.0 1.0 1.0 1.0 Residuals [GJ/GJ]Investment [ECU1995/(GJ/jr)]O&M cost 2.35 2.35 2.35 2.11 Fixed [ECU1995/GJ/yr)] Variable [ECU1995/GJ]Delivery costs diesel [ECU1995/GJ]Delivery costs N-fert [ECU1995/kg N]Availability factor [-]Life [years] 25 25 25 25Bounds [ha] - - - -
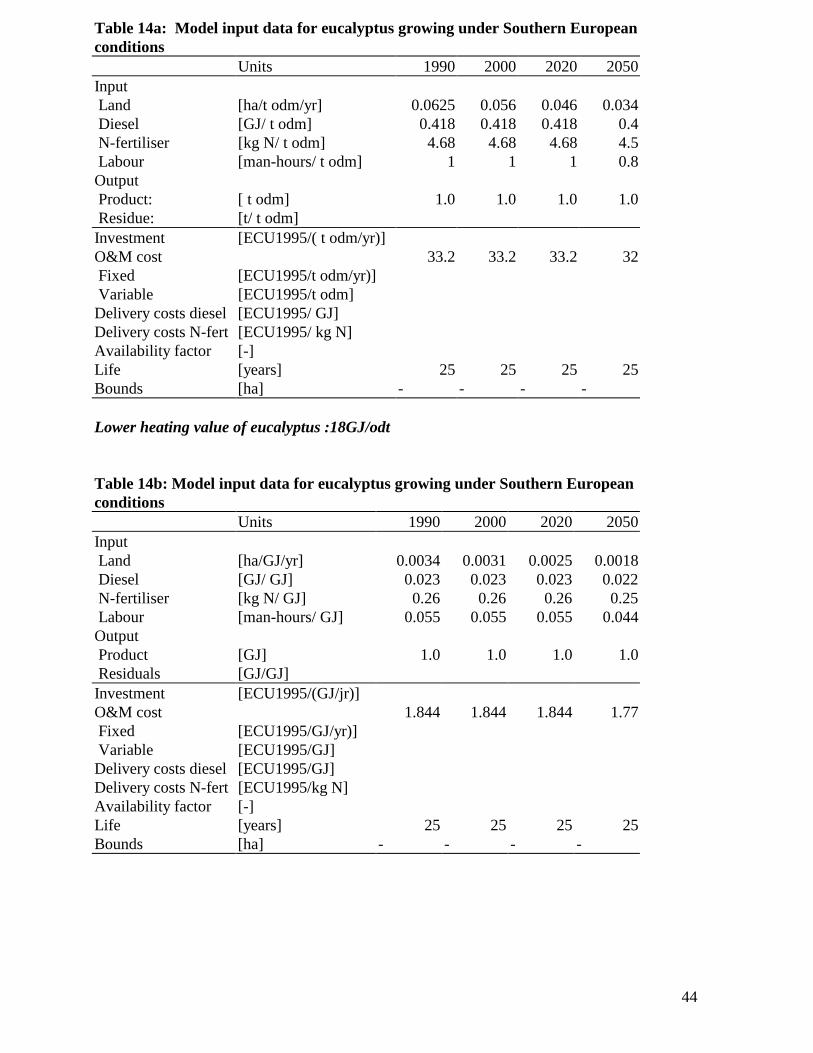
44
Table 14a: Model input data for eucalyptus growing under Southern Europeanconditions
Units 1990 2000 2020 2050Input Land [ha/t odm/yr] 0.0625 0.056 0.046 0.034 Diesel [GJ/ t odm] 0.418 0.418 0.418 0.4 N-fertiliser [kg N/ t odm] 4.68 4.68 4.68 4.5 Labour [man-hours/ t odm] 1 1 1 0.8Output Product: [ t odm] 1.0 1.0 1.0 1.0 Residue: [t/ t odm]Investment [ECU1995/( t odm/yr)]O&M cost 33.2 33.2 33.2 32 Fixed [ECU1995/t odm/yr)] Variable [ECU1995/t odm]Delivery costs diesel [ECU1995/ GJ]Delivery costs N-fert [ECU1995/ kg N]Availability factor [-]Life [years] 25 25 25 25Bounds [ha] - - - -
Lower heating value of eucalyptus :18GJ/odt
Table 14b: Model input data for eucalyptus growing under Southern Europeanconditions
Units 1990 2000 2020 2050Input Land [ha/GJ/yr] 0.0034 0.0031 0.0025 0.0018 Diesel [GJ/ GJ] 0.023 0.023 0.023 0.022 N-fertiliser [kg N/ GJ] 0.26 0.26 0.26 0.25 Labour [man-hours/ GJ] 0.055 0.055 0.055 0.044Output Product [GJ] 1.0 1.0 1.0 1.0 Residuals [GJ/GJ]Investment [ECU1995/(GJ/jr)]O&M cost 1.844 1.844 1.844 1.77 Fixed [ECU1995/GJ/yr)] Variable [ECU1995/GJ]Delivery costs diesel [ECU1995/GJ]Delivery costs N-fert [ECU1995/kg N]Availability factor [-]Life [years] 25 25 25 25Bounds [ha] - - - -