biomass production and nutrient dynamics in an aquaponics...
TRANSCRIPT

Biomass Production and NutrientDynamics in an Aquaponics System
Item Type text; Electronic Dissertation
Authors Licamele, Jason David
Publisher The University of Arizona.
Rights Copyright © is held by the author. Digital access to this materialis made possible by the University Libraries, University of Arizona.Further transmission, reproduction or presentation (such aspublic display or performance) of protected items is prohibitedexcept with permission of the author.
Download date 10/05/2018 01:08:38
Link to Item http://hdl.handle.net/10150/193835

1
BIOMASS PRODUCTION AND NUTRIENT DYNAMICS IN AN AQUAPONICS SYSTEM
by
Jason Licamele
_________________________ Copyright © Jason David Licamele 2009
A Dissertation Submitted to the Faculty of the
DEPARTMENT OF AGRICULTURE AND BIOSYSTEMS ENGINEERING
In Partial Fulfillment of the Requirements For the Degree of
DOCTOR OF PHILOSOPHY
In the Graduate College
THE UNIVERSITY OF ARIZONA
2009

2
THE UNIVERSITY OF ARIZONA GRADUATE COLLEGE
As members of the Dissertation Committee, we certify that we have read the dissertation prepared by Jason David Licamele entitled Biomass Production and Nutrient Dynamics of an aquaponics System and recommend that it be accepted as fulfilling the dissertation requirement for the Degree of DOCTOR OF PHILOSOPHY
___________________________________________________Date: November 16, 2009 Dr. Gene A. Giacomelli ___________________________________________________Date: November 16, 2009 Dr. Kevin Fitzsimmons __________________________________________________Date: November 16 , 2009 Dr. Chieri Kubota ___________________________________________________Date: November 16, 2009 Dr. Joel Cuello
Final approval and acceptance of this dissertation is contingent upon the candidate’s submission of the final copies of the dissertation to the Graduate College. I hereby certify that I have read this dissertation prepared under my direction and recommend that it be accepted as fulfilling the dissertation requirement. __________________________________________________ Date: November 16, 2009
Dissertation Director: Dr. Gene A. Giacomelli

3
STATEMENT BY AUTHOR
This dissertation has been submitted in partial fulfillment of requirements for an advanced degree at The University of Arizona and is deposited in the University Library to be made available to borrowers under rules of the library. Brief quotations from this dissertation are allowable without special permission, provided that accurate acknowledgment of source is made. Requests for permission for extended quotation from or reproduction of this manuscript in whole or in part may be granted by the copyright holder.
SIGNED: Jason Licamele

4
ACKNOWLEDGEMENTS
I would like to thank my advisors and mentors Dr. Gene A. Giacomelli and Dr. Kevin Fitzsimmons for their guidance, help and continuous support during the development of this research. My appreciation to Chieri Kubota for the constructive criticism in the development of my research project. A special appreciation to Dr. Merle Jensen for his support, enthusiasm, and advice. Many thanks to the CEAC facilities staff that made the work at the CEAC possible and their help in the maintenance and construction of the aquaponics greenhouse. My appreciation to Neal Bharto, Peter Considine, and Jorge Castillo for their help and support in the construction and maintenance of the aquaponics greenhouse. My appreciation to my friends and colleagues at the Controlled Environment Agriculture Center.

5
DEDICATION To my parents for their continuous support and encouragement throughout my scholastic career and life. To Rachel for her love, companionship, and endless support. To all those who have touched my life and interacted with me to make the times I shared enjoyable and productive. You know who you are.

6
TABLE OF CONTENTS
LIST OF FIGURES…………………………………………………………………….....9 LIST OF TABLES……………………………………………………………………….10 ABSTRACT……………………………………………………………………………...11 INTRODUCTION……………………………………………………………………….13 PROBLEM STATEMENT………………………………………………………13 LITERATURE REVIEW……………………………………………..................16 Aquaculture……………………………………………………................16 Lettuce Hydroponics………………………………………………...…...19 Aquaponics……………………………………………………................22 PROJECT GOALS AND OBJECTIVES……………………………..................30 Aquaponics Research Greenhouse Design………………………………36
Hypothesis and Specific Aims…………………………………………...42 PRESENT STUDY…………………………………………………………....................45 OVERALL SUMMARY………………………………………………………...45
OPTIMAL FISH (OREOCHROMIS NILOTICUS) TO PLANT (LACTUCA SATIVA CV. REX) RATIOS FOR A CONTROLLED ENVIRONMENT AQUAPONICS SYSTEM (APPENDIX A)………………………………………………..………...45 COMPARISON OF LETTUCE (LACTUCA SATIVA CV. REX) GROWN WITH TILAPIA (OREOCHROMIS NILOTICUS) EFFLUENT AND NUTRIENT SUPPLEMENTATION VERSUS A HYDROPONIC SOLUTION (APPENDIX B)…………………………………................48 NITROGEN REMEDIATION AND NUTRIENT DYNAMICS IN A CONTROLLED ENVIRONMENT AQUAPONICS SYSTEM (APPENDIX C)…………...………………...53
OVERALL CONCLUSIONS AND RECOMMENDATIONS…………………56
REFERENCES…………………………………………………………………..64

7
TABLE OF CONTENTS - Continued
APPENDIX A: OPTIMAL FISH (OREOCHROMIS NILOTICUS)
TO PLANT (LACTUCA SATIVA CV. REX) RATIOS FOR
A CONTROLLED ENVIRONMENT AQUAPONICS
SYSTEM………………………………………………………………………...70
ABSTRACT……………………………………………………………...71
INTRODUCTION……………………………………………………….73 MATERIALS AND METHODS………………………………………...78
Experimental Design……………………………………………..78 Fish and Plants…………………………………………………...79 Environmental Parameters and Water Chemistry………………..81 Data Analysis…………………………………………………….82 RESULTS……………………..………………………………................86 Fish Biomass……………………………………………………..86 Plant Biomass………………………………………………........86 Water Chemistry…………………………………………………87 DISCUSSION………………………………………………..................97 REFERENCES……………………………………………....................103
APPENDIX B: COMPARISON OF LETTUCE (LACTUCA
SATIVA CV. REX) GROWN WITH TILAPIA (OREOCHROMIS
NILOTICUS) EFFLUENT AND NUTRIENT
SUPPLEMENTATION VERSUS A HYDROPONIC
SOLUTION……………………………………………………………………107
ABSTRACT…………………………………………………………….108 INTRODUCTION…………………………………………………..….109 MATERIALS AND METHODS……………………………………….114
Aquaponics System Design and Protocol……………………....114 Nutrient Supplementation……………………………………....117 Monitoring of Environmental Parameters……………………...118 Biomass and Chlorophyll Concentration Index...………………118 RESULTS………………..…………………………..............................122 Water Chemistry Analysis and Environmental Parameters…….122 Biomass Analysis and Chlorophyll Concentration Index……....123 DISCUSSION………………………………………………................134 REFERENCES……………………………………………....................136

8
APPENDIX C: NITROGEN REMEDIATION AND NUTRIENT
DYNAMICS IN A CONTROLLED ENVIRONMENT
AQUAPONICS SYSTEM………...…………………………………………..140
ABSTRACT…………………………………………………………….141 INTRODUCTION……………………………………………………...143 MATERIALS AND METHODS……………………………………….148
Aquaponics System Design and Protocol……………………...148 Nutrient Supplementation………………………………………151 Monitoring of Environmental Parameters……………………...152 Data Collection and Statistical Analysis………………………..152 RESULTS………………………………................................................157 Environmental Parameters…………………………………..….157 Water Chemistry Analysis……………………………………...157 Biomass Analysis……………………………………………….158 Nutrient Analysis……………………………………………….158 Nitrogen Dynamics……………………………………………..159 DISCUSSION………………………………………………..................166
REFERENCES……………………………………................................170
9
LIST OF FIGURES
Figure 1. Picture of the University of Arizona controlled environment greenhouse The greenhouse structure (A), the fish bay (B), and the hydroponic plant bay (C)……………………………………………………………..32
Figure 2. The filtration system for the University of Arizona controlled environment
aquaponics greenhouse. A Polygeyser™ PG7-PR filter from International Filter Solutions was used to remove particulate matter from the aquaponics water. A biological filter was constructed to supplement the PG7 filter. The sludge from the aquaponics system was collected…………………………………………………………..…34
Figure 3. Aquaponics research greenhouse fish section design. Figure legend lists the
Fish and filtration system components…………………………………..38 Figure 4. Aquaponics research greenhouse plant section design. Figure
Legend lists the schematics of the hydroponic plant beds. Yellow represents airlines for oxygen delivery, and blue represents water flowing to the hydroponic beds and back to the fish component.….……39
Figure 5. Flow chart of the inputs and outputs of an aquaponics system. The three
primary outputs are fish, lettuce, and processed fish sludge. Inputs include water, feed (nutrients), and sunlight. Energy is also utilized for moving water and delivering oxygen to the water…………………...44
Figure 6. Picture of lettuce (L. sativa cv. Rex) grown with aquaponics water (A),
aquaponics water plus supplementation (B), and hydroponic solution (C)……......................................................................................................57
Figure 7. Fish and lettuce grown in the University of Arizona Controlled Environment
Aquaponics Greenhouse. Tilapia (O. niloticus spp.) was harvested on monthly basis (A). Varieties of lettuce were grown in the aquaponics system including romaine, red and green oak, and butterhead (B). An organic romaine cultivar of lettuce (L. sativa cv. Rom) (C)…………….58

10
LIST OF TABLES Table 1. Amount of water required to produce $100 output of different food
commodities……………………………………………………………………24

11
ABSTRACT
The goal of this study was to prove that aquaponic systems can produce lettuce of
equal growth and quality compared to hydroponic lettuce production and to determine the
stocking density of fish required for plant growth. Aquaponics is the integration of
recirculating aquaculture and hydroponic plant production. The project had four
objectives. The first objective was to determine the biomass of fish required for plant
growth to develop a fish to plant density ratio. The second objective was to compare
lettuce grown with aquaponic water and a hydroponic solution under the same
environmental conditions. The third objective was to compare the quality of lettuce
grown with aquaponics water plus nutrient supplementation with a hydroponic solution.
The fourth objective was to determine the nitrogen dynamics in the aquaponic system and
to compare the nutrient composition of lettuce grown with aquaponics water with nutrient
supplementation and hydroponic solution. It was determined that under the specified
environmental conditions 5 kg m-3 of Nile tilapia (O. niloticus) fed 2% of their body
weight daily yields on average 4.7 kg m-2 of lettuce (L. sativa cv. Rex) in 35 days. There
was no significant difference (p≤0.05) in biomass or chlorophyll concentration index in
lettuce (L. sativa cv. Rex) grown with aquaponics water and nutrient supplements versus
a hydroponic solution. The aquaponics solution generated equal biomass and chlorophyll
concentration indexes compared to the hydroponic solution. Aquaponics water plus
supplementation can yield L. sativa cv. Rex with equal biomass accumulation and
chlorophyll concentration indexes compared to hydroponics lettuce. Nutrients added to
the aquaponics system consisted of iron, manganese, and zinc. These nutrient
concentrations became depleted in the aquaponics water over time and were not

12
replenished via the fish feed. Dolomite was added to the aquaponics system every two
weeks to increase the buffering capacity of the water and maintain optimal pH levels.
Aquaponics lettuce had similar nutrient composition to hydroponic lettuce. One head of
L. sativa cv. Rex (176.75 ± 31.03) will assimilate approximately 5.96 grams of nitrogen
(3.38% per dry gram lettuce). One kilogram of fish will yield 6.4 lettuce heads (1,128
grams) and fixate 38.13 grams of nitrogen.

13
INTRODUCTION
PROBLEM STATEMENT
The world population is growing fast and as of November 2009 is approximately
6.8 billion, while 308 million people reside in the United States (U.S. Census Bureau
2009). Water and land resources for agriculture are diminishing and world fisheries are at
or past their maximum sustainable yields. To feed humanity for the next 40 years it is
speculated that more food must be produced than all the food produced since the
beginning of recorded history (Parker 2002). Extractive resources are taken from nature
and then consumed in some applications for food or energy. Renewable resources such as
trees and fish exist in finite quantities at any point in time but can regenerate (Rasband et
al. 2004). Fisheries are an extractable renewable resource when managed properly.
Recent consumption and demand for seafood primarily driven by technological fishing
development and market demand (arising from recent knowledge of the health benefits
from fish and increasing populations) has led to a mismanaged system. There are multiple
reasons for the mismanagement of fisheries. First, increases in consumer demand has
skyrocketed past what natural fish stocks can support. Second, pollution, climate change
and the lack of global enforcement in fisheries management has led to severely depleted
fish stocks. Some predict commercial fish stocks to disappear within the next decade or
even sooner if problems are not addressed (FAO 2007). The majority of commercially
fished species are at or past their maximum sustainable yields meaning that fish
populations can not naturally rebound on their own. Aquaculture yields promise for
sustaining fishery resources. However this can not be done by simple mass production via
aquaculture. Environmental problems that arise from aquaculture include: biological

14
pollution (escaped fish); fish for fish feed ingredients, farm discharge pollution leading to
eutrophication, habitat modification and chemical pollution from antibiotics and
pesticides. Aquaculture practices must be coupled with sound environmental and
fisheries policies to yield a productive and sustainable management system.
Aquaculture is the fastest growing sector of food production producing over 60
million metric tons of products in 2005 (FAO 2007). This will only continue to rise as
demand for seafood is increasing and fisheries are being depleted. In aquaculture, as with
livestock or poultry, water is not consumed but the biochemical nature of water is altered.
In the United States aquaculture has increased in importance. The U.S. imports more
seafood than it exports resulting in a $9.2 billion seafood import deficit (DOC 2007).
Seafood consumption in the U.S. has increased to over 16 pounds per person in 2005 and
is now third in the world behind China and Japan respectively (FAO 2005). The recent
growth of organic farming has supported the use of fish and fish byproduct fertilizers
over conventional synthetically derived chemical fertilizers. Water is a precious resource
and becoming a scarcity relative to human demand. Sustainability of agriculture and
economic activities that require water can only be achieved through proper management
practices (Postel 2002). Water is one of the essential commodities for sustaining life and
producing food. Demand for food is increasing with an increase in human population.
Water and land resources are decreasing and as demand for their utilization to produce
food increases their value will increase. Resources used in farming of food consist
primarily of water, land, and feed. All three of these resources are limited. Resources
used in farming of food consist primarily of water, land, and feed. All three of these
resources are limited. Agriculture accounts for approximately 70% of the global water

15
use (Rogers 2008). Agricultural runoff contributes to phosphorous and nitrogen pollution
of surface waterways (Fitzsimmons and Posadas 1997). Elevated nitrogen and
phosphorous levels have been documented to pose negative impacts on aquatic
ecosystems. Farm irrigation is one of the major sinks for freshwater in the world. It is
speculated that a 10% drop in farm irrigation water can save more water than water used
by municipalities and public consumers (Rogers 2008).
Improving water use by agriculture and food production is critical in order to
supply the demand for food in the future (FAO 2003). The FAO has addressed some
primary issues in regards to food production and water use. Some of the target issues of
the FAO are the sustainable development and management of rain fed and irrigated
agriculture, the modernization of irrigation practices to demand-oriented management,
improving governance of agriculture water through integrated, efficient and equitable
water resources, the development of international cooperation, and the development of
research in the field of food production technologies to maximize water use efficiency.
Establishing proper water management practices will lead to an increase in water use
efficiency and a reduction in environmental pollution. Rainwater collection and
utilization could help alleviate the demand for water. However, it will take multiple
efforts on all fronts to have a significant impact on water use efficiency. Farm irrigation
is one of the major sinks for freshwater in the world. Some aspects of agriculture that can
be changed to help conserve water are the implementation of new technologies such as
drip irrigation, stringent crop management techniques, proper fertilization applications
and integrating farming systems. The face of farming is changing and the future of
farming resides in the sustainable production of nutritionally substantial foods.

16
Aquaponic systems and integrated farming practices will yield sustainable and
environmentally sound farming methods.
LITERATURE REVIEW
Aquaculture
Tilapia is the fourth most consumed aquacultured product in the world (FAO
2005). Catfish and Salmon are the only two aquacultured fish consumed more than
Tilapia (Kohler 2000). There are numerous types of commercial farming applications
ranging from extensive systems to very intensive systems. The type of system developed
for farming tilapia is dependent on the experience and knowledge of the farmer,
geographic locale, resource acquisition, potential marketing and distribution as well as
startup funding. Tilapias are native to Africa and the Middle East (Fitzsimmons and
Posadas 1997). World wide production of Tilapia has increased from 855,000 metric tons
(1.8 billion pounds) in 1990 to 1,100,000 metric tons (2.2 billion pounds) in 1994. South
American countries primarily export Tilapia to the United States. Tilapia imports have
increased steadily over the past decade. U.S. imports have increased from 7.5 million
pounds in 1992 to 41.9 million pounds in 1996 (Fitzsimmons and Posadas 1997). In 1992
89% (0.8 million pounds) of the tilapia imports were whole frozen fish whereas in 1996
20% (8.4 million pounds) of the imports were fresh fish marketed to local fish markets
(Fitzsimmons and Posadas 1997). The increase in Tilapia imports can be attributed to the
decrease in wild fish populations as well as the advent of aquaculture operations. Tilapia
consumption has steadily increased through 2002 to over 150,000 metric tons/year
(Parker 2002). The primary marketing targets for commercially produced Tilapia are the

17
United States, Europe and Japan. Tilapia has been successfully marketed to tourist areas,
restaurants, and fish markets and is currently in demand in the United States.
The majority of tilapia species farmed outside of Africa is of the genus
Oreochromis. Nile tilapia (O. niloticus) comprise up to 90% of the species being
commercially farmed (Popma and Masser 1999). Other commercially farmed tilapia
species are the Blue tilapia (O. aureus) the Mozambique tilapia (O. mossambicus), and
the Zanzibar tilapia (O. urolepis hornorum) (Popma and Masser 1999). Several species of
Tilapia are raised in the United States. The most popular species are the Nile Tilapia (O.
niloticus). Tilapia are laterally compressed, deep bodied and have an interrupted lateral
line. Nile tilapias generally have prominent vertical bands while mature male Nile tilapia
develops gray or pink pigment on the throat area. (Popma and Masser 1999). The Chinese
have been practicing integrated fish and plant culture system for centuries. China is the
leader in aquaculture production and one of the major importers of frozen and fillet
tilapia into the United States. In the United States the majority of domestic aquaculture
production of tilapia is sold to the live fresh fish market (Fitzsimmons 2006).
Tilapia has many favorable characteristics for aquaculture production. Tilapia can
tolerate poor water quality. Wide salinity ranges, water temperature ranges, low dissolved
oxygen levels, and elevated ammonia concentrations have less effect on tilapia than other
fish species grown in commercial farming operations (Popma and Masser 1999). Tilapia
consumption has risen annually in the U.S. and is currently one of the top five fish
consumed per capita (Fitzsimmons 2006). There has been a shift in consumption from red
meat to fish because it contains higher quality proteins and is low in fat. A 100 gram
serving of tilapia contains 96 calories and is a good source of protein (20 g) and Vitamin

18
B12 that is low in total fat (2 g), sodium (52 mg), and cholesterol (50 mg)
(www.nutritiondata.com). It is mild in flavor, consumed globally, absorbs seasonings
well, is easy to raise and has a relatively quick turnover time compared to other species.
In the U.S the majority of tilapia production is sold to live markets, or fresh on ice, to
obtain a more competitive price. The physiology, behavior, nutrition and genetics of
tilapia have been well studied over the years. Tilapia are a hardy fast growing fish with a
low protein requirement making them a primary target for aquaponic recirculating
systems. Tilapia fish are omnivorous and have a relatively low protein requirement in
comparison to other carnivorous aquacultured fish (Fitzsimmons 2006). They are
omnivorous consuming a wide range of organisms including phytoplankton, zooplankton,
aquatic macrophytes, algae, benthic invertebrates, larval fish, detritus and decomposing
material (Popma and Masser 1999).
Tilapia require the standard ten amino acids that other fish species require. Protein
quantity and quality are required for sufficient and optimal growth. Most commercial
tilapia feeds comprise approximately anywhere from 28-36% protein depending on life
stage and age of the fish. Digestible energy of tilapia is estimated to be 8.2 to 9.4 kcal of
digestible energy (DE) per gram of dietary protein (Popma and Masser 1999). Vitamin
requirements are similar to that of other fish species as well. Protein is the most
expensive feed ingredient in fish food and often consists of wild anchovy meals, yeast
meals, and animal meals. Tilapia are able to digest plant based proteins allowing for
substitution of plant based protein sources for more expensive animal based protein
sources (Watanabe et al 2002). Fish aquaculture systems can provide a consistent organic

19
source of nutrients for the hydroponics plants. Aquaponics and farm integration can
reduce the environmental impacts from agriculture and aquaculture farming.
Lettuce Hydroponics
Hydroponics is the culture of plants in a soil less media. There are numerous
advantages of hydroponic food production systems over conventional agriculture. The
ability to produce vegetables all year round enables growers to obtain high prices for
vegetables out of season when supply is decreased. In hydroponic systems the plants
roots reside in a hydroponic solution formulated for optimal plant growth (Hanan 1998).
The solution can be tailored to a specific species to yield optimal growth. Plants grown in
a hydroponic solution can yield greater growth rates and be of higher quality in
comparison to conventional agriculture. Hydroponic systems will also produce more
consistent crops. Production of hydroponic systems can be ten times greater than
conventional agriculture production (Resh 2001). Another advantage of hydroponic
production methods is that the risk of soilbourne viruses is reduced because the plants
reside in an aquatic medium. There are many soilbourne viruses that effect crops of
economic viability. Lettuce dieback is a disease caused by at least two soilbourne viruses
in the family Tombusviridae: lettuce necrotic stunt virus (LNSV) and tomato bushy stunt
virus (TBSV) (Obermeier et al, 2001). Symptoms include chlorosis and necrosis in older
leaves and eventually plant stunting and death (Grube & Ryder 2003). Reports of lettuce
dieback have been increasing in California and Arizona which account for over 95% of
lettuce production in the United States (U.S. Department of Agriculture 2002). The
Romaine lettuce industry has suffered from this virus and research into has not warranted

20
a cultivar resistant to the disease. Red and green leaf lettuce cultivars have also suffered
from dieback but have not yet been documented in iceberg lettuce.
Lettuce is commonly cultured and grows well in hydroponic and aquaponic
systems. Typical types of lettuce grown are bibb, looseleaf, iceberg, and romaine.
Looseleaf varieties are the easiest to grow and can tolerate daytime temperature of 270C
without bolting, wilting or slow growth. Spacing can be 10 to 30 heads per square meter.
Lettuce has a four to five week vegetative growth phase to harvest. A profit can be
realized in short time in comparison to tilapia (4-6 weeks). Lettuce (Lactuca sativa) is a
common plant used in hydroponic systems. It is a hardy plant that has a fast growth rate
(Resh 2001). Lettuce is the first salad crop to be cultivated commercialized
internationally. Lettuce has the ability to a accumulate nitrogen and phosphate. The
nitrogen and phosphate is assimilated from the solution medium (Resh 2001). Lettuce
also has a quick growth cycle and can be harvested within four to five weeks allowing for
quick realized profit and turnover of nutrients in the system (Rakocy et al. 2006). This
makes lettuce a good target crop for aquaponic systems with a heavy bio-load and thus
high nitrogen accumulation. Biotic (genetics, growth, and disease) and abiotic
(temperature, light, water potential, nutrient availability) factors influence growth and
development of plants. These factors can also influence pigment concentrations in plants.
Lettuce grows best at air temperatures between 16 – 25o C and will bolt in air temperature
above 25 – 28o C (Resh 2001). Day temperatures of 24o C and night temperatures of 19oC
coupled with photosynthetic active radiation (PAR) levels of 17 mol/m2 per day were
found to produce marketable lettuce heads in 24 days after transplant (Both et al. 1994).
Lettuce will bolt (flower) at high air temperatures (25-280C) thus making it hard to grow

21
in warm climates and seasons (Resh 2001). Research has shown that by keeping the root
zone temperatures at optimal levels even though air temperatures are high proper growth
can be achieved. Iceberg lettuce was able to grow properly and form compact heads when
root zone temperatures were kept at 15-170C even though air temperature was 25-390C
(Marsic and Osvald 2002).
Temperature affects the pigment stability of lettuce. Higher temperatures lead to
increased pigment degradation (Shaked-Sachray et al 2002). Coloration and nutritional
value are important marketing parameters of lettuce. Coloration (intensity and
uniformity) and nutritional value are linked to chlorophyll and anthocyanin levels
(Simonne et al, 2002). Anthocyanin and chlorophyll concentrations in lettuce are effected
by the plants genetics as well as the growing conditions (Dela et al, 2003). Genotype,
temperature, and light can influence the shifting of pigment levels independently of one
another or synergistically (Crozier et al, 1997). Temperature can affect anthocyanin and
chlorophyll levels in lettuce negatively impacting both quality and nutrition. Day and
night air temperature fluctuations (30/200C) result in higher anthocyanin and chlorophyll
b concentrations than a constant (30 or 200C) day/night air temperature (Gazula et al,
2005). This suggests that the effects on quality and nutrition from high day air
temperatures can be mitigated with low night air temperatures. Temperature affects the
pigment stability. Higher temperatures lead to increased pigment degradation (Shaked-
Sachray et al 2002). A marketable lettuce head weighs a minimum of 150 grams and can
be achieved in 3-4 weeks after transplant under optimal growing conditions (Both et al.
1994; Resh 2001).

22
Nutritional requirements of plants vary at different stages of development.
Nitrogen is the most essential nutrient that drives plant growth and elongation. Nitrogen
is part of a large number of vital organic compounds such as amino acids, proteins,
coenzymes, nucleic acids, and chlorophyll (Resh 2001). Phosphorous levels greater than
15-30 mg kg-1 are sufficient for most agronomic crops (Ludwick, 2002). Lettuce has a
higher phosphorous requirement for maximum growth. Phosphorous plays a vital role in
the synthesis of organic compounds such as sugar phosphates, ATP, nucleic acids,
phospholipids and coenzymes (Resh 2001). Phosphorous requirement thresholds range
from 35 mg kg-1 (Ludwick 2002) to 80 mg kg1 (McPharlin et al, 1996) for lettuce. This
can vary depending on growing media and season. A deficiency in phosphorous will stunt
growth and flowering or fruit set. Iron has been found to be the limited nutrient in
recirculating aquaponic systems (Fitzsimmons and Posadas 1997). Therefore a
recirculating aquaponics system will need iron supplementation over an extended period
of time. Iron is required for chlorophyll synthesis and is an essential part of cytochromes
which are electron carriers in photosynthesis and respiration (Resh 2001).
Aquaponics
Aquaponics is the integration of recirculating fish production systems with
hydroponic plant production to utilize the fertilizers efficiently. The integration of these
two systems leads to the removal of nutrients (primarily nitrates and phosphates) from the
system omitting the need for water changes thus conserving water. However, water is
needed to fill the initial system. Dissolved nutrients from fish are similar to the nutrients
required for hydroponic growth of plants (Rakocy et al. 2006). Aquaponics is the most

23
efficient food production system in terms of amount of product produced per volume of
water (Table 1). It takes approximately 500 liters of water to produce $100 of product
(fish and lettuce), whereas producing cattle takes more than 100 times as much water to
produce a $100 of product (Rakocy et al. 2004).
Aquaponic systems recirculate water to utilize nutrients efficiently thus producing
food in a sustainable manner with little environmental impact. Removal of nutrients from
fish effluent via plant nutrient uptake is an efficient and productive method of filtration.
The production of fish and vegetables through the integration of fish aquaculture and
plant production has been demonstrated (Fitzsimmons 1991; Fitzsimmons 1992; Rakocy
et al. 1993; McMurtry et al. 1997; Chaves 2000; McIntosh and Fitzsimmons 2003;
Sabidov 2004; Castro et al. 2006; Diver 2006). Coupling fish aquaculture with
hydroponic plant culture is more sustainable than conventional agriculture systems
(McMurtry et al. 1990; Fitzsimmons 1992; Rakocy et al. 1992; Rakocy and Nair 1987;
Rakocy and Hargreaves 1993). Popular food crops such as lettuce, basil, tomatoes and
strawberries, have been successfully cultivated with the use of fish effluent as the primary
fertilizer (McMurtry et al. 1997, Takeda et al. 1997, Rakocy et al. 2004, Hanson et al.
2008). The integration of recirculating aquaculture systems (RAS) with hydroponic plant
production is referred to as aquaponics. The primary resources used in animal or crop
production are water, nutrients, light, and land. Intensive RAS can produce more fish per
liter of water than other types of aquaculture systems (Timmons et al. 2002) therefore
reducing water used. Greenhouse hydroponics production can produce from five to ten
times more output compared to conventional agriculture (Resh 2001; Hannan 1998). It
takes approximately 100 liters of water to raise a fish in a recirculating aquaculture

24
Commodity Liters of Water
Rice 470,000
Cotton 160,000
Milk 147,000
Sugar 123,000
Beef Cattle 81,200
Vegetables and Fruit (soil) 37,900
Wheat 24,500
Hydroponics 600
Aquaponics (fish and lettuce) 500
Aquaponics (fish and basil) 173
Table 1. Amount of water required to produce $100 of output of commodity (Rakocy et al. 2004).

25
system (Timmons et al. 2002). Water loss in fish systems occurs mainly from water
changes and/or discharge or evaporation. In hydroponic lettuce production systems one
liter of water will yield on average 3.5 grams of dry lettuce biomass (Gonnella et al.
2002; Gonella et al. 2001). Preliminary studies at The University of Arizona’s aquaponics
research greenhouse determined that it takes less than a liter of water per lettuce head, or
approximately 4.2 liters of water per kilogram of head wet weight of lettuce. The
integration of fish and plant systems can potentially reduce the amount of water used per
kilogram of food produced. Aquaponic systems can yield similar crop production to
hydroponic systems (Sabidov 2004). Water from RAS systems can be used in greenhouse
hydroponics to intensify production by utilizing resources more efficiently potentially
reducing water usage by 20-27% compared to conventional agriculture (Chavez et al.
2000).
Lettuce (Lactuca sativa cv.) is commonly cultured in hydroponic and aquaponic
systems. Lettuce has a four to five week vegetative growth phase to harvest. It is a hardy
plant that has a fast growth rate (Resh 2001). It was found that lettuce can deposit a large
amount of nitrogen to its leaves and the nitrogen deposition can be manipulated by plant
density and nitrogen availability (Seawright 1998). Tilapia can tolerate a pH from acidic
to alkaline (pH 5-11) (Chervinski 1982) and a wide range of salinity concentrations
(Watanabe et al. 2002). Plants grow best and uptake nutrients at a lower pH (5.5-6.5)
(Resh 2001). Specifically, lettuce will grow well in a pH range of 5.5-6.5 (Resh 2001,
Islam et al. 1980). Nitrifying bacteria is inhibited below a pH of 6.5, with an optimum pH
of 7.8 depending on bacterial species and temperature (Antoniou et al. 1990; Tyson et al.
2007). Lettuce will exhibit normal growth at oxygen levels of the solution greater than

26
0.10 mM (Yoshida et al 1997). Lettuce is tolerant of lower oxygen levels in comparison
to other plants. Tilapia can withstand low dissolved oxygen levels but optimal growth
occurs with levels greater than 2 mg / l (Watanabe et al. 2002). Electrical conductivity
levels range between 1-2 mS / cm for hydroponic lettuce production (Resh 2001), well
below the levels (2000 mS / cm) that can be toxic to Nile tilapia (Timmons 2002).
Optimal water temperature for Nile tilapia (Oreochromis niloticus) ranges between 28-
35o C (Chervinski 1982) while lettuce grows best at water temperatures between 21-25oC
(Resh 2001). These water parameters can influence the physiology of the organisms
within the aquaponic system and must be monitored and controlled for optimal system
performance.
The conceptual aspect of aquaponics is to balance the nutrients within a given
system. Nutrients are delivered to the system through an input source, in this case fish
feed. Protein content in the feed dictates the amount of nitrogen that is available to the
plants after the fish assimilate and process the nutrients (Timmons 1996). The density of
fish, protein content in the feed, and the feeding rate drive the nutrient loading of the
system. Balancing the amount of nutrients produced from the fish system with the
nutrient requirements of the plants can lead to optimized resource utilization and system
productivity. Nitrogen is used for protein and amino acid synthesis. Proteins make up
structural tissues, transport oxygen or hemoglobin, regulate reactions as hormones, and
catalyze biochemical reactions as enzymes (Parker 2002; Santamaria 2002). Protein is the
most costly ingredient in fish diets. Protein is the primary nutrient for fish growth and can
account for more than 60 percent of fish feed cost (Hatch and Kinnucan 1993). High
body fat reduces the shelf life of the frozen fish, reduces dressing percentage possibly

27
decreasing market quality. Increasing the protein content in the feed will improve the
quality of the fish (Hatch and Kinnucan 1993). Protein has an effect on the growth of
fish, quality of fish, cost of feed, and the water chemistry of the system. Aquatic animals
convert feed at better rates than other terrestrial food animals (Parker 2002). Fish require
less energy for body support and are cold blooded therefore expending less metabolic
energy for body temperature regulation. This will yield low feed conversion ratios (FCR)
thus yielding more product per feed unit. The conversion of feed to usable energy and
somatic growth in fish is 25-30% (Rakocy & Hargreaves 1993). Studies by Quillere et al.
(1995) revealed a 60% nitrogen recovery (fish 31% and tomato plants 28%) from an
aquaponics system.
Wastewater from aquaculture farms primarily discharge water composed of
nutrients and organic matter. This water is suitable for plant growth. Non-point source
pollution from agriculture comprises nitrogen and causes environmental degradation
(Fitzsimmons 1992). Reducing the amount of nitrogen in agriculture and aquaculture
discharge water can reduce the environmental impact from both point source and non
point source pollution. This can be done through proper fertilizer application rates,
reducing water discharge by recirculating water, and using biological organisms to
remediate the water. Water from intensive recirculating fish culture systems can have
total ammonia levels up to 19.2 mg / l, nitrate levels of over 500 mg / L, phosphate levels
up to 53 mg / L and potassium levels up to 150 mg / L (Fitzsimmons 1992). Phosphorous
accumulation in soils occurs from heavy fertilization but does not necessarily cause
agronomic problems. However agricultural runoff attributes to phosphorous pollution of

28
surface waterways. Elevated nitrogen and phosphorous levels have been documented to
pose negative impacts on the eutrophication of water ecosystems (Sims 1998).
Fish waste and accumulated feed builds up in the system. Nitrogen, phosphorous,
and organic matter accumulate in high quantities in aquaculture systems. Nitrogenous
wastes are produced when nitrogen in the form of ammonia is excreted by the fish.
Ammonia is the byproduct of protein synthesis by the fish. Nutrient levels from fish
aquaculture are suitable for plant growth and can be manipulated by increasing fish
biomass and feed rate or by increasing the protein levels in the feed. It was found that
lettuce can deposit a large amount of nitrogen to its leaves and the nitrogen deposition
can be manipulated by plant density and nitrogen availability (Al-Hafedh et al 2004).
These levels are increased dramatically in recirculating systems and can lead to
secondary effects (Timmons et al. 2002). Phytoplankton blooms can effect the oxygen
concentration of the system, the nutrient dynamics, disease, and promote bacterial
problems that can lead to off-flavors (Fitzsimmons 2006).
Plants use ammonia and nitrates for growth (Marschner 1995). Nitrate is taken up
by the plant at better rates than ammonia nitrite can be toxic to plants (Britto and
Konzucker 2002). Ammonia concentrations at elevated levels can inhibit nutrient uptake
in plants by altering the ionic capacity of the water medium. Depending on plant species
sensitivity symptoms of ammonia toxicity appear with external ammonia concentrations
above 0.1 - 0.5 µmol/L (Britto and Kronzucker 2002). Plants can uptake nitrate build up
in fish systems serving as a natural filter that can generate profits simultaneously with the
fish. Ammonia (NH3–NH4+) is oxidized by Nitrosomonas spp. to nitrite (NO2
-) (Timmons
et al. 2002). Ammonia nitrogen assumes two forms dependent on the pH of the water. A

29
higher pH will shift ammonia concentration to the ionized form (NH4+) which is more
toxic to fish (Timmons et al. 2002). Nitrite is then oxidized by Nitrobacter spp. to nitrate
(NO3-) which is taken up by the lettuce plants for growth (Broadly et al. 2003). A
mechanical filter is used to remove large particulate matter from the fish wastes prior to
being processed by the biological filter. Removal of large particulate matter prior to
biological filtration will reduce heterotrophic bacteria populations (Losordo 1999), thus
reducing competition with nitrifying bacteria and promoting conversion of ammonia to
nitrate (Timmons et al. 2002). The nitrogen is removed from the system when the plants
are harvested. The nitrification process is an acid forming process which releases H+ in
turn increases the pH of the water (Timmons et al. 2002). Calcium hydroxide and
potassium hydroxide, are used for pH stabilization of aquaponic systems (Rakocy et al
2006). Optimum pH for nitrifying bacteria is between 7.0-7.8 (Tyson et al. 2007).
Dissolved oxygen levels should not go below 2.0 mg/L for optimal performance. One
gram of NH3-N requires 4.57 grams of oxygen (Parker 2002). Temperature can also
regulate the performance of nitrifying bacteria with optimum ranges from 20-30oC. The
rate of nitrification (grams nitrogen per m2 per day) for a trickling filter in relation to
temperature can be expressed by the following equation R = 140 + 8.5 * ToC (Parker
2002) for nitrogen digestion and conversion. The fish component of an aquaponics
system provides the water with nutrients via feeding and excretion. Nutrient byproducts
from fish production systems can and have been utilized as a natural fertilizer for
hydroponic plant production (Lewis 1978).
The nutrients in the system can achieve a steady state with given inputs (feed) and
outputs (fish, plants, particulate matter). The concept of aquaponic systems is to balance

30
the nutrients within a given system so that there is no excess accumulation of nutrients,
nitrogen in particular. Nutrients are delivered to the system via feed which is consumed,
assimilated and excreted by the fish. Balancing the amount of nutrients produced from
the fish system with the nutrient requirements of the plants can lead to optimized resource
utilization and system productivity. Excess nutrients can decrease water clarity thus
initiating algal, fungal or bacterial growth (Timmons 2002, Losordo et al. 1999). In
aquaponics systems, dissolved waste nutrients from the aquaculture system are retained
within the aquaponics system and absorbed by the plants (Rakocy et al. 2006). Therefore,
it is necessary to develop an optimal ratio of fish density to plant density for an
aquaponics system that can be scaled up to a commercial level. The filtration components
are the pillar of which the aquaponics system is built on. Determining the nutrient inputs,
the biological processes within the system, and outputs will help elucidate the efficiency
and performance of an aquaponics system.
PROJECT GOALS AND OBJECTIVES
Aquaponics systems conserve water, land, and protein needed to produce an
edible product. Conservation of resources (primarily water) will be essential in the future
in order to produce the amount of food required to supply the world food demand. In the
United States the implementation and support from government agencies to develop
environmentally sound food production practices will help develop and establish the
industry and potentially free up water for other uses other than food production. The goal
of this study was to prove that aquaponic systems can produce lettuce of equal growth
and quality compared to hydroponic lettuce production and determine the stocking

31
density ratios of fish and plants. The project had four objectives. The first objective was
to determine the biomass production (fish and plants) that can be achieved per unit of
feed to develop fish to plant density ratios. Prior research has focused on fish to plant
ratios in systems that grow multiple crops, or systems that are not in controlled
environments. This research will elucidate the fish to plant ratios of lettuce and determine
an optimal protocol for production. A design ratio for scaling up the aquaponic system
was developed. The concentration of ammonia and nitrate nitrogen in the water was
analyzed to determine when the level of feed input to the system reached a steady state
with a given density of fish and plants. It is important to determine the individual

32
Figure 1. Picture of the University of Arizona’s controlled environment aquaponics greenhouse. The greenhouse structure (A), the fish bay (B), and the hydroponic plant bay (C).
A
B
C

33
cropping requirements to establish an efficient use of resources and produce optimal
quality produce.
A state of the art controlled environment aquaponics research greenhouse was
designed and engineered for intensive fish and vegetable production at The University of
Arizona (Figure 1). A controlled environment aquaponics greenhouse was constructed to
run experiments on the growth and quality of lettuce. The aquaponics system design was
based on the fish to plant ratios developed in the first experiment. A Computer system
was utilized for monitoring and control of environmental parameters. Environmental
monitoring and control consists of air temperature, relative humidity and photosynthetic
active radiation (PAR). Water temperature, pH, electrical conductivity, and dissolved
oxygen are monitored and controlled. The complete water chemistry of the system was
analyzed on a weekly basis. An aquaponics greenhouse system to allows for analysis of
fish and plant growth under consistent and optimal environmental conditions. A
biological and mechanical filtration system processed the fish excretion (Figure 2).
The second objective of the study was to compare lettuce grown with aquaponic
water and hydroponic solution under the same environmental conditions. A comparison
of lettuce growth was conducted to determine if there is a difference in growth in lettuce
grown with aquaponic fish water and hydroponic solution. The water chemistry was
analyzed throughout the trials. The nutrient depletion in the aquaponics system was
observed. A supplementation protocol was developed to increase the targeted nutrient
concentrations in the aquaponics water to levels required for optimal plant growth. The
third objective of the study was to compare the quality of the lettuce grown with
aquaponics water and hydroponic solution. A comparison of the chlorophyll

34
Figure 2. The filtration system for the University of Arizona controlled environment aquaponics greenhouse. A Polygeyser™ PG7-PR filter from International Filter Solutions was used to remove particulate matter from the aquaponics water. A biological filter was constructed to supplement the PG7 filter. The sludge from the aquaponics system was collected.

35
concentration index (CCI%) was conducted to determine if there was a difference in
CCI% in the leaves of lettuce grown with aquaponics water with supplementation and
hydroponic lettuce solution. The fourth objective was to determine the nitrogen
partitioning in the aquaponic system and to compare the nutrient composition of lettuce
grown with aquaponics water with supplementation and hydroponic solution. The
nitrogen in the aquaponic system was introduced through the fish feed then converted by
the fish, consumed by bacteria, retained in the fish sludge, and converted by plants. Each
component utilizes the nitrogen in the system. Prior research has focused on the nitrogen
conversion of fish, bacteria, and plants. However, the nitrogen partitioning in an
aquaponic system has not been established and the amount of nitrogen remediation that
can be achieved in an aquaponic system had not been outlined.
The information gathered throughout this study can be applied for agricultural
business development and environmental remediation. The greenhouse and aquaculture
industries can utilize information on aquaponics and farm integration to develop farms of
the future that will have to be able to produce food in less land with less available
resources. The information from nitrogen partitioning in an aquaponic system can be
used to determine the amount of plants that would be needed to bring residual ammonia
and nitrate-nitrogen concentrations down from current aquaculture effluents to accepted
Environmental Protection Agency (EPA) standards, adhere to Best Management
Practices (BMP), and recirculate water to reduce water usage. Currently, diminishing
fresh water resources and increased food demand from increasing populations has put
pressure on the agriculture industry. Fish effluent is a sustainable and efficient nutrient
source for plant production and plant uptake and deposition of nutrients is an
36
environmentally friendly means of filtration. Aquaponics systems have the potential to
produce fish and vegetables in a sustainable manner with minimal environmental impact.
This information will lead to more conservative agricultural practices that maximum
production. Benefits from the development and optimization of aquaponic and integrated
systems include the conservation and efficient use of resources, and reduced
environmental impacts.
Aquaponics Research Greenhouse Design
The aquaponics research greenhouse was constructed at The University of
Arizona’s Controlled Environment Agriculture Center. A schematic of the hardware
system for the fish (Figure 3) and lettuce (Figure 4) are provided. The University of
Arizona Aquaponics Greenhouse (UAAG) structure was developed and operated by the
UA-CEAC and is a free standing steel A-frame greenhouse with a double wall
polycarbonate glazing. The greenhouse is oriented in a north-south configuration. The
height to the gutter is 2 meters and height to the ridge is 4 meters. The greenhouse is
divided into three separate 7.6 meter by 7.4 meter compartments, each with individual
environmental controls. Double wall polycarbonate panels are used to divide the
greenhouse. The north section houses the fish aquaculture and water filtration systems
and the two south bays house the hydroponic beds.
The aquaculture component of the UAAG is comprised of four 1,300 liter
growout aquaculture tanks, four 190 liter fry and fingerling tanks, and a 3,200 liter gallon
water collection tank. The aquaculture component consists of a total of 9,160 liters. The

37
tanks were designed and fabricated by GSE Incorporated (Houston, TX USA). The water
from the fish aquaculture and plant hydroponic systems drains into the collection tank. A

38
Sump
Polyg.
Sink
NileTilapiaO.niloticus
NileTilapiaO.niloticus
RedTilapiaO.spp
Tilapia Polyg.
FryFry FryFry
Fry
Bf.
Sg
Bf.
1
2
3
3
NileTilapiaO.niloticus
Sg
1 2
Sump
H2O
Air
Polygeyser FilterMechanical / Biological Filtration(32 scfh) air injection for backwash
(15 min.) (0.23 m3 media)
S
S
Biofilter
0.2m3 Bioball media
Sludge
Sensors
Camera
0.19 kW Pump 1 - Fish System 5.7 l/s
0.19 kW Pump 2 - Hydro Beds 5.7 l/s
0.38 kW hp Blower - Air blower
60 - 80 kg per tank
1.3 m3
0.19 m3
3.2 m3
Figure 3. Aquaponics research greenhouse fish section design. Figure legend lists the fish and filtration system components.

39
Hydroponic BedL.sativa
Hydroponic BedL.sativa
Bed = ( 2.4m x 4.8m x 0.46m) = 5,436 litersEach bed = 7 Plant Boards 62 plants / board (15 cm off center)Total Plants / Bed = 434 Total Plants / Bay - 868 Total Plants (bay 2 & 3) = 1,736Total liters of H20 / Plant Bay = 10,872 litersTotal liters for Plant Bays 2 & 3 = 21,743 liters2 swamp coolers per plant bay
Figure 4. Aquaponics research greenhouse plant section design. Figure legend lists the schematics of the hydroponic plant beds. Yellow represents airlines for oxygen delivery, and blue represents water flowing to the hydroponic beds and back to the fish component.

40
Sweetwater® Centrifugal 1.1 kW pump (Aquatic Eco-Systems Inc. Apoka, FL USA)
delivers water back to the fish aquaculture system at a rate of 340 liter/minute. A
Sweetwater 0.9 kW regenerative blower was used to provide aeration to the fish tanks,
biological filter, water collection tank and hydroponic beds. Aero-Tube™ (Tekni-Plex
Inc. Ridgefield, NJ USA) perforated aeration tubing lined the inner perimeter of the
growout tanks to provide aeration. Air stones (15 cm x 4 cm) were used to provide
aeration to the fingerling tanks. Water from the fish aquaculture system was filtered
through a mechanical and a biological filter prior to being distributed to the plants. A
Polygeyser™ PG7-PR filter from International Filter Solutions (IFS) (Marion, TX USA)
served as the mechanical filter and a biological filter. The PG7 was plumbed inline with
an additional 189 L container filled with Bio-Spheres™ (Aquatic Eco-Systems Inc.
Apoka, FL USA) and lined with Aero-Tube™ to provide additional biological filtration.
The biological filter contained approximately 0.3 m3 of bio-ball filter media for
supporting the maximum fish load (150 kg). Trickling biological filters can convert
approximately 1-2 grams of nitrogen per square meter per day (Parker 2002). A HiBlow
(HiBlow USA Inc. Saline, MI USA) HP-80 linear air pump delivered air to the PG7 filter
at a rate of 1.13 m3 per hour for backwashing the beads. The filter was purged daily.
Typically five liters of sludge were removed from the system per filter purge.
Each hydroponic bed contained 1,400 l of water. An AquaFlo 0.19 kW pump
delivers water to the four hydroponic plant beds at a rate of 340 liters / minute (85 liters
per minute per bed). The water was constantly in circulation between the aquaculture and
hydroponic sections. There are two plant growing bays, each plant bay contains two
hydroponic beds. One of the hydroponic beds was used to produce the plants for the

41
experiment. The second hydroponic bed was used to maintain proper fish to plant ratios
throughout the trials. Two hydroponic treatments which included lettuce plants grown
with aquaponics nutrient solution, and the other with a standard hydroponic lettuce
nutrient solution were established for each trial. Two replications of the standard lettuce
hydroponic nutrient solution were established by submerging two 0.61 meter by 1.22
meter acrylic boxes into the aquaponic beds and filling them with the standard
hydroponic lettuce nutrient solution. This procedure maintained similar water
temperature and atmospheric conditions (air temperature, relative humidity, and PAR) for
the aquaponics and hydroponic plant nutrient treatments.
The experiments were conducted from January through May 2009. The
aquaponics system was designed to operate to produce tilapia (O. niloticus) for harvest on
a monthly basis and for lettuce to be harvested on a weekly basis. Fish tank density
ranged from 30 – 80 kg per tank depending on fish growth and/or planting density. Fish
are grown to harvest at one kilogram. Previous studies conducted at the University of
Arizona Environmental Research Lab determined that 5 kilograms of fish fed 2%
biomass per day throughout the growth cycle of lettuce would yield 32 heads of lettuce
per square meter (Licamele et al 2009).
The input and output resources of the aquaponic system that are required to produce fish
and lettuce are shown in Figure 5. The primary resources needed for fish growth are feed
and water. The primary resources needed for plant growth are water, nutrients (from the
fish), and sunlight. The three main outputs of the system are fish, lettuce, and the sludge
collected from the filtration system. Other inputs into the system include energy for
moving water, energy for heating and cooling, oxygen (aeration) for fish respiration, and

42
air (carbon dioxide) for photosynthesis. Water is lost solely through evaporation from the
system and transpiration from the plants. The schematic also outlines the consumption
and generation of oxygen and nitrogen in the system. Oxygen is consumed by the
biological organisms in the system. Nitrogen is introduced via the fish feed and then
processed by the fish and filtration into dissolved nitrate-nitrogen. In an aquaponics
system resources are conserved over time. The water is recirculated in the system from
the fish (nutrient charge) to the plants (nutrient sink).
Hypothesis and Specific Aims
The focus of this dissertation is to present an integrated farming technique which
can increase resource use efficiency without reducing production. The goal was to be able
to produce food from freshwater that to sustain the world population’s food demand.
Lettuce can be grown hydroponically using aquaponics fish water. The fish to plant ratio
required to grow lettuce with minimal nitrogen retention in the system was evaluated. It
was hypothesized that lettuce can be grown hydroponically utilizing aquaponics fish
water and additional supplementation to achieve equal growth and quality of lettuce
grown within traditional hydroponic fertilizer solutions. The growth and quality (as
determined by the chlorophyll concentration in leaves) of lettuce grown with aquaponic
fish water and supplementation was compared to the growth and quality of lettuce grown
in a hydroponic solution. The environmental conditions were monitored and controlled to
achieve optimal plant growth. It was hypothesized that integrating plant production with
fish aquaculture effluent can significantly reduce the potential ammonia-nitrogen and
nitrate-nitrogen concentrations in aquaculture water. The amount of nitrogen deposited in

43
the leaves of the lettuce plants was determined and the potential nitrogen remediation was
calculated.

44
INPUTS
- Energy (solar / electrical)- Feed / Nutrients- Water- Air - Oxygen- Labor
MechanicalFilter
O2 cons.
BiologicalFilter
OUTPUTS
- Lettuce- Fish
- Sludge
AQUACULTURE
Tilapia(Oreochromis niloticus)
HYDROPONICS
Lettuce(Lactuca sativa)
SludgeCollection
SumpDataCollection
SwampCooler
Heaters
Energy
Hot/Cool Air
Energy Lost
Evaporation
SolarEnergy
Feed ConsumedAmmonia - NitrateProduced
O2 consumed
CO2 produced
Nitrate and NutrientsConsumed
Oxygen consumedat root zone
O2 produced
CO2 consumed
Transpiration
Figure 5. Flow chart of the inputs and outputs of an aquaponics system. The three primary outputs are fish, lettuce, and processed fish sludge. Inputs include water, feed (nutrients), and sunlight. Energy is also utilized for moving water and delivering oxygen to the water.

45
PRESENT STUDY
OVERALL SUMMARY
The contributions of this dissertation are included in three manuscripts, each in a separate
appendix. Each manuscript includes an introduction, methods, results and discussion. The
following is a summary of the most important findings of each manuscript.
OPTIMAL FISH (Oreochromis niloticus) TO PLANT (Lactuca Sativa CV. REX)
RATIOS FOR A CONTROLLED ENVIRONMENT AQUAPONICS SYSTEM
(APPENDIX A)
The goal of the first study was to determine the optimal stocking density of tilapia
to grow a square meter of lettuce crops (32 lettuce heads at 15 cm spacing). Experiments
were conducted at the University of Arizona’s Environmental Research Lab (ERL) in the
fish greenhouse. Preliminary experiments were conducted to test the efficacy of different
hydroponic plant cultivars and to let the system mature so the biological organisms in the
filter and system could be established. A randomized block experimental design was used
to determine if there was a significant difference in growth of lettuce (L. sativa cv. Rex)
that were fed nutrients from three different stocking densities of tilapia (O. niloticus).
Nile tilapia (O. niloticus) and Butterhead Lettuce (L. sativa cv. REX) were used in
the aquaponics experiments. Tilapias were stocked into their respective total tank
biomass densities of 2 kg m-3, 5 kg m-3 and 8 kg m-3 of fish per cubic meter. Prior
experiments conducted at the ERL revealed that approximately one kilogram of fish feed
can yield 20 heads of lettuce (Fitzsimmons 1992). Fish were fed 2% of the total stocking
biomass daily throughout the trials. Treatments received 40 grams, 100 grams or 160

46
grams of feed per day depending on the tank stocking biomass. A total of 1.4 kg of feed
was fed to each replicate of the 2 kg m-3 fish biomass treatment. A total of 3.5 kg of feed
was fed to each replicate of the 5 kg m-3 fish biomass treatment. A total of 5.6 kg of feed
was fed to each replicate of the 8 kg m-3 biomass treatment. Tilapias were fed a Star
Milling Company Tilapia Diet. The tilapia diet was comprised of 32% protein, and
delivered nutrients to the fish and then the lettuce plants. A nutrient analysis of the fish
feed determined the amount of individual nutrients that are delivered to the aquaponics
system via the feed.
Fish biomass and FCR was determined for each experimental replicate. The fish
were weighed and stocked in their respective tanks three days prior to the beginning of
the experiment and were harvested at day 37. The mean initial stocking weight of fish (O.
niloticus) for the aquaponics experiment was 202.68 ± 30.35 grams per fish. Fish were
stocked at mean densities of 10.67 ± 2.89 fish per tank for the 2 kg m-3 treatments, 27.33
± 1.15 fish per tank for the 5 kg m-3 treatments and 33.67 ± 0.58 fish per tank for the 8 kg
m-3 treatments. There was a total of 15 data plants per treatment replicate (n = 15). Border
plants were excluded in the experimental analysis. The aquaponics plant trials lasted 35
days which is the time it takes for the lettuce to reach harvest weights of approximately
150 grams.
It was determined that 5 kg m-3 of Nile tilapia (O. niloticus) fed 2% of their body
weight daily will yield on average 4.7 kg of lettuce (L. sativa cv. Rex) in 35 days. The
lettuce from the 2 kg m-3 fish density treatment had similar wet weight as the 5 kg m-3
fish density treatment, however the dry weight was significantly (P<0.05) higher for the 5
kg m-3 treatment. The coloration of the lettuce leaves from the 2 kg m-3 fish treatment

47
was a pale yellow compared to the 5 kg m-3 fish treatment indicating nutrient deficiency
and less chlorophyll content. The 5 kg m-3 fish treatment had significantly more head dry
weight at harvest indicating more vegetative biomass. There was a significant difference
in biomass accumulation of dry weight of the lettuce head between the 5 kg m-3 fish
treatment and the other treatments. The 5 kg m-3 fish treatment yielded the most
marketable lettuce biomass per square meter of deep bed hydroponics lettuce. The lettuce
was greener and more marketable from the 5 kg m-3 fish treatment as well. The 2 kg m-3
fish treatment had a net yield of 0.65 kg of fish and 4.32 kg of lettuce. The 5 kg m-3 fish
treatment had a net yield of 1.58 kg of fish and 4.65 kg of lettuce in a 35 day harvest
cycle. The total biomass of fish and plant production for the 5 kg m-3 fish treatment was
6.23 kg of both fish and plants. For the 5 kg m-3 fish treatment the ratio of net fish
biomass to harvestable lettuce biomass is 0.34 (1.58 kg fish biomass / 4.65 kg lettuce
biomass). It will take approximately 0.34 kg of fish biomass to yield 1 kg of harvestable
lettuce biomass. One kilogram of fish will yield 2.94 kilograms of lettuce. These are the
production expectations for the species of fish (O. niloticus), the fish feed and feeding
rate (2%), plant cultivar (L. sativa cv. Rex), deep bed hydroponic system, mean daily
PAR of 28.64 mols m-2, and mean air temperature and water temperature of 27.1oC and
24.4oC respectively.

48
COMPARISON OF LETTUCE (Lactuca sativa CV. REX) GROWN WITH
TILAPIA (Oreochromis niloticus) EFFLUENT AND NUTRIENT
SUPPLEMENTATION VERSUS A HYDROPONIC SOLUTION (APPENDIX B)
The goal of this study was to determine if there is a significant difference in
growth (head wet weight and head dry weight) and leaf chlorophyll content index
(CCI%) between lettuce (Lactuca sativa cv. Rex) grown with aquaponics water and
nutrient supplements versus a hydroponic solution. A recirculating aquaponics system
was engineered and designed at The University of Arizona’s Controlled Environment
Agriculture Center to grow tilapia and lettuce. Tilapia (Oreochromis niloticus) were
grown in an intensive recirculating aquaculture system conjoined with deep bed
hydroponic lettuce (L. sativa cv. Rex and Tom Thumb). In all trials, aquaponics water
with the proper nutrient supplementation can yield equal or greater biomass and CCI% as
compared to growth in conventional hydroponic solutions. Mean wet weight for
aquaponics lettuce (176.75 ± 31.04 grams) was equal to or greater than lettuce grown
with hydroponic solution (148.55 ± 21.71 grams). The CCI% for lettuce grown from
aquaponic water plus supplements (9.89 ± 0.89) was not significantly different (p≤0.05),
or significantly greater (p≤0.05), than lettuce grown in hydroponics solution. The efficacy
of utilizing aquaponics water as a base nutrient source for hydroponic vegetable
production was demonstrated. Integrating fish and plant production will lead to utilizing
resources more efficiently thus delivering more sustainable food production with less
environmental impacts. Aquaponic system with proper supplementation can yield lettuce
of equal biomass and quality to conventional agriculture and hydroponic applications.

49
The University of Arizona aquaponics research greenhouse was designed to
produce tilapia (O. niloticus) for harvest on a monthly basis and lettuce to be harvested
on a weekly basis. Fish tank density ranges from 30 – 80 kg per tank depending on fish
growth and/or planting density. Fish are grown out to 1 kg for harvest. It was determined
from previous studies conducted at the University of Arizona Environmental Research
Lab that 5 kilograms of fish fed 2% biomass per day will yield 32 heads of lettuce
(Licamele et. al. 2009).
The aquaponics system was online for 7 months prior to the onset of the
experimental trials. During the experimental trials there was an initial stocking density of
a total of 105 kg of fish supplying 21 m2 of plant growing area (128 lettuce heads a
week). One growout tank had 30 kg of fish, a second had 30 kg of fish, a third was
stocked with 35 kg of fish, and a fourth was stocked with 15 kg of fish. Mean fish weight
at stocking was 310 grams per fish. Fish feeding was the same throughout the trials. Fish
were fed 2% of the standing biomass daily (2.1 kilograms). Fish were harvested
throughout the trials and the mean Feed Conversion Ratio (FCR) and mean survival was
recorded for the aquaponics system. Fish were harvested, or sorted and put back into the
respective tanks for further growout and maintaining system biomass load for plant
growth.
Nutrient supplements were added to the aquaponics system throughout the trials
to maintain targeted water chemistry parameters. One kilogram of Dolomite 65 Ag Lime
was added to the sump every two weeks to maintain a pH of 6.8. Dolomite is comprised
of 22.7 % calcium and 11.8% magnesium. Organic Materials Review Institute (OMRI)
certified Biomin® amino acid chelated minerals were provided by JH Biotech™. During

50
the first week of the first trial 275 ml of Biomin® iron (5%) and 50 ml of Biomin® Zinc
(7%) were added to the aquaponics system. The second week of the first trial 275 ml of
Biomin® iron (5%), 50 ml of Biomin® Zinc (7%), and 50 ml of Biomin® Manganese
(5%) were added to the aquaponics system. In the second trial during the second week,
and the first week of the third trial, 800 ml of Biomin® iron (5%), 50 ml of Biomin®
Zinc (7%), and 50 ml of Biomin® Manganese (5%) were added to the aquaponics
system. In the third week of the third trial 100 ml of Biomin® iron (5%) and 50 ml of
Biomin® Manganese (5%) were added to the system. Levels equal to or greater than 0.01
mg/l of all nutrients were maintained in the aquaponics water throughout the entire
duration of the third trial. The supplements were added to the sump and allowed to
dissolve into the system for 24 hours before taking a water sample. A hydroponic
solution was formulated for lettuce and used in the hydroponic treatments. A 500 ml
water sample was collected every week from the aquaponics system and sent to the lab
for analysis. Water samples were tested by the Soil and Plant Laboratory Incorporated
(Santa Clara, California).
Lettuce seeds were transplanted one week after germination into the hydroponic
boards. Three trials were conducted for this experiment. The wet weight (grams) was
measured at harvest (28 days after transplant) and samples were dried in a drying oven at
50oC for 72 hours before dry weight (grams) was measured. The Chlorophyll
Concentration Index (CCI %) was measured on three different leaves with an Apogee
CCM-200 prior to harvesting for each data plant. Lettuce was harvested 35 days after
transplant for the first trial. The transplant time for the following two trials was changed
to 28 days because head market weights were achieved more quickly. There were six data

51
plants per treatment with two replicates for each aquaponic and hydroponic treatment per
trial. This totaled 12 data plants for the aquaponic treatment and 12 data plants for the
hydroponic treatment per trial for trials one and two. Trial three there were 24 data plants
per treatment for L. sativa cv. Rex. At the end of the trials the fish growout tanks were
harvested, weighed (kg) and restocked with fish accordingly. The mean final weight (kg)
and feed conversion ratio (FCR) was calculated for the tilapia fish aquaculture
component. The data was analyzed using a paired t-test.
The system nutrients reached a steady state after 6 months of producing lettuce
and fish prior to the onset of the experimental trials. A protocol to maintain pH and
proper water chemistry parameters was developed. Iron, zinc, and manganese had
reached minimal levels (<0.01) and were targeted for nutrient additions. The water
chemistry analysis for the first trial revealed that the nitrate-nitrogen (NH3-N)
concentration ranged from 18 mg/l to 65 mg/l throughout the duration of the trials. The
nitrate-nitrogen concentration for the second trial ranged from 18 mg/l to 62 mg/l and the
third trail ranged from 48 mg/l to 89 mg/l. Ammonia was not present in the first trial and
reached a level of 1 mg/l near the end of the second and third trials. The iron
concentration in the aquaponics water ranged from 0.00 mg/l to 0.13 mg/l. The
concentration of manganese ranged from 0.00 mg/l to 0.17 mg/l. The concentration of
zinc in the aquaponics water trial ranged from 0.00 mg/l to 0.05 mg/l. Throughout the
duration of the third trial iron, manganese and zinc maintained detectable levels (>0.01
mg/l) in the aquaponics system water.
The first trial lettuce (L. sativa cv. Rex) was analyzed to determine if there was a
significant difference in head wet weight (grams), head dry weight (grams), and CCI%.

52
The mean chlorophyll concentration index of L. sativa cv. Rex was 10.1% ± 0.90% for
the aquaponics treatment and 11.4% ± 0.95% for the hydroponic treatment. There was no
significant difference (p≤0.05) in mean head wet weight (grams) and mean head dry
weight (grams) for the Rex cultivar grown with aquaponics and hydroponic solution.
There was a significant difference (p≤0.05) in the mean chlorophyll concentration index
(%) between the L. sativa CV. Rex grown with aquaponics water and hydroponic
solution.
The second trial consisted of a comparison of the Rex cultivar grown in
aquaponics water plus supplements and hydroponic solution. The mean head wet weight
and mean head dry weight were significantly different (p≤0.05) between lettuce grown
with aquaponics solution plus supplements and hydroponic solution. The aquaponic
lettuce had a greater mean head wet weight (182.79 ± 26.90 grams) and mean head dry
weight (6.29 ± 0.74 grams at harvest). There was no significant difference (p≤0.05) in
CCI% between L. sativa cv. Rex grown with aquaponics water plus supplements and
hydroponic solution. The mean CCI% for the aquaponics lettuce was 8.5% ± 0.63% and
the mean CCI% for the lettuce grown with the hydroponic solution was 8.8%± 0.65%.
The third trial was another comparison of the Rex lettuce cultivar. The mean head
wet weight was significantly different (p≤0.05) between lettuce grown with aquaponics
solution plus supplements and hydroponic solution. The aquaponic lettuce had a greater
mean head wet weight (176.75 ± 31.04 grams) than the hydroponic lettuce at harvest. The
mean head dry weight was not significantly different (p≤0.05) between lettuce grown
with aquaponics (4.36 ± 0.78 grams) solution plus supplements and hydroponic (4.60 ±
0.60 grams) solution. There was a significant difference (p≤0.05) in CCI% between L.

53
sativa cv. Rex grown with aquaponics water plus supplements and hydroponic solution.
The men CCI% for the aquaponics lettuce was 9.89 ± 0.89% and for the hydroponics
lettuce was 8.71 ± 0.45%.
Fish tanks were harvested at the end of the trials. The mean FCR for the fish was
2.56 ± 0.64 and mean fish survival was 82.94% ± 0.07. Fish stocking densities of 110 and
114 fish per growout tank yielded a lower FCR (3.03 and 2.82 respectively) than tanks
stocked with 80 fish (1.83). There were no mortalities from the supplement additions or
other water chemistry parameters.
NITROGEN REMEDIATION AND NUTRIENT DYNAMICS IN A
CONTROLLED ENVIRONMENT AQUAPONICS SYSTEM (APPENDIX C)
The goal of this study was to determine if there is a significant difference in
nutrient composition of lettuce (L. sativa cv. Rex) grown with aquaponics water plus
nutrient supplementation and hydroponic solution. The nutrient dynamics of the
aquaponic system was examined through water chemistry analysis. The nutrient flows
were monitored and tailored to achieve nutrient concentrations for optimal plant growth.
The amount of nitrogen removed from the aquaponics system through lettuce biomass
accumulation was determined. In conclusion, aquaponics water plus supplementation can
grow L. sativa cv. Rex with equal biomass accumulation and chlorophyll concentration
index. This indicates that aquaponics lettuce can be produced with similar yield and
quality compared with conventional hydroponic solutions when proper supplementation
is added.

54
One head of L. sativa cv. Rex (176.75 ± 31.03) will deposit approximately 5.96
grams of nitrogen (3.38% per dry gram lettuce). One kilogram of fish will yield 6.4
lettuce heads (1,128 grams) and fixate 38.13 grams of nitrogen. There was a significant
increase (p ≤ 0.05) in percent composition of the micronutrients zinc, manganese, and
boron in the leaves of lettuce (L. sativa cv. Rex) grown with aquaponics water compared
to lettuce grown in hydroponic solution. The mean head wet weight was significantly
different (p≤0.05) between lettuce grown with aquaponics solution plus supplements and
hydroponic solution. The aquaponic lettuce had a greater mean head wet weight (176.75
± 31.04 grams) than the hydroponic lettuce at harvest. The mean head dry weight was not
significantly different (p≤0.05) between lettuce grown with aquaponics (4.36 ± 0.78
grams) solution and hydroponic (4.60 ± 0.60 grams) solution. There was a significant
difference (p≤0.05) in CCI% between L. sativa cv. Rex grown with aquaponics water
plus supplements and hydroponic solution. The men CCI% for the aquaponics lettuce
was 9.89 ± 0.89% and for the hydroponics lettuce was 8.71 ± 0.45%. The mean FCR for
the fish was 2.56 ± 0.64 and mean fish survival was 82.94% ± 0.07. Fish stocking
densities of 110 and 114 fish per growout tank yielded a lower FCR (3.03 and 2.82
respectively) than tanks stocked with 80 fish (1.83). This research also determines that
lettuce (L. sativa cv. Rex) can be grow with aquaponics water plus nutrient
supplementation and yield adequate nutritional value compared to lettuce grown in a
hydroponic solution.
A nitrogen model was constructed for the aquaponics system. For every kilogram
of feed put into the system, 59.7 grams of nitrogen was added to the system. A total of
2.1 kg of fish feed was added to the system daily. Approximately 125.37 grams of

55
nitrogen were added to the aquaponics system daily via the feed (5.97% nitrogen in feed).
There was a total of 4.39 kg of nitrogen introduced to the aquaponics system over the 35
day experiment. The fish digest 90% of the proteins in the feed (Timmons et al. 2002)
which was comprised of 5.97% nitrogen. Aquaponics lettuce was comprised of 5.22%
nitrogen. There was approximately 5 liters of sludge per day collected from the
mechanical filter. The sludge was aqueous and consisted of approximately 2% dry sludge
(Timmons et al. 2002). Nitrogen loss that is unaccounted for consists of nitrogen gas,
algae, bacteria and micro fauna within the aquaponics system. The nitrogen model for
this aquaponics system outlines the flow of nitrogen within this system. Nitrogen was
utilized for growth in both fish and lettuce. Nitrogen was also lost in the aquaponics
system via removal of the processed fish sludge. Other nitrogen sinks in the system
consists of bacteria, nitrogen gas, and micro-fauna that reside in the aquaponics system.
This nitrogen loss via these mechanisms was not quantified. The aquaponics system
utilized approximately 93% of the daily nitrogen input with the rest either remaining in
solution as nitrate nitrogen or lost to other mechanisms. The aquaponics system had
residual nitrate nitrogen in the water. Algae did not proliferate in the system because of
the competition of nutrients with lettuce and the constant grazing of algae by the fish in
the fish component. In an aquaponics system nitrogen is either assimilated by organisms
in the system or remains in dilute in the water. Nitrogen is not discharged from the
system in a form that leads to eutrophication.

56
OVERALL CONCLUSIONS AND RECOMMENDATIONS
The objective of this study was to determine if there is a difference in biomass
accumulation and chlorophyll concentration index (CCI%) in lettuce (Lactuca sativa cv.
Rex) grown with aquaponics water plus nutrient supplementation and hydroponic
solution. The second goal of the study was to determine if there is a significant difference
in nutrient composition of lettuce (L. sativa cv. Rex) grown with aquaponics water plus
nutrient supplementation and hydroponic solution. The green coloration in Lactuca sativa
cv. Rex varied between lettuce grown with aquaponics water, aquaponics water with
supplementation, and a hydroponic solution (Figure 3). Tilapia and lettuce were
harvested from the system on a regular basis (Figure 4).
The environmental parameters will affect plant physiology, thus plant growth
(Resh 2001) which will in turn affect the nutrient uptake. Hydroponic nutrient solutions
are formulated for specific plants. Characterizing the water chemistry of an aquaponics
system will enable growers to tailor their aquaponics water with individual supplements
in order to achieve maximum productivity and crop quality. Determining the optimum
water temperature for an aquaponics system is a tradeoff between maximizing fish
growth and plant growth. Water temperatures ranging from 24oC to 28oC will yield good
lettuce production in relation to biomass generation and quality. Nile tilapia will grow at
a better rate at higher temperatures (Chervinski 1982), however in order to obtain optimal
lettuce production temperatures were kept cooler and below optimum (30oC). Decreased
water temperatures (<28oC) can lead to a lower FCR for the tilapia (Timmons et al.
2002). Future studies should be conducted in order to determine the optimal water

57
Figure 6. Picture of lettuce (L. sativa cv. Rex) grown with aquaponics water (A), aquaponics water plus supplementation (B), and hydroponic solution (C).
A
B
C

58
Figure 7. Fish and lettuce grown in the University of Arizona Controlled Environment Aquaponics Greenhouse. Tilapia (O. niloticus spp.) (A), and varieties of lettuce were grown in the aquaponics system including romaine, red and green oak, and butterhead (B). An organic romaine cultivar of lettuce (L. sativa cv. Rom) (C).
A
B
C

59
temperature for an aquaponics system. The cost to heat and cool water to achieve optimal
temperatures for the fish and plants needs to be evaluated. Elevated water temperature set
points for an aquaponics system provide warmer root zone temperatures for the plants.
Further development of aquaponics system will take precise control and monitoring of
the fish, plants, environment, and water chemistry which can be achieved with
greenhouse and filtration technologies.
Fish production was similar and the plant treatments did not seem to have an
effect on growth. In a system of larger magnitude the plant uptake of nutrients can
compete with algae and bacteria thus potentially clearing up water quality for the fish. It
is recommended that 100 grams of fish feed per day will yield 45.1 grams of fish growth
and 132.86 grams of lettuce biomass per day under the specified environmental
parameters. These formulations can be scaled up to fit commercial designs. Changing the
feed can yield different results if the nutrient analysis of the feed is different. Increasing
protein content in the feed for feeding trout or other species would change the ratio of
fish needed to grow one kilogram of lettuce. The amount of feed needed to produce a
kilogram of harvestable head lettuce would be less in terms of nitrogen. However, the
other essential nutrients for proper fish growth might not be present at the same levels in
feeds made of different sources. The nutrient accumulation of other essential nutrients for
growth can also change from the type of fish feed used in an aquaponics system. Nutrient
depletion over an extended period of time in aquaponics systems is common (Rakocy et
al 1993, Seawright et al. 1998). Developing a commercial aquaponics greenhouse
prototype will involve the need for nutrient supplementation not limited to but including
iron (Fitzsimmons 1992, Rakocy et al. 1993 and Seawright et al. 1998).

60
The filtration and biological processing of the fish water for plant nutrient uptake
can also influence the system. Future studies should include the integration of filtration
technologies to remove solids and dissolve solids within the system. Controlled
aquaponic systems can increase productivity, feed use efficiency, and water use
efficiency over conventional farming practices. The ability to produce crops intensively
with minimal to no impact to the environment will be essential in order for human
civilization to be able to meet future food demands without negatively impacting the
environment. Continuous operation of an aquaponics system can lead to the production of
beneficial organisms in the water medium. Bacteria, phytoplankton, and zooplankton can
become established in a system given the correct environmental surroundings and can
increase growth and health of the plants (Sabidov 2004). If beneficial organisms can
thrive in the aquaponics system then it is possible for non beneficial organisms to also
reside in the system given a particular set of environmental surroundings. The balance of
nutrients into the system with nutrient uptake by the target organisms (fish and plants)
can be crucial in establishing beneficial organisms and reducing the establishment of
harmful organisms. These harmful organisms thrive off similar nutrients that the fish and
plants require for growth. Harmful bacteria and algal blooms indicate poor water quality.
Water quality is affected by the nutrients put into the systems, the density of organisms
within the systems, and the biological processing of the water within the system.
Aquaponics water plus supplementation can grow L. sativa cv. Rex with equal or
greater biomass accumulation and chlorophyll concentration index. All of the
macronutrients analyzed remained mostly constant throughout the duration of the
experiment with a slight increase in the end. The micronutrients also remained in steady a

61
steady state again with a very slight increase near the end of the experiment. Sulfate
accumulated throughout the duration of the experiment due to the content in the fish feed
being at concentrations higher than that needed for fish and plant fixation. The L. sativa
cv. Rex lettuce needs nutrient supplementation including iron, manganese and zinc to be
added to the aquaponics water to yield marketable lettuce. The level of the
supplementation in this experiment was sufficient and can possibly be reduced with
further study. A total of 900 ml of Biomin® iron (5%), 100 ml of Biomin® Zinc (7%),
and 100 ml of Biomin® Manganese (5%) were added to the aquaponics system
throughout the growout cycle of the lettuce.
The need for supplementation will depend on the system water chemistry
parameters and the plants nutrient demand. Nutrient requirements can be different for
each plant cultivar and must be evaluated to achieve optimal production and plant health.
Lettuce can be grown consistently in an aquaponics system thus using water, nutrients
and space more efficiently than conventional agriculture leading to a more sustainable
food production system. The aquaponics system has produced lettuce with equal or
greater chlorophyll concentration indices. It was determined that aquaponics water
provides a good source of nutrients for plant growth. The nitrogen, phosphorous and
potassium in the aquaponics system reached a near steady state with the lettuce
production indicating that fish effluent at the densities established can provide a stable
source of macronutrients for plant growth. The micronutrients in the aquaponics system
must be monitored and adjusted to the crop being grown. It is concluded that lettuce
grown with aquaponics water plus nutrient supplementation grows at similar rates to
lettuce grown with hydroponic solutions. Supplementation rates will vary depending on

62
the fish to plant ratio, system design and environmental parameters. Nutrients do not
accumulate at the same rate in relation to each other so certain supplements would be
needed to match the nutrient demand of the target crop. It has been supported that iron,
zinc and manganese accumulate at different rates in aquaponic system (Seawright 1998)
and therefore must be supplemented accordingly. Nutrients can also be recovered from
the solid fish wastes. The sludge from the aquaponics system has a nutrient composition
that can be utilized if applied to field crops, soil amendments, or dissolved back into
solution. By utilizing the fish sludge complete recovery of nutrients from the system can
be achieved.
Lettuce (L. sativa cv. Rex) can be grow with aquaponics water plus nutrient
supplementation and yield adequate nutritional value compared to lettuce grown with
hydroponic solution. Values reported for the nutrient composition in the lettuce are
similar to lettuce grown in conventional agriculture and hydroponics (Resh 2001). The
composition of macronutrients and micronutrients in the growing solution can determine
the nutrient content, growth, and health of lettuce (Resh 2001). Lettuce has a low
efficiency in using nitrogen but needs nitrogen constantly to promote growth (Welch et
al. 1983). Aquaponic systems deliver the amount of nitrogen needed for lettuce growth
allowing for the assimilation of nitrogen through photosynthesis without developing a
build up or sink of nitrogen within the system.
Lettuce and other plant crops prove a valuable remediation tool for fish farming
and aquaculture in general. Greenhouse or conventional agriculture can integrate lettuce
production to existing aquaculture farms to remediate nitrogen and nutrient discharge.
This will in turn generate a marketable product in the lettuce, but reduce the costs for

63
fertilizers and reduce environmental degradation commonly associated with large scale
agriculture. If one kilogram of fish will yield 6.4 lettuce heads (1,128 grams) and deposit
38.13 grams of nitrogen, then a farm can calculate the amount of greenhouse space
needed to remediate the current discharge of fish effluent. The impacts from this can be
tremendous to the environment and costs to farmers. Further research regarding the
production of different crops that require different nutrient demands can lead to different
nutrient supplementation protocols. The OMRI listed nutrient supplement Biomins™
from JH Biotech allowed for specific nutrients to be targeted and added to the system.
This enables the aquaponics system to stay within organic standards by utilizing OMRI
listed nutrient products along with processed fish effluent to produce sustainable organic
vegetables. Future research at the aquaponics greenhouse will focus on integrating
varieties of vegetable crops and tailoring the water chemistry using Biomin™ nutrient
supplementations to produce crops of equal or greater yields to agriculture and
hydroponic systems.

64
REFERENCES
Antoniou, P., J. Hamilton, B. Koopman, R. Jain, B. Holloway, G. Lyberatos and S.A.
Svoronos (1990). Effect of temperature and pH on the effective maximum
specific growth rate of nitrifying bacteria. Water Research. 24 (1): 97-101.
Al-Hafedh, Y. S., A. Alam, and M. S. Beltagi. 2008. Food production and water
conservation in a recirculating aquaponic system in Saudi Arabia at different
ratios of fish Feed to plants. Journal of the World Aquaculture Society. 39(4):
510-520.
Both, A.J., L.D. Albright, R.W. Langhans, R.A. Reiser, and B.G. Vinzant. 1994.
Hydroponic lettuce production influenced by integrated supplemental light levels
in a controlled environment agriculture facility: experimental results. International
Society of Horticulture Science Acta Horticulturae 418: III International
Symposium on Artificial Lighting in Horticulture.
Broadley, M. R., Ido Seginer, Amanda Burns, Abraham J. Escobar-Gutierrez and Phillip
J. White 2003. The nitrogen and nitrate economy of Butterhead lettuce (Lactuca
sativa var. capitata L.). Journal of experimental biology Vol. 54 No. 390: 2081-
2090.
Britto D. T., Herbert J. Konzucker (2002). NH4+ toxicity in higher plants: a critical
review. J. Plant Physiology 159. 567-584.
Chaves, P.A., L.M. Laird, R. Sutherland and J. Beltrao (2000). Assessment of fish culture
water improvement through integration of hydroponically grown lettuce. Water
Science and Technology 42 (1-2) pp. 43-47.
Chervinski, J. (1982). Environmental physiology of tilapias (pp.119-128) In R.S.V. Pullin
and R.H. Lowe-McConnell (eds.), The Biology and Culture of Tilapias. ICLARM
Conference Proceedings 7, Manila, Philippines.
Crozier, A., M.E.J. Lean, M.S. McDonald, and C. Black. 1997. Quantitative analysis of
the flavenoid content of commercial tomatoes, onions, lettuce, and celery. J. Agr.
Food. Chem. 45:590-595.
Dela, D., E. Or, R. Ovadia, A. Nissim-Levi, D. Weiss, and M. Oren-Shamir. Changes in
anthocyanin concentration and composition in jaguar rose flowers due to transient
high temperature conditions. Plant. Sci. 164:333-340.

65
Fitzsimmons, K. M. 1991. Intensive tilapia production integrated with field crops in
Southwest U.S. In:3rd International Symposium on tilapia aquaculture. ICLARM.
Manilla, Philipines.
Fitzsimmons, K. 1992. Fertilizer value of aquaculture effluents and land disposal as a
best management practice. Proceedings from the National Extension Aquaculture
Workshop. Arkansas State 4-H Center. March 3-7 1992.
Fitzsimmons, K. and Posadas, B. 1997. Consumer demand for tilapia products in the US
and the effects on local markets in exporting countries. Pp. 613-632. In: Tilapia
Aquaculture: Proceedings of the Fourth International Symposium on Tilapia in
Aquaculture. Editor. Fitzsimmons, K. Northeast Regional Agricultural
Engineering Service Publication, No. NRAES - 106. Ithaca, N. Y.
Fitzsimmons, K. 2006. Prospect potential for global production. (pp. 51-73) In Chhorn
Lim and Carl D. Webster (Eds.) Tilapia: Biology, Culture and Nutrition. Food
Product Press New York, New York.
Gazula, A., M.D. Kleinhenz, J.G. Streeter, and A.R. Miller. 2005. Temperature and
cultivar effects on Anthocyanin and chlorophyll b concentrations in three related
lollo rosso lettuce cultivars. HortScience 40(6): 1731-1733.
Gonnella, M., F. Serio, G. Conversa, and P. Santamaria. 2004. Production and nitrate
content in Lamb’s lettuce grown in floating system. Acta Hort. 644:61-68.
Gonnella, M., F. Serio, G. Conversa, and P. Santamaria. 2003. Yield and quality of
lettuce grown in floating system using different sowing density and plant spatial
arrangements. Acta Hort. 614
Grube, R.C. and E.J. Ryder. 2003. Romaine lettuce breeding lines with resistance to
lettuce dieback caused by tombusvirus. HortScience 38(4): 627-628.
Hanan, J.J. 1998. Greenhouses. Advanced Technology for Protected Cultivation. CRC
Press.
Hanson, A., J. Yabes, Jr., and L. P. Primavera. 2008. Cultivation of Lemon Basil,
Ocimum americanum, in two different hydroponic configurations supplemented
with various concentrations of Tilapia aquaculture green water. BIOS. 79(3):92-
102.
Hatch U. and H. Kinnucan . Aquaculture: Models and Economics. Westview Press Inc.

66
Boulders, Co 1993.
Islam, A.K.M.S., D.G. Edwards and C.J. Asher (1980). pH Optima for crop growth
results of a flowing solution culture experiment with six species. Plant and Soil
Vol. 54 No. 3 October.
Kohler CC (2000). A white paper on the status and needs of tilapia aquaculture in the
north central region. North Central Region Aquaculture Center March 29, 200.
Lewis, W.M., J.H. Yopp, H.L. Schramm and M. Brandenburg (1978). Use of
Hydroponics to maintain quality of recirculated water in a fish culture system.
Transactions of the American Fisheries Society. Volume 107(1):92-99.
Losordo, T.M., M. P. Masser and J. Rakocy (1999). Recirculating aquaculture tank
production systems. Southern Regional Aquaculture Center (SRAC). SRAC
Publication No. 453.
Ludwick, A.E. 2002. Western fertilizer handbook. 9th edition. Interstate Publ., Danville,
Ill.
Marschner, H. 1995. Mineral nutrition of higher plants 2nd edition. Academic Press,
London, U.K.
Marsic N. K., and J. Osvald. 2002. The influence of different concentration of nitrogen in
nutrient solution on plant growth and nitrate accumulation in aeroponically grown
lettuce (Lactuca sativa). Agrochimica 46:55-65.
McMurtry, M.R., P.V. Nelson, D.C. Sanders, and L. Hodges. 1990. Sand culture of
vegetables using recirculating aquaculture effluents. Journal of Applied
Agriculture Research 54:280-284.
McMurtry, M. R., D.C. Sanders, J.D. Cure, R.G. Hodson, B.C. C. Hanning, and P.C. St.
Amand. 1997. Efficiency of water use of an integrated fish/vegetable co-culture
system. Journal of the World Aquaculture Society 28:420-432.
McPharlin, I.R., R.C. Jeffery, and D.H. Pitman. 1996. Phosphorous requirements of
winter planted lettuce (Latuca sativa) on a karrakatta sand and residual value of
phosphate as determined by soil test. Austral. J. Exp. Agr. 36:897-903.
Obermeier, C., J.L. Sears, H.Y. Liu, K.O. Schlueter, E.J. Ryder, J.E. Duffus, S.T. Koike,

67
and G.C. Wisler. 2001. Characterization of distinct tombusvirus that cause
diseases of lettuce and tomato in the Western United States. Phytopathology
91:797-806.
Parker, Rick 2002. Aquaculture Science, Second Edition. Delmar Albany, New York
2002.
Popma, Thomas and Michael Masser 1999. Tilapia life history and biology. Southern
Regional Aquaculture Center Publication No. 283
Postel, S.L. 2000. Entering an era of water scarcity: The challenges ahead. Ecol. Appl.
10:941-948.
Quillere, I., L. Roux, D. Marie, Y. Roux, F. Gosse, and J.F. Morot-Gaudry 1995. An
artificial productive ecosystem based on a fish/bacteria/plant association. 2.
Performance. Agriculture, Ecosystems and Environment. 53:19-30.
Rakocy, J. E. and A. Nair. 1987. The status of aquaponics. Part 2. Aquaculture Magazine
25:64-70.
Rakocy, J. E., T. M. Losordo, and M.P. Masser. 1992. Recirculating aquaculture tank
production systems: integrating fish and plant culture. SRAC Publication No. 454.
Southern Regional Aquaculture Center, Mississippi State University, Stoneville,
Mississippi, USA.
Rakocy, J. E. and J.A. Hargreaves (1993). Integration of Vegetable Hydroponics with
Fish Culture: A Review. American Society of Agriculture Engineers, St. Joseph,
MI (USA) pp. 112-136.
Rakocy, J.E., D.S. Bailey, C. Shultz and E.S. Thoman (2004). Update on tilapia and
vegetable production in the UVI aquaponic system. Proceedings from the 6th
International Symposium on Tilapia in Aquaculture. Volume 2: 676-690.
Rakocy, J. E., Michael P. Masser and Thomas Losordo 2006. Recirculating aquaculture
tank production systems: aquaponics – integrating fish and plant culture. Southern
Regional Aquaculture Center. SRAC Publication No. 454
Rasband, J., J. Salzman, and M. Squillace. Natural Resources Law And Policy (university
Casebook Series). Foundation Press. New York, New York 2004.
Resh, H. M. 2001. Hydroponic Food Production. Woodbridge Press Publishing
Company. Santa Barbra, CA 93012.

68
Rogers, Peter (2008). “Facing the freshwater crisis” Scientific America. August.
Santamaria, P., E. Antonio, and F. Serio 2002. Effect of solution nitrogen
concentration on yield, leaf element content, and water and nitrogen use
efficiency of three hydroponically grown rocket salad genotypes. Journal of Plant
Nutrition, 25:245-258.
Sabidov, N. A. 2004. Annual report of greenhouse crops program for 2003/2004. CDC
South, Brooks, Canada.
Sabidov, N.A., E. Hutchings, and J.E. Rakocy 2007. Fish and plant production in a
recirculating aquaponics system: a new approach to sustainable agriculture in
Canada. Proc. Int. Conf. & Exhibition on Soilless Culture. Acta Hort. 742:209-
222.
Seawright, D.E., R. R. Stickney, and R. B. Walker. 1998. Nutrient dynamics in integrated
aquaculture-hydroponic systems. Aquaculture. 160:215-237.
Shavart-Sachray, L.D., D. Weiss, M. Reuveni, A. Nissim-Levi, and M. Oren-Shamir.
2002. Increased anthocyanin accumulation in aster flowers at elevated
temperatures due to magnesium treatment. Physiol. Plant 114:559-565.
Simonne, A., E. Simonne, R. Eitenmiller, and C.H. Coker. 2002. Bitterness and
composition of lettuce varieties grown in southeastern United States.
HortTechnology 12:721-726.
Sims, J.T. 1998. Pjospjorous soil testing: innovations for water quality protection. Comm.
Soil Sci. Plant Anal. 29L 1471-1489.
Takeda, F., P.R. Adler, and D.M. Glenn. 1997. Strawberry production linked to
aquaculture wastewater treatment. Proc. Third Int. Strawberry Symp. Acta Hort.
ISHS 439(2):673-677.
Timmons, M.B., J.M. Ebling, F.W. Wheaton, S.T. Summerfelt and B.J. Vinci (2002).
Recirculating Aquaculture Systems 2nd Edition. Northern Regional Aquaculture
Center Publication No. 01-002. Cayuga Aqua Ventures Ithaca, New York.
Tyson, R.V., E.H. Simonne, M. Davis, E.M. Lamb, J.M. White and D.D. Treadwell
(2007). Effect of nutrient solution, nitrate-nitrogen concentration, and pH on
nitrification rate in perlite medium. Journal of Plant Nutrition, 30:901-913.
Watanabe, W. O., T. M. Losordo, K. Fitzsimmons and F. Hanley (2002). Tilapia

69
production systems in the americas: technical advances, trends and challenges.
Reviews in Fisheries Science, 10(3-4): 465–498.
Yoshida, S., M. Kitano, and H. Eguchi. 1997. Growth of lettuce (Lactuca sativa) under
control of dissolved O2 concentration in hydroponics. Biotronics 26:39-45.

70
APPENDIX A: OPTIMAL FISH (OREOCHROMIS
NILOTICUS) TO PLANT (LACTUCA SATIVA)
RATIOS FOR A CONTROLLED ENVIRONMENT
AQUAPONICS SYSTEM
Journal of the World Aquaculture Society
Jason Licamele, Kevin Fitzsimmons and Gene Giacomelli Department of Agriculture and Biosystems Engineering, University of Arizona
The Environmental Research Laboratory 2601 E. Airport Drive Tucson, Arizona 85706

71
ABSTRACT
The goal of this study was to determine the optimal stocking density of tilapia to grow 32
lettuce heads (15 cm spacing). A randomized block experimental design was used to
determine if there was a significant difference in growth of lettuce (L. sativa cv. Rex) that
were fed nutrients from three different stocking densities of tilapia (O. niloticus). Each
experimental treatment was a recirculating aquaponics system totaling 1600 liters. The
fish tank was 1000 liters which flowed to a biological filter, and then a one square meter
hydroponic bed. Three fish densities were stocked with a total biomass of 2 kg m-3, 5 kg
m-3, and 8 kg m-3 of fish and fed 2% of their respective biomass daily. The tilapia diet
was comprised of 32% protein, and delivered nutrients to the fish and then the lettuce
plants. The hydroponic lettuce plot consisted of a square meter area with 32 lettuce
seedlings planted at 15 cm spacing. Environmental parameters (temperature, relative
humidity and PAR) were monitored throughout the experiment. Biomass data of the
lettuce (head wet weight and head dry weight) determined if there was a significant
difference in lettuce yield. The Feed Conversion Ratio (FCR) was calculated for the
different fish stocking densities. Water chemistry was analyzed throughout the
experiments to determine the levels of ammonia, nitrite, and nitrate. The pH, dissolved
oxygen and electrical conductivity were also monitored. Plant biomass data was compiled
to test for a significant difference between treatments via an ANOVA. The data
demonstrated that 5 kg m-3 fish density treatment of tilapia had significantly (P<0.05)
greater lettuce growth (Head dry weight) compared to the 2 kg m-3 treatment for a one
square meter plot of lettuce (32 plants). The water chemistry results demonstrated that
nitrate and phosphate accumulation in the system reached a near steady state in the 5 kg

72
m-3 fish density treatment whereas the ammonia and nitrate continued to accumulate in
the 8 kg treatment. It was concluded that 5 kg m-3 of tilapia will grow 32 marketable
lettuce heads (one square meter plot). The nutrient input (nitrogen) into the system
reached a steady state thus concluding that the amount of nitrogen into the system
reached equilibrium with the nitrogen requirements of the lettuce biomass. It was
concluded that one kilogram of fish fed 2% of its body weight per day will yield 2.94
kilograms of lettuce in a 35 day period under the experiments environmental conditions.

73
INTRODUCTION
Aquaponics has received much interest in recent years. The ability to increase
production through integration of fish aquaculture and plant production has been
demonstrated (Fitzsimmons 1991; Fitzsimmons 1992; Rakocy et al. 1993; McMurtry et
al. 1997; Chaves 2000; McIntosh and Fitzsimmons 2003; Sabidov 2004; Castro et al.
2006; Diver 2006). Coupling fish aquaculture with hydroponic plant culture has been
proven to be feasible and more sustainable than conventional agriculture systems
(McMurtry et al. 1990; Fitzsimmons 1992; Rakocy et al. 1992; Rakocy and Nair 1987;
Rakocy and Hargreaves 1993). The economic feasibility of aquaponic systems for
producing food fish and crops has been evaluated and proven to be potentially profitable
(Rakocy et al. 1997, Adler et al. 2000, Rakocy et al. 2004, Neori et al. 2004). Popular
food crops such as lettuce, basil, tomatoes and strawberries have been successfully
cultivated with the use of fish effluent as the primary fertilizer (McMurtry et al. 1997,
Takeda et al. 1997, Rakocy et al. 2004, Hanson et al. 2008). The success of commercial
aquaponics to consistently produce high quality yields is dependent on the engineering
and design of the biological processes occurring within a given biological system. The
goal of this study was to determine the optimal ratio of fish biomass to lettuce biomass in
a controlled environment aquaponics system. The nutrient cycling in the system occurs
via bio-processing of fish effluent and retention in fish, plants, bacteria, and various
microorganisms. A greenhouse will allow for consistent monitoring and control of
environmental parameters, thus allowing for optimal crop production.
The primary resources used in animal or crop production are water, nutrients,
light, and land. Intensive recirculating aquaculture systems (RAS) can produce more fish

74
per liter of water than other types of aquaculture systems (Timmons et al. 2002). And
greenhouse hydroponics (GHH) production can produce from five to ten times the output
as compared to conventional agriculture (Resh 2001; Hannan 1998). Water from RAS
systems can be used in GHH to intensify production by utilizing resources as efficiently
as possible. Integration of lettuce culture with fish aquaculture systems can reduce water
usage by 20-27% (Chavez et al. 2000). Combining aquaculture with agriculture or
greenhouse crop production can increase food production efficiency. World food demand
is increasing as populations continue to rise and the resources available to produce food
are finite. In order to provide enough food in the future to feed humanity, the
management of those resources must be optimized to produce the most amount of food
per unit of resource.
The integration of a RAS with hydroponic plant production is referred to as
aquaponics. Aquaponic systems incorporate specific design parameters in which the fish
water flows through a mechanical filter, into a biological filter, and then to the
hydroponic plants (Rakocy et al. 2006). Mechanical and biological filtration processes
are important components for RAA (Losordo et al. 1999). The fish component provides
the water with nutrients via feeding and excretion. A mechanical filter is used to remove
large particulate matter from the fish wastes prior to being processed via the biological
filter. Removal of large particulate matter prior to the biological filtration unit will reduce
heterotrophic bacteria populations (Losordo 1999), thus reducing competition with
nitrifying bacteria. The biological filtration promotes the growth of nitrifying bacteria
which converts ammonia to nitrate (Timmons et al. 2002). Ammonia can be toxic to
plants at solution concentrations greater than 0.5 µmol / liter (Britto and Kronzucker
75
2002). Ammonia and nitrite are toxic to fish at high concentrations, however, nitrate is
not (Timmons 2002). After the water is processed it is then delivered to the hydroponic
beds where nutrients are taken up by the plants. Dissolved nutrients from fish are similar
to nutrients used in hydroponics systems (Rakocy et al. 2006). The water then flows to
the sump where it is pumped back to the fish system. Accumulated nutrients in fish
aquaculture systems can lead to algae and bacterial growth that can be harmful to fish and
lead to off flavors (Fitzsimmons 2006).
Maintaining proper water chemistry parameters requires balancing the fish,
nitrifying bacteria, and the plant’s physiological requirements in one system. Tilapia can
tolerate a pH from acidic to alkaline (pH 5-11) (Chervinski 1982) and a wide range of
salinity concentrations (Watanabe et al. 2002). Plants grow best and uptake nutrients at a
lower (5.5-6.5) pH (Resh 2001). Nitrifying bacteria is inhibited below a pH of 6.5 with an
optimum pH at 7.8 (Antoniou et al. 1990) depending on bacterial species and temperature
(Tyson et al. 2007). Electrical conductivity levels range between 1-2 uS cm-1for
hydroponic lettuce production (Resh 2001). Lettuce will grow well at a pH range of 5.5-
6.5 (Resh 2001, Islam et al. 1980). Optimal water temperature for tilapia (O. niloticus)
ranges between 28-35oC (Chervinski 1982) while lettuce grows best at water
temperatures between 21-25oC (Resh 2001). These water parameters can influence the
physiology of the organisms within the aquaponic system and must be monitored and
controlled for optimal system performance. Filtration technologies can be incorporated
into recirculating aquaculture systems or aquaponics systems in order to maintain
optimum targeted water chemistry parameters.

76
The nutrients in the system can achieve a steady state with given inputs (feed) and
outputs (fish, plants, particulate matter). The concept of aquaponic systems is to balance
the nutrients within a given system so that there is no excess accumulation of nutrients,
nitrogen in particular. Nutrients are delivered to the system via feed which is consumed,
assimilated and excreted by the fish. The conversion of feed to usable energy and somatic
growth in fish is 25-30% (Rakocy & Hargreaves 1993). Studies by Quillere et al. (1995)
revealed a 60% nitrogen recovery (fish 31% and tomato plants 28%) from an aquaponics
system. Balancing the amount of nutrients produced from the fish system with the
nutrient requirements of the plants can lead to optimized resource utilization and system
productivity. Excess nutrients can decrease water clarity thus initiating algal, fungal or
bacterial growth (Timmons 2002, Losordo et al. 1999). In aquaponics systems, dissolved
waste nutrients from the aquaculture system are retained within the aquaponics system
and absorbed by the plants (Rakocy et al. 2006). Therefore, it is necessary to develop an
optimal ratio of fish density to plant density. Determining the nutrient inputs, the
biological processes and outputs will help elucidate the efficiency and performance of an
aquaponics system.
Prior research has mapped out the feasibility of aquaponic lettuce production
(Rakocy 1989b, Fitzsimmons 1992, Chaves 2000, Castro et al. 2006, Diver 2006,), ratio
of fish to cropping area (Fitzsimmons 1991, Rakocy et al. 1993), crop feasibility (Rakocy
1989a, Sabidov 2004, Sabidov 2007), nutrient composition (Seawright et al. 1998) and
polyculture of aquatic organisms (Quillere et al. 1995, Neori et al. 2004). Aquaponic
systems are comprised of multiple biological systems (fish, plants, and microorganisms)
functioning synergistically with one another. Design of the aquaponic system will also

77
influence the biological activity of the system. Research that focuses on the individual
system components in a controlled environment can yield insight into the maximum
productivity of aquaponics. Combining greenhouse environmental control with the
recirculating aquaponic system will enable a more controlled analysis of the interactions
between nutrients provided by the fish and plant uptake of those nutrients. This research
integrates two intensive growing systems, RAS and greenhouses to optimize
environmental parameters in order to achieve maximal system efficiency. Lettuce
(Lactuca sativa cv. Rex.) and Nile tilapia (Oreochromis niloticus) were grown in an
aquaponics system to determine the optimal fish to plant ratios. System productivity was
evaluated. Water chemistry analysis allows for determination of the amount of soluble
nutrients in the aquaponics system. The amount of nitrate in the system will be dependent
on the amount of fish feed introduced, which is determined by the fish biomass. The goal
of this study was to determine the optimal fish density that would support a specified
lettuce density for an intensive aquaponics system. Water chemistry analysis (ammonia,
nitrite, and nitrate), plant biomass analysis, and fish growth were analyzed.

78
MATERIALS AND METHODS
Experiments were conducted at the University of Arizona’s Environmental
Research Lab (ERL) in the fish greenhouse. The fish greenhouse glazing consisted of
double layer polyethylene plastics. Greenhouse environmental control consisted of
evaporative cooling and natural gas heating to maintain temperatures throughout the
growing seasons. Environmental parameters (air and water temperature, humidity, and
photosynthetic active radiation) were monitored and controlled for optimal plant
production. Preliminary experiments were conducted to test the effects of different
hydroponic plant cultivars and air temperature set points. The system was allowed to
mature for 8 weeks so the biological organisms in the filter and system could be
established.
EXPERIMENTAL DESIGN
A randomized block experiment was designed to evaluate the difference in plant
growth and nitrate accumulation of aquaponic systems fed nutrients from three different
fish stocking density treatments. A total of nine aquaponic test systems were constructed
consisting of three treatments with three replicates per treatment. Each aquaponic
treatment system consisted of a 1000 liter (1 m-3) fiberglass fish tank plumbed in line to a
95 liter plastic drum which overflowed into a 200 liter plastic drum. This was connected
to a one square meter per growing bed constructed of wood with dimensions 1 meter long
by 1 meter wide by 15.25 cm deep and lined with a black plastic liner. A 5 cm drain was
plumbed at the bottom of the West side of each bed. A 2 cm thick hydroponic styrofoam
board was cut to the hydroponic bed size and used to float the lettuce heads to allow for

79
the roots to be suspended in the water. Deep bed hydroponics was found to be the more
efficient hydroponic system compared to sand or gravel ebb and flood systems in
delivering nutrients to the roots at a consistent and constant rate from the fish systems
(Lennard and Leonard 2004). This drain fed water to another 200 liter drum which
housed a water pump that would deliver water back to the fish tank at rate of 1-3 liters
per second. The water volume of the each system was 1600 liters of water (Figure 1).
Water was replenished to each aquaponic treatment system to compensate for
water loss from evapotranspiration. Water loss was approximately 5% of the system
volume per week (0.05% - 1.8% daily). The water in the system cycled from the fish to
the plants and back to the fish approximately every 5-10 minutes to assure complete
mixing and delivery of fish nutrients to the plants. The biological filter contained 2
kilograms of small polyethylene filter beads topped with 1.8 m2 of nylon bird netting
material. For each aquaponic system one air diffuser (7.62 cm length) was placed at the
bottom of the cylinder to aerate and stir the beads, one air diffuser was placed in the fish
tank and one air diffuser was placed in plastic drum that housed the pump. The netting
material was manually shaken out inside the filter every week to prevent filters from
clogging and overflowing. Particulates would dissolve back into solution or collect in the
200 liter plastic drum.
FISH AND PLANTS
The target fish used in the aquaponics experiments was the Nile tilapia (O.
niloticus) and the target plant used was a Butterhead Lettuce (L. sativa cv. REX). Tilapias
were stocked into their respective total tank biomass densities of 2 kg m-3, 5 kg m-3 and 8

80
kg m-3 of fish per cubic meter. Prior experiments conducted at the ERL revealed that
approximately one kilogram of fish feed can yield 20 heads of lettuce (Fitzsimmons
1992). Fish were fed 2% of the total stocking biomass daily throughout the trials.
Treatments received 40 grams, 100 grams or 160 grams of feed per day depending on the
tank stocking biomass. A total of 1.4 kg of feed was fed to each replicate of the 2 kg m-3
fish biomass treatment. A total of 3.5 kg of feed was fed to each replicate of the 5 kg m-3
fish biomass treatment. A total of 5.6 kg of feed was fed to each replicate of the 8 kg m-3
biomass treatment. Tilapias were fed a Star Milling Company Tilapia Diet (Table 1). A
nutrient analysis of the fish feed determined the amount of individual nutrients that are
delivered to the aquaponics system via the feed (Table 1).
Tilapia starting and final densities were recorded and the Feed Conversion Ratio
(FCR) was determined for each of the treatments. The FCR is calculated by dividing the
amount of fish feed into the system by the net fish biomass increase for the duration of
the growth period. Fish biomass and FCR was determined for each experimental
replicate. The fish were weighed and stocked in their respective tanks three days prior to
the beginning of the experiment and were harvested at day 37. The mean initial stocking
weight of fish (O. niloticus) for the aquaponics experiment was 202.68 ± 30.35 grams per
fish. Fish were stocked at mean densities of 10.67 ± 2.89 fish per tank for the 2 kg m-3
treatments, 27.33 ± 1.15 fish per tank for the 5 kg m-3 treatments and 33.67 ± 0.58 fish
per tank for the 8 kg m-3 treatments. Each individual fish tank was plumbed in line with a
standard hydroponic planting bed consisting of a density of 32 lettuce plants per square
meter. A total of 32 plants per square meter yielded 15 data plants per treatment replicate.
Border plants were excluded in the experimental analysis.

81
Lettuce (L. sativa cv. Rex) was planted in 2.5 x 5 centimeter rockwool cubes. The
seedlings were transplanted to 2 cm thick polystyrene boards at a spacing of 15.25 cm off
center. Lettuce was seeded in a misting bed for 14 days prior to transplanting. The
aquaponics plant trials lasted 35 days which is the time it takes for the lettuce to reach
harvest weights of approximately 150 grams. The lettuce was harvested at 35 days.
Lettuce was harvested and plant data was collected at the end of the experiment. Plant
height (cm) was collected by measuring from the top of the hydroponic board to the
upper most section of the plant crown. Plant diameter (cm) was measured from the two
outer most leaves across the plant crown. Lettuce harvest head wet weight (g) was
recorded. Plants were placed in a drying oven for 72 hours and head dry weight (g) was
recorded.
ENVIRONMENTAL PARAMETERS AND WATER CHEMISTRY
The water temperature (Co), air temperature (Co), relative humidity (%) and the
photosynthetic active radiation (µmol/m2s) were monitored continuously with a Campbell
(Campbell Scientific Inc. Logan, Utah USA) 21X Data logger (averaged values every 15
minutes). An aspirator was designed to house the dry/wet bulb temperature
thermocouples (Copper-Constantine) for accurate temperature and relative humidity
readings. A Li-Cor (Li-Cor Biosciences Lincoln, NE USA) PAR sensor was mounted on
the truss of the greenhouse above the lettuce canopy. The pH and electrical conductivity
(µS/cm) was measured on a weekly basis with a pH ep4 Pen and a Dist5EC/TDS Pen
made by Hanna Instruments (Woonsocket, RI USA). The dissolved oxygen (mg/l) and
temperature (Co) were monitored on a weekly basis using a YSI (Yellow Springs, OF

82
USA) 550A handheld dissolved oxygen meter. The environmental parameters for the
trials are listed in Table 2. Water samples were collected from each treatment at the
beginning of the experiment, 12 days after transplant, 24 days after transplant, and 35
days after transplant. Water samples were tested for ammonia, nitrite and nitrate
(Kjeldhal digestion colorimetry). Total Phosphate-P was also determined for each
treatment using colorimetry. The samples water samples were analyzed by the Water
Quality Center at the Environmental Research Lab.
DATA ANALYSIS
Experiments were conducted in the beginning of the fall from September to
October. The data was analyzed using JMP analytical software. An ANOVA was applied
to determine if there was a significant (p = 0.05) difference in plant biomass (head wet
weight, head dry weight, plant height and plant diameter) between lettuce grown with
effluent from the three respective fish densities (2kg, 5kg, and 8kg). Post-hoc students T-
tests were used to determine significant (0.05) differences between treatments. The
residual nitrate and phosphate concentration (mg/l) in the water for each treatment was
examined to determine if nitrate or phosphate was a limiting factor among the three
treatments. The hypothesis to be tested is that there is a significant difference in biomass
of hydroponically grown lettuce (L. sativa cv. Rex) grown off nutrients from aquaculture
effluent at different fish (O. niloticus) densities (2 kg m-3, 5 kg m-3 and 8 kg m-3).

83
Fish Tank
1000 l (m3)O. niloticus
2 kg, 5 kg, 8 kg fishStocking Density
150 lBiofilter
Hydroponic Bed
(1 m2) (300 l)L. sativa c.v. Rex15.25 cm Spacing
32 plants / m^2
1.8 m2 Plastic Netting2 kg Polyethylene Bio-Beads
150 lSump
5 l/s Pump
Aquaponics Research System
FIGURE 1. This is a schematic of one of the replicates of the aquaponics research system. The biological filter media consisted of 2 kg of bead media with 1.8 m2 bird netting on top. Water is pumped from the sump then flows via gravity through the fish tank through the biological filter, then into the hydroponic plant bed finally returning to the sump. The water flow of the system is 5 liters per second. A total of 32 lettuce heads were planted per square meter. The respective fish density was allocated for each replicate.

84
Star Milling Co. Tilapia
Feed
Proximate Analysis
(% composition)
Crude Protein 35%
Crude Fat 5%
Crude Fiber 4%
Ash 9%
Nutrients (% dry diet)
N 5.97%
P 1.53%
K 1.46%
Ca 1.61%
Mg 0.26%
Na 0.24%
S 0.46%
TABLE 1. List of tilapia feed analysis used in the aquaponics research trials. The feed is a manufactured tilapia diet by Star Milling Company. A nutrient analysis of the feed shows the relative concentrations of nitrogen and phosphorous that is delivered to the aquaponics system.

85
ENVIRONMENTAL PARAMETERS
Daily Mean Values (9/9/07 -
10/13/07)
Air Temperature Co
TminCo 24.8
oC
TmaxCo 29.1
oC
TaveCo 27.1
oC
Water Temperature oC
TminCo 23.2
oC
TmaxCo 25.7
oC
TaveCo 24.4
oC
Relative Humidity (%)
Mean R.H.% 66%
PAR (mol m-2
)
PAR Daily mols m-2
28.64 mols m-2
PAR Total mols m-2
1002.4 mols m-2
TABLE 2. A list of the environmental parameters for the aquaponics trial. The water temperature, air temperature, relative humidity and photosynthetic active radiation (PAR) were monitored and recorded using a 21x Campbell Scientific Data Logger. Readings were recorded every 10 seconds and averaged over 5 minute intervals continuously throughout the experiment.

86
RESULTS
FISH BIOMASS The mean increase in average fish biomass was greatest in the 5 kg m-3 fish
density treatment (1.58 ± 0.12 kg) (Table 3). The 8 kg m-3 fish treatment yielded the
greatest increase in fish biomass (Table 3). The 8 kg m-3 fish treatment had the highest
FCR of 3.10 ± 0.27 (Table 3). The 5 kg m-3 fish treatment had an FCR of 2.22 ± 0.17,
which was similar to the 2 kg m-3 fish treatment that had an FCR of 2.19 ± 0.34 (Table 3).
Tilapia aquaculture feed conversion ratios typically range from 1.5 -2.0 (Watanabe et al
2002). All treatments had an increase in fish biomass throughout the experiment. The 2
kg m-3 and 5 kg m-3 fish density treatments had 100% survival. One replicate of the 8 kg
m-3 fish density treatment had 88% survival. All feed distributed to the tanks was
consumed by the fish or dissolved into the system within a 24 hour period.
PLANT BIOMASS
There was a significant (P < 0.05) difference in the mean head wet weight, mean
head dry weight, mean plant height and mean plant diameter of L. sativa cv. Rex grown
from the three fish densities (2 kg m-3, 5 kg m-3 and 8 kg m-3). The mean head wet
(145.47 ± 33.94 grams) and head dry weight (7.10 ± 1.53 grams) was highest in the 5 kg
m-3 fish biomass treatment (Figure 2 and Figure 3). The 8 kg m-3 treatment had the lowest
head wet (96.63 ± 22.90 grams) and head dry weight (5.53 ± 0.92 grams) (Figure 2 and
Figure 3). The 5 kg m-3 fish treatment had the greatest mean plant height (13.95± 2.07
cm) and plant diameter (19.05 ± 2.21 cm) (Figure 4). The 5 kg m-3 fish treatment
accumulated the most biomass and size compared to the other treatments.

87
A post hoc t-test determined there was no significant (P<0.05) difference in mean
lettuce head wet weight between the 2 kg m-3 fish density treatment and the 5 kg m-3
treatment. There was a significant (P<0.05) difference in mean lettuce head wet weight
between the 5 kg m-3 fish density treatment and the 8 kg m-3 treatment. Mean lettuce head
dry weight was significantly different for the 5 kg m-3 fish density treatment compared to
the 2 kg m-3 and 8 kg m-3 treatments. There was a significant (P<0.05) difference in mean
plant height of lettuce grown in the 5 kg m-3 fish density treatment compared to the 2 kg
m-3 and 8 kg m-3 treatments. There was no significant (P<0.05) difference for mean
lettuce plant diameter grown in the 2 kg m-3 and 5 kg m-3 fish density treatments. There
was a significant (P<0.05) difference in mean lettuce plant diameter between the 5 kg m-3
fish density treatment compared to the 8 kg m-3 treatment.
The 2 kg m-3 fish density treatment received 1,400 grams of feed over a 35 day
period, had a mean FCR of 2.19 ± 0.34, and produced on average 620 ± 100 grams of fish
and 4,048 ±38.71 grams of lettuce. The 5 kg m-3 fish density received 3,500 grams of
feed over a 35 day period, had a mean FCR of 2.22 ± 0.17, and produced 1,550 ± 120
grams of fish and 4,364 ± 33.94 grams of lettuce. The lettuce in the 2 kg m-3 fish density
treatment was not as green as the lettuce in the 5 kg m-3 fish density treatment. The 8 kg
m-3 fish density received 5,600 grams of feed over a 35 day period, had a mean FCR of
4.73 ± 1.61, and produced 1,270 ± 360 grams of fish and 2,899 ± 30.00 grams of lettuce.
WATER CHEMISTRY
The mean pH of each fish density treatment all had hydrogen ion concentrations
within a pH 7 (Table 4). The pH for all treatment replicates did decrease throughout the

88
duration of the experiment. The pH deceased in the 2 kg m-3, 5 kg m-3 and 8 kg m-3
treatments by 0.40, 0.70 and 0.80 pH units, respectively. The dissolved oxygen
concentration for the 2 kg m-3 (7.91 ± 0.36 mg/l) and 5 kg m-3 (6.76 ± 0.41 mg/l) fish
density treatments was maintained above the optimum of 5 mg/l for fish growth
(Timmons et al. 2002). The mean dissolved oxygen levels for the 8 kg m-3 fish density
treatment was 4.82 ± 2.07 mg/l (Table 4). The electrical conductivity increased in all
treatments as the experiment progressed and was significantly different among all
treatments (P<0.05). At the end of the trial the electrical conductivity was highest in the
treatment with the highest fish density of 8 kg m-3, and the 5 kg m-3 fish density treatment
was greater (920 ± 0.08 uS/cm) than the 2 kg m-3 treatment (830 ± 0.04 uS/cm) (Table 4).
Ammonia and nitrite were minimal to none detectable during the experiments for
all treatments. Ammonia nitrogen (NH3-N) levels ranged from 0.04 mg/l to 0.69 mg/l
and were undetectable after two weeks into the experiment. Nitrite was undetectable
throughout the entire experiment for all treatments. Nitrifying bacteria populations in the
biological filters were established prior to the experiment to reduce elevated ammonia
and nitrite concentrations. Nitrate and phosphate concentrations increased as the
experiment progressed and more feed was added (Figure 5 and Figure 6). Nitrate
concentration was highest in the 8 kg m-3 treatment and was continuing to rise throughout
the duration of the experiment (Figure 5). Nitrate concentrations at the end of the
experiment in the 5 kg m-3 fish density treatment increased 1.2 mg/l between sampling. .
Nitrate concentration in the 5 kg m-3 treatment reached a near steady state at the end of
the experiment (Figure 4). The 2 kg m-3 and 8 kg m-3 fish density treatments had larger
nitrate concentration increases of 12.49 mg/l and 24.81 mg/l compared to the 5 kg m-3

89
treatment. Phosphate continued to rise in all three treatments to the end of the experiment
(Figure 5). The increase in phosphate concentration for the 2 kg m-3 and 5 kg m-3 fish
density treatments were 3.61 and 3.25 mg/l, respectively. The increase in phosphate
concentration in the 8 kg m-3 fish density treatment was much higher (6.94 mg/l) than the
other treatments. This data indicates that nitrates and phosphates in the 8 kg m-3 fish
density treatments compared to the 2 kg m-3 and 5 kg m-3 treatments accumulate at a
faster rate than the lettuce plants can uptake nutrients.

90
Fish Data Treatment 1 Treatment 2 Treatment 3
Initial Fish Biomass (kg) 2 kg m-3
5 kg m-3
8kg m-3
Mean Initial Fish Weight (g) 196 ± 0.04 183 ± 0.01 238 ± 0.01
Mean Number Fish per tank 10.67 ± 2.89 27.33 ± 1.15 33.67 ± 0.58
Mean Harvest Fish Biomass (kg) 2.65 ± 0.10 6.58 ± 0.12 9.82 ± 0.15
Mean Net Biomass Increase (kg) 0.65 ± 0.10 1.58 ± 0.12 1.82 ± 0.15
Mean Survival % 100% 100% 88%
Total Feed (35 day trial) 1.4 kg 3.5 kg 5.6 kg
Mean Feed Conversion Ratio (FCR) 2.19 ± 0.34 2.22 ± 0.17 3.10 ± 0.27
Plant Data Treatment 1 Treatment 2 Treatment 3
Lettuce Biomass Head Wet Weight (kg) 4.32 ± 0.04 4.65 ± 0.03 3.09 ± 0.02
Lettuce Biomass Head Dry Weight (g) 201 ± 1.56 227 ± 1.53 1.77 ± 0.92
Table 3. Fish and plant data from an aquaponics experiment comparing the growth of a one square meter hydroponic plot of lettuce (L. sativa c.v Rex) irrigated with fish effluent comprised of three different fish (O. niloticus) stocking densities (2 kg m-3, 5 kg m-3, and 8 kg m-3). There were 32 heads of lettuce per
square meter hydroponic plot.

91
0.00
20.00
40.00
60.00
80.00
100.00
120.00
140.00
160.00
180.00
200.00
2 kg m-3 5 kg m-3 8 kg m-3
Treatment
gra
ms
Figure 2. Mean head wet weight of Lettuce (L. sativa cv. Rex) in an aquaponics system fed nutrients from three different fish (O. niloticus) densities (2 kg m-3, 5 kg m-3 and 8 kg m-3). Fish were fed %2 of the stocking biomass daily. Lettuce was harvested 35 days after transplant. Error bars represent SEM, * represents p≤0.05 as determined by ANOVA.
*

92
0.00
1.00
2.00
3.00
4.00
5.00
6.00
7.00
8.00
2 kg m-3 5 kg m-3 8 kg m-3
Treatment
gra
ms
Figure 3. Mean head dry weight of Lettuce (L. sativa cv. Rex) in an aquaponics system fed nutrients from three different fish (O. niloticus) densities (2 kg m-3, 5 kg m-3 and 8 kg m-3). Fish were fed %2 of the stocking biomass daily. Lettuce was harvested 35 days after transplant. Error bars represent SEM, *, and ** represents p≤0.05 as determined by ANOVA.
*
**

93
0.00
5.00
10.00
15.00
20.00
25.00
2 kg m-3 5 kg m-3 8 kg m-3
Treatment
cm
Plant Height
Plant Diameter
Figure 4. Mean height and diameter of Lettuce (L. sativa cv. Rex) in an aquaponics system fed nutrients from three different fish (O. niloticus) densities (2 kg m-3, 5 kg m-3 and 8 kg m-3). Fish were fed %2 of the stocking biomass daily. Lettuce was harvested 35 days after transplant. Error bars represent SEM, *, and ** represents p≤0.05 as determined by ANOVA.
**
*
*

94
Treatment Initial pH Final pH Initial EC (uS/cm)
Final EC (uS/cm)
Initial D.O. (mg/L)
Final D.O. (mg/L)
2 kg m-1 8.1 ± 0.19 7.7 ± 0.38 0.80 ± 0.04 830 ± 0.04 8.1 ± 0.26 7.91 ± 0.35
5 kg m-1 7.4 ± 0.41 920 ± 0.08 6.76 ± 1.08
8 kg m-1 7.3 ± 0.32 1000 ± 0.13 4.82 ± 2.07
Table 4. Mean water chemistry parameters for the three fish density (O. niloticus) treatments (2 kg m-3, 5 kg m-3, and 8 kg m-3). Readings were recorded at noon on a weekly basis throughout the trials.

95
0.00
50.00
100.00
150.00
200.00
250.00
0 12 24 35
Days
mg
/L
2 kg m-3
5 kg m-3
8 kg m-3
Figure 5. Mean nitrate concentration in an aquaponics system fed nutrients from three different fish (O. niloticus) densities (2 kg m-3, 5 kg m-3 and 8 kg m-3). Fish were fed %2 of the stocking biomass daily. Lettuce was harvested 35 days after transplant.
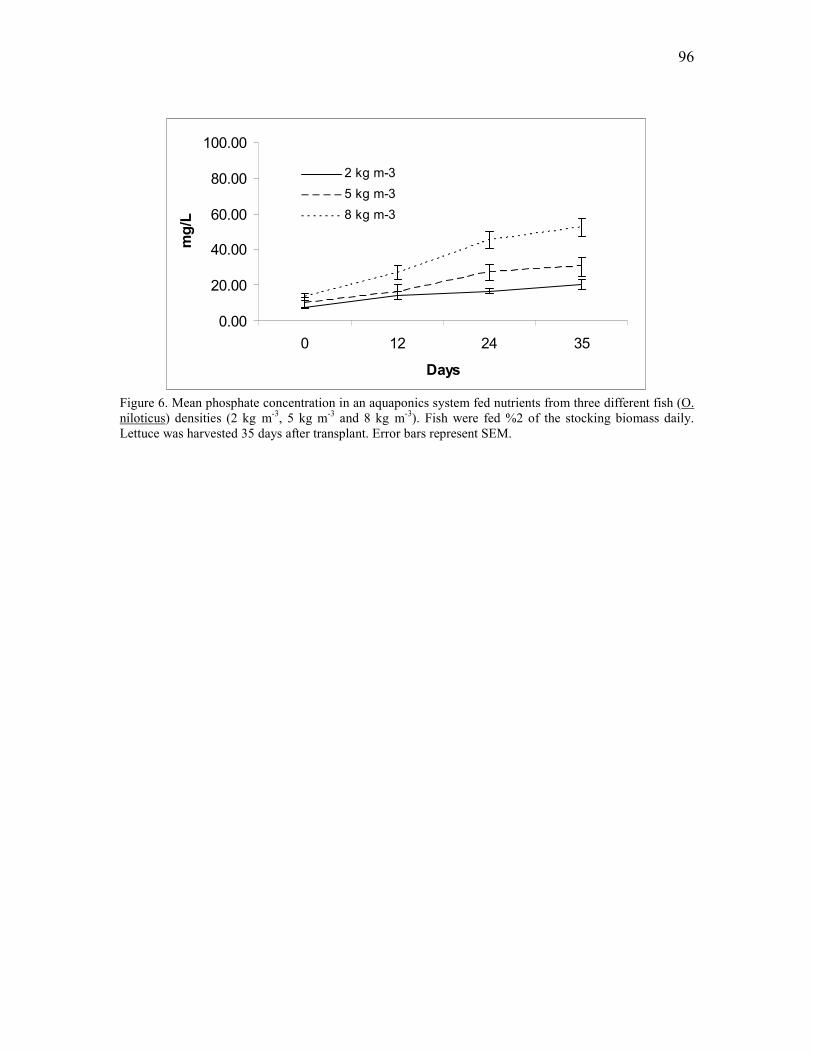
96
0.00
20.00
40.00
60.00
80.00
100.00
0 12 24 35
Days
mg
/L2 kg m-3
5 kg m-3
8 kg m-3
Figure 6. Mean phosphate concentration in an aquaponics system fed nutrients from three different fish (O. niloticus) densities (2 kg m-3, 5 kg m-3 and 8 kg m-3). Fish were fed %2 of the stocking biomass daily. Lettuce was harvested 35 days after transplant. Error bars represent SEM.

97
DISCUSSION
It was concluded that 5 kg m-3 of Nile tilapia (O. niloticus) will yield on average
4.7 kg of lettuce (L. sativa cv. Rex) in 35 days under the specified environmental
conditions. The mean lettuce head wet weight was approximately 145.87 ± 42.66 grams.
An increase in PAR would have an effect on the growth of the lettuce, possibly
increasing the biomass accumulation and nitrogen demand. A marketable lettuce head of
150 grams can be achieved with hydroponic solution in 21-35 days with a minimum PAR
of 17 mols per day (Both et al 1994). The lettuce from the 2 kg m-3 fish density treatment
had similar wet weight as the 5 kg m-3 fish density treatment, however the dry weight was
significantly (P<0.05) higher for the 5 kg m-3 treatment. The coloration of the lettuce
leaves from the 2 kg m-3 fish treatment was a pale yellow compared to the 5 kg m-3 fish
treatment indicating nutrient deficiency and less chlorophyll content. The 5 kg m-3 fish
treatment had significantly more head dry weight at harvest indicating more vegetative
biomass. There was a significant difference in biomass accumulation of dry weight of the
lettuce head between the 5 kg m-3 fish treatment and the other treatments. The 5 kg m-3
fish treatment yielded the most marketable lettuce biomass per square meter of deep bed
hydroponics lettuce. The lettuce was greener and more marketable from the 5 kg m-3 fish
treatment as well. The 2 kg m-3 fish treatment had a net yield of 0.65 kg of fish and 4.32
kg of lettuce. The 5 kg m-3 fish treatment had a net yield of 1.58 kg of fish and 4.65 kg of
lettuce in a 35 day harvest cycle. The total biomass of fish and plant production for the 5
kg m-3 fish treatment was 6.23 kg of both fish and plants.
For the 5 kg m-3 fish treatment the ratio of net fish biomass to harvestable lettuce
biomass is 0.34 (1.58 kg fish biomass / 4.65 kg lettuce biomass). It will take

98
approximately 0.34 kg of fish biomass to yield 1 kg of harvestable lettuce biomass. One
kilogram of fish will yield 2.94 kilograms of lettuce. This is the production expectations
under the assumptions of the species of fish (O. niloticus), the fish feed and feeding rate
(2%), and plant cultivars (L. sativa cv. Rex) used in this experiment under the specified
environmental parameters (Table 2). Optimizing environmental parameters such as PAR
air temperature, and water temperature could yield increased lettuce biomass
accumulation and fish growth. Changing the feed can yield different results if the nutrient
analysis of the feed is different. Increasing protein content in the feed for feeding trout or
other species would change the ratio of fish needed to grow one kilogram of lettuce. The
amount of feed needed to produce a kilogram of harvestable head lettuce would be less in
terms of nitrogen. However, the other essential nutrients for proper fish growth might not
be present at the same levels in feeds made of different sources. The nutrient
accumulation of other essential nutrients for growth can also change from the type of fish
feed used in an aquaponics system.
The FCR of the 8 kg m-3 fish treatment was higher than expected because of some
mortality in one of the replicate tanks. The FCR for tilapia in the aquaponics system
(FCR 2.2) was close to the expected tilapia aquaculture FCR of 1.5-2.0 (Watanabe et al
2002). Increasing water temperature could increase the FCR of for the fish system
however this could have negative effects on lettuce growth. The plant treatments did not
seem to have an effect on growth. In a system of larger magnitude the plant uptake of
nutrients can compete with algae and bacteria thus potentially clearing up water quality
for the fish. The dissolved oxygen was low in the 8 kg m-3 fish treatment compared to the
other two treatments. Dissolved oxygen in all treatments never reached levels (7 mg/l)

99
equal to the other treatments. The respiration from the fish, plant root zone, and
microorganisms in the system was greater than the capacity to deliver oxygen in this
experiment. In order to sustain the biological oxygen demand of larger densities of fish
and plants more airstones, increased air delivery, or injection of pure oxygen would be
required. A decrease in oxygen is not beneficial for fish or plant growth (Timmons et al.
2002; Resh 2001).
Electrical conductivity, nitrate and phosphate increased in all the treatments as
more fish feed was added on a daily basis. The nitrate and phosphate concentration in the
5kg m-3 fish treatment reached a near steady state at the end of the experiment. Nitrate
concentration in the 5 kg m-3 fish treatment reached a steady state at approximately 110
mg/l by the end of the experiment with no negative effect on growth. Phosphate
concentration in all treatments was greater than 20 mg/l. This indicates that the amount of
nitrogen and phosphate into the system was equivalent to the amount being taken up by
the plants. Nitrogen that is not accounted for in the aquaponic system can be lost via
fixation by bacteria, algae, and micro fauna that reside in the system, or in the form of
nitrogen gas (N2). An increase in more nutrients for the 8 kg m-3 fish treatment did not
yield an increase in plant biomass compared to the other treatments.
It was determined that 100 grams of fish feed per day will yield 45.1 grams of fish
growth and 132.86 grams of lettuce biomass per day. These result are comparable to
production from hydroponic and aquaculture systems (FCR 2.2; 150 gram head). These
formulations can be scaled up to fit commercial designs. Nutrient depletion over an
extended period of time in aquaponics systems is common (Rakocy et al 1993, Seawright
et al. 1998). Developing a commercial aquaponics greenhouse prototype will involve the

100
need for nutrient supplementation not limited to but including iron (Fitzsimmons 1992,
Rakocy et al. 1993 and Seawright et al. 1998).
The filtration and biological processing of the fish water for plant nutrient uptake
can also influence the system. Future studies should include the integration of filtration
technologies to remove solids and dissolve solids within the system. Controlled
aquaponic systems can increase productivity and feed use efficiency. The ability to
produce crops intensively with minimal to no impact to the environment will be essential
in order for human civilization to be able to meet future food demands without negatively
impacting the environment. Continuous operation of an aquaponics system can lead to
the production of beneficial organisms in the water medium. Bacteria, phytoplankton, and
zooplankton can become established in a system given the correct environmental
surroundings and can increase growth and health of the plants (Sabidov 2004). If
beneficial organisms can thrive in the aquaponics system then it is possible for non
beneficial organisms to also reside in the system given a particular set of environmental
surroundings. The balance of nutrients into the system with nutrient uptake by the target
organisms (fish and plants) can be crucial in establishing beneficial organisms and
reducing the establishment of harmful organisms. Particularly because these harmful
organisms thrive off of the similar constituents that the fish and plants thrive off of (water
and nutrients). Harmful bacteria and algal blooms indicate poor water quality. Water
quality is affected by the nutrients put into the systems, the density of organisms within
the systems, and the biological processing of the water within the system.
Future studies should include chlorophyll analysis of the plant leaves. Visual
observations of plant nutrient deficiency symptoms can also be used to determine plant

101
health. The environmental parameters will affect plant physiology, thus plant growth
(Resh 2001) which will in turn affect the nutrient uptake. Hydroponic nutrient solutions
are formulated for specific plants. Characterizing the water chemistry of an aquaponics
system will enable growers to tailor their aquaponics water with individual supplements
in order to achieve maximum productivity and crop quality.
Future studies will look into developing a commercial prototype scaled up from
the fish to plant ratios. Control of environmental parameters will allow for testing the
effect of air temperature, humidity, and PAR on plant physiology in the aquaponics
system and thus the nutrient dynamics of the system. Determining the optimum water
temperature for an aquaponics system is a tradeoff between maximizing fish growth and
plant growth. Water temperatures ranging from 24oC to 28oC will yield good lettuce
production in relation to biomass generation and quality. Nile tilapia will grow at a faster
rate at higher temperatures (Watanabe et al 2002), however in order to obtain optimal
lettuce production temperatures were kept cooler and below optimum (30oC). Decreased
water temperatures (<28oC) can lead to a lower FCR for the tilapia (Timmons et al.
2002). Increasing water temperature could yield a lower FCR 1.5-2.0, however the
growth of the lettuce would also be affected. Future studies should be conducted in order
to determine the optimal water temperature for an aquaponics system. The price to heat
and cool water to achieve optimal temperatures for the fish and plants needs to be
evaluated. Elevated water temperature set points for an aquaponics system provide
warmer root zone temperatures for the plants. Warmer root zone temperatures coupled
with providing cooler air temperatures can provide optimal growing conditions for the
lettuce. Further development of aquaponics system will take precise control and

102
monitoring of the fish, plants, environment, and water chemistry which can be achieved
with greenhouse and filtration technologies.

103
REFERENCES
Adler, P.R., J.K. Harper, E.M. Wade, T. Takeda, and S.T. Summerfelt. 2000. Economic analysis of an
aquaponic system for the integrated production of rainbow trout and plants. International Journal
of Recirculating Aquaculture 1:15-34.
Al-Hafedh, Y. S., A. Alam, and M. S. Beltagi. 2008. Food production and water conservation in a
recirculating aquaponic system in Saudi Arabia at different ratios of fish Feed to plants. Journal of
the World Aquaculture Society. 39(4): 510-520.
Antoniou, P., J. Hamilton, B. Koopman, R. Jain, B. Holloway, G. Lyberatos and S.A. Svoronos (1990).
Effect of temperature and pH on the effective maximum specific growth rate of nitrifying bacteria.
Water Research. 24 (1): 97-101.
Britto D. T., Herbert J. Konzucker (2002). NH4+ toxicity in higher plants: a critical review. J. Plant
Physiology 159. 567-584.
Castro, R. S., C.M.S. Borges, and F. Bezerra-Neto. 2006. Increasing cherry tomato yields using fish
effluent as irrigation in Northeastern Brazil. Scientia Horticulturae 110(1):44-50.
Chaves, P.A., L.M. Laird, R. Sutherland and J. Beltrao (2000). Assessment of fish culture water
improvement through integration of hydroponically grown lettuce. Water Science and Technology
42 (1-2) pp. 43-47.
Chervinski, J. (1982). Environmental physiology of tilapias (pp.119-128) In R.S.V. Pullin and R.H. Lowe-
McConnell (eds.), The Biology and Culture of Tilapias. ICLARM Conference Proceedings 7,
Manila, Philippines.
Diver, S. 2006. Aquaponics – integration of hydroponics with aquaculture. Publication No. IP163.ATTRA.
National Sustainable Agriculture Information Service.
Fitzsimmons, K. M. 1991. Intensive tilapia production integrated with field crops in Southwest U.S. In:3rd
International Symposium on tilapia aquaculture. ICLARM. Manilla, Philipines.
Fitzsimmons, K. 1992. Fertilizer value of aquaculture effluents and land disposal as a best management
practice. Proceedings from the National Extension Aquaculture Workshop. Arkansas State 4-H
Center. March 3-7 1992.
104
Fitzsimmons, K. 2006. Prospect Potential for Global Production. (pp. 51-73) In Chhorn Lim and Carl D.
Webster (Eds.) Tilapia: Biology, Culture and Nutrition. Food Product Press New York, New
York.
Hanan, J.J. (1998). Greenhouses. Advanced Technology for Protected Cultivation. CRC Press.
Hanson, A., J. Yabes, Jr., and L. P. Primavera. 2008. Cultivation of Lemon Basil, Ocimum americanum, in
two different hydroponic configurations supplemented with various concentrations of Tilapia
aquaculture green water. BIOS. 79(3):92-102.
Islam, A.K.M.S., D.G. Edwards and C.J. Asher (1980). pH Optima for crop growth results of a flowing
solution culture experiment with six species. Plant and Soil Vol. 54 No. 3 October.
Lennard, W. A., and B. V. Leonard 2004. A comparison of reciprocating flow versus constant flow in an
integrated, gravel bed, aquaponic test system. Aquaculture International 12:539-553.
Losordo, T.M., M. P. Masser and J. Rakocy (1999). Recirculating aquaculture tank production systems.
Southern Regional Aquaculture Center (SRAC). SRAC Publication No. 453.
McIntosh, D. and K. Fitzsimmons. 2003. Characterization of effluent from an inland, low salinity shrimp
farm: what contribution could this water make if used for irrigation? Aquaculture Engineering
27:147-156.
McMurtry, M.R., P.V. Nelson, D.C. Sanders, and L. Hodges. 1990. Sand culture of vegetables using
recirculating aquaculture effluents. Journal of Applied Agriculture Research 54:280-284.
McMurtry, M. R., D.C. Sanders, J.D. Cure, R.G. Hodson, B.C. C. Hanning, and P.C. St. Amand. 1997.
Efficiency of water use of an integrated fish/vegetable co-culture system. Journal of the World
Aquaculture Society 28:420-432.
Neori, A., T. Chopin, M. Troell, A. H. Buschmann, G. P. Kraemer, C. Halling, M. Shpigel, and C. Yarish.
2004. Integrated aquaculture: rationale, evolution and state of the art emphasizing seaweed
biofiltration in modern aquaculture. Aquaculture 231:361-391.
Quillere, I., L. Roux, D. Marie, Y. Roux, F. Gosse, and J.F. Morot-Gaudry 1995. An artificial productive
ecosystem based on a fish/bacteria/plant association. 2. Performance. Agriculture, Ecosystems and
Environment. 53:19-30.
Rakocy, J. E. and A. Nair. 1987. The status of aquaponics. Part 2. Aquaculture Magazine 25:64-70.

105
Rakocy, J. E. and J.A. Hargreaves (1993). Integration of Vegetable Hydroponics with Fish Culture: A
Review. American Society of Agriculture Engineers, St. Joseph, MI (USA) pp. 112-136.
Rakocy, J. E., T. M. Losordo, and M.P. Masser. 1992. Recirculating aquaculture tank production systems:
integrating fish and plant culture. SRAC Publication No. 454. Southern Regional Aquaculture
Center, Mississippi State University, Stoneville, Mississippi, USA.
Rakocy, J.E., D.S. Bailey, C. Shultz and E.S. Thoman (2004). Update on tilapia and vegetable production
in the UVI aquaponic system. Proceedings from the 6th International Symposium on Tilapia in
Aquaculture. Volume 2: 676-690.
Rakocy, J. E., Michael P. Masser and Thomas Losordo 2006. Recirculating aquaculture tank production
systems: aquaponics – integrating fish and plant culture. Southern Regional Aquaculture Center.
SRAC Publication No. 454
Resh, H. M. (2001). Hydroponic Food Production. Woodbridge Press Publishing Company. Santa Barbra,
CA 93012.
Sabidov, N. A. 2004. Annual report of greenhouse crops program for 2003/2004. CDC South, Brooks,
Canada.
Sabidov, N.A., E. Hutchings, and J.E. Rakocy 2007. Fish and plant production in a recirculating
aquaponics system: a new approach to sustainable agriculture in Canada. Proc. Int. Conf. &
Exhibition on Soilless Culture. Acta Hort. 742:209-222.
Seawright, D.E., R. R. Stickney, and R. B. Walker. 1998. Nutrient dynamics in integrated aquaculture-
hydroponic systems. Aquaculture. 160:215-237.
Takeda, F., P.R. Adler, and D.M. Glenn. 1997. Strawberry production linked to aquaculture wastewater
treatment. Proc. Third Int. Strawberry Symp. Acta Hort. ISHS 439(2):673-677.
Timmons, M.B., J.M. Ebling, F.W. Wheaton, S.T. Summerfelt and B.J. Vinci (2002). Recirculating
Aquaculture Systems 2nd Edition. Northern Regional Aquaculture Center Publication No. 01-002.
Cayuga Aqua Ventures Ithaca, New York.
Tyson, R.V., E.H. Simonne, M. Davis, E.M. Lamb, J.M. White and D.D. Treadwell (2007). Effect of
nutrient solution, nitrate-nitrogen concentration, and pH on nitrification rate in perlite medium.
Journal of Plant Nutrition, 30:901-913.

106
Watanabe, W. O., T. M. Losordo, K. Fitzsimmons and F. Hanley (2002). Tilapia production systems in the
americas: technical advances, trends and challenges. Reviews in Fisheries Science, 10(3&4): 465–
498.

107
APPENDIX B: COMPARISON OF LETTUCE
(LACTUCA SATIVA CV. REX) GROWN WITH
TILAPIA (OREOCHROMIS NILOTICUS) EFFLUENT
AND NUTRIENT SUPPLEMENTATION VERSUS A
HYDROPONIC SOLUTION
Journal of Plant Nutrition
Jason Licamele, Kevin Fitzsimmons, Gene Giacomelli Department of Agriculture and Biosystems Engineering, University of Arizona
Controlled Environment Agriculture Center 1951 East Roger Road Tucson, Arizona 85719

108
ABSTRACT
The goal of this study was to determine if there is a significant difference in
growth (head fresh weight and head dry weight) and leaf chlorophyll content index
(CCI%) between lettuce (Lactuca sativa cv. Rex) grown with aquaponics water and
nutrient supplements a hydroponic solution. A recirculating aquaponics system was
designed to grow tilapia and lettuce. Tilapia (Oreochromis niloticus) were grown in an
intensive recirculating aquaculture system conjoined with deep bed hydroponic lettuce
(L. sativa cv. Rex and Tom Thumb). Aquaponics water with the proper nutrient
supplementation can yield equal or greater biomass and CCI% as compared to growth in
conventional hydroponic solutions. Mean wet weight for aquaponics lettuce (176.75 ±
31.04 grams) was equal to or greater than lettuce grown with hydroponic solution (148.55
± 21.71 grams). The CCI% for lettuce grown from aquaponic water plus supplements
(9.89 ± 0.89) was not significantly different (p≤0.05) than lettuce grown in a hydroponics
solution. This research demonstrates the efficacy of utilizing aquaponics water as a base
nutrient source for hydroponic vegetable production. Integrating fish and plant
production can produce plants of equal biomass and color compared to a hydroponic
solution. Integrated fish and plant systems can lead to more sustainable food production
with less environmental impacts. Aquaponic systems with proper supplementation can
yield lettuce and other potential vegetable crops of equal biomass and quality (coloration)
compared to agriculture and hydroponic production.
109
INTRODUCTION
The production of fish and vegetables through the integration of fish aquaculture
and plant production has been demonstrated (Fitzsimmons 1991; Fitzsimmons 1992;
Rakocy et al. 1993; McMurtry et al. 1997; Chaves 2000; McIntosh and Fitzsimmons
2003; Sabidov 2004; Castro et al. 2006; Diver 2006). Coupling fish aquaculture with
hydroponic plant culture is more sustainable than conventional agriculture systems by
reducing the environmental impact from eutrophication (McMurtry et al. 1990;
Fitzsimmons 1992; Rakocy et al. 1992; Rakocy and Nair 1987; Rakocy and Hargreaves
1993). Popular food crops, such as lettuce, basil, tomatoes, and strawberries, have been
successfully cultivated with the use of fish effluent as the primary fertilizer (McMurtry et
al. 1997, Takeda et al. 1997, Rakocy et al. 2004, Hanson et al. 2008). Intensive
recirculating aquaculture systems (RAS) can produce more fish per liter of water than
other types of aquaculture systems (Timmons et al. 2002), therefore reducing water used.
Greenhouse hydroponics production can produce from five to ten times more output
compared to conventional agriculture (Resh 2001; Hannan 1998). Given these increased
yields, aquaponic systems can yield similar crop production compared to hydroponic
systems (Sabidov 2004). Water from aquaculture systems can be integrated with plant
production utilizing resources more efficiently, potentially reducing water usage by 20-
27% (Chaves et al. 2000).
The fish component of an aquaponics system provides the water with nutrients via
feeding and excretion. A mechanical filter is used to remove large particulate matter from
the fish wastes prior to being processed by the biological filter. Removal of large
particulate matter prior to biological filtration will reduce heterotrophic bacteria

110
populations (Losordo 1999), thus reducing competition with nitrifying bacteria and
promoting conversion of ammonia to nitrate (Timmons et al. 2002). This is important in
preventing ammonia toxicity in fish (>2 mg/l) (Timmons et al 2002; Watanabe et al
2002). Depending on plant species sensitivity symptoms of ammonia toxicity appear with
external ammonia concentrations above 0.1 - 0.5 µmol/L (Britto and Kronzucker 2002).
Lettuce will grow in ammonia concentrations of 2 mg/l (Resh 2001). Ammonia and
nitrite are toxic to fish at high concentrations, however, nitrate is not (Timmons 2002).
After the water is processed by the mechanical and biological filters, it is then delivered
to the hydroponic beds where nutrients are taken up by the plants. Dissolved nutrients
from fish are similar in composition to the nutrients required for hydroponic growth of
plants (Rakocy et al. 2006). Certain accumulated nutrients (nitrogen, phosphorous,
potassium) in fish aquaculture systems can lead to algae and bacterial growth that can be
harmful to fish and lead to off flavors (Fitzsimmons 2006). In aquaponics systems, the
plants use dissolved nutrients from the fish aquaculture component thus reducing their
accumulation in the RAS. Plants compete for these same nutrients as algae thus leading
to reduced algae concentrations in aquaponics system compared to RAS.
Maintaining proper water chemistry parameters requires balancing the fish’s,
nitrifying bacteria’s, and the plant’s physiological requirements in one system. Tilapia
can tolerate a pH from acidic to alkaline (pH 5-11) (Chervinski 1982) and a wide range of
salinity concentrations (Watanabe et al. 2002). Plants grow best and uptake nutrients at a
lower pH (5.5-6.5) (Resh 2001). Specifically, lettuce will grow well in a pH range of 5.5-
6.5 (Resh 2001, Islam et al. 1980). Nitrifying bacteria is inhibited below a pH of 6.5, with
an optimum pH of 7.8 depending on bacterial species and temperature (Antoniou et al.

111
1990; Tyson et al. 2007). Electrical conductivity levels range between 1-2 mS cm-1 for
hydroponic lettuce production (Resh 2001), well below the levels (2000 uS cm-1) that can
be toxic to Nile tilapia (Timmons 2002). Optimal water temperature for Nile tilapia
(Oreochromis niloticus) ranges between 28-35o C (Chervinski 1982) while lettuce grows
at water temperatures between 21-25oC (Resh 2001). These water parameters can
influence the physiology of the organisms within the aquaponic system and must be
monitored and controlled for optimal system performance. Lettuce grows best at air
temperatures between 16 – 25o C and can bolt in air temperature above 28 – 30o C (Resh
2001). Day temperatures of 24o C and night temperatures of 19oC coupled with
photosynthetic active radiation (PAR) levels of 17 mol/m2 day were found to produce
marketable lettuce heads in 24 days after transplant (Both et al. 1994). A marketable
lettuce head weighs a minimum of 150 grams and can be achieved in 3-4 weeks after
transplant under optimal growing conditions (Both et al. 1994; Resh 2001).
Macronutrients and micronutrients are essential for proper plant growth
(Marschner 1995). It has been documented that over time aquaponic systems require
some nutrient supplementation not delivered from the fish feed (Rakocy et al. 2006;
Seawright 1998). The nutrients are affected by the amount of feed put into the system, the
fish to plant ratios, and environmental parameters (Rakocy et al 2006; Seawright 1998;
Fitzsimmons 1991). Prior studies at the University of Arizona Environmental Research
Lab determined that nitrogen and phosphate were not depleted when a stocking density of
5kg of tilapia were fed 100 grams of feed daily throughout the duration of the growing
cycle of 32 heads of lettuce (Licamele unpublished data 2009). Iron, zinc, and copper
have been documented to be plant micronutrients that can be depleted in aquaponic

112
systems (Rakocy et al. 2006; Seawright 1998; Fitzsimmons 1992) and are important for
plant health (Resh 2001). Prior observations on aquaponic systems revealed that iron,
manganese, and zinc became depleted over time and must be supplemented to achieve
optimal plant growth (Licamele unpublished data 2009). Iron and manganese play an
important role for photosynthesis in plants. Iron plays a role in chlorophyll synthesis in
plants (Marschner 1995). Manganese is primarily associated with photosystem II
reactions (Marschner 1995). Zinc plays a role in the structure of plants and is associated
with plant hormones responsible for cell elongation in plants (Marschner 1995). These
nutrients were targeted for supplementation in the aquaponics system. Plants with equal
CCI% will be photosynthesizing and fixing nutrients at similar rates and thus should have
similar morphology.
Combining greenhouse environmental control with the recirculating aquaponic
system will enable a more controlled analysis of the interactions between nutrients
provided by the fish and plant uptake of those nutrients. Prior studies have shown that
lettuce in an aquaponics system can be produced with similar growth as hydroponics
solution (Licamele et al. 2009). The quality of lettuce grown with aquaponics water must
also be analyzed to determine the efficacy of aquaponic vegetable production. Lettuce
(Lactuca sativa cv. Rex and Lactuca sativa cv. Tom Thumb) and Nile tilapia (O.
niloticus) were grown in a controlled environment aquaponics greenhouse system to
compare the differences in growth and quality of lettuce to a standard hydroponic
solution. Plant quality was determined by comparing the chlorophyll concentration index
of the same plant cultivar grown in both an aquaponics and hydroponic system. This
method was used to quantify green coloration in the lettuce. The goal of this study was to

113
determine if there is a significant difference in growth and quality of lettuce grown in
aquaponics water plus supplements or a hydroponic solution.

114
MATERIALS AND METHODS
Aquaponics System Design and Protocol
The University of Arizona Aquaponics Greenhouse (UAAG) structure developed
and operated by the UA-CEAC is a free standing steel A-frame greenhouse with a double
wall polycarbonate glazing. The greenhouse is oriented in a north-south configuration.
The height to the gutter is 2 meters and height to the ridge is 4 meters. The greenhouse is
divided into three separate 7.6 meter by 7.4 meter compartments, each with individual
environmental controls. Double wall polycarbonate panels are used to divide the
greenhouse. The north section houses the fish aquaculture and water filtration systems
and the two south bays house the hydroponic beds.
The aquaculture component of the UAAG is comprised of four 1,300 liter
growout aquaculture tanks, four 190 liter fry and fingerling tanks, and a 3,200 liter gallon
water collection tank. The aquaculture component consists of a total of 9,160 liters. The
tanks were designed and fabricated by GSE Incorporated (Houston, TX USA). The water
from the fish aquaculture and plant hydroponic systems drains into the collection tank. A
Sweetwater® Centrifugal 1.5 horsepower pump (Aquatic Eco-Systems Inc. Apopka, FL
USA) delivers water back to the fish aquaculture system at a rate of 340 liter/minute. A
Sweetwater 1 ¼ horsepower regenerative blower was used to provide aeration to the fish
tanks, biological filter, water collection tank and hydroponic beds. Aero-Tube™ (Tekni-
Plex Inc. Ridgefield, NJ USA) lined the inner perimeter of the growout tanks to provide
aeration. Air stones (15 cm x 4 cm) were used to provide aeration to the fingerling tanks.
Water from the fish aquaculture system is filtered through a mechanical and a biological
filter prior to being distributed to the plants. A Polygeyser™ PG7-PR filter from

115
International Filter Solutions (IFS) (Marion, TX USA) served as the mechanical filter and
a biological filter. The PG7 was plumbed inline with an additional 50 gallon drum filled
with Bio-Spheres™ (Aquatic Eco-Systems Inc. Apoka, FL USA) and lined with Aero-
Tube™ to provide additional biological filtration. The biological filter contains
approximately 0.3 m3 of bio-ball filter media for supporting the maximum fish load (150
kg). Trickling biological filters can convert approximately 1-2 grams of nitrogen per
square meter per day (Parker 2002). A HiBlow (HiBlow USA Inc. Saline, MI USA) HP-
80 linear air pump delivered air to the PG7 filter at a rate of 1.13 standard cubic feet per
hour for backwashing the beads. The filter was purged daily removing five liters of
sludge from the system.
Each hydroponic bed holds 1,400 liters of water. An AquaFlo ¼ horsepower
pump delivers water to the four hydroponic plant beds at a rate of 340 liters / minute (85
liters per minute per bed). The water is constantly in circulation between the aquaculture
and hydroponic sections. Aero-Tube™ was used to line the perimeter of the beds to
aerate and circulate the water within the bed. There are two plant growing bays, each
plant bay houses two beds. One of the hydroponic beds housed the experimental trials.
The second hydroponic bed was used to maintain proper fish to plant ratios throughout
the trials. Two hydroponic treatments were set up per trial each consisting of a 0.61 meter
by 1.22 meter acrylic box submerged into the aquaponic beds and filled with a
hydroponic lettuce solution. This was done to maintain similar water temperature and
atmospheric conditions (air temperature, relative humidity, and PAR) for the aquaponics
and hydroponic plant treatments. The experiments were conducted from March through
May 2009.

116
The UAAG was designed to produce tilapia (O. niloticus) for harvest on a
monthly basis and lettuce to be harvested on a weekly basis. Fish tank density ranges
from 30 – 80 kg per tank depending on fish growth and/or planting density. Fish are
grown out to 1 kg for harvest. It was determined from previous studies conducted at the
University of Arizona Environmental Research Lab that 5 kilograms of fish fed 2%
biomass per day throughout the growth cycle of lettuce will yield 32 heads of lettuce
(Licamele et al 2009). The aquaponics system had been in operation for seven months
prior to the onset of the experimental trials and the water in the system reached a steady
state.
The seeds were germinated for one week prior to transplant. During the
experimental trial there was an initial stocking density of a total of 105 kg of fish
supplying 21 m2 of plant growing area (a total of 672 lettuce heads). This density was
based on the design ratio from previous studies (Licamele et al. 2009). One growout tank
had 30 kg of fish, a second had 30 kg of fish, a third was stocked with 35 kg of fish, and a
fourth was stocked with 15 kg of fish. Mean fish weight at stocking was 310 grams per
fish. Fish were fed 2% of the standing initial biomass daily (2.1 kilograms) throughout
the growout cycle of lettuce. The feed used in the experimental trials was manufactured
by Star Milling Company (Perris, CA USA) (Table 1). Fish were harvested and the mean
Feed Conversion Ratio (FCR) and mean survival was determined for the aquaponics
system. Fish were harvested, or sorted and put back into the respective tanks for further
growout and maintaining system biomass load for plant growth.

117
Nutrient Supplementation:
Nutrient supplements were added to the aquaponics system throughout the trials
to maintain targeted water chemistry parameters (Table 2). One kilogram of Dolomite 65
Ag Lime was added to the sump every two weeks to maintain a pH of 6.8. Dolomite is
comprised of 46.0% calcium carbonate (CaCO3), 38.5% magnesium carbonate (MgCO2),
22.7 % calcium (Ca), and 11.8% magnesium (Mg). Organic Materials Review Institute
(OMRI) certified Biomin® amino acid chelated minerals were provided by JH Biotech™
(Ventura, CA USA). The first week 800 ml of Biomin® iron (5%), 50 ml of Biomin®
Zinc (7%), and 50 ml of Biomin® Manganese (5%) were added to the aquaponics
system. On the third week of the trial 100 ml of Biomin® iron (5%) and 50 ml of
Biomin® Manganese (5%) were added to the system. Levels equal to or greater than 0.01
mg/l of all nutrients were maintained in the aquaponics water throughout the entire
duration of the experimental trial. All supplements were mixed into a 20 liter bucket and
diluted with water prior to being added to the system. The supplements were added to the
sump and allowed to dissolve into the system for 24 hours before taking a water sample.
A hydroponic solution based off a half strength Hoagland’s solution was formulated for
lettuce and used in the hydroponic treatments (Table 2). The aquaponics targeted water
chemistry parameters are listed in Table 2. Water chemistry analysis allows for
determination of the amount of soluble nutrients in the aquaponics system. A 500 ml
water sample was collected every week from the aquaponics system and sent to a lab for
analysis. Water samples were tested by the Soil and Plant Laboratory Incorporated (Santa
Clara, CA USA).

118
Monitoring of Environmental Parameters:
Environmental parameters were monitored and controlled via a network of
sensors connected to a Campbell Scientific™ 21X Data logger. The air temperature (oC)
was monitored with a Campbell Scientific™ 107-L temperature probe. The relative
humidity (%) was monitored with a Campbell Scientific HMP50-L Vaisala™ sensor
housed in an aspirator. A LI-COR™ 190 Quantum sensor was used to capture
photosynthetic active radiation (µmol m-2s-1) available to the plants. Water parameters
were monitored in real time using the Campbell Scientific™ 21X Data Logger and
sensors placed in the water collection tank. A Copper-Constantine thermocouple was
constructed to measure water temperature (Co), a Hanna HI 3001 electrical conductivity
(µЅ/cm) sensor, a Hanna HI 1001 pH sensor, and an Oxyguard Campbell Scientific
CS512 dissolved oxygen (mg/l) sensor were used to monitor water parameters in real
time throughout the duration of the experiment. The data was processed and stored on a
computer in the control room on the North side of the greenhouse. The mean water and
environmental parameters are listed in Table 3.
Biomass and Chlorophyll Concentration Index:
Lettuce seeds were transplanted one week after germination into the hydroponic
boards. A total of three trials were conducted for this experiment. The Chlorophyll
Concentration Index (CCI %) was measured on three different leaves with an Apogee
CCM-200 prior to harvesting for each data plant. Lettuce was harvested 35 days after
transplant for the first trial. The transplant time for the following two trials was changed
to 28 days because head market weights were achieved quicker. The wet weight (grams)

119
was determined at harvest (28 days after transplant) and samples were dried in a drying
oven at 50oC for 72 hours before dry weight (grams) was measured. There were six
sample plants per treatment with two replicates for each aquaponic and hydroponic
treatment per trial. This totaled 12 data samples (n=12) for the aquaponic treatment and
12 data samples (n=12) for the hydroponic treatment per trial for trials one and two.
There were 24 data plants per treatment for L. sativa cv. Rex. At the end of the trials the
fish growout tanks were harvested, weighed (kg) and restocked with fish accordingly.
The mean final weight (kg) and feed conversion ratio (FCR) was calculated for the tilapia
fish aquaculture component. The data was analyzed using a paired t-test.

120
Star Milling Co. Tilapia Feed
Crude Protein 35%
Crude Fat 5%
Crude Fiber 4%
Ash 9%
Nutrient Analysis
N 5.97%
P 1.53%
K 1.46%
Ca 1.61%
Mg 0.26%
Na 0.24%
S 0.46%
Cu 15 mg/Kg
Zn 143 mg/ Kg
Mn 93 mg/ Kg
Fe 161 mg/ Kg
B 18 mg/ Kg TABLE 1. Tilapia fish diet manufactured by Star Milling Company. The manufacturer’s label is listed in the table. A nutrient analysis of the feed shows the relative concentrations of nutrients per gram of feed.

121
Lettuce
Solution Concentrations Solution Aquaponics
pH 6.50 6.80 Electrical Conductivity (dS/m) 1.80 1.00
Ammonia NH3-N (mg/L) 0.00 0.00
Nitrite NO2 (mg/L) 8.00 0.00
Nitrate NO3-N (mg/L) 180.00 50.00
Boron (B) (mg/L) 0.25 0.20
Calcium (Ca) (mg/L) 150.00 60.00
Copper (Cu) (mg/L) 0.10 0.05
Iron (Fe) (mg/L) 1.50 0.05
Magnesium (Mg) (mg/L) 30.00 30.00
Manganese (Mn) (mg/L) 0.25 0.05
Molybdenum (Mo) (mg/L) 0.05 0.05
PO4-P (mg/L) 25.00 50.00
Potassium (K) (mg/L) 125.00 150.00
Sulfate (SO4)-S (mg/L) 100.00 50.00
Zinc (Zn) (mg/L) 0.20 0.03
Table 2. Water chemistry target parameters for the aquaponics research trials and the hydroponic lettuce solution.

122
RESULTS
Water Chemistry Analysis and Environmental Parameters:
The mean water temperature for the duration of the trials was 28.8 ± 1.7oC. The
mean dissolved oxygen was 5.4 ± 0.5 mg/l, the mean pH was 6.8 ± 0.2, and the mean
electrical conductivity was 0.9 ± 0.2 mS/cm for the aquaponics system water (Table 3).
The water and air environmental parameters for the trials are listed in Table 3. The mean
air temperature for the first trial was 19.7 ± 2.3 oC, the second trial was 21.7 ± 3.5 o C,
and the third trial was 21.4 ± 3.0 o C (Table 3). The mean relative humidity was greater
for the second trial (47.23 ± 6.85 %) and third trial (46.71 ± 6.71 %) than the first trial
(39.79 ± 7.44 %) (Table 3). The mean daily integrated photosynthetic active radiation for
the first trial was 16.52 ± 5.13 mol m-2 d-1 and was greater than the second trial (13.37 ±
4.06 mol m-2 day-1) but not the third trial (18.70 ± 2.42 mol m-2 day-1) (Table 3).
The system was in operation for six months prior to the onset of the experimental
trials. A protocol to maintain pH and proper water chemistry parameters was developed.
Iron, zinc, and manganese had reached minimal levels (<0.01) and were targeted for
nutrient additions. The water chemistry analysis for the first trial revealed that the nitrate-
nitrogen (NH3-N) concentration ranged from 18 mg/l to 65 mg/l throughout the duration
of the trials (Figure 1). The nitrate-nitrogen concentration for the second trial ranged from
18 mg/l to 62 mg/l and the third ranged from 48 mg/l to 89 mg/l (Figure 1). Ammonia
was not measurable in the first trial and reached a level of 1 mg/l near the end of the
second and third trials (Figure 1). The iron concentration in the aquaponics water for the
first trial ranged from 0.01 mg/l to 0.08 mg/l (Figure 2). The iron concentration in the
aquaponics water for the second trial ranged from non detectable to 0.13 mg/l and the
third trial ranged from 0.01 mg/l to 0.13mg/l (Figure 2). The concentration of manganese

123
in the first trial ranged from non detectable mg/l to 0.17 mg/l (Figure 2). The
concentration of manganese in the second trial ranged from 0.02 mg/l to 0.04 mg/l and
the third trial ranged from 0.02 mg/l to 0.05 mg/l (Figure 2). The concentration of zinc in
the aquaponics water for the first trial ranged from non detectable to 0.04 mg/l (Figure 2).
The concentration of zinc in the aquaponics water for the second trial ranged from 0.03
mg/l to 0.04 mg/l and the third trial ranged from 0.03 mg/l to 0.05 mg/l (Figure 2).
Throughout the duration of the third trial iron, manganese and zinc maintained detectable
levels (>0.01 mg/l) in the aquaponics system water.
Biomass Analysis and Chlorophyll Concentration Index:
In the first trial, lettuce (L. sativa cv. Rex) was analyzed to determine if there was
a significant difference in head wet weight (grams), head dry weight (grams), and CCI%
between aquaponics and nutrient supplements versus hydroponics. The mean CCI% of L.
sativa cv. Rex was 10.1% ± 0.90% for the aquaponics treatment and 11.4% ± 0.95% for
the hydroponic treatment. There was no significant difference (p≤0.05) in mean head wet
weight (grams) and mean head dry weight (grams) for the Rex cultivar grown with
aquaponics and hydroponic solution (Figure 5 and Figure 6). There was a significant
difference (p≤0.05) in the mean chlorophyll concentration index (%) between the L.
sativa CV. Rex grown with aquaponics water and hydroponic solution (Figure 4).
The second trial consisted of a comparison of the Rex cultivar grown in
aquaponics water plus supplements and hydroponic solution. There was a significant
difference (p≤0.05) in mean head wet weight between lettuce grown with aquaponics
solution plus supplements and hydroponic solution (Figure 5). The aquaponic lettuce had

124
a greater mean head wet weight (182.79 ± 26.90 grams) at harvest compared to the
hydroponic solution. There was no significant difference (p≤0.05) in CCI% between L.
sativa cv. Rex grown with aquaponics water plus supplements and hydroponic solution
(Figure 6). The mean CCI% for the aquaponics lettuce was 8.5% ± 0.63% and the mean
CCI% for the lettuce grown with the hydroponic solution was 8.8%± 0.65%.
The third trial was another comparison of the Rex Lettuce cultivar. The mean
head wet weight was significantly different (p≤0.05) between lettuce grown with
aquaponics solution plus supplements and hydroponic solution (Figure 7). The aquaponic
lettuce had a greater mean head wet weight (176.75 ± 31.04 grams) than the hydroponic
lettuce at harvest (Figure 7). The mean head dry weight was not significantly different
(p≤0.05) between lettuce grown with aquaponics (4.36 ± 0.78 grams) solution plus
supplements and hydroponic (4.60 ± 0.60 grams) solution (Figure 7). There was a
significant difference (p≤0.05) in CCI% between L. sativa cv. Rex grown with
aquaponics water plus supplements and hydroponic solution (Figure 8). The men CCI%
for the aquaponics lettuce was 9.89 ± 0.89% and for the hydroponics lettuce was 8.71 ±
0.45% (Figure 8).
Fish tanks were harvested at the end of the trials. The mean FCR for the fish was
2.56 ± 0.64 and mean fish survival was 82.94% ± 0.07. Fish stocking densities of 110 and
114 fish per growout tank yielded a lower FCR (3.03 and 2.82 respectively) than tanks
stocked with 80 fish (1.83). Any fish mortality that occurred was from fish jumping out
of the tank. There were no mortalities from the supplement additions or other water
chemistry parameters. Fish were fed the same amount of feed throughout the trials to
deliver a consistent amount of nutrients to the aquaponics system.

125
Trial 1 Trial 2 Trial 3
TH2O C0 29.0 ± 1.8 28.4 ± 1.4 29.0 ± 1.8
D.O. (mg/l) 5.2 ± 0.9 5.5 ± 0.3 5.6 ± 0.3
pH 6.8 ± 0.3 6.8 ± 0.1 6.9 ± 0.1 H20
EC (mS/cm) 1.0 ± 0.3 0.9 ± 0.1 0.9 ± 0.2
Tair C0 19.7 ± 2.2 21.7 ± 3.5 21.4 ± 3.0
RH% 39.8 ± 7.4 47.2 ± 6.9 46.7 ± 6.7 Air
PAR (mol/m2 day) 16.5 ± 5.1 13.4 ± 4.1 18.7 ± 2.4
Table 3. Mean water chemistry and environmental parameters for the aquaponic research trials.

126
0.00
25.00
50.00
75.00
100.00
T1s T2s T1f /
T3s
T2f T3f
Trial
mg
/l
Ammonium NH3-N
Nitrate NO3-N
Figure 1. Water chemistry analysis for the aquaponics experiments. Ts is when trials start, Tf is when trials finish. This graph represents the concentration of ammonia-nitrogen and nitrate-nitrogen in the aquaponics water. Nitrate-nitrogen concentration ranged from 18 mg/l to 89 mg/l. The hydroponic solution concentration of nitrate nitrogen was of 180 mg/l.

127
0.00
0.05
0.10
0.15
0.20
T1s T2s T1f /
T3s
T2f T3f
Trial
mg
/l
Iron (Fe)
Manganese (Mn)
Zinc (Zn)
Figure 2. Water chemistry analysis for the aquaponics research trials. Ts is when trials start, Tf is when trials finish. This graph represents the concentration of iron, manganese, and zinc in the aquaponics water throughout the duration of the trials. The concentration of iron, manganese, and zinc in the hydroponic solution was 1.50, 0.25, and 0.20 mg/l respectively.

128
0
50
100
150
200
250
300
Aquaponics Hydroponics
gra
ms
0
2
4
6
8
10
Aquaponics Hydroponics
gra
ms
Figure 3. Mean head wet weight (grams) of L. sativa cv. Rex grown with aquaponics water and hydroponic solution for the first trial (A). Mean head dry weight (grams) of L. sativa cv. Rex grown with aquaponics water and hydroponic solution for the first trial (B). Error bars represent SEM, *represents p≤0.05 as determined by ANOVA.
A
B

129
0.00
2.00
4.00
6.00
8.00
10.00
12.00
14.00
16.00
Aquaponics Hydroponics
%
Figure 4. Mean chlorophyll concentration index (%) of L. sativa cv. Rex grown with of aquaponics and hydroponic solution for the first trial. There is a significant difference (p≤0.05) in CCI% of lettuce (L. sativa cv. Rex) grown with aquaponics water and hydroponic solution. Error bars represent SEM, * represents p≤0.05 as determined by ANOVA.
*

130
0
50
100
150
200
250
300
Aquaponics Hydroponics
gra
ms
0
2
4
6
8
10
Aquaponics Hydroponics
gra
ms
Figure 5. Mean head wet weight (grams) of L. sativa cv. Rex grown with aquaponics water and hydroponic solution for the second trial (A). There is a significant difference (p≤0.05) in mean head wet weight of lettuce (L.sativa cv. Rex) grown with aquaponics water and hydroponic solution. Mean head dry weight (grams) of L. sativa cv. Rex grown with aquaponics water and hydroponic solution for the second trial (B). There is a significant difference (p≤0.05) in mean head dry weight of lettuce (L.sativa cv. Rex) grown with aquaponics water and hydroponic solution. Error bars represent SEM, * represents p≤0.05 as determined by ANOVA.
*
A
B

131
0
2
4
6
8
10
12
14
16
Aquaponics Hydroponics
%
Figure 6. Mean chlorophyll concentration index (%) of L. sativa cv. Rex grown with aquaponics water and hydroponic solution for the second trial. There is no significant difference (p≤0.05) in mean CCI% of lettuce (L.sativa cv. Rex) grown with aquaponics water and hydroponic solution. Error bars represent SEM, * represents p≤0.05 as determined by ANOVA.

132
0
50
100
150
200
250
300
Aquaponics Hydroponics
gra
ms
0
2
4
6
8
10
Aquaponics Hydroponics
gra
ms
Figure 7. Mean head wet weight (grams) of L. sativa cv. Rex grown with aquaponics water and hydroponic solution for the third trial (A). There is a significant difference (p≤0.05) in mean head wet weight of lettuce (L.sativa cv. Rex) grown with aquaponics water and hydroponic solution. Mean head dry weight (grams) of L. sativa cv. Rex grown with aquaponics water and hydroponic solution for the third trial (B). There is no significant difference (p≤0.05) in mean head dry weight of lettuce (L.sativa cv. Rex) grown with aquaponics water and hydroponic solution. Error bars represent SEM, * represents p≤0.05 as determined by ANOVA.
A
B
*

133
0
2
4
6
8
10
12
14
16
Aquaponics Hydroponics
%
Figure 6. Mean chlorophyll concentration index (%) of L. sativa cv. Rex grown with aquaponics water and hydroponic solution for the third trial. There is a significant difference (p≤0.05) in mean CCI% of lettuce (L.sativa cv. Rex) grown with aquaponics water and hydroponic solution. Error bars represent SEM, * represents p≤0.05 as determined by ANOVA.
*

134
DISCUSSION
It has been demonstrated that aquaponics water plus supplementation can grow L.
sativa cv. Rex and L. sativa cv. Tom Thumb with equal or greater biomass accumulation
and comparative chlorophyll indices. This indicates that aquaponics lettuce can be
produced with similar yield and quality compared with conventional hydroponic
solutions when proper nutrient supplementation is added. The micronutrients Iron,
manganese and zinc were added to the aquaponics water along with the addition of
dolomite to increase the buffering capacity of the water. These additions to the
aquaponics water yielded L. sativa cv. Rex of equal fresh head weight and quality
(coloration). The need for supplementation will depend on the system water chemistry
parameters and the plants nutrient demand. The lettuce in the first trial grew larger than
lettuce in the second and third trial because lettuce was allowed to grow for 35 days after
transplant compared to 28 days after transplant. In the third trial lettuce showed no
significant difference in dry weight but had a significant difference in wet weight in favor
of the aquaponics lettuce. The CCI% was also significantly greater in the aquaponics
lettuce thus increasing the photosynthetic capability of the lettuce and possibly driving
more water accumulation in the lettuce.
Lettuce can be grown an aquaponics system utilizing nutrients from the processed
fish waste. The integration of fish and plant systems can yield more efficient production
and less environmental impact compared to conventional agriculture leading to a more
sustainable food production system. The aquaponics system has produced lettuce with
equal or greater growth and chlorophyll concentration indices. It was determined that
aquaponics water provides a good source of nutrients for plant growth. The nitrogen,

135
phosphorous and potassium in the aquaponics system reached a near steady state with the
lettuce production indicating that fish effluent at the densities established can provide a
stable source of macronutrients for plant growth. From this study we conclude that lettuce
grown with aquaponics water plus nutrient supplementation grows at similar rates to
lettuce grown with hydroponic solutions. Supplementation rates will vary depending on
the fish to plant ratio, system design and environmental parameters. Nutrients do not
accumulate at the same rate in relation to each other so certain supplements would be
needed to match the nutrient demand of the target crop. It has been supported that iron,
zinc and manganese accumulate at different rates in aquaponic system (Seawright 1998)
and therefore, must be supplemented accordingly. Nutrients can also be recovered from
the solid fish wastes.
Further research regarding the production of different crops that require different
nutrient demands can lead to different nutrient supplementation protocols. The OMRI
listed nutrient supplement Biomins™ from JH Biotech allowed for specific nutrients to
be targeted and added to the system. This enables the aquaponics system to stay within
organic standards by utilizing OMRI listed nutrient products along with processed fish
effluent to produce sustainable organic vegetables. Future research should focus on
integrating varieties of vegetable crops and tailoring the water chemistry using Biomin™
nutrient supplementations to produce crops of equal or greater yields to agriculture and
hydroponic systems.

136
REFERENCES Antoniou, P., J. Hamilton, B. Koopman, R. Jain, B. Holloway, G. Lyberatos and S.A. Svoronos (1990).
Effect of temperature and pH on the effective maximum specific growth rate of nitrifying bacteria.
Water Research. 24 (1): 97-101.
Both, A.J., L.D. Albright, R.W. Langhans, R.A. Reiser, and B.G. Vinzant. 1994. Hydroponic lettuce
production influenced by integrated supplemental light levels in a controlled environment
agriculture facility: experimental results. International Society of Horticulture Science Acta
Horticulturae 418: III International Symposium on Artificial Lighting in Horticulture.
Britto D. T., Herbert J. Konzucker (2002). NH4+ toxicity in higher plants: a critical review. J. Plant
Physiology 159. 567-584.
Castro, R. S., C.M.S. Borges, and F. Bezerra-Neto. 2006. Increasing cherry tomato yields using fish
effluent as irrigation in Northeastern Brazil. Scientia Horticulturae 110(1):44-50.
Chaves, P.A., L.M. Laird, R. Sutherland and J. Beltrao (2000). Assessment of fish culture water
improvement through integration of hydroponically grown lettuce. Water Science and Technology
42 (1-2) pp. 43-47.
Chervinski, J. (1982). Environmental physiology of tilapias (pp.119-128) In R.S.V. Pullin and R.H. Lowe-
McConnell (eds.), The Biology and Culture of Tilapias. ICLARM Conference Proceedings 7,
Manila, Philippines.
Diver, S. 2006. Aquaponics – integration of hydroponics with aquaculture. Publication No. IP163.ATTRA.
National Sustainable Agriculture Information Service.
Fitzsimmons, K. M. 1991. Intensive tilapia production integrated with field crops in Southwest U.S. In:3rd
International Symposium on tilapia aquaculture. ICLARM. Manilla, Philipines.
Fitzsimmons, K. 1992. Fertilizer value of aquaculture effluents and land disposal as a best management
practice. Proceedings from the National Extension Aquaculture Workshop. Arkansas State 4-H
Center. March 3-7 1992.
Fitzsimmons, K. 2006. Prospect potential for global production. (pp. 51-73) In Chhorn Lim and Carl D.
Webster (Eds.) Tilapia: Biology, Culture and Nutrition. Food Product Press New York, New
York.

137
Goto, E., A.J. Both, L.D. Albright, R.W. Langhans, and A.R. Leed. 1996. Effect of dissolved oxygen
concentration on lettuce growth in floating hydroponics. International Society of Horticulture
Science Acta Horticulturae 440: International Symposium on Plant Production in Closed
Ecosystems.
Hanan, J.J. (1998). Greenhouses. Advanced Technology for Protected Cultivation. CRC Press.
Hanson, A., J. Yabes, Jr., and L. P. Primavera. 2008. Cultivation of Lemon Basil, Ocimum americanum, in
two different hydroponic configurations supplemented with various concentrations of Tilapia
aquaculture green water. BIOS. 79(3):92-102.
Islam, A.K.M.S., D.G. Edwards and C.J. Asher (1980). pH Optima for crop growth results of a flowing
solution culture experiment with six species. Plant and Soil Vol. 54 No. 3 October.
Losordo, T.M., M. P. Masser and J. Rakocy (1999). Recirculating aquaculture tank production systems.
Southern Regional Aquaculture Center (SRAC). SRAC Publication No. 453.
Marschner, H. 1995. Mineral nutrition of higher plants 2nd edition. Academic Press, London, U.K.
McIntosh, D. and K. Fitzsimmons. 2003. Characterization of effluent from an inland, low salinity shrimp
farm: what contribution could this water make if used for irrigation? Aquaculture Engineering
27:147-156.
McMurtry, M.R., P.V. Nelson, D.C. Sanders, and L. Hodges. 1990. Sand culture of vegetables using
recirculating aquaculture effluents. Journal of Applied Agriculture Research 54:280-284.
McMurtry, M. R., D.C. Sanders, J.D. Cure, R.G. Hodson, B.C. C. Hanning, and P.C. St. Amand. 1997.
Efficiency of water use of an integrated fish/vegetable co-culture system. Journal of the World
Aquaculture Society 28:420-432.
Neori, A., T. Chopin, M. Troell, A. H. Buschmann, G. P. Kraemer, C. Halling, M. Shpigel, and C. Yarish.
2004. Integrated aquaculture: rationale, evolution and state of the art emphasizing seaweed
biofiltration in modern aquaculture. Aquaculture 231:361-391.
Quillere, I., L. Roux, D. Marie, Y. Roux, F. Gosse, and J.F. Morot-Gaudry 1995. An artificial productive
ecosystem based on a fish/bacteria/plant association. 2. Performance. Agriculture, Ecosystems and
Environment. 53:19-30.
Rakocy, J. E. and A. Nair. 1987. The status of aquaponics. Part 2. Aquaculture Magazine 25:64-70.

138
Rakocy, J. E., T. M. Losordo, and M.P. Masser. 1992. Recirculating aquaculture tank production systems:
integrating fish and plant culture. SRAC Publication No. 454. Southern Regional Aquaculture
Center, Mississippi State University, Stoneville, Mississippi, USA.
Rakocy, J. E. and J.A. Hargreaves (1993). Integration of vegetable hydroponics with fish culture: A
Review. American Society of Agriculture Engineers, St. Joseph, MI (USA) pp. 112-136.
Rakocy, J.E., D.S. Bailey, C. Shultz and E.S. Thoman (2004). Update on tilapia and vegetable production
in the UVI aquaponic system. Proceedings from the 6th International Symposium on Tilapia in
Aquaculture. Volume 2: 676-690.
Rakocy, J. E., Michael P. Masser and Thomas Losordo 2006. Recirculating aquaculture tank production
systems: aquaponics – Integrating Fish and Plant Culture. Southern Regional Aquaculture Center.
SRAC Publication No. 454
Resh, H. M. (2001). Hydroponic Food Production. Woodbridge Press Publishing Company. Santa Barbra,
CA 93012.
Sabidov, N. A. 2004. Annual report of greenhouse crops program for 2003/2004. CDC South, Brooks,
Canada.
Sabidov, N.A., E. Hutchings, and J.E. Rakocy 2007. Fish and plant production in a recirculating
aquaponics system: a new approach to sustainable agriculture in Canada. Proc. Int. Conf. &
Exhibition on Soilless Culture. Acta Hort. 742:209-222.
Seawright, D.E., R. R. Stickney, and R. B. Walker. 1998. Nutrient dynamics in integrated aquaculture-
hydroponic systems. Aquaculture. 160:215-237.
Takeda, F., P.R. Adler, and D.M. Glenn. 1997. Strawberry production linked to aquaculture wastewater
treatment. Proc. Third Int. Strawberry Symp. Acta Hort. ISHS 439(2):673-677.
Timmons, M.B., J.M. Ebling, F.W. Wheaton, S.T. Summerfelt and B.J. Vinci (2002). Recirculating
Aquaculture Systems 2nd Edition. Northern Regional Aquaculture Center Publication No. 01-002.
Cayuga Aqua Ventures Ithaca, New York.
Tyson, R.V., E.H. Simonne, M. Davis, E.M. Lamb, J.M. White and D.D. Treadwell (2007). Effect of
nutrient solution, nitrate-nitrogen concentration, and pH on nitrification rate in perlite medium.
Journal of Plant Nutrition, 30:901-913.

139
Watanabe, W. O., T. M. Losordo, K. Fitzsimmons and F. Hanley (2002). Tilapia production systems in the
americas: technical advances, Trends and Challenges. Reviews in Fisheries Science, 10(3&4):
465–498.

140
APPENDIX C: NITROGEN REMEDIATION AND
NUTRIENT DYNAMICS IN A CONTROLLED
ENVIRONMENT AQUAPONICS SYSTEM
Agriculture, Ecosystems and the Environment
Jason Licamele, Kevin Fitzsimmons, and Gene Giacomelli Department of Agriculture and Biosystems Engineering, University of Arizona
Controlled Environment Agriculture Center 1951 East Roger Road Tucson, Arizona 85719

141
ABSTRACT
The goal of this study was to determine if there is a significant difference in
nutrient composition of lettuce (L. sativa c.v. Rex) grown with aquaponics water plus
nutrient supplementation and hydroponic solution. The nutrient dynamics of the
aquaponic system was examined through water chemistry analysis. The nutrient flows
were monitored and tailored to achieve nutrient concentrations for optimal plant growth.
The amount of nitrogen removed from the aquaponics system through lettuce biomass
accumulation was determined. In conclusion, aquaponics water plus supplementation can
grow L. sativa cv. Rex with equal biomass accumulation and chlorophyll concentration
index equivalent to traditional hydroponics. This indicates that aquaponics lettuce can be
produced with similar yield and quality compared with conventional hydroponic
solutions when proper supplementation is added. One head of L. sativa cv. Rex (176.75 ±
31.03) will deposit approximately 5.96 grams of nitrogen (3.38% per dry gram lettuce).
One kilogram of fish will yield 6.4 lettuce heads (1,128 grams) and fixate 38.13 grams of
nitrogen. There was a significant increase (p ≤ 0.05) in percent composition of the
micronutrients zinc, manganese, and boron in the leaves of lettuce (L. sativa cv. Rex)
grown with aquaponics water compared to lettuce grow in hydroponic solution. The
mean head wet weight was significantly different (p≤0.05) between lettuce grown with
aquaponics solution plus supplements and hydroponic solution. The aquaponic lettuce
had a greater mean head wet weight (176.75 ± 31.04 grams) than the hydroponic lettuce
at harvest. The mean head dry weight was not significantly different (p≤0.05) between
lettuce grown with aquaponics (4.36 ± 0.78 grams) solution plus supplements and
hydroponic (4.60 ± 0.60 grams) solution. There was a significant difference (p≤0.05) in

142
CCI% between L. sativa cv. Rex grown with aquaponics water plus supplements and
hydroponic solution. The men CCI% for the aquaponics lettuce was 9.89 ± 0.89% and for
the hydroponics lettuce was 8.71 ± 0.45%. The mean FCR for the fish was 2.56 ± 0.64
and mean fish survival was 82.94% ± 0.07. Fish stocking densities of 110 and 114 fish
per growout tank yielded a lower FCR (3.03 and 2.82 respectively) than tanks stocked
with 80 fish (1.83). Lettuce (L. sativa cv. Rex) can be grown with aquaponics water plus
nutrient supplementation and yield adequate nutritional value compared to lettuce grown
with hydroponic solution.

143
INTRODUCTION
Water and land resources are decreasing and as demand for their utilization to
produce food increases their value will increase. Resources used in farming of food
consist primarily of water, land, and feed. All three of these resources are limited.
Agriculture accounts for approximately 70% of the global water use (Rakocy et al. 2006).
Farm irrigation is one of the major sinks for freshwater in the world. Non-point source
pollution from agriculture comprises nitrogen and causes environmental degradation
(Fitzsimmons 1992). It is speculated that a 10% drop in irrigation water can save more
water than water used by consumers (Rogers 2008). Improving water use by agriculture
and food production is critical in order to supply the demand for food in the future (FAO
2003). Establishing proper water management practices will lead to an increase in water
use efficiency and a reduction in environmental pollution. Phosphorous and nitrogen
pollution of surface waterways is attributed to agricultural runoff (Fitzsimmons and
Posadas 1997). Elevated nitrogen and phosphorous levels have been documented to have
negative impacts on aquatic ecosystems (Fitzsimmons and Posadas 1997). Reducing the
amount of nitrogen in agriculture and aquaculture discharge water can reduce the
environmental impact from non point source pollution. This can be done through proper
fertilizer application rates, reducing water discharge by recirculating water, and using
biological organisms to remediate the water. This information will lead to more
conservative agricultural practices that maximum production.
Aquaponics is the integration of recirculating fish production systems with
hydroponic plant production to utilize the fertilizers efficiently. Coupling fish aquaculture
with hydroponic plant culture is more sustainable than conventional agriculture systems

144
(McMurtry et al. 1990; Fitzsimmons 1992; Rakocy et al. 1992; Rakocy and Nair 1987;
Rakocy and Hargreaves 1993). It takes approximately 500 liters of water to produce $100
of product (fish and lettuce), whereas producing cattle takes more than 100 times as much
water to produce $100 of product (Rakocy et al. 2004). Dissolved nutrients from fish are
similar to the nutrients required for hydroponic growth of plants (Rakocy et al. 2006).
The production of fish and vegetables through the integration of fish aquaculture and
plant production has been demonstrated (Fitzsimmons 1991; Fitzsimmons 1992; Rakocy
et al. 1992; McMurtry et al. 1997; Chaves 2000; McIntosh and Fitzsimmons 2003;
Sabidov 2004; Castro et al. 2006; Diver 2006). Popular food crops, such as lettuce, basil,
tomatoes and strawberries, have been successfully cultivated with the use of fish effluent
as the primary fertilizer (McMurtry et al. 1997, Takeda et al. 1997, Rakocy et al. 2004,
Hanson et al. 2008). Intensive RAS can produce more fish per liter of water than other
types of aquaculture systems (Timmons et al. 2002) therefore reducing water used.
Greenhouse hydroponics production can produce from five to ten times more output
compared to conventional agriculture (Resh 2001; Hannan 1998). Aquaponic systems can
yield similar crop production compared to hydroponic systems (Sabidov 2004). Water
from RAS systems can be used in greenhouse hydroponics to intensify production by
utilizing resources more efficiently, potentially reducing water usage by 20-27% (Chavez
et al. 2000).
The concept of aquaponics is to balance the nutrients within a given system.
Nutrients are delivered to the system through an input source, in this case fish feed.
Protein content in the feed dictates the amount of nitrogen that is available to the plants
after the fish assimilate and process the nutrients (Timmons 1996). The density of fish,

145
protein content in the feed, and the feeding rate determine the nutrient loading of the
system. Aquatic animals convert feed to biomass at better rates than other terrestrial food
animals (Parker 2002). Fish require less energy for body support and are cold blooded
therefore expending less metabolic energy for body temperature regulation. This will
yield low feed conversion ratios (FCR), thus producing more product per feed unit.
Wastewater from aquaculture farms primarily discharge water composed of nutrients and
organic matter, which is suitable for plant growth. Water from intensive recirculating fish
culture systems can have total ammonia levels up to 19.2 mg/l, nitrate levels over 500
mg/L, phosphate levels up to 53 mg/L, and potassium levels up to 150 mg/L
(Fitzsimmons 1992). These nutrient levels are suitable for plant growth and can be
manipulated by increasing fish biomass, feed rate, or by increasing the protein levels in
the feed.
Nitrogen is used for protein and amino acid synthesis. Proteins make up structural
tissues, transport oxygen or hemoglobin, regulate reactions as hormones, and catalyze
biochemical reactions as enzymes (Parker 2002; Santamaria 2002). Protein is the primary
nutrient for fish growth and can account for more than 60 percent of fish feed cost (Hatch
and Kinnucan 1993). The Nitrogen cycle is critical for sustaining life by conversion of
harmful waste buildup (ammonia) from animal excretion to a less toxic form (nitrates) for
plant uptake. Ammonia (NH3–NH4+) is oxidized by Nitrosomonas spp. to nitrite (NO2
-)
(Timmons et al. 2002). Nitrite is then oxidized by Nitrobacter spp. to nitrate (NO3-)
which is taken up by the lettuce plants for growth (Broadly et al. 2003). The nitrification
process is an acid forming process which releases H+ in turn increases the pH of the
water (Timmons et al. 2002). Calcium hydroxide and potassium hydroxide, are used for

146
pH stabilization of aquaponic systems (Rakocy et al. 2006). The nitrogen is removed
from the system when the plants are harvested.
Plants use ammonia and nitrates for growth (Marschner 1995). Nitrate is taken up
by the plant at better rates than ammonia nitrite can be toxic to plants (Britto and
Konzucker 2002). Depending on plant species sensitivity symptoms of ammonia toxicity
appear with external ammonia concentrations above 0.1 - 0.5 µmol/L (Britto and
Kronzucker 2002). Ammonia concentrations at elevated levels can inhibit nutrient uptake
in plants by altering the ionic capacity of the water medium. The fish component of an
aquaponics system provides the water with nutrients via feeding and excretion. Plants can
uptake nitrate build up in fish systems serving as a natural filter that can generate profits
simultaneously with the fish.
Lettuce (Lactuca sativa cv.) is commonly cultured in hydroponic and aquaponic
systems. It is a hardy plant that has a fast growth rate (Resh 2001). A marketable lettuce
head weighs a minimum of 150 grams and can be achieved in 3-4 weeks after transplant
under optimal growing conditions (Both et al. 1994; Resh 2001). Lettuce can deposit a
large amount of nitrogen to its leaves and the nitrogen deposition can be manipulated by
plant density and nitrogen availability (Seawright 1998). Fish and plants require water
chemistry that can overlap in range. Tilapia can tolerate a pH from acidic to alkaline (pH
5-11) (Chervinski 1982) and a wide range of salinity concentrations (Watanabe et al.
2002). Lettuce will grow best in a pH range of 5.5-6.5 (Resh 2001, Islam et al. 1980).
Nitrifying bacteria is inhibited below a pH of 6.5, with an optimum pH of 7.8 depending
on bacterial species and temperature (Antoniou et al. 1990; Tyson et al. 2007). Electrical
conductivity levels range between 1-2 mS cm-1for hydroponic lettuce production (Resh

147
2001), well below the levels (2000 uS cm-1) that can be toxic to Nile tilapia (Timmons
2002). Optimal water temperature for Nile tilapia (Oreochromis niloticus) ranges
between 28-35o C (Chervinski 1982) while lettuce grows best at water temperatures
between 21-25oC (Resh 2001). Lettuce grows best at air temperatures between 16 – 25o C
and will bolt in air temperature above 25 – 28o C (Resh 2001). Day temperatures of 24o C
and night temperatures of 19oC coupled with photosynthetic active radiation (PAR) levels
of 17 mol/m2 day were found to produce marketable lettuce heads in 24 days after
transplant (Both et al. 1994). These water parameters can influence the physiology of the
organisms within the aquaponic system and must be monitored and controlled for optimal
system performance.
The goal of this study was to develop a nitrogen budget of an aquaponics system.
The amount of nitrogen removed from the aquaponics system through lettuce biomass
accumulation was determined. A second objective was to determine if there was a
significant difference in nutrient composition of lettuce (L. sativa cv. Rex) grown with
aquaponics water plus nutrient supplementation and hydroponic solution. The nutrient
dynamics of the aquaponic system was examined through water chemistry analysis. The
nutrient flows were monitored and tailored to achieve recommended nutrient
concentrations for expected plant growth.

148
MATERIALS AND METHODS
Aquaponics System Design and Protocol
The University of Arizona Aquaponics Greenhouse (UAAG) structure is a free
standing steel A-frame greenhouse with a double wall polycarbonate glazing. The
greenhouse is oriented in a north-south configuration. The height to the gutter is 2 meters
and height to the ridge is 4 meters. The greenhouse is divided into three separate 7.6
meter by 7.4 meter compartments, each with individual environmental controls. Double
wall polycarbonate panels are used to divide the greenhouse. The north section houses the
fish aquaculture and water filtration systems and the two south bays house the
hydroponic beds.
The aquaculture component of the UAAG is comprised of four 1,300 liter
growout aquaculture tanks, four 190 liter fry and fingerling tanks, and a 3,200 liter gallon
water collection tank. The aquaculture component consists of a total of 9,160 liters. The
tanks were designed and fabricated by GSE Incorporated (Houston, TX USA). The water
from the fish aquaculture and plant hydroponic systems drains into the collection tank. A
Sweetwater® (Aquatic Eco_Systems Inc. Apoka, FL USA) Centrifugal 1.5 horsepower
pump delivers water back to the fish aquaculture system at a rate of 340 liter/minute. A
Sweetwater 1 ¼ horsepower regenerative blower was used to provide aeration to the fish
tanks, biological filter, water collection tank and hydroponic beds. Aero-Tube™ (Tekni-
Plex Inc. Ridgefield, NJ USA) lined the inner perimeter of the growout tanks to provide
aeration. Air stones (15 cm x 4 cm) were used to provide aeration to the fingerling tanks.
Water from the fish aquaculture system is filtered through a mechanical and a biological
filter prior to being distributed to the plants. A Polygeyser™ PG7-PR filter from

149
International Filter Solutions (IFS) (Marion, TX USA) served as the mechanical filter and
a biological filter. The PG7 was plumbed inline with an additional 50 gallon drum filled
with Bio-Spheres™ (Aquatic Eco-Systems Apoka, FL USA) and lined with Aero-Tube™
to provide additional biological filtration. The biological filter contains approximately 0.3
m3 of bio-ball filter media for supporting the maximum fish load (150 kg). Trickling
biological filters can convert approximately 1-2 grams of nitrogen per square meter per
day (Parker 2002). A Hiblow (HiBlow USA Inc. Saline, MI USA) HP-80 linear air pump
delivered air to the PG7 filter at a rate of 1.13 standard cubic feet per hour for
backwashing the beads. The filter was purged daily removing five liters of sludge from
the system.
Each hydroponic bed holds 1,400 liters of water. An AquaFlo ¼ horsepower
pump delivers water to the four hydroponic plant beds at a rate of 340 liters / minute (85
liters per minute per bed). The water is constantly in circulation between the aquaculture
and hydroponic sections. Aero-Tube™ was used to line the perimeter of the beds to
aerate and circulate the water within the bed. There are two plant growing bays, each
plant bay houses two beds. One of the hydroponic beds housed the experimental trials.
The second hydroponic bed was used to maintain proper fish to plant ratios throughout
the trials. Two hydroponic treatments were set up per trial each consisting of a 0.61 meter
by 1.22 meter acrylic box submerged into the aquaponic beds and filled with a
hydroponic lettuce solution. This was done to maintain similar water temperature and
atmospheric conditions (air temperature, relative humidity, and PAR) for the aquaponics
and hydroponic plant treatments.

150
The UAAG was designed to produce tilapia (O. niloticus) for harvest on a
monthly basis and lettuce to be harvested on a weekly basis. Fish tank density ranges
from 30 – 80 kg per tank depending on fish growth and/or planting density. Fish are
grown out to 1 kg for harvest. It was determined from previous studies conducted at the
University of Arizona Environmental Research Lab that 5 kilograms of fish fed 2%
biomass per day throughout the growth cycle of lettuce will yield 32 heads of lettuce
(Licamele et. al. unpublished data 2009). The aquaponics system was online for seven
months prior to the onset of the experimental trials and the water in the system reached a
steady state.
The seeds were germinated for one week prior to transplant. During the
experimental trial there was an initial stocking density of a total of 105 kg of fish
supplying 21 m2 of plant growing area (128 lettuce heads a week). One growout tank had
30 kg of fish, a second had 30 kg of fish, a third was stocked with 35 kg of fish, and a
fourth was stocked with 15 kg of fish. Mean fish weight at stocking was 310 grams per
fish. Fish were fed 2% of the standing initial biomass daily (2.1 kilograms) throughout
the growout cycle of lettuce. The feed used in the experimental trials was manufactured
by Star Milling Company (Table 1). Fish were harvested and the mean Feed Conversion
Ratio (FCR) and mean survival was determined for the aquaponics system. Fish were
harvested, or sorted and put back into the respective tanks for further growout and
maintaining system biomass load for plant growth.

151
Nutrient Supplementation:
Nutrient supplements were added to the aquaponics system throughout the trials
to maintain targeted water chemistry parameters (Table 2). One kilogram of Dolomite 65
Ag Lime was added to the sump every two weeks to maintain a pH of 6.8. Dolomite is
comprised of 46.0% calcium carbonate (CaCO3), 38.5% magnesium carbonate (MgCO2),
22.7 % calcium (Ca), and 11.8% magnesium (Mg). Organic Materials Review Institute
(OMRI) certified Biomin® amino acid chelated minerals were provided by JH Biotech™
(Ventura, CA USA) The first week 800 ml of Biomin® iron (5%), 50 ml of Biomin®
Zinc (7%), and 50 ml of Biomin® Manganese (5%) were added to the aquaponics
system. On the third week of the trial 100 ml of Biomin® iron (5%) and 50 ml of
Biomin® Manganese (5%) were added to the system. Levels equal to or greater than 0.01
mg/l of all nutrients were maintained in the aquaponics water throughout the entire
duration of the experimental trial. All supplements were mixed into a 20 liter bucket and
diluted with water prior to being added to the system. The supplements were added to the
sump and allowed to dissolve into the system for 24 hours before taking a water sample.
A hydroponic solution was formulated for lettuce and used in the hydroponic treatments
(Table 2). The aquaponics targeted water chemistry parameters are listed in Table 2.
Water chemistry analysis allows for determination of the amount of soluble nutrients in
the aquaponics system. A 500 ml water sample was collected every week from the
aquaponics system and sent to a lab for analysis. Water samples were tested by the Soil
and Plant Laboratory Incorporated (Santa Clara, California).
152
Monitoring of Environmental Parameters:
Environmental parameters were monitored and controlled via a network of
sensors connected to a Campbell Scientific™ (Campbell Scientific Inc. Logan, Utah
USA) 21X Data logger. The air temperature (Co) was monitored with a Campbell
Scientific™ 107-L temperature probe. The relative humidity (%) was monitored with a
Campbell Scientific HMP50-L Vaisala™ sensor housed in an aspirator. A Li-Cor™ (Li-
Cor Biosciences Lincoln, NE USA) 190 Quantum sensor was used to capture
photosynthetic active radiation (µmol m-2s-1) available to the plants. Water parameters
were monitored in real time using the Campbell Scientific™ 21X Data Logger and
sensors placed in the water collection tank. A Copper-Constantine thermocouple was
constructed to measure water temperature (Co), a Hanna™ (Hanna Instruments
Woonsocket, RI USA) HI 3001 electrical conductivity (µЅ/cm) sensor, a Hanna HI 1001
pH sensor, and an Oxyguard™ CS512 dissolved oxygen (mg/l) from Campbell Scientific
sensor were used to monitor water parameters in real time throughout the duration of the
experiment. The data was processed and stored on a computer in the control room on the
North side of the greenhouse. The mean water and environmental parameters are listed in
Table 3.
Data Collection and Statistical Analysis:
Lettuce seeds were transplanted one week after germination into the hydroponic
boards at a density of 32 heads per m2. There were 24 data plants per aquaponic and
hydroponic treatment for L. sativa cv. Rex. The wet weight (grams) was taken at harvest
(28 days after transplant) and samples were dried in a drying oven at 50oC for 72 hours

153
before dry weight (grams) was measured. The data was analyzed to test for a significant
difference (p ≤ 0.05) in wet weight, dry weight, and CCI% in lettuce grown with
aquaponics water plus supplements and a hydroponic solution. Six data plants per
aquaponic and hydroponic treatment were sent to the Soil and Plant Laboratory Inc.
(Santa Clara, California) for dry mass analysis. The nutrient content of the lettuce was
tested for a significant difference (p ≤ 0.05) between lettuce grown with aquaponic water
plus supplements and hydroponic solution. The amount of nitrogen removed from the
aquaponic system via the lettuce was calculated. The nutrient composition of the fish feed
and the aquaponics sludge was analyzed by the Soil and Plant Laboratory Incorporated. A
student’s T-test was applied to test for significant differences (p ≤ 0.05).

154
Star Milling Co. Tilapia Feed
Crude Protein 35%
Crude Fat 5%
Crude Fiber 4%
Ash 9%
Nutrient Content
N 5.97%
P 1.53%
K 1.46%
Ca 1.61%
Mg 0.26%
Na 0.24%
S 0.46%
Cu 15 mg/Kg
Zn 143 mg/Kg
Mn 93 mg/Kg
Fe 161 mg/Kg
B 18 mg/Kg
TABLE 1. Tilapia fish diet manufactured by Star Milling Company. The manufacturer’s label is listed in the table. A nutrient analysis of the feed shows the relative concentrations of nutrients per gram of feed.

155
Lettuce
Solution Concentrations Solution Aquaponics
pH 6.50 6.80
Electrical Conductivity (dS/m) 1.80 1.00
Ammonia NH3-N (mg/L) 0.00 0.00
Nitrite NO2 (mg/L) 8.00 0.00
Nitrate NO3-N (mg/L) 180.00 50.00
Boron (B) (mg/L) 0.25 0.20
Calcium (Ca) (mg/L) 150.00 60.00
Copper (Cu) (mg/L) 0.10 0.05
Iron (Fe) (mg/L) 1.50 0.05
Magnesium (Mg) (mg/L) 30.00 30.00
Manganese (Mn) (mg/L) 0.25 0.05
Molybdenum (Mo) (mg/L) 0.05 0.05
PO4-P (mg/L) 25.00 50.00
Potassium (K) (mg/L) 125.00 150.00
Sulfate (SO4)-S (mg/L) 100.00 50.00
Table 2. Water chemistry target parameters for the aquaponics research trials and the hydroponic solution.

156
TH2O C0 28.9 ± 1.8
D.O. (mg/l) 5.6 ± 0.3
pH 6.8 ± 0.1 H20
EC (µS/cm) 0.9 ± 0.2
Tair C0 21.4 ± 3.0
RH% 46.7 ± 6.7 Air
PAR (mol/m
2 day) 18.7 ± 2.4
Table 3. Mean water chemistry and environmental parameters for the aquaponic research trial.

157
RESULTS
Environmental Parameters:
The water and air environmental parameters for the trial are listed in Table 3. The
mean water temperature for the duration of the trial was 28oC. The mean dissolved
oxygen was 5 mg/l, the pH was 6.8, and the mean electrical conductivity was 0.9 ± 0.2
mS/cm for the aquaponics system water (Table 3). The mean air temperature for the third
trial was 21.40 ± 3.00 o C (Table 3). The mean relative humidity was (46.71 ± 6.71 %)
(Table 3). The mean daily integrated photosynthetic active radiation was (18.70 ± 2.42
mol m-2 day-1) (Table 3).
Water Chemistry Analysis:
The nitrate-nitrogen concentration for the trail ranged from 48 mg/l to 89 mg/l
(Figure 1A). Ammonia was present reaching a level of 1 mg/l near the end of the
experiment (Figure 1A). Macronutrient concentration reached a near steady state
throughout the trial, however, sulfate seemed to accumulate at a high rate (Figure 1A).
The iron concentration in the aquaponics water ranged from 0.01 mg/l to 0.13mg/l
(Figure 1B). The concentration of manganese ranged from 0.02 mg/l to 0.05 mg/l (Figure
1B). The concentration of zinc in the aquaponics water ranged from 0.03 mg/l to 0.05
mg/l (Figure 1B). Throughout the duration of the experiment iron, manganese and zinc
maintained detectable levels (>0.01 mg/l) in the aquaponics system water. Concentration
of micronutrients such as iron, zinc, manganese, and molybdenum in the aquaponics
water did show a reduction in concentration over time (Figure 1B). This indicates the
need for micronutrient supplementation at the specified fish to plant ratios of 5 kg of fish
to 32 lettuce heads.

158
Biomass Analysis:
The mean head wet weight was significantly different (p≤0.05) between lettuce
grown with aquaponics solution plus supplements and hydroponic solution (Figure 2).
The aquaponic lettuce had a greater mean head wet weight (176.75 ± 31.04 grams) than
the hydroponic lettuce at harvest (Figure 2). The mean head dry weight was not
significantly different (p≤0.05) between lettuce grown with aquaponics (4.36 ± 0.78
grams) solution plus supplements and hydroponic (4.60 ± 0.60 grams) solution (Figure
2). There was a significant difference (p≤0.05) in CCI% between L. sativa cv. Rex grown
with aquaponics water plus supplements and hydroponic solution (Figure 3). Fish tanks
were harvested at the end of the trial. The mean FCR for the fish was 2.56 ± 0.64 and
mean fish survival was 82.94% ± 0.07. Fish stocking densities of 110 and 114 fish per
growout tank yielded a lower FCR (3.03 and 2.82 respectively) than tanks stocked with
80 fish (1.83). Any fish mortality that occurred was from fish jumping out of the tank.
There were no mortalities from the supplement additions or other water chemistry
parameters. Fish were fed the same amount of feed throughout the trials to deliver a
consistent amount of nutrients to the aquaponics system.
Nutrient Analysis:
The composition of macronutrients and micronutrients in the lettuce grown via
aquaponics and hydroponics are shown in Figure 3. There was a significant difference (p
≤ 0.05) in percent composition per dry gram of lettuce leaf in nitrogen, phosphorous, and
magnesium between lettuce grown in the aquaponics water compared with hydroponic
solution. There was a greater percent concentration of nitrogen (5.22 ± 0.38 %),
phosphorous (1.14 ± 0.07%), and magnesium (0.74 ± 0.13) in lettuce (L. sativa cv. Rex)

159
grown with aquaponics water as compared to hydroponic solution (Figure 4A). There
was no significant difference (p ≤ 0.05) in calcium composition in the leaves of lettuce
(L. sativa cv. Rex) grown with aquaponic water (1.94 ± 0.08) and hydroponic solution
(1.82 ± 0.14). The concentration of potassium and sulfate in the leaves of lettuce (L.
sativa. Cv. Rex) was not significantly (p ≤ 0.05) different in the lettuce grown in
aquaponics water and hydroponic solution (Figure 3A). There was a significant increase
(p ≤ 0.05) in percent composition of the micronutrients zinc, manganese, and boron in the
leaves of lettuce (L. sativa cv. Rex) grown with aquaponics water compared to lettuce
grow in hydroponic solution (Figure 3B). There was no significant difference (p ≤ 0.05)
in percent composition in iron and copper in lettuce (L. sativa cv. Rex) grown with
aquaponics water and hydroponic solution (Figure 3B). The percent nutrient composition
in the aquaponics lettuce (L. sativa cv. Rex) was greater in all micronutrients except
copper (Figure 3B).
Nitrogen Dynamics:
The percent nutrient composition of macronutrients (N-P-K) in the aquaponics
lettuce (L. sativa cv. Rex) was greater than the hydroponic lettuce (Figure 3A). In the
aquaponics lettuce there was 5.22 ± 0.15% nitrogen per dry gram lettuce (Figure 3A). In
the hydroponic lettuce there was 4.62 ± 0.26% nitrogen per dry gram of lettuce (Figure
3A). The nutrient composition of the fish sludge is listed in Figure 4. The percent nutrient
composition of nitrogen (3.38%) and calcium (1.36%) were present in high levels in the
sludge in relation to the other macronutrients (Figure 4A). The nutrient composition of
the fish sludge consisted of elevated levels of iron (759 mg / l) and zinc (233 mg / l)

160
(Figure 4B). One head of L. sativa cv. Rex (176.75 ± 31.03) will assimilate
approximately 9.23 ± 0.05 grams of nitrogen (5.22 ± 0.15% per dry gram lettuce). One
kilogram of fish will yield 6.4 lettuce heads (1,128 grams) and assimilate approximately
58.88 ± 1.69 grams of nitrogen.
A nitrogen model was constructed for the aquaponics system (Figure 5). For
every kilogram of feed put into the system, 59.7 grams of nitrogen is added to the system.
A total of 2.1 kg of fish feed was added to the system daily. Approximately 125.37 grams
of nitrogen were added to the aquaponics system daily via the feed (5.97% nitrogen in
feed). There was a total of 4.39 kg of nitrogen introduced to the aquaponics system over
the 35 day experiment. The fish digest 90% of the proteins in the feed (Timmons et al.
2002) which is comprised of 5.97% nitrogen (Table 1). Aquaponics lettuce was
comprised of 5.22% nitrogen. There was approximately 5 liters of sludge per day
collected from the mechanical filter. The sludge is discharged in aqueous form and is
approximately 2% dry sludge (Timmons et al. 2002). Nitrogen loss that is unaccounted
for consists of nitrogen gas, algae, and micro fauna within the aquaponics system.

161
0.00
50.00
100.00
150.00
200.00
250.00
300.00
0 1 2 3 4
Week after Transplant
mg
/ l
Ammonium NH3-N
Nitrate NO3-N
Phosphorous PO4-P
Potassium (K)
Calcium (Ca)
Magnesium (Mg)
Sulfate (SO4)-S
0.00
0.20
0.40
0.60
0.80
1.00
0 1 2 3 4
Week
mg
/ l
Boron (B)
Copper (Cu)
Iron (Fe)
Manganese (Mn)
Molybdeum (Mo)
Zinc (Zn)
Figure 1. Concentration of macronutrients (A) in the aquaponics water. Concentration of micronutrients in the aquaponics water. Water samples were taken at the onset of the experiment and every week thereafter.
A
B

162
0
50
100
150
200
250
300
Aquaponics Hydroponics
gra
ms
0
2
4
6
8
10
Aquaponics Hydroponics
gra
ms
Figure 2. Mean head wet weight (grams) of L. sativa cv. Rex grown with aquaponics water and hydroponic solution (A). There is a significant difference (p≤0.05) in mean head wet weight of lettuce (L.sativa cv. Rex) grown with aquaponics water and hydroponic solution. Mean head dry weight (grams) of L. sativa cv. Rex grown with aquaponics water and hydroponic solution (B). There is no significant difference (p≤0.05) in mean head dry weight of lettuce (L.sativa cv. Rex) grown with aquaponics water and hydroponic solution. Error bars represent SEM, * represents p≤0.05 as determined by ANOVA.
A
B
*
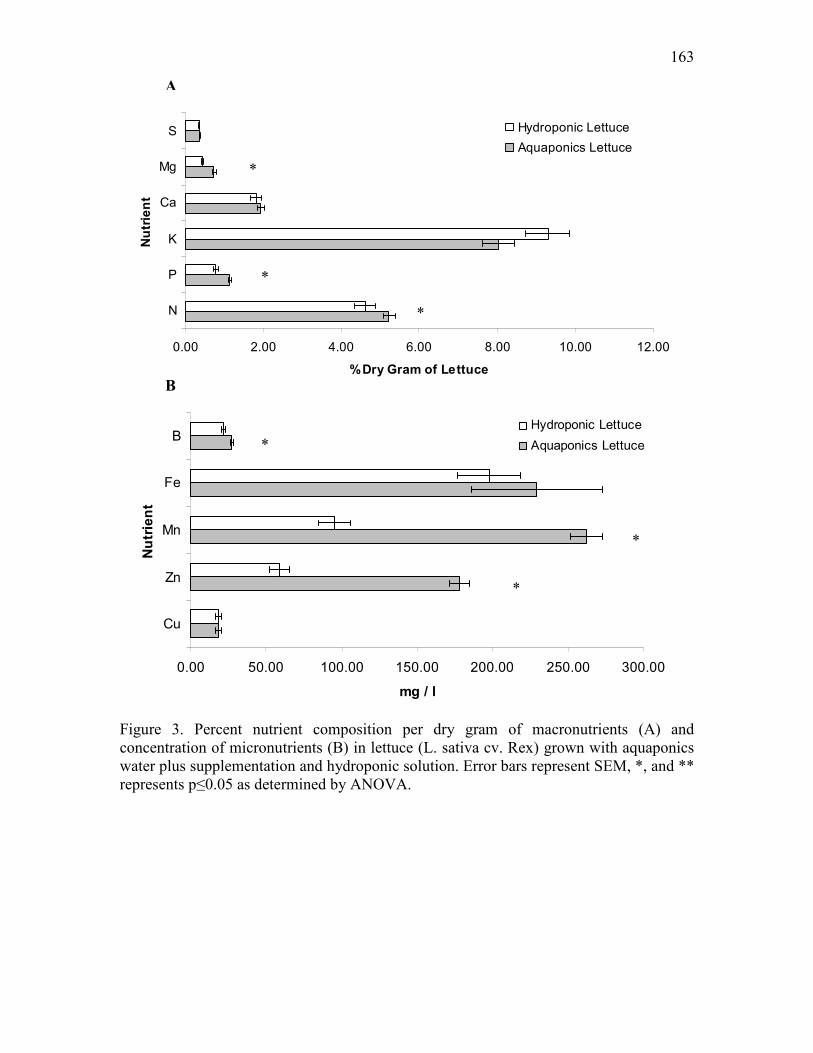
163
0.00 2.00 4.00 6.00 8.00 10.00 12.00
N
P
K
Ca
Mg
SN
utr
ien
t
% Dry Gram of Lettuce
Hydroponic Lettuce
Aquaponics Lettuce
0.00 50.00 100.00 150.00 200.00 250.00 300.00
Cu
Zn
Mn
Fe
B
Nu
trie
nt
mg / l
Hydroponic Lettuce
Aquaponics Lettuce
Figure 3. Percent nutrient composition per dry gram of macronutrients (A) and concentration of micronutrients (B) in lettuce (L. sativa cv. Rex) grown with aquaponics water plus supplementation and hydroponic solution. Error bars represent SEM, *, and ** represents p≤0.05 as determined by ANOVA.
B
A
*
*
*
*
*
*

164
0 2 4 6 8 10 12
N
P
K
Ca
Mg
S
Nu
trie
nt
%
0 200 400 600 800 1000
Cu
Zn
Mn
Fe
B
Nutr
ient
mg / l
Figure 4. Percent nutrient composition of macronutrients (A) and concentration of micronutrients (B) in the aquaponics fish sludge.
A
B

165
Nitrogen Input(5.97% nitrogen in feed)
1 kg fish fed 2% biomass = 20grams feed daily
+ 1.19 grams N per day
Fish90% protein digestion
- 1.07 grams N per day
Sludge(3.38% nitrogen)
2% solids- 0.4 grams sludge per day
0.01% N
- 0.01 grams N per day
Lettuce0.36 grams lettuce per day
(5.22 % nitrogen)0.02% N
- 0.02 grams N per day
Aquaponics Water11,960 liters
62.60 +/- 15.85 mg/l N03-N
Residual in Water748.70 +/- 189.57 grams N03-N
Nitrogen Loss in System:Nitrifying Bacteria
AlgaeMicrofauna
N2 gas
- 0.09 grams N per day
Figure 5. Nitrogen model of an aquaponics system. The nitrogen input in this model is based off of the feed requirement for a kilogram of fish.

166
DISCUSSION
Aquaponics water plus supplementation can grow L. sativa cv. Rex with equal or
greater biomass accumulation and chlorophyll concentration index. This study focused on
the nitrogen flow in the aquaponic system and the composition of aquaponics lettuce
compared to hydroponic lettuce. Aquaponics lettuce can be produced with similar yield
and quality compared with conventional hydroponic solutions when proper
supplementation is added. All of the macronutrients analyzed remained mostly constant
throughout the duration of the experiment with a slight increase in the end. The
micronutrients also remained in a steady state with a very slight increase near the end of
the experiment. Sulfate accumulated throughout the duration of the experiment due to the
content in the fish feed being at concentrations higher than that needed for fish and plant
fixation. The L. sativa cv. Rex lettuce needs nutrient supplementation including iron,
manganese, and zinc to be added to the aquaponics water to yield marketable lettuce. The
level of the supplementation in this experiment was sufficient and can possibly be
reduced with further study. A total of 900 ml of Biomin® iron (5%), 100 ml of Biomin®
Zinc (7%), and 100 ml of Biomin® Manganese (5%) were added to the aquaponics
system throughout the growout cycle of the lettuce. The aquaponics lettuce had a higher
concentration of nitrogen in the leaves compared to the hydroponic treatment. The
concentration of nitrogen in the hydroponic was 180 mg/l compared to the aquaponics
water which had nitrogen levels fluctuating around 50 mg/l. However, this is residual
nitrogen left in the system water, when feed is introduced more nitrogen is introduced to
the system and is assimilated by the plants. Future studies should include real time
monitoring of nitrate-nitrogen concentration to determine the diurnal fluctuations in
nitrogen in an aquaponics system.

167
The need for supplementation will depend on the system water chemistry
parameters and the plants nutrient demand. Nutrient requirements can be different for
each plant cultivar and must be evaluated to achieve optimal production and plant health.
Lettuce can be grown consistently in an aquaponics system thus using water, nutrients
and space more efficiently than conventional agriculture leading to a more sustainable
food production system. The aquaponics system has produced lettuce with equal or
greater chlorophyll concentration indices. Aquaponics water provides a good source of
nutrients for plant growth. The nitrogen, phosphorous and potassium in the aquaponics
system reached a near steady state with the lettuce production indicating that fish effluent
at the densities established can provide a stable source of macronutrients for plant
growth. The micronutrients in the aquaponics system must be monitored and adjusted to
the crop being grown.
Lettuce grown with aquaponics water plus nutrient supplementation grows at
similar rates to lettuce grown with hydroponic solutions. Supplementation rates will vary
depending on the fish to plant ratio, system design and environmental parameters.
Nutrients do not accumulate at the same rate in relation to each other so certain
supplements would be needed to match the nutrient demand of the target crop. It has been
supported that iron, zinc and manganese accumulate at different rates in aquaponic
system (Seawright 1998) and therefore must be supplemented accordingly. Nutrients can
also be recovered from the solid fish wastes. The sludge from the aquaponics system has
a nutrient composition that can be utilized in soil amendments or dissolved back into
solution.

168
Lettuce (L. sativa cv. Rex) can be grow with aquaponics water plus nutrient
supplementation and yield a nutritional value compared to lettuce grown with hydroponic
solution. Values reported for the nutrient composition in the lettuce are similar to lettuce
grown in conventional agriculture and hydroponics (Resh 2001). The composition of
macronutrients and micronutrients in the growing solution can determine the nutrient
content, growth, and health of lettuce (Resh 2001). Lettuce has a low efficiency in using
nitrogen but needs nitrogen constantly to promote growth (Welch et al. 1983).
The nitrogen model for this aquaponics system outlines the flow of nitrogen
within the system. Nitrogen was utilized for growth in both fish and lettuce. Nitrogen was
also lost in the aquaponics system via removal of the sludge. Nitrogen was also utilized in
the system by bacteria and microfauna that reside in the aquaponics system. Nitrogen loss
via these mechanisms was not quantified in this model. The aquaponics system had
residual nitrate nitrogen in the water. Algae did not proliferate in the system because of
the competition of nutrients with lettuce and the constant grazing of algae by the fish in
the fish component. In an aquaponics system nitrogen is either assimilated by organisms
in the system or remains dilute in the water. Nitrogen is not discharged from the system
in a form that causes eutrophication. The aquaponics system utilized approximately 93%
of the nitrogen introduced to the system on a daily basis (Figure 5).
Lettuce and other plant crops prove a valuable remediation tool for fish farming
and aquaculture. Greenhouse or conventional agriculture can integrate lettuce production
to existing aquaculture farms to remediate nitrogen and nutrient discharge. This will in
turn generate a marketable product in the lettuce, but reduce the costs for fertilizers and
reduce environmental degradation commonly associated with large scale agriculture. In

169
an aquaponics system resources (nutrients and water) are shared thus potentially
increasing net profits compared to the individual systems (aquaculture or hydroponics). If
one kilogram of fish will yield 6.4 lettuce heads (1,128 grams) and deposit 38.13 grams
of nitrogen, then a farm can calculate the amount of greenhouse space needed to
remediate the current discharge of fish effluent. The impacts from this can be tremendous
to the environment and costs to farmers. Further research regarding the production of
different crops that require different nutrient demands can lead to different nutrient
supplementation protocols. The OMRI listed nutrient supplement Biomins™ from JH
Biotech allowed for specific nutrients to be targeted and added to the system. Aquaponic
systems can operate within organic certifying standards by utilizing OMRI listed nutrient
products along with processed fish effluent to produce sustainable organic vegetables.
Future research at the aquaponics greenhouse will focus on integrating varieties of
vegetable crops and tailoring the water chemistry using Biomin™ nutrient
supplementations to produce crops of equal yields to agriculture and hydroponic system.

170
REFERENCES
Antoniou, P., J. Hamilton, B. Koopman, R. Jain, B. Holloway, G. Lyberatos and S.A. Svoronos (1990).
Effect of temperature and pH on the effective maximum specific growth rate of nitrifying bacteria.
Water Research. 24 (1): 97-101.
Both, A.J., L.D. Albright, R.W. Langhans, R.A. Reiser, and B.G. Vinzant. 1994. Hydroponic lettuce
production influenced by integrated supplemental light levels in a controlled environment
agriculture facility: experimental results. International Society of Horticulture Science Acta
Horticulturae 418: III International Symposium on Artificial Lighting in Horticulture.
Broadley, M. R., Ido Seginer, Amanda Burns, Abraham J. Escobar-Gutierrez and Phillip J. White 2003.
The nitrogen and nitrate economy of Butterhead lettuce (Lactuca sativa var. capitata L.). Journal
of experimental biology Vol. 54 No. 390: 2081-2090.
Britto D. T., Herbert J. Konzucker (2002). NH4+ toxicity in higher plants: a critical review. J. Plant
Physiology 159. 567-584.
Castro, R. S., C.M.S. Borges, and F. Bezerra-Neto. 2006. Increasing cherry tomato yields using fish
effluent as irrigation in Northeastern Brazil. Scientia Horticulturae 110(1):44-50.
Chaves, P.A., L.M. Laird, R. Sutherland and J. Beltrao (2000). Assessment of fish culture water
improvement through integration of hydroponically grown lettuce. Water Science and Technology
42 (1-2) pp. 43-47.
Chervinski, J. (1982). Environmental physiology of tilapias (pp.119-128) In R.S.V. Pullin and R.H. Lowe-
McConnell (eds.), The Biology and Culture of Tilapias. ICLARM Conference Proceedings 7,
Manila, Philippines.
Diver, S. 2006. Aquaponics – integration of hydroponics with aquaculture. Publication No. IP163.ATTRA.
National Sustainable Agriculture Information Service.
FAO Improving agricultural water use is essential to fight hunger and poverty. 2003
http://www.fao.org/english/newsroom/news/2003/15707-en.html
Fitzsimmons, K. M. 1991. Intensive tilapia production integrated with field crops in Southwest U.S. In:3rd
International Symposium on tilapia aquaculture. ICLARM. Manilla, Philipines.

171
Fitzsimmons, K. 1992. Fertilizer value of aquaculture effluents and land disposal as a best management
practice. Proceedings from the National Extension Aquaculture Workshop. Arkansas State 4-H
Center. March 3-7 1992.
Fitzsimmons, K. and Posadas, B. 1997. Consumer demand for tilapia products in the US and the effects
on local markets in exporting countries. Pp. 613-632. In: Tilapia Aquaculture: Proceedings of
the Fourth International Symposium on Tilapia in Aquaculture. Editor. Fitzsimmons, K.
Northeast Regional Agricultural Engineering Service Publication, No. NRAES - 106. Ithaca, N. Y.
Hanan, J.J. (1998). Greenhouses. Advanced Technology for Protected Cultivation. CRC Press.
Hatch, U., and H. Kinnucan (1993). Aquaculture: Models and Economics. Westview Press Boulder,
Colorado.
Islam, A.K.M.S., D.G. Edwards and C.J. Asher (1980). pH Optima for Crop Growth Results of a Flowing
Solution Culture Experiment with Six Species. Plant and Soil Vol. 54 No. 3 October.
Marschner, H. 1995. Mineral nutrition of higher plants 2nd edition. Academic Press, London, U.K.
McIntosh, D. and K. Fitzsimmons. 2003. Characterization of effluent from an inland, low salinity shrimp
farm: what contribution could this water make if used for irrigation? Aquaculture Engineering
27:147-156.
McMurtry, M.R., P.V. Nelson, D.C. Sanders, and L. Hodges. 1990. Sand culture of vegetables using
recirculating aquaculture effluents. Journal of Applied Agriculture Research 54:280-284.
McMurtry, M. R., D.C. Sanders, J.D. Cure, R.G. Hodson, B.C. C. Hanning, and P.C. St. Amand. 1997.
Efficiency of water use of an integrated fish/vegetable co-culture system. Journal of the World
Aquaculture Society 28:420-432.
Parker, Rick 2002. Aquaculture Science, Second Edition. Delmar Albany, New York 2002.
Rakocy, J. E. and A. Nair. 1987. The status of aquaponics. Part 2. Aquaculture Magazine 25:64-70.
Rakocy, J. E. and J.A. Hargreaves (1993). Integration of vegetable hydroponics with fish culture: A
Review. American Society of Agriculture Engineers, St. Joseph, MI (USA) pp. 112-136.
Rakocy, J. E., T. M. Losordo, and M.P. Masser. 1992. Recirculating aquaculture tank production systems:
integrating fish and plant culture. SRAC Publication No. 454. Southern Regional Aquaculture
Center, Mississippi State University, Stoneville, Mississippi, USA.

172
Rakocy, J.E., D.S. Bailey, C. Shultz and E.S. Thoman (2004). Update on tilapia and vegetable production
in the UVI aquaponic system. Proceedings from the 6th International Symposium on Tilapia in
Aquaculture. Volume 2: 676-690.
Rakocy, J. E., Michael P. Masser and Thomas Losordo 2006. Recirculating aquaculture tank production
systems: aquaponics – integrating fish and plant culture. Southern Regional Aquaculture Center.
SRAC Publication No. 454
Resh, H. M. (2001). Hydroponic Food Production. Woodbridge Press Publishing Company. Santa Barbra,
CA 93012.
Rogers, Peter (2008). “Facing the freshwater crisis” Scientific America. August.
Santamaria, P., E. Antonio, and Francesco Serio 2002. Effect of solution nitrogen concentration on yield,
leaf element content, and water and nitrogen use efficiency of three hydroponically grown rocket
salad genotypes. Journal of Plant Nutrition, 25:245-258.
Sabidov, N. A. 2004. Annual report of greenhouse crops program for 2003/2004. CDC South, Brooks,
Canada.
Seawright, D.E., R. R. Stickney, and R. B. Walker. 1998. Nutrient dynamics in integrated aquaculture-
hydroponic systems. Aquaculture. 160:215-237.
Takeda, F., P.R. Adler, and D.M. Glenn. 1997. Strawberry production linked to aquaculture wastewater
treatment. Proc. Third Int. Strawberry Symp. Acta Hort. ISHS 439(2):673-677.
Timmons MB 1996. Successes and failures in commercial recirculating aquaculture. Aquaculture
Engineering Society Proceedings II. NRAES 98(1):141-150.
Timmons, M.B., J.M. Ebling, F.W. Wheaton, S.T. Summerfelt and B.J. Vinci (2002). Recirculating
Aquaculture Systems 2nd Edition. Northern Regional Aquaculture Center Publication No. 01-002.
Cayuga Aqua Ventures Ithaca, New York.
Tyson, R.V., E.H. Simonne, M. Davis, E.M. Lamb, J.M. White and D.D. Treadwell (2007). Effect of
nutrient solution, nitrate-nitrogen concentration, and pH on nitrification rate in perlite medium.
Journal of Plant Nutrition, 30:901-913.