biomass residues for power generation: a simulation study ... · biomass residues for power...
TRANSCRIPT

Biomass residues for power generation: A simulation study of their
usage at Liberia’s plantations
By Rashmi Krishnan
A thesis submitted
in partial fulfillment of the requirements
for the degree of
Master of Science
(Natural Resources and Environment)
at the University of Michigan
August 2016
Faculty advisor:
Assistant Professor of Practice, Dr. Jose Alfaro


ii
Abstract
This study employs an Agent-Based Model (ABM) to simulate rural electrification in Liberia
using biomass residues from Liberia’s major rubber and oil palm plantations. The model is
constructed using the NetLogo software (v 5.2.0) [1]. We evaluate the use of gasifiers powered
by residues from replanting in major rubber and oil palm plantations, traditionally used for
charcoal production. Since several existing plantations intend to expand their areas of operation,
we assume an annual replanting rate, enabling steady availability of fuel. Projects are evaluated
based on their Net Present Value (NPV) and marginal cost of connection. The electric grid is
extended to districts with the highest NPV, thereby forming an electrical network.
We employ two decision strategies for the general operation of the model. In the first strategy,
Power Plants aim to maximize the level of self-generation to satisfy the plantation’s electricity
demand while in the second they maximize the plantation’s producing area. The first strategy
results in lower investment costs, higher NPV and lower land requirement, with fewer
unelectrified districts.
We find that less than 2% of a plantation’s producing area is sufficient to support the networks
over a period of 30 years. Residential power consumption patterns neither impact land use nor
profitability due to large differences between industrial and residential load consumption
patterns. An increase in annual demand growth rates has a negligible impact on the system.
However, transmission line costs have a high effect on the electrification patterns.

iii
Acknowledgements
I am most grateful to my advisor and mentor, Dr. Jose Alfaro, who demonstrated unwavering
faith in me and gave me the freedom to mold and shape this project as I saw fit. Our
conversations have helped me grow as a researcher and better prepared me for working with
different cultures across the world. I am also grateful to Dr. John DeCicco and Dr. Shelie Miller
for their consistent support, guidance and encouragement. I sincerely thank Ms. Anita Nzeribe,
Ms. Melanie Vant and Mr. Maxime Bainduah from USAID for making many documents
available for my use.
My transformative experience at Ann Arbor and SNRE was greatly enhanced because of my
dearest friends, Mayank Vikas, Stefania Almazan Casali and Alexander Natanson. You inspire
me every day and I cannot thank you enough. To my flatmates and close friends, Rashmi Hegde
and Preeti Ramaraj, I express my utmost gratitude for experiencing my highs and lows with me. I
would like to thank my family for seeing me through the final leg of this Master’s thesis. Thank
you for taking pride in my achievements, cheering me on in all my endeavours and always being
present even though you’re so far away. Thank you, Chintu, Byrav, Shanku and Eshu for giving
me a home away from home. Finally, I would like to thank my friends from Sustainability
Without Borders, the Association for India’s Development and the SNRE community for being
fantastic companions on this journey.
iv
Contents
1. Introduction ................................................................................................................................. 1
1.1 Liberia’s Energy Sector ......................................................................................................... 2
1.2 Rubber and Oil-palm plantations in Liberia .......................................................................... 5
2. Methods....................................................................................................................................... 8
2.1 Model Overview .................................................................................................................. 10
2.2 Agent-Based Modelling ...................................................................................................... 13
2.3 Net Present Value and Levelized Cost of Electricity .......................................................... 19
2.4 Verification.......................................................................................................................... 21
2.5 Validation ............................................................................................................................ 22
3. Results ....................................................................................................................................... 23
3.1 Observer-specified Replanting Rate.................................................................................... 23
3.2 Residential Demand Profile ................................................................................................ 24
3.3 Transmission Infrastructure Cost ........................................................................................ 27
4. Discussion ................................................................................................................................. 28
5. Conclusion ................................................................................................................................ 31
6. References ................................................................................................................................. 33
1
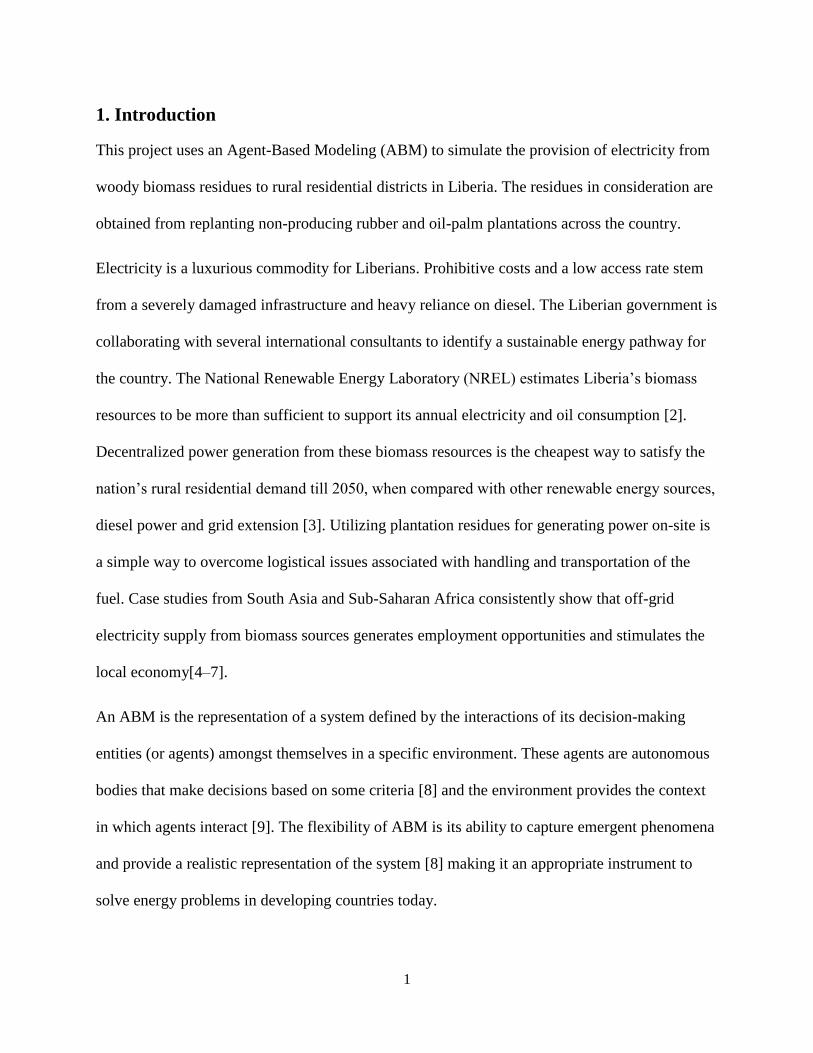
1. Introduction
This project uses an Agent-Based Modeling (ABM) to simulate the provision of electricity from
woody biomass residues to rural residential districts in Liberia. The residues in consideration are
obtained from replanting non-producing rubber and oil-palm plantations across the country.
Electricity is a luxurious commodity for Liberians. Prohibitive costs and a low access rate stem
from a severely damaged infrastructure and heavy reliance on diesel. The Liberian government is
collaborating with several international consultants to identify a sustainable energy pathway for
the country. The National Renewable Energy Laboratory (NREL) estimates Liberia’s biomass
resources to be more than sufficient to support its annual electricity and oil consumption [2].
Decentralized power generation from these biomass resources is the cheapest way to satisfy the
nation’s rural residential demand till 2050, when compared with other renewable energy sources,
diesel power and grid extension [3]. Utilizing plantation residues for generating power on-site is
a simple way to overcome logistical issues associated with handling and transportation of the
fuel. Case studies from South Asia and Sub-Saharan Africa consistently show that off-grid
electricity supply from biomass sources generates employment opportunities and stimulates the
local economy[4–7].
An ABM is the representation of a system defined by the interactions of its decision-making
entities (or agents) amongst themselves in a specific environment. These agents are autonomous
bodies that make decisions based on some criteria [8] and the environment provides the context
in which agents interact [9]. The flexibility of ABM is its ability to capture emergent phenomena
and provide a realistic representation of the system [8] making it an appropriate instrument to
solve energy problems in developing countries today.

2
In the remainder of the thesis, we will introduce the reader to Liberia’s energy and cash crop
sectors. We will then describe the methods used to conduct our analysis, highlight key findings
and discuss our results.
1.1 Liberia’s Energy Sector
Primary energy uses: With a population of 4.5 million, approximately 90% of Liberians rely on
traditional biomass for cooking and heating [10]. While some depend on firewood, a significant
proportion of the population is heavily dependent on charcoal [11]. Imported petroleum products
of major importance are gasoline and diesel fuel oil, while the country also imports jet fuel and
kerosene. These are ultimately used for transportation, electricity and domestic lighting [10].
Rural households generally lack access to electricity, and mainly rely on oil lamps, flashlights
and candles for lighting[6].
Renewable Energy Resource Potential: Liberia has an identified capacity of 967MW for large-
hydro generation according to a project underway to set up a regional electricity market for the
Economic Community of West African States (ECOWAS) [12]. Table 1 shows estimates of
Liberia’s renewable energy potential based on many published works.
Energy Source Estimated Potential Units Source/s
Small Hydro Power (SHP)a 57.3 (1 – 30 MW) MW [13]
86 (1 – 30 MW) MW [14]
200 (< 10 MW) MW [10]
Solar PV 6.67 TWh per year [12]
4 - 6 kWh/m2/day [10], [15]
Biomass 459 MW [12]
26,923 GWh/year [2]
27,452 GWh per year [10]
CSP, Wind 0 MW [12]
Table 1. aThe large variation small hydro potential indicates the need for an updated study on Liberia’s
SHP potential.

3
According to the International Renewable Energy Agency (IRENA), Liberia can support more
than 75% of its electricity generation from its own renewable sources [16]. Several domestic
renewable energy development projects are in the pipeline; however, serious institutional barriers
such as lack of coordination between energy-related organizations and poor renewable energy
data collection and analysis must be overcome so that the country may benefit from tapping its
own resource potential.
The Electricity Sector: With one of the lowest access rates (1.2% rural, 18.9% urban [17]) and
one of the highest tariffs ($0.52/kWh) in the world, most Liberians resort to informal power
producers or self-generation to satisfy their electricity demand.
Prior to the civil wars of 1989-1996 and 1999-2003, Liberia’s installed capacity of 412 MW
powered an operational grid across Monrovia and several stand-alone systems in major towns.
The mining and agricultural industries contributed to approximately half of this capacity [18]. In
the aftermath of a fourteen-year civil conflict and the Ebola epidemic, Liberia seeks to rebuild its
electricity sector as one of many endeavors to regain political and economic stability.
Immediately following the second civil war, the government worked with foreign-aid
organizations to build a small grid in Monrovia of 9.6MW, powered by high-speed diesel
generators [19]. The only electric utility in Liberia, Liberia Electricity Corporation (LEC) was
restored at this time. Presently, Liberia’s power generation capacity stands at 38MW, its
generation mix consisting of Heavy Fuel Oil and Diesel [16,20].
Evolution of Energy Policy: Energy policy in Liberia has been ambitious, and has thus far
maintained its focus on being transformative. One of the first initiatives by the Government of
Liberia (GoL) towards revitalizing its energy sector was the creation of the National Energy
Policy in 2009, which set clear energy access targets for the country to achieve by 2015 [18].
4
This saw the creation of a renewable energy fund (REFUND) and the establishment of the Rural
and Renewable Energy Agency (RREA). At the same time, Liberia also became a member of the
ECOWAS community.
The management contract between LEC and Manitoba Hydro International (MHI) of 2010 was
beneficial to the LEC with the creation of business strategies and short to medium-term plans to
improve the efficiency of the company. However, the public utility plans to expand its services
in Monrovia and surrounding areas and it will be a long time before the rest of Liberia is grid-
connected. In order to overcome this time lag, several transmission infrastructure development
projects are underway such as the Liberia Energy Access Project, Liberia Energy Sector Support
Program, the Cote d’Iviore / Liberia / Sierra Leone / Guinea (CLSG) and cross-border
electrification projects by the West African Power Pool (WAPP). Though these projects are
primarily funded by international donor organizations, they have had difficulty in attracting
private sector funding due to lack of regulation, lack of political will to introduce reforms and
lack of institutional support [21].
Last year, the Liberian senate passed the 2015 Electricity Law of Liberia, which aims to make
the power sector more attractive to private investors by establishing a legal and regulatory
framework for power generation, transmission, distribution and retail. The law also requires the
creation of an Independent Regulatory Commission, who will receive the responsibilities now
held by the Ministry of Lands, Mines and Energy (MLME) [22]. The passage of this bill marks
the beginning of the end of LEC’s monopoly, since it encourages the emergence of Independent
Power Producers (IPPs) and unbundling of the electricity sector through private investment.
Although electricity policy is still in its infancy in Liberia, the country stands to gain by avoiding
common pitfalls like regulatory capture.

5
Although more than 90% of Liberians are heavily reliant on charcoal and woodfuel, the charcoal
industry remains mostly informal and unregulated. Currently, international donor organizations
and the government are focusing primarily on providing access to modern energy services.
However, there is little attention on how to ensure a smooth transition from use of charcoal to
these new services. Jones [23] emphasizes the need for decision-makers to shy away from
assuming that Liberians will transcend the traditional energy ladder, when the use of charcoal is
deep-rooted in the people’s culture and lifestyle. Instead, he encourages decision-makers to
create an institutional, legal and technological framework for the regulated operation of one of
Liberia’s most profitable, environmentally damaging industries that provides employment to
numerous Liberians.
1.2 Rubber and Oil-palm plantations in Liberia
With an aggregate production area of 100,000 hectares, Liberia is a major producer and exporter
of natural rubber in the African continent [24]. Since oil-palm is strategically bred for export,
several large scale government-owned oil-palm plantations were established all over the country
in the 1980s. Both industries are key components of the agricultural sector, which employs more
than 70% of the population [25]. Most of these plantations were abandoned or destroyed during
the civil conflict, and are now under rehabilitation. Due to a sharp decline in commodity prices
and reduced productivity from aged trees, major plantation companies have tremendously cut
back on production [26]. Consequently, this has severely impacted the country’s workforce and
earnings from exports. Natural rubber exports decreased from 36.9% of total exports in 2012 to
17.5% in 2014 [27,28]. Several foreign rubber and oil-palm companies own and operate
industrial plantations in the country. The GoL signed concession agreements with these
companies, allowing them to expand their operations onto much larger areas of land.

6
Table 2 outlines the results of a desk study of bio-power availability from Liberia’s major rubber
and oil palm plantation companies. Although a significant proportion of national production is
from smallholder farmers and companies continue to purchase harvest from them, their policies
of working with smallholders in the future is unclear. It is expected that once companies begin to
profit from replanting, they may compete with smallholder farmers rather than working with
them [29]. The use of residues for power generation is an opportunity to create domestic value in
a country that is highly export-dependent. We expect this socio-economic system to foster a
symbiosis between the charcoal industry, smallholder farmers, plantation companies, the state
utility, IPPs and electricity distribution companies. In the next chapter, we describe the ABM
used to simulate this energy system.
Plantation County Ownership Crop Total Area
(hectares)
Producing
Area
(hectares)
Firestone Margibi Bridgestone Rubber 47753 25000
Liberian
Agricultural
Company (LAC)
Grand Bassa SOCFIN Rubber 22000 9500
Guthrie Bomi Sime Darby Rubber 121406 8907
Senjeh Bomi Sime Darby Rubber 12661 107
Cavalla Maryland SIPH Rubber 35000 5630
The Cocopa
Plantation
Nimba The Liberia
Company
(LIBCO)
Rubber 10117 3441
Salala Rubber
Plantation
Margibi Salala Rubber
Corporation,
SOCFIN
Rubber 8500 4777

7
Plantation County Ownership Crop Total Area
(hectares)
Producing
Area
(hectares)
Sinoe Rubber
Corporation
Sinoe Mesurado Group Rubber 242812 20243
Morris American
Rubber
Company
Montserrado Liberian-owned Rubber 4047 2429
Foya Lofa GoL Oil-
Palm
2300
Kpatawee Bong GoL Oil-
Palm
560
Zleh Town Grand Gedeh GoL Oil-
Palm
830
Dubwe Grand Gedeh GoL Oil-
Palm
1214
Fendell Bong GoL Oil-
palm
70
Mount Coffee Grand Bassa GoL Oil-
palm
13961 5600
Matambo Estate Grand cape
Mount
Sime Darby Oil-
palm
15000 2868
Cape Mount
Estate
Grand Cape
Mount
Sime Darby Oil-
palm
1992
Bomi Estate Bomi Sime Darby Oil-
palm
10000 3179
Lofa Estate Bomi Sime Darby Oil-
palm
1996
Palm Bay Estate Grand Bassa Equatorial Palm
Oil (EPO)
Oil-
palm
13007 5600

8
Plantation County Ownership Crop Total Area
(hectares)
Producing
Area
(hectares)
Butaw Estate Sinoe EPO Oil-
palm
8011 1700
Golden
Veroleum
(GVL) Estates
Sinoe GVL Oil-
palm
12000 2530
GVL Estates Sinoe GVL Oil-
palm
8000 600
Maryland Oil
Palm Plantation
Maryland SIFCA Oil-
palm
15000 9000
Table 2. Sources: [15,30–45].
Note: This list is not exhaustive, and is indicative of the plantations considered in our ABM. Information
on the GoL-owned oil-palm plantations is not readily available, hence the total area is difficult to
estimate.
2. Methods
Two geo-spatial tools for planning rural electrification are extremely relevant to this study. The
NetworkPlanner tool developed by the Sustainable Engineering Lab at Columbia University
(networkplanner.modilabs.org) compares the costs of different power generating technologies
and grid architectures. While it provides great flexibility in using a variety of demand and
transmission infrastructure datasets, its consideration of electricity technologies is limited to
solar and diesel. Its powerful network-planning algorithm develops the least-cost electrical
network that is partially built by extending the existing grid, and also consists of standalone
systems and microgrids.
The Reference Electrification Model (REM), developed by MIT’s Universal Energy Access
Research Group, is a sophisticated version of NetworkPlanner. It considers a consumer’s

9
location, electrification status and type [46] and designs an optimized grid structure based on
technical and economic specifications. As with NetworkPlanner, it considers only solar and
diesel options for power generation.
Modeling the use of biomass residues for power generation is uniquely complicated in that,
biomass availability, fuel quality, costs of transportation and handling must be taken into
account. Buchholz et al. [47] illustrates these calculations by simulating the use of residues from
short-rotation woody crops for combined heat and power in Uganda.
ABM is the ideal tool to analyze this energy system as compared to a traditional optimization
model or an endogenous technological change model [48] since we are dealing with a complex
system. Many variables such as the biomass stock, fuel prices, load consumption pattern and the
structure of the grid itself are in a constant state of flux, so it is key to use a modeling technique
that provides insight into “what could be.” The objective is not to control the energy system,
instead to understand what it could look like in different scenarios, and to guide further analysis
that will aid in better understanding of this system.
Our ABM incorporates the geo-spatial aspects of consumer demand data and flexibility in grid
structure from NetworkPlanner and REM. Although our model assumes power generation at the
plantations’ sites to minimize handling and transportation costs, the user can consider siting
power plants away from the plantations by developing an algorithm based on Buchholtz et al.
[47].
We chose NetLogo due to several reasons. On one hand, its flexibility in managing datasets and
customizing source code allows the decision-maker to specify details in our model with greater
ease. Netlogo’s language and user-friendliness allows the user to refine the model by adding
agents and modify their decision-making processes. Scenarios and algorithms can be easily

10
altered to suit the decision-maker’s criteria. Required inputs can also be modified according to
data availability. As long as the underlying logic is based on a strong empirical foundation, the
results of the ABM will be reliable.
2.1 Model Overview
We seek to answer the following questions using the ABM:
Is it economically feasible to use the biomass residues available at cash crop plantations
to satisfy rural residential electricity demand?
What percentage of plantation area is required to sustain power production?
What percentage of the population’s electrical demand is satisfied?
What is the resulting total installed capacity?
What is the required initial investment?
This model is based on previous work by Alfaro et al. [49], which aims to promote the use of
ABM as a tool for renewable energy planning in developing countries. The authors develop a
strategy to choose from available renewable energy sources for rural electrification using the
Levelized Cost of Electricity metric (LCOE).
This model calculates the optimal sequence of extending the grid from biomass power plants to
Demand Centers (DCs) based on the marginal cost of the connection and the NPV of the project.
Embedded in these metrics are the associated costs and anticipated revenues over the lifetime of
the project. The model was constructed using NetLogo (v5.2.0)[1] with use of the GIS and
Network Extensions.

11
Data and Sources: The construction of political boundaries and rural district population
information is based on data from the Liberia Institute of Statistics and Geo-Information Services
(LISGIS) [49]. Residential DCs are placed at the geometric center of each district boundary.
Each plantation is associated with a resource potential as well as an industrial load profile. The
resource potential at each plantation is estimated according to an annual replanting rate as shown
in Table 3, while their locations were approximated using map data from Google [50–73]. Load
consumption patterns for residents and industries, technology and infrastructure costs were
assumed with reference to energy planning reports in Liberia and the West African region
[3,10,12,74–76]. Power Plants are located at the plantation site. This minimizes the cost of
transportation and handling of residues and the cost of distribution of electricity back to the
plant. As a result, these costs are considered negligible in our model. Figure 1 is a snapshot of
the model after loading the DCs.
Plantation Resource potential
Replant 100%
producing area
(GWh)
Replant 2%
producing area per
year (GWh/year)
Replant 5%
producing area per
year (GWh/year)
Firestone 3038 61 152
Liberian Agricultural
Company (LAC)
1154 23 58
Guthrie 1082 22 54
Senjeh 13 0.26 1
Cavalla 684 14 34
The Cocopa Plantation 418 8 21
Salala Rubber
Plantation
580 12 29
12
Sinoe Rubber
Corporation
2460 49 123
Morris American
Rubber Company
295 6 15
Foya 276 6 14
Plantation Resource potential
Replant 100%
producing area
(GWh)
Replant 2%
producing area per
year (GWh/year)
Replant 5%
producing area per
year (GWh/year)
Kpatawee 67 1 3
Zleh Town 100 2 5
Dubwe 146 3 7
Fendell 8 0.17 0.42
Mount Coffee 672 13 34
Matambo Estate 344 7 17
Cape Mount Estate 239 5 12
Bomi Estate 381 8 19
Lofa Estate 240 5 12
Palm Bay Estate 672 13 34
Butaw Estate 204 4 10
Golden Veroleum
(GVL) Estates
304 6 15
GVL Estates 72 1 4
Maryland Oil Palm
Plantation
1080 22 54
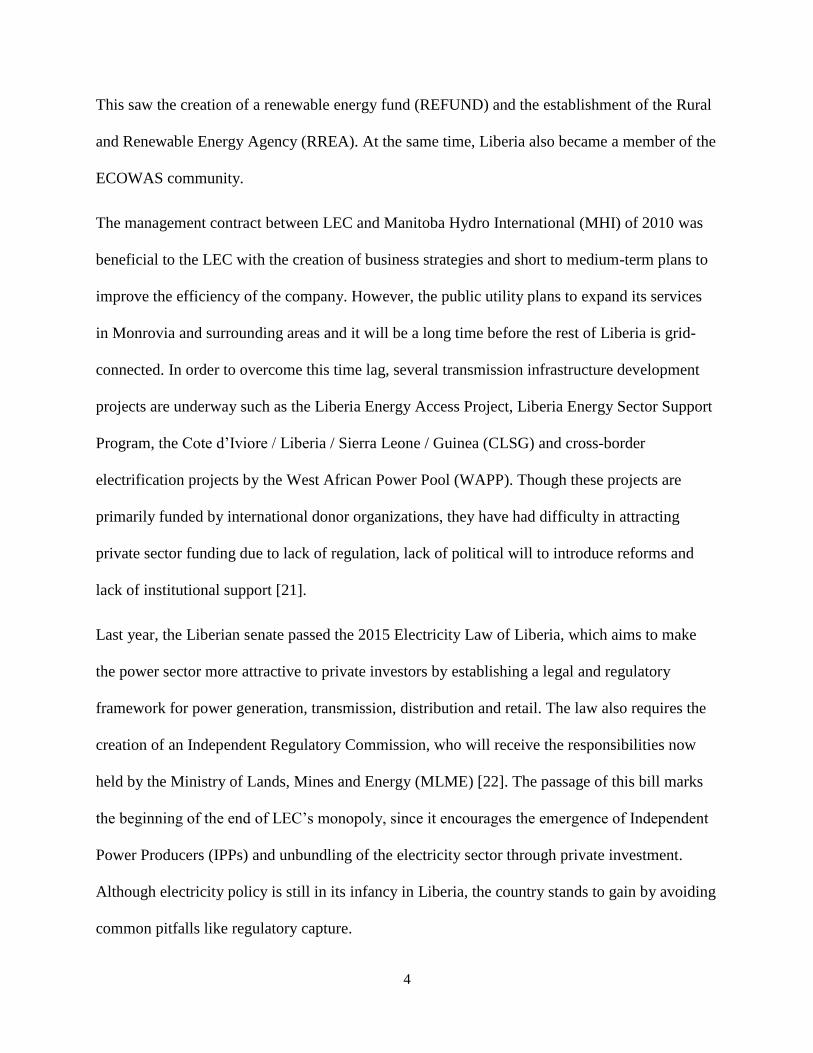
Table 3. Yields of dry woody biomass from replanting for rubber and oil-palm are 81 and 80 dry tonnes
per hectare respectively, thermal efficiency is 1.5 MWhe per dry tonne of biomass [2]. Note: Producing
area is shown in Table 2.
13
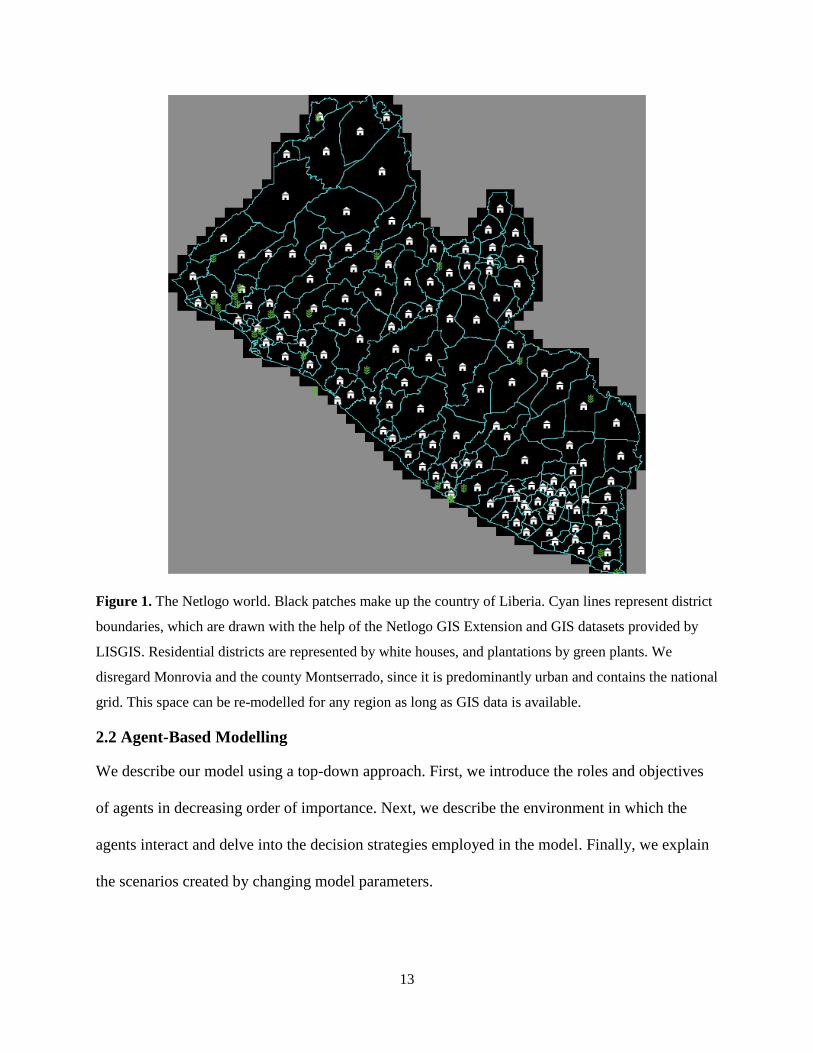
Figure 1. The Netlogo world. Black patches make up the country of Liberia. Cyan lines represent district
boundaries, which are drawn with the help of the Netlogo GIS Extension and GIS datasets provided by
LISGIS. Residential districts are represented by white houses, and plantations by green plants. We
disregard Monrovia and the county Montserrado, since it is predominantly urban and contains the national
grid. This space can be re-modelled for any region as long as GIS data is available.
2.2 Agent-Based Modelling
We describe our model using a top-down approach. First, we introduce the roles and objectives
of agents in decreasing order of importance. Next, we describe the environment in which the
agents interact and delve into the decision strategies employed in the model. Finally, we explain
the scenarios created by changing model parameters.

14
Agents: The Observer sets the values of variables, chooses a decision-strategy to employ and
runs the simulation. Table 4 lists the key parameters that the Observer needs to specify for the
model to yield different outcomes. It also includes our assumptions that form the basis for the
results of this work.
Consumer Demand Pattern
Residential Peak Load (W/household) 130 [75]
Average Plantation Load Factor 0.43 [12]
Plantation Peak Load (W/planted hectare) 200 [15,34,77]
Average Residential Load Factor 0.375 [12]
Annual Demand Growth Rate (%) 2 Assumed
Plantation Variables
Observer-defined Replanting rate (% planted area)a 2 Assumed
Average yield of biomass residue (dry tonnes/hectare) 80.5 [2]
Lower Heating Value (GJ/tonne) 19 [76]
Powerplant Variables
Capital Cost ($/kW) 3600 [74]
Fixed Operations and Maintenance (O&M) Costs ($/kW-year) 162 [74]
Variable O&M ($/MWh) 4 [74]
Fuel Cost ($/ton) 16 [74]
Heat Rate (GJ/MWh) 9.47 [12]
Lifespan (years) 30 [12]
Construction time (years) 4 [12]
Capital spent in the first year of construction 50% [12]
Economic Variables
Discount Rate 10% Assumed
Fuel price inflation rate 1% [6]
Electricity Tariff ($/kWh) 0.3 [6]
Table 4. aObserver-defined Replanting rate needs to be specified when using the Maximum Area
Utilization strategy only.

15
District agents are located at the centroid of each district boundary. They are also DCs whose
demand is estimated based on the local population. Darks are Districts waiting to be electrified
while Incompletes have been electrified but a portion of their demand is unsatisfied. At the time
of loading the world, all Districts are Darks. Each Dark aims to be chosen by a supplier to have
its demand completely satisfied. An Electrified is a District whose demand has been completely
satisfied. Once they become nodes in a microgrid, Electrifieds search for the ideal agent to whom
the grid will be extended at every iteration. Unmets are Districts that have not been electrified at
the end of the simulation.
The Plantation agent supplies Powerplants with biomass residues. They are DCs whose demand
is calculated from the producing area, and the biomass potential is approximated using a user-
specified percentage of producing area that will be replanted every year. Plantations, like
Districts, connect to Powerplants to satisfy their demand. Once satisfied, Plantations also search
for the most profitable DC to whom the grid will be extended, depending on the available power
capacity of their supplier.
The Powerplants generate electricity from residues supplied by the Plantations. They are located
on the same patch as the Plantations to minimize costs of handling and transportation of fuel as
well as distribution costs. They function as suppliers of their electrical networks. All Powerplants
store the load profiles of their consumers and calculate the NPV of their operations at every
iteration. Powerplants aim to utilize their power producing capacity by extending the electrical
network to agents who increase their NPV.
Links are built between agents that are part of an electrical network. A link does not make
decisions, but aids agents connected to it to identify as part of the same microgrid. They behave

16
similar to transmission lines, and assume the properties of 33kv low voltage transmission lines
used for rural electrification infrastructure projects in Africa.
The Patches make up the Netlogo world. They also do not make decisions; rather they aid other
agents in accessing geographic data. Those that belong to the country of Liberia hold the names
of the district and county as attributes.
Environment The simulation is run in three parts. First, the Observer sets parameters and loads
the world. At this point, the GIS dataset is loaded and the DCs are formed. Patches are associated
with a county and district. Districts (now all Darks) have a population, and Plantations are
associated with total and planted areas. While all agents own agent-specific variables, they can
also access global variables in the program. These variables are part of the world, and are set by
the Observer prior to starting the simulation. Figure 2 shows the parameters that the Observer
needs to set prior to setting up the system.
Decision Strategies: Two strategies determine the way Powerplants are sized. In the Satisfying
Plantation Demand (SPD) strategy, the plant is sized based on the plantation demand. Each DC
has a 24-hour load profile. When the Powerplant connects to a Plantation, it sets its capacity to
the maximum hourly load in that profile. As more agents join the Powerplant’s network, it
revises its capacity to the maximum aggregate demand of connected projects. Figure 3 illustrates
the SPD strategy when a Powerplant is connected to one Plantation and one District. It is worth
noting the disparity between residential and industrial load profiles.
In the Maximum Area Utilization (MAU) strategy, Powerplants are sized to the maximum
residues available from re-planting a percentage of the plantation’s producing area. This
potential is estimated as shown in Table 3. The Observer-defined Replanting rate (OR) is the
most important variable in this strategy, since Powerplants cannot revise their capacity once it is

17
set. A very low value may leave insufficient capacity to electrify other districts, and a very high
value may cause revenue loss. The significance of this variable is further explained in the Results
section. The installed capacity is given by the following equation:
𝐼𝑛𝑠𝑡𝑎𝑙𝑙𝑒𝑑 𝐶𝑎𝑝𝑎𝑐𝑖𝑡𝑦 = 𝑌𝑖𝑒𝑙𝑑 × 𝑂𝑅 × 𝑃𝑟𝑜𝑑𝑢𝑐𝑖𝑛𝑔 𝐴𝑟𝑒𝑎 × 𝐿𝐻𝑉
𝐻𝑒𝑎𝑡 𝑅𝑎𝑡𝑒 × 𝑀𝑖𝑛 (𝐷𝑢𝑡𝑦 𝐹𝑎𝑐𝑡𝑜𝑟, 𝐿𝑜𝑎𝑑 𝐹𝑎𝑐𝑡𝑜𝑟)
Figure 2. The Observer specifies parameters listed in Table 4 using NetLogo.

18
Figure 3. Sample Load Profile: Powerplant
Powerplants are built next to every Plantation and links are formed between them, creating the
first links of a microgrid network. At every iteration, all Powerplants not fully utilizing their
capacities indicate to their networks that they are available. Agents in the network shortlist DCs
based on transmission constraints. All shortlisted DCs then calculate the NPV and the Marginal
Cost (MC) of connecting to the nearest available agent in these networks. The network agents
order eligible DCs in decreasing order of NPV. The DC with the highest NPV is chosen and
connected to. In the case of similar NPVs, the agent with lower MC is chosen. The Powerplants
then sum the load curves of connected projects, reset their capacity if necessary, and calculate
NPV and LCOE.
Another crucial metric calculated by Powerplants at every iteration is the Required Replanting
rate (RR). This is calculated when both strategies are employed. RR represents the percentage of
the plantation’s producing area that needs to be replanted every year in order to ensure steady
availability of fuel over the lifetime of the project.
0
1000
2000
3000
4000
5000
1 2 3 4 5 6 7 8 9 10 11 12 13 14 15 16 17 18 19 20 21 22 23 24
Ho
url
y Lo
ad (
kW)
Plantation District

19
Scenario Building: We designed our experiments to determine the effect of residential
consumer demand patterns and transmission infrastructure cost on profitability, fuel stability and
grid structure. In the MAU strategy, we explore the effect of OR (therefore the installed capacity
of Powerplants) on the system. Our measures for profitability are the LCOE and NPV. RR is our
measure for fuel stability. We track the number of Incompletes, Unmets and microgrids formed
at the end of each simulation to conceptualize the structure of the grid.
Scenarios are built through one-at-a-time variation of residential peak load, annual demand
growth rate, residential day load, transmission line cost, discount rate and OR (Table 5).
Strategy Residential
Peak Load
(W/household)
Residential
Day Load
(fraction of
peak)
Annual
Demand
Growth
Rate
(%)
OR (%
producing
area)
Cost of
transmission
line ($/km)
Discount
Rate
(%)
SPD
MAU
110
130
150
0.2
0.3
0.4
0.5
0.5
2
5
1
2
3
4
40,000
80,000
120,000
8
10
12
Table 5.
2.3 Net Present Value and Levelized Cost of Electricity
In the model, Districts and Powerplants calculate their NPV over their lifetime of n years using
the following formula:
𝑁𝑃𝑉 = ∑ 𝑅𝑒𝑣𝑒𝑛𝑢𝑒𝑠
𝑛
𝑖=0
− ∑ 𝐹𝑖𝑥𝑒𝑑 𝐶𝑜𝑠𝑡𝑠
𝑛
𝑖=0
− ∑ 𝑉𝑎𝑟𝑖𝑎𝑏𝑙𝑒 𝐶𝑜𝑠𝑡𝑠
𝑛
𝑖=0
𝑅𝑒𝑣𝑒𝑛𝑢𝑒𝑖 = 𝑇𝑎𝑟𝑖𝑓𝑓𝑖 × 𝐴𝑛𝑛𝑢𝑎𝑙 𝐺𝑒𝑛𝑒𝑟𝑎𝑡𝑖𝑜𝑛𝑖

20
𝐴𝑛𝑛𝑢𝑎𝑙 𝐺𝑒𝑛𝑒𝑟𝑎𝑡𝑖𝑜𝑛𝑖 = ∑ 𝐿𝑜𝑎𝑑𝑗𝑖
24
𝑗=1
× 365
𝐿𝑜𝑎𝑑𝑖+1 = 𝐿𝑜𝑎𝑑𝑖 × (1 + 𝑑𝑔𝑟)𝑖+1
𝑉𝑎𝑟𝑖𝑎𝑏𝑙𝑒 𝐶𝑜𝑠𝑡𝑠𝑖 = 𝐹𝑖 + 𝑉𝑂𝑀𝑖
𝐹𝑖+1 = 𝐹𝑖 (1 + 𝑝𝑖𝑛)𝑖+1
𝐿𝑜𝑎𝑑𝑗 represents load in hour j, 𝑑𝑔𝑟 is the annual demand growth rate. 𝐹𝑖, and 𝑉𝑂𝑀𝑖 represent
the fuel and Variable O&M costs in year i respectively. 𝑝𝑖𝑛 is the annual price inflation rate.
Fixed costs are different for each type of agent. For Districts, the annual costs are calculated so
that each District pays the additional operating cost to the Powerplants towards satisfying its
demand. Each District also pays costs to install and maintain the transmission line for extending
the grid towards it. Due to limited availability of data, the transmission costs in this model are
purely line costs and do not include transformer or distribution costs.
At i = 0,
𝐹𝑖𝑥𝑒𝑑 𝐶𝑜𝑠𝑡𝑠0 = 𝑇𝑟𝑎𝑛𝑠𝑚𝑖𝑠𝑠𝑖𝑜𝑛 𝐶𝑎𝑝𝑖𝑡𝑎𝑙
At i > 0,
𝐹𝑖𝑥𝑒𝑑 𝐶𝑜𝑠𝑡𝑠𝑖 = 𝑇𝑂𝑀𝑖
𝑇𝑂𝑀𝑖 represents the transmission O&M costs in year i.
Powerplants calculate their annual costs at the beginning of every iteration. For the sake of
distributing capital costs over the construction period, we assume that a portion of the total
Capital Cost is paid in year 0. Then the Powerplants pay an instalment each year until the end of
the construction period, along with interest on the amount due.

21
At i = 0,
𝐹𝑖𝑥𝑒𝑑 𝐶𝑜𝑠𝑡𝑠0 = 𝐶𝑎𝑝0
While i > 0 and i <= k - 1,
𝐹𝑖𝑥𝑒𝑑 𝐶𝑜𝑠𝑡𝑠𝑖 = 𝐶𝑎𝑝𝑖 + 𝑑 × ∑ 𝐶𝑎𝑝𝑗
𝑘−1
𝑗=𝑖
𝐶𝑎𝑝𝑖 represents the installment of Capital Costs in year i over a construction period of k years. 𝑑
represents the discount rate.
At i >= k,
𝐹𝑖𝑥𝑒𝑑 𝐶𝑜𝑠𝑡𝑠𝑖 = 𝐹𝑂𝑀𝑖
𝐹𝑂𝑀𝑖 represents the fixed O&M costs in year i.
The calculation of LCOE for Powerplants and Marginal Cost for DCs is adapted from the
formula recommended by IRENA [78]. Notations are consistent with those defined earlier.
𝐿𝐶𝑂𝐸 =
∑𝐹𝑖𝑥𝑒𝑑 𝐶𝑜𝑠𝑡𝑠𝑖 + 𝑉𝑎𝑟𝑖𝑎𝑏𝑙𝑒 𝐶𝑜𝑠𝑡𝑠𝑖
(1 + 𝑑)𝑖𝑛𝑖=0
∑𝐴𝑛𝑛𝑢𝑎𝑙 𝐺𝑒𝑛𝑒𝑟𝑎𝑡𝑖𝑜𝑛𝑖
(1 + 𝑑)𝑖𝑛𝑖=0
2.4 Verification
The process of verification is done to ensure that the model is behaving as it was intended. While
building the model, we tracked the behavior of random individual agents whenever changes to an
agent’s decision strategies were made. Many of these verifications were visual, by continuously
using the ‘View Updates’ feature in NetLogo as the model progressed. We also printed outputs
for random individual agents at different stages of the model’s construction to ensure that there
were no bugs in the code. Wherever applicable, we tested the sensitivity of outputs to changing

22
inputs and compared them with separately computed values. Once the model was complete,
individual Powerplant outputs were printed for all the scenarios listed in Table 5. These outputs
were found to be consistent with theoretical expectations.
2.5 Validation
Validation is confirmation that the model approaches reality. Data inputs to this model were
gathered from research either in Liberia or in the West African region, and closely reflect
present-day values. Since the intention of this model is to create informed choices for an energy
system that does not exist, it is not possible to compare its outputs with the real-world.
Validation through historical backcasting is also not applicable. Hence, we seek to validate the
model through subject matter experts by engaging multiple stakeholders such as the RREA, LEC
and plantation companies. Their evaluation of the model will ensure its validity. Next, we aim to
validate this model by comparing its results with an already validated model like the
NetworkPlanner tool. Alternatively, we would validate it against a replica which models the
system using a different methodology such as System Dynamics. Finally, depending on the
resources available to us, we would seek to build a prototype microgrid to check if our
representation of the system captures important relationships and patterns in reality.

23
3. Results
3.1 Observer-specified Replanting Rate
Figure 4. Effect of OR on Grid Structure
On average, approximately 94 districts (out of 134) are left unelectrified at a low OR of 1% due
to insufficient or unsuitably located capacity. The contribution of transmission costs to the total
costs varies from 10% to 5%, while overnight capital costs rapidly increase by 300% as OR
increases (Figure 5). The NPV of the system dips due to high capital costs that are not recovered
over the lifetime of the project, while more Powerplants gain the capacity to support microgrids.
Since producing area varies widely across plantations, a higher OR would make Powerplants
attached to smaller plantations capable of powering more districts, whereas those supplied by
larger plantations would operate in loss because of a low load factor. To provide a more useful
insight into the behavior of the system, we analyze further results of the model using OR values
of 2% and 3% only.
0
10
20
30
40
50
60
70
80
90
100
1 2 3 4
Nu
mb
er
of
Mic
rogr
ids,
Un
me
ts,
Inco
mp
lete
s
OR (% Producing Area)
Average Microgrids Average Incompletes Average Unmets

24
Figure 5. Effect of OR on Profitability
3.2 Residential Demand Profile
Day Load (6AM to 6PM): There is a significant difference in the average LCOE resulting from
the two strategies (Figure 6). The LCOE in the MAU strategy fluctuates from $0.3/kWh to
$0.35/kWh, while the range is much lower for the SPD strategy from $0.13/kWh to $0.15/kWh.
The day load, input as a percentage of the peak load, is gradually increased in steps of 10
percentage points from 20% to 50% of the peak. The decrease in LCOE with the increase in day
load indicates that Powerplants see a substantial benefit when there is increased usage of power
generation during the day. Interestingly, the steeper slope in the MAU strategy shows that these
Powerplants have a larger capacity and a lower load factor. As expected with decreasing LCOE,
the aggregate NPV of all Powerplants averaged across simulations is seen to increase (Figure 7).
NPV in the MAU strategy is significantly lower than the SPC strategy, and rises sharper with
increase in day load.
-400
-200
0
200
400
600
800
1000
1 2 3 4
Cap
ital
Co
st, T
ran
smis
sio
n C
ost
, NP
V
(Mill
ion
$)
OR (% Producing Area)
Average Overnight Capital Cost (Million $)
Average Transmission Cost (Million $)
Aggregate NPV (Million $)

25
Figure 6. Effect of Residential Base Load on LCOE
Figure 7. Effect of Residential Base Load on NPV
Residential Peak Load: We varied peak demand per household from 110W to 150W in
intervals of 20W. In the SPD strategy, there was a marginal increase in LCOE as peak load
increased (Figure 7, $0.1376/kWh to $0.1382/kWh) while NPV saw a significant increase
(Figure 8). The higher LCOE may be attributed to slightly greater fixed costs, since Powerplants
size their capacity according to the maximum hourly demand in their network (Section 2.2).
0.00
0.05
0.10
0.15
0.20
0.25
0.30
0.35
0.40
0 0.1 0.2 0.3 0.4 0.5 0.6Leve
lize
d C
ost
of
Ele
ctri
city
($
/kW
h)
Residential Base Load (% Peak Load)
SPD MAU
0.00
50.00
100.00
150.00
200.00
250.00
300.00
350.00
400.00
450.00
500.00
0 0.1 0.2 0.3 0.4 0.5 0.6
Ne
t P
rese
nt
Val
ue
(M
illio
n $
)
Residential Base Load (% Peak Load)
SPD MAU

26
Increasing NPV indicates that the annual revenue to Powerplants from increased sales of
electricity is much greater than the increase in the annual costs. In the MAU strategy, the results
are similar to those with increasing day load; decreasingCOE and an increasing NPV. The
difference in slopes between these points hints at a non-linear relationship between household
peak load and profitability, which may be a worthwhile investigation in the future.
Figure 8. Effect of Residential Peak Load on LCOE
Figure 9. Effect of Residential Peak Load on NPV
0.00
0.05
0.10
0.15
0.20
0.25
0.30
0.35
0.40
100 110 120 130 140 150 160Leve
lize
d C
ost
of
Ele
ctri
city
($
/kW
h)
Residential Peak Load (W/Household)
SPD MAU
0.00
50.00
100.00
150.00
200.00
250.00
300.00
350.00
400.00
450.00
500.00
100 110 120 130 140 150 160
Ne
t P
rese
nt
Val
ue
(M
illio
n $
)
Residential Peak Load (W/Household)
SPD MAU

27
Increase in residential consumption yielded numerically similar results for RR. In all 14 cases,
RR was consistently lower than 1.8% of the Plantation’s producing area. However, it is key to
remember that this number represents the average RR among all Plantations, and it is very likely
that smaller Plantations will need to replant a slightly higher percentage of their producing area
every year. The consistent difference between RRs from the two strategies may be attributed to
the variation in the size and shape of microgrids.
Figure 10. Effect of Residential Base Load on RR
3.3 Transmission Infrastructure Cost
The transmission infrastructure cost considered in the model is only the line cost, we do not
include transformer or distribution costs. The relationship between the number of districts
electrified and transmission line cost is clearly non-linear (Figure 11). As the line cost
approaches $120,000/km, Powerplants find fewer viable districts to connect with. As many as 8
districts are unelectrified in the MAU strategy, whereas 3 districts are not connected to the grid
in the SPD strategy.
0.00
0.20
0.40
0.60
0.80
1.00
1.20
1.40
1.60
1.80
2.00
0 0.1 0.2 0.3 0.4 0.5 0.6Re
qu
ire
d R
ep
lan
tin
g R
ate
(%
Pla
nte
d
Are
a)
Residential Base Load (% Peak Load)
SPD MAU

28
Figure 11. Effect of Line Cost on Unelectrified Populations
4. Discussion
Buchanan Renewables Energy (BRE) has previously attempted to use non-productive trees from
rubber plantations for biofuel and power production in Liberia, shortly after the end of the civil
conflict. Poor regulation, lack of transparency in the concession agreements and the
government’s inability to protect the rights of smallholder farmers and workers in the charcoal
industry are some of the major reasons for BRE’s lack of success [79,80].
Rubber, oil-palm and rice are agricultural resources that attract extractive investment in Liberia.
Though well-intentioned, the concession agreements have not lead to the anticipated
consequences of increased employment generation, a skilled labor force and a stabilized
economy. The Liberian government is unhappy with the continued lack of indigenous production
and extractive nature of commodity export, and intends to review the concession agreements in
the near future [81]. Currently, oil-palm and rubber plantation companies can operate on 620,000
hectares and 370,000 hectares respectively over the next 45 - 60 years [82]. Most of this land has
0.00
1.00
2.00
3.00
4.00
5.00
6.00
7.00
8.00
9.00
0 20000 40000 60000 80000 100000 120000 140000
Nu
mb
er
of
Dis
tric
ts U
ne
lect
rifi
ed
Transmission Line Cost ($/km)
SPD MAU

29
not yet been planted with oil-palm and rubber, contains sites of ecological and cultural
importance, and is home to indigenous tribes.
The negative impacts of industrial plantation companies on the lives of the local people in Asia
and Africa are well documented [24][83]. Major plantation companies in Liberia are not alone in
violating human rights on accounts of slave labor, terrible working conditions and persecution of
indigenous people to surrender their lands [84]. Like many of their international counterparts,
they have also been guilty of causing severe environmental damage through monoculture
cropping, deforestation and habitat destruction. In addition, they have had a troubling history of
encroaching indigenous property and destroying cultural heritage sites[85].
There are many ongoing attempts to effectively regulate industrial plantation companies. The
Roundtable on Sustainable Palm Oil (RSPO) is one such initiative, where members develop
country-specific principles and practices for sustainable oil-palm production in the local context
[86]. RSPO members range from plantation companies to banks and civil societies. One of many
relevant Liberian laws is the Environmental Protection and Management Law of 2002, which
mandates that all activities that will significantly impact the environment must undergo an
Environmental Impact Assessment (EIA)[76]. The guidelines to conduct these assessments are
prepared by the Liberian Environmental Protection Agency (EPA). According to the RSPO,
plantation companies are required to conduct and make publicly available, an Environmental and
Social Impact Assessment (ESIA) as well as a High Conservation Value (HCV) assessment.
Companies operating in the extractive industry are required to comply with the procedures of the
Liberia Extractive Industries Transparency Initiative (LEITI), an agency dedicated to transparent
management of extractive industries in the country [87]. We anticipate that the decision makers
listed in Table 6 will be instrumental in establishing and sustaining this bio energy system.

30
Name Specific Objective Level of
Jurisdiction
ECOWAS Center for
Renewable Energy and
Energy Efficiency (ECREE)
Overcome barriers and create favorable
conditions for regional renewable energy
and energy efficiency markets across
ECOWAS member states.
International
West African Power Pool
(WAPP)
Promote and develop power generation and
transmission infrastructure, set up a regional
electricity market across ECOWAS member
states.
International
Ministry of Lands, Mines and
Energy (MLME)
Coordinate with development partners to
oversee the development of energy projects
and ensure their compliance with current
policies and legislation. Regulate the
functioning of LEC.
National
Rural and Renewable Energy
Agency (RREA)
Work with communities to provide
affordable electricity to off-grid, rural areas
through low-carbon pathways using a
dedicated public fund for renewable energy.
National
Liberia Electricity
Corporation (LEC)a
Extend the grid across Monrovia and its
surrounding areas, and ensure grid
reliability. Engage in power generation,
Transmission and Distribution (T&D) and
retail of electricity.
Monroviab
Name Specific Objective Level of
Jurisdiction
Forest Development
Authority (FDA)
Regulate and manage commercial forestry,
community forestry and conservation
forestry in Liberia.
National
National Bureau of
Concessions
Monitors and manages legal and financial
aspects of concessions in Liebria
National

31
National Charcoal Union of
Liberia (NACUL)
Build capacity within the charcoal industry. Monrovia and
surrounding
areas
National Oil Company
(NOCAL) and Liberia
Petroleum Refining
Company (LPRC)
Administer and regulate the upstream and
downstream petroleum sector according to
policies and legislations set by MLME.
National
The World Bank, USAID,
African Development Bank,
Norwegian Agency for
Development Corporation
Work with government agencies in Liberia
to develop and implement energy access
projects. Support these projects through
financial and technological aid.
International
Table 6. Developed with reference to [76], which describes the involvement of government organizations
in greater detail.
aIn 2010, LEC signed a management contract with Manitoba Hydro International (MHI), allowing the
Canadian firm to take over its business operations and develop strategies to ensure the utility’s efficient
performance over the next five years[88]. LEC plans to enter into another strategic partnership with MHI
soon.
bSince LEC is the only utility in the country and it is publicly funded, its jurisdiction is limited to the
extent of the national grid, which currently exists in Monrovia.
5. Conclusion
The results of our ABM indicate that change in residential power consumption patterns would
not significantly impact land use. An increase in residential power consumption would simply
make the power generation more effective, and is favorable to the power plants. Less than 2% of
a plantation’s producing area is sufficient to support this system over a project lifetime of 30
years. We found that an increase in annual demand growth rates had a negligible impact on the
system, while the impact of transmission line cost was significant. As a result of huge disparities
between industrial and residential load consumption patterns, the SPD strategy resulted in lower
investment costs, higher NPV and lower RR, with fewer unelectrified districts. It is important to

32
remember that this model is a simplistic representation of the grid, and is not indicative of actual
power flows.
To effectively implement this model and ensure that this system sustains itself, it is essential to
establish a decentralized power structure early on. IPPs will need to collaborate with the
plantation companies and charcoal producers in order to procure fuel without drastically altering
the informal, yet vital economy and severely impacting the environment. The Forest
Development Authority can halt illegal expansions by the plantation companies into forests. It
would be prudent for them to approve of the Environment and Social Impact Assessment as well
as the High Conservation Value Assessment, in addition to the RSPO. T&D infrastructure costs
cannot be handled by the power producers since they cannot control power flow. The Liberian
Energy Sector needs to encourage the creation of independent entities owning, operating and
maintaining the T&D system. Future versions of the model will need to incorporate the
anticipated results of the transmission infrastructure projects to improve validity. Stakeholders
whose interests are most at risk like smallholder farmers, indigenous communities and informal
charcoal producers must be empowered with equitable participation in decision-making
processes. With collaboration and careful regulation, the suppressed electricity demand of
Liberians can be met in a cost-effective way with reduced dependency on imports, while
bolstering the local economy and preserving its forests.

33
6. References
[1] U. Wilensky, NetLogo, (1999).
[2] A. Milbrandt, Assessment of Biomass Resources in Liberia, Golden, Colorado, 2009.
[3] J. Alfaro, S. Miller, Satisfying the rural residential demand in Liberia with decentralized
renewable energy schemes, Renew. Sustain. Energy Rev. 30 (2014) 903–911.
doi:10.1016/j.rser.2013.11.017.
[4] I. Da Silva, T. Buchholz, J. Furtado, Power from wood gasifiers in Uganda: a 250 kW and
10 kW case study, Proc. ICE - Energy. 165 (2012) 181–196. doi:10.1680/ener.12.00005.
[5] R. Pode, B. Diouf, G. Pode, Sustainable rural electrification using rice husk biomass
energy: A case study of Cambodia, Renew. Sustain. Energy Rev. 44 (2015) 530–542.
doi:10.1016/j.rser.2015.01.018.
[6] USAID Liberia; Winrock International, Detailed Project Feasibility Report Volume 1 -
Main Report: Kwendin Biomass Electricity Project, Monrovia, Liberia, 2012.
[7] S.C. Bhattacharyya, Viability of off-grid electricity supply using rice husk: A case study
from South Asia, Biomass and Bioenergy. 68 (2014) 44–54.
doi:10.1016/j.biombioe.2014.06.002.
[8] E. Bonabeau, Agent-based modeling: Methods and techniques for simulating human
systems, Proc. Natl. Acad. Sci. 99 (2002) 7280–7287. doi:10.1073/pnas.082080899.
[9] U. Wilensky, R. William, What Is Agent-Based Modeling?, in: Introd. to Agent-Based
Model. Model. Nat. Soc. Eng. Complex Syst. with NetLogo, The MIT Press, Cambridge,

34
2015: pp. 21 – 43.
[10] Rural and Renewable Energy Agency, Republic of Liberia Investment Plan for Renewable
Energy, 2013.
[11] P.K. Wesseh, B. Lin, Renewable energy technologies as beacon of cleaner production: a
real options valuation analysis for Liberia, J. Clean. Prod. 90 (2015) 300–310.
doi:10.1016/j.jclepro.2014.11.062.
[12] A. Miketa, B. Merven, West African Power Pool: Planning and Prospects for Renewable
Energy, Abu Dhabi, 2013.
[13] H. Liu, D. Masera, L. Esser, World Small Hydropower Development Report 2013, 2013.
www.smallhydroworld.org (accessed June 24, 2016).
[14] ECOWAS Centre for Renewable Energy and Energy Efficiency (ECREEE), The
ECOWAS Small-Scale Hydro Power Program First Phase: 2013 to 2018, Praia, Cape
Verde, 2012. http://www.ecreee.org (accessed June 24, 2016).
[15] Africa Energy Unit, Options for the Development of Liberia’s Energy Sector,
Washington, DC, 2011.
[16] A. Miketa, N. Saadi, Africa Power Sector: Planning and Prospects for Renewable Energy,
(2015).
[17] World Bank, Access to electricity (% of rural population with access), Access to
electricity (% of urban population with access), Sustain. Energy All . (2012).
http://databank.worldbank.org/data/reports.aspx?source=sustainable-energy-for-

35
all&Type=TABLE&preview=on# (accessed June 15, 2015).
[18] M. and E. Ministry of Lands, Republic of Liberia National Energy Policy, 2009.
http://www.moci.gov.lr/doc/National Energy Policy 2009.pdf (accessed June 20, 2016).
[19] World Bank, Emergency Project Paper on a Proposed Credit to the Republic of Liberia for
an Electricity System Enhancement Project, 2010.
[20] Daily Observer, Liberia: LEC Completes 18 Megawatt Power Plant, All Africa. (2016).
http://allafrica.com/stories/201605301311.html (accessed June 20, 2016).
[21] International Development Group LLC., Learning, Evaluation & Analysis Project - II
Liberia Energy Sector Support Program Performance Monitoring and Evaluation - Final
Report, 2015.
[22] B. Carter J., Senate Passes 2015 Electricity Law, Dly. Obs. (2015).
http://www.liberianobserver.com/news/senate-passes-2015-electricity-law (accessed June
27, 2016).
[23] B. Jones, Social and Environmental Impacts of Charcoal Production in Liberia, University
of Michigan, 2015. http://hdl.handle.net/2027/mdp.39015089715869 (accessed June 27,
2016).
[24] R. Carrere, S. Veuthey, J.-F. Gerber, Oil palm and rubber plantations in Western and
Central Africa : An Overview, 2008.
[25] Ministry of Agriculture, Social Protection and Agriculture: Breaking the cycle of rural
poverty. World Food Day Special Edition., Monrovia, Liberia, 2015.

36
[26] J. Aglionby, Bridgestone nurses heavy losses in Liberia as rubber price falls, Financ.
Times. (2016). https://next.ft.com/content/9b2b54a2-dbbb-11e5-a72f-1e7744c66818
(accessed June 28, 2016).
[27] Central Bank of Liberia, Central Bank of Liberia Annual Report 2014, Monrovia, 2015.
https://cbl.org.lr (accessed June 28, 2016).
[28] Rubber Plantations to Lay-Off Thousands, New Daw. (2016).
http://www.thenewdawnliberia.com/news/9221-rubber-plantations-to-lay-off-thousands
(accessed June 29, 2016).
[29] R. Small, Review of Smallholder Models: Liberia and Sierra Leone, Monrovia, 2014.
[30] Government of Liberia, United Nations, Rubber Plantations Task Force Report, Monrovia,
Liberia, 2006.
[31] H. Camp, T. Morakinyo, H. Young, Salala Rubber Corporation (SRC), Liberia
Environmental and Social Due Diligence Assessment, Monrovia, Liberia, 2015.
[32] Plantation Sustainability & Quality Management Department, Sime Darby Plantation
Sustainability Report 2014, Selangor Darul Ehsan, 2014. www.simedarbyplantation.com.
[33] Société Internationale de Plantations D’Hévéas (SIPH), Major agreement in Liberia to
extend the land to 35,000 ha, (2012) 0–1.
[34] Earthtime Inc, Environmental and Social Impact Assessment Progress Report for Salala
Rubber Company, Monrovia, Liberia, 2008.
[35] Republic of Liberia Ministry of Commerce and Industry, National Export Strategy: Oil

37
Palm Export Strategy 2014-2018, Geneva, Switzerland, 2014.
[36] Republic of Liberia Ministry of Agriculture, Comprehensive Assessment of the
Agriculture Sector: Vol 2.1, Monrovia, 2007.
[37] Y. Son Kheong, HCV Assessment for Sime Darby Plantation Liberia, Kuala Lumpur,
2011.
[38] P. De Wit, Land Inventory and Land Management Planning in Sinoe County, Monrovia,
Liberia, 2012.
[39] S. Kpanan’Ayoung Siakor, Uncertain Futures: The impacts of Sime Darby on
communities in Liberia, Monrovia, Liberia, 2012.
[40] Equatorial Palm Oil, Sustainability Report 2015: EPO in Liberia building a better future,
Monrovia, Liberia, 2015.
[41] Sustainable Development Institute, Community Complaint against Equatorial Palm Oil,
(2013).
[42] Roundtable on Sustainable Palm Oil (RSPO), Summary Report of Planning and
Management for Golden Veroleum Oil Palm Proposed Development Area at Tarjuowon
District, Sinoe County, Liberia, Monrovia, Liberia, 2013.
[43] African Development Bank, Maryland Oil Palm Plantation Project Brief, Monrovia,
Liberia, 2014.
[44] African Development Bank, Maryland Oil Palm Plantation Project Liberia: Summary of
the Environmental and Social Impact Assessment, Monrovia, Liberia, 2012.

38
[45] Government of Liberia, Liberia Agriculture Sector Investment Program (LASIP) Report,
Monrovia, Liberia, 2010.
[46] D. Ellman, The Reference Electrification Model: A Computer Model for Planning Rural
Electricity Access, Massachusetts Institute of Technology, 2015.
[47] T. Buchholz, T. Tennigkeit, A. Weinreich, K. Windhorst, I. DaSilva, Modeling the
profitability of power production from short-rotation woody crops in Sub-Saharan Africa,
Biomass and Bioenergy. 59 (2013) 116–127. doi:10.1016/j.biombioe.2012.11.027.
[48] T. Ma, Y. Nakamori, Modeling technological change in energy systems – From
optimization to agent-based modeling, Energy. 34 (2009) 873–879.
doi:10.1016/j.energy.2009.03.005.
[49] R. Alfaro, J.F.; Miller, S.A.; Johnson, J.X.; Riolo, Improving Rural Electricity System
Planning: An Agent Based Model for Stakeholder Engagement and Decision Making,
Energy Policy. (n.d.).
[50] Google, Firestone Factory, Bomi, Google Maps. (2016).
[51] Google, LAC Rubber Factory, District 3, Grand Bassa, Google Maps. (2016).
[52] Google, Guthrie, Bomi, Liberia, Google Maps. (2016).
[53] Google, Senjeh, Bomi, Liberia, Google Maps. (2016).
[54] Google, Cavalla, Harper, Liberia, Google Maps. (2016).
[55] Google, Cocopa, Nimba, Liberia, Google Maps. (2016).

39
[56] Google, SRC Plantation Bud Wood Garden, Kakata, Margibi, Liberia, Google Maps.
(2016).
[57] Google, Greenville, Sinoe, Liberia, Google Maps. (2016).
[58] Google, Todee, Montserrado, Liberia, Google Maps. (2016).
[59] Google, Foya, Lofa, Liberia, Google Maps. (2016).
[60] Google, Kpatawi, Bong, Liberia, Google Maps. (2016).
[61] Google, Zleh Town, Grand Gedeh, Liberia, Google Maps. (2016).
[62] Google, Dubwe, Grand Gedeh, Liberia, Google Maps. (2016).
[63] Google, Saturday, District 4, Grand Bassa, Liberia, Google Maps. (2016).
[64] Google, University of Liberia - Fendell Campus, Liberia, Google Maps. (2016).
[65] Google, Wangeko, Liberia, Google Maps. (2016).
[66] Google, Voinjama, Lofa, Liberia, Google Maps. (2016).
[67] Google, Gbarnga, Bong, Liberia, Google Maps. (2016).
[68] Google, Garwula, Grand Cape Mount, Liberia, Google Maps. (2016).
[69] Google, Golakonneh, Grand Cape Mount, Liberia, Google Maps. (2016).
[70] Google, Gisi Camp, Bomi, Liberia, Google Maps. (2016).
[71] Google, Bama, Grand Bassa, Liberia, Google Maps. (2016).
40
[72] Google, New Town, Sinoe, Liberia, Google Maps. (2016).
[73] Google, Maryland Oil Palm Plantations, Pleebo-Sodoken, Maryland, Liberia, Google
Maps. (2016).
[74] M. Taylor, K. Daniel, A. Ilas, E. Young So, Renewable Power Generation Costs in 2014,
Bonn, 2015.
[75] V. Modi, E. Adkins, J. Carbajal, S. Sherpa, Liberia Power Sector Capacity Building and
Energy Master Planning Final Report, Phase 4: National Electrification Master Plan, New
York City, 2013.
[76] W. Hamdan, Energy and Electricity Distribution in Liberia, Monrovia, Liberia, 2010.
[77] H. Camp, T. Morakinyo, H. Young, Liberian Agricultural Company (LAC), Liberia:
Environmental and Social Due Diligence Report, Monrovia, Liberia, 2015.
[78] IRENA Secretariat, Renewable Energy Technologies: Cost Analysis Series - Biomass for
Power Generation, Bonn, 2012.
http://www.irena.org/menu/index.aspx?mnu=Subcat&PriMenuID=36&CatID=141&Subc
atID=234.
[79] Director of the Office of Accountability, Buchanan Renewable Energy Projects in Liberia,
2014.
[80] T. Steinweg, K. Racz, A. Brownell, F. Colee, Burning Rubber: Buchanan Renewables’
impact on Sustainable Development in Liberia, Centre for Research on Multinational
Corporations, Amsterdam, 2011.

41
[81] B.J. Carter, Senate Wants All Concessions Reviewed, Dly. Obs. (2016).
http://liberianobserver.com/news/senate-wants-all-concessions-reviewed (accessed June
28, 2016).
[82] Rights and Resources Group, Investments into the Agribusiness , Extractive , and
Infrastructure Sectors of Liberia: An Overview, Washington DC, 2013.
[83] O.P. dan P.U.K. (OPPUK) Rainforest Action Network, The Human Cost of Palm Oil,
2016. http://www.laborrights.org/publications/human-cost-conflict-palm-oil (accessed
July 1, 2016).
[84] Verite, Rubber Production in Liberia: An Exploratory Assessment of Living and Working
Conditions, with Special Attention to Forced Labor, 2012.
http://digitalcommons.ilr.cornell.edu/cgi/viewcontent.cgi?article=2777&context=globaldo
cs.
[85] Centre for Research on Multinational Corporations (SOMO), Liberia Back in Business ?
Conflict and human rights issues in a post conflict environment, 2015.
[86] Roundtable on Sustainable Palm Oil (RSPO), The Republic of Liberia: Adoption of the
International RSPO Criteria in its Entirety as a National Interpretation, 2014.
[87] Republic of Liberia House of Representatives, An Act Establishing the Liberia Extractive
Industries (LEITI), Liberian Senate, Monrovia, 2009.
[88] M.O. Kiazolu, Governing Liberia’s Electricity Sector Reforms: Challenges and
Recommendations, 2 (2015) 1–8.