biomechanics of bone
TRANSCRIPT

1
Biomechanics of Boneand Skeletal System
Course Text: Hamill & Knutzen (Ch 2)Nordin & Frankel (Ch 1) or Hall (Ch. 4)
The Musculoskeletal System
bone tendons ligaments fascia cartilage muscle
Over the nextfew weeks wewill look at thebiomechanicalproperties ofthese tissues.
Connective Tissues
Connective Tissue Composition CELLS {fixed (fibroblasts, chondroblasts,
osteoblasts; migratory(e.g. mast & plasma cells)
EXTRACELLULAR MATRIX fibres {collagen (collagenous & recticular),
elastic}
ground substance (calcium, lipids,glycoproteins, proteoglycans)
TISSUE FLUID (filtrate of the blood)
Skeletal System Functions Movement Related Functions
Levers Support
Non-Movement Related Functions Protection Storage of fat and minerals Blood cell formation
Composition of Human BoneWATER 25-30%MINERAL 60-70% (Resists compression)
Calcium phosphate 85%Calcium carbonate 10%Calcium fluoride 2-3%Magnesium fluoride 2-3%
PROTEIN (Collagen) 5-15% (Resists tension)Bone is termed a two-phase material
Bone Structure (density)
Compact (Cortical) Boneporosity < 15%
Spongy boneporosity > 70%

2
How strong aremy bones?
Probably not as strong asyou thought!
Flexible, Strong
Flexible, Weak Stiff, Weak
Stiff, Strong
lead
oakBONE
spider web
silk
fiberglasssteel
iron
gold
copper
glass
Repetition
Load
Tolerance
Injury Threshold
Acute trauma
Chronic
Repetitive
Tissue Tolerance
Risk of Injury
too little too much
Movement (repetition), force (lifting)physical activity, sitting or standing
Tissue strength (conditioning) is also a factor in risk of injury
Keep the big picturein mind. If you havelittle movement/exercise then thetissues become moresusceptible to injurydue to poorconditioning.
Hippocrates (460-377 B.C.)
“All parts of the body which have afunction, if used in moderation andexercises in labours to which each areaccustomed, thereby become healthy andwell-developed: but if unused and left idle,they become liable to disease, defectivein growth, and age quickly. This isespecially the case with joints andligaments, if one doe not use them.”
LeVay 1990. p30. Time
Force
Acute
Acute vs. Chronic InjuriesIf you had a force vstime graph the areaunder the curve wouldbe an impulse (Ft =>the cumulative loadingof that tissue)
Chronic
3
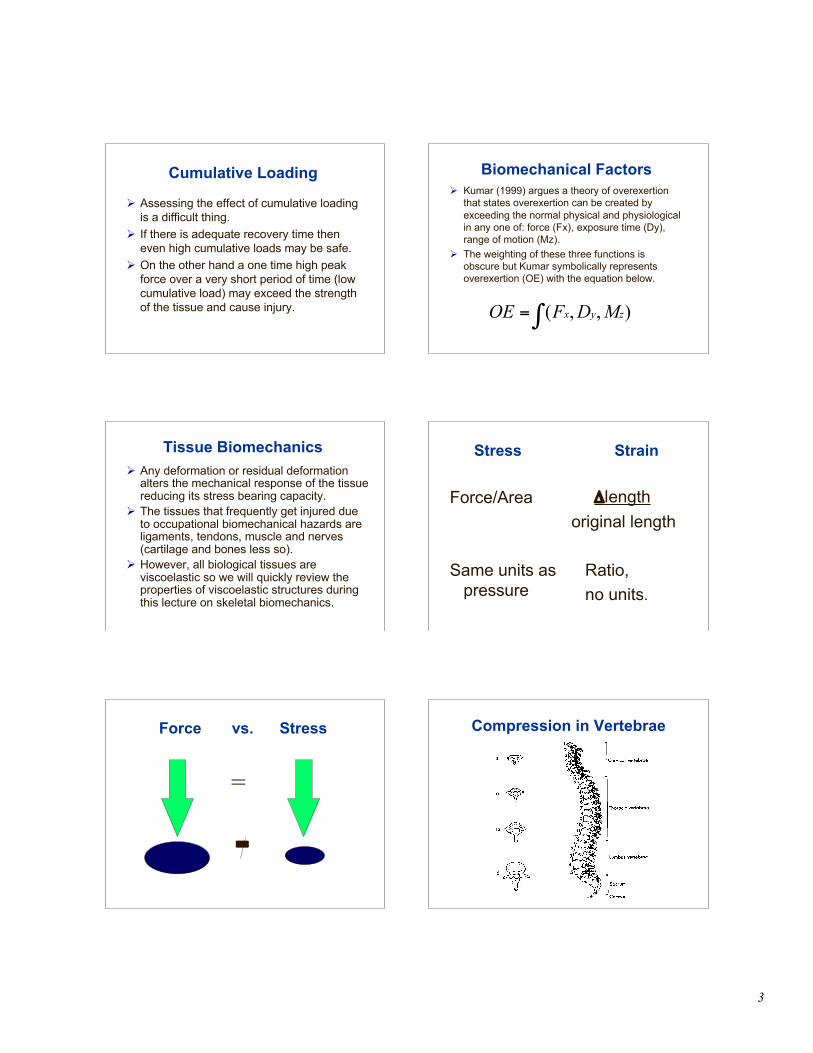
Cumulative Loading
Assessing the effect of cumulative loadingis a difficult thing.
If there is adequate recovery time theneven high cumulative loads may be safe.
On the other hand a one time high peakforce over a very short period of time (lowcumulative load) may exceed the strengthof the tissue and cause injury.
Biomechanical Factors Kumar (1999) argues a theory of overexertion
that states overexertion can be created byexceeding the normal physical and physiologicalin any one of: force (Fx), exposure time (Dy),range of motion (Mz).
The weighting of these three functions isobscure but Kumar symbolically representsoverexertion (OE) with the equation below.
!= ),,( zyx MDFOE
Tissue Biomechanics Any deformation or residual deformation
alters the mechanical response of the tissuereducing its stress bearing capacity.
The tissues that frequently get injured dueto occupational biomechanical hazards areligaments, tendons, muscle and nerves(cartilage and bones less so).
However, all biological tissues areviscoelastic so we will quickly review theproperties of viscoelastic structures duringthis lecture on skeletal biomechanics.
Stress Strain
Force/Area
Same units aspressure
ΔΔlengthoriginal length
Ratio,no units.
Force vs. Stress
=
=
Compression in Vertebrae

4
60.724.95,864*23.933*T853.525.05,17321.029*T746.125.04,45918.125*T638.725.03,74615.221*T533.225.03,21113.118T427.725.02,67510.915T322.125.02,1408.712T216.625.01,6056.59T1
% ofL4 Breaking
Strength
BreakingStress in
Compression+
BreakingStrength
(N)
Mass kgCarried
by72.7 kg
Man
% ofBody
WeightCarried
Vertebra
e
Calculation of Vertebral Strengths
109.124.610,550*43.660*L5100.023.49,667*42.258*L499.624.19,636*40.756*L388.822.78,584*38.553*L282.622.47,982*36.450*L181.023.47,835*34.247*T1278.424.27,580*32.044*T1175.325.57,277*29.140*T1068.925.26,657*26.937*T9
*Single asterisk represents data collectedexperimentally by Ruff (1950).Unmarked values are calculated or assumed.
Stress Strain
Force/Area
Same units aspressure
ΔΔlengthoriginal length
Ratio,no units.
Elastic Response
Stress
Strain
ElasticRegion
PlasticRegion
Failure
Yield
Stress/Strain Curves
Glass (brittle)
Metal (ductile)
Bone

5
Strength & Stiffness
StrengthDefined by the failure point. Also can
be assessed by energy storage (areaunder curve).
Stiffness (modulus of elasticity)determined by the slope of the load
deformation curve
Flexible, Strong
Flexible, Weak Stiff, Weak
Stiff, Strong
lead
oakBONE
spider web
silk
fiberglasssteel
iron
gold
copper
glass
Young’s Modulus
Young’s Modulus is the ratio of: tensile stress / tensile strain
Young’s TensileModulus Strength
Tendon 2 x 10⁹ 1 x 10⁸
Bone 1.7 x 10¹⁰ 1.8 x 10⁸
Carbon Steel 2 x 10¹¹ 3 x 10⁹
Soft rubber c.106
Direction of Force
Shear
Compression Tension
Bending
Tension
Compression

6
TorsionNeutral Axis
Shear
Torsion
Anisotropic Characteristics
Stress to Fracture
CompressionCompression
TensionTension
ShearShear

7
Bone Injury and Low Back Pain Bone injury (e.g. endplate fracture) is far from the
common cause of most back pain. However, extensive research has been conducted
into disc compression as it is thought to be largelyresponsible for vertebral end-plate fracture, discherniation, and resulting nerve root irritation.
Back compression has been argued to be a goodpredictor of low-back and other overexertion injuries[Herrin+, 1986]
Due to the clinical interest in this area data exists onthe compressive strength of the lumbar vertebralbodies and intevertebral disks
Compression apparatus inwhich the specimens weresubjected to pressure(maximum 300 kp) recordedby a measuring brined at thesame times as Röutgenplates were made.
A = SpecimenB = Mechanically Driven ScrewC = Strain gaugeD = Measuring Bridge
A
C
B
D
Axial compression of the spinal unit results in a lossof height measured between the vertebrae. As thedisc material itself is essentially incompressible,height decrease must result in a radial bulge of thedisc and a corresponding axial disc bulge (an inwarddeformation of the vertebral end plates).
A centrally situated, postmortem fracture of the end-plate
<40 40-50 50-60 >60
Mean and Range of Disc Compression Failures byAge (Adapted from Evans, 1959, and Sonoda, 1962)
10000
8000
6000
4000
2000
0
AGE
CompressiveForcesResulting inDisc-VertebraeFailures atL5/S1 Level(Newtons)
Should job designfactor in age?

8
1,9249Std. Dev.
10,09328Mean
Compressive Strength (N)Age
Compressive Strength (N) Estimated for L4/L5Spinal Unit from Mechanical Testing of
Lumbar Spinal Units (males 20-40 years, n = 17). Porter, Hutton and Adams, 1989:
Hutton and Adams, 1982
Model opposite showsthe lever arms (A-D)from L3-L4 for the head,trunk, arms and liftedweight.
Data in table overleafwas from calculated forworld championshiplevel power lifters.
Fatigue Failure Compression fracture is the common
failure mode of the vertebra-disc complexin severe axial loading. This mechanismdoes not apply to repetitive loading withinthe linear portion of the stress-strain curve.Low back pain and back disordersassociated with frequent lifting, whole-bodyvibration and repeated shocks point to achronic degeneration of tissues, rather thanacute failure.
Repetition
Load
Tolerance
Injury Threshold
Acute trauma
Chronic
Repetitive
Tissue Tolerance Stress analysis of the proximalend of the femur

9
Avoiding Tension and ShearBalanced Loads
There are many examples wherecarrying is designed to carry twobalanced loads in each hand ratherthan one heavier load in one hand.
Stress in the Human Heel. The model (left) withforces applied indicated by arrows. Stresspattern indicated by polarized light (right).
Continuous lines = compressive stress.
Dotted lines =tensile stress.
Red line shows epiphysial plate
Resolution of Vectors
Compressionacross anepipheseal plateis less damagingthan tension.
Where there is tensile stress across an epiphysialplate (such as the proximal end of the tibia) a lotof collagen fibres are present to protect the platefrom excess tension.
Quadriceps muscleforce pulls oninsertion point (viapatella tendon)

10
Viscoelastic Characteristics
Load
Deformation
Fracture
Fracture
Quick
SlowUnlo
ad (re
turn)
Viscoelastic Characteristics
Load
Deformation
Load (deform
)Hysteresis loopShaded arearepresents lostenergy (heat)
Stress Fractures
Bone Remodeling
Load
Deformation
Normal
Immobilized
(Wolff’s Law)
Issues of degenerationand regeneration

11
Loading, Muscular Activity,and Injury
Injury vs. Loadingcomplex problem depending on loading
level, direction, speed, skeletal maturityand conditioning.
Muscular Activity vs. Loadingmuscular activity influences loading (often
reducing tensile loading). If musclesfatigue their ability to do this iscompromised.
Tibial Boot-Top Fracture
Sample Problem
What is the compressive force on theL5/S1 vertebral disk of the 50% male?
What is the compressive stress on this diskif it is aligned horizontally and its cross-sectional surface area is 24 cm2?
What is the compressive force on one tibiaif the 50% male stands in the anatomicalposition (symmetrical weight bearingbetween both feet)?
AnswerTwo total arm segments = 7.4 kg
(0.4 + 1.2 + 2.1) x 2Head, neck and trunk above L5/S1= 33.5 kgTotal mass above L5/S1 = 40.9 kg.Force on disk = 40.9 x -9.81= -401.2 NStress = 401.2/24 = 16.7 N/cm2
401.2/0.0024 167,179 Pa or 167 kPaTotal mass less two shanks and feet = 74.4 -8.8 = 65.6 kg ⇒ 643.5 N. Per tibia = 321.8 N