biomedical diagnostics i - hcmuthuynhqlinh/qpys/seminar/seminar... · glucose diagnostics...
TRANSCRIPT

IVBiomedicalDiagnostics I
18Glucose Diagnostics
18.1 Introduction18.2 On-Line Glucose Monitoring and Process Control
Near-Infrared Spectroscopy • Raman Spectroscopy for Biological Glucose Analysis • Polarimetric Measurement of Aqueous Glucose
18.3 Diabetic MonitoringCommercial Colorimetric Glucose Meters • Laser Perforation and Poration Devices for Fluid Extraction • Spectroscopic Methods for in Vivo Glucose Diagnostics
References
18.1 Introduction
Glucose is one of the most important carbohydrate nutrient sources and is fundamental to almost allbiological processes. Quantification of glucose concentration is important in monitoring and analysis ofagricultural products, control and regulation of cell culture, and diagnosis and control of human diseasesincluding diabetes. A wide range of parameters, including glucose concentration range, volume of glucosesolution available, and required accuracy, exist across these applications. For instance, the sugar concen-tration in many agricultural products (e.g., fruit juices) is hundreds of grams per liter while the glucoseconcentration for an on-line cell culture system may be in the milligrams per deciliter range. Additionally,the volume or, more importantly for optical approaches, the available optical path length for on-lineprocess control and agricultural applications can be tens of centimeters while in vivo these are typicallymillimeters to centimeters. Consequently, the required glucose sensitivity in vivo needs to be orders ofmagnitude better than in the agricultural industry. Finally, the environmental challenges associated within vivo monitoring make this problem more difficult than typical industrial applications because of arange of potential confounders that cannot be controlled. These include temperature and pH variations,confounding chemical species, pressure changes, and correlated physiological changes.
For biotechnological processes such as cell culture, measurements of analytes such as glucose arecurrently obtained using off-line methods that require sample extraction from the process or bioreactor.The off-line measurements may cause cell contamination, can be time consuming, can be expensive, andmay not reflect the real-time status of the cells. In order to overcome many of these limitations, nonde-structive optical methods have been proposed as a solution. Three of the most common optical approachesfor on-line glucose monitoring and process control are described in Section 18.2.
A significant role for physiological glucose monitoring is in the diagnosis and management of diabetes.Diabetes mellitus is a metabolic disease that presents as a complex group of syndromes related in largepart to problems with insulin production and/or utilization. Insulin is the primary hormone responsiblefor glucose regulation in the body; in diabetics, blood glucose levels, which would normally be maintainedbetween 90 and 120 mg/dl, may fluctuate between 40 and 400 mg/dl or more. Over time, elevated glucoselevels may damage the kidneys, eyes, nerves, and heart, and severely low glucose levels may cause a patient
Gerard L. CotéTexas A&M UniversityCollege Station, Texas
Roger J. McNicholsBioTex, Inc.Houston, Texas
©2003 CRC Press LLC

to go into shock or even die. Therefore, a goal of diabetes management is tight maintenance of bloodglucose levels via insulin injection, modified diet, exercise, or a combination of these. In order to guidethis therapy, regular measurement of blood glucose levels (up to five times per day) is required. Becausecurrent glucose sensing methods require a painful and inconvenient puncture of the skin to obtain ablood sample for analysis, efforts to develop a noninvasive or implantable glucose meter using opticalmethods have been strong.
A number of invasive and noninvasive techniques are being investigated for glucose monitoring,including direct transmission through blood vessels, measurement of glucose in interstitial fluid in thedermis, light transmission through blood containing body parts (including the earlobe, the finger, andthe forearm), and optical interrogation of the aqueous humor of the eye. The invasive approaches havethe advantage of direct contact with the media of interest and thereby enhanced specificity, but they oftensuffer from biocompatibility issues. The noninvasive approaches do not suffer from the biocompatibilityissues but are less specific and must account for the fact that they simultaneously probe multiple volumesincluding interstitial fluid, blood, and intracellular fluid. The anterior chamber of the eye has beensuggested as a noninvasive glucose monitoring site because it is uniquely transmissive to optical radiation.It has been shown that the aqueous humor (AH), the fluid just beneath the cornea, exhibits an age-dependent steady-state value of glucose approximately 70% of that found in blood and that the time lagbetween AH and blood glucose is on the order of minutes. The lack of significant scattering componentsand the relative simplicity of AH compared to blood or blood and tissue make it an attractive site foroptical measurement techniques. Section 18.3 focuses on the optical approaches currently used and beingdeveloped for glucose monitoring.
18.2 On-Line Glucose Monitoring and Process Control
18.2.1 Near-Infrared Spectroscopy
The near-infrared (NIR) region of the optical spectrum extends from 700 to 2500 nm (0.7 to 2.5 �m)and can be used for quantitative measurement of organic functional groups, especially C–H, O–H, N–H,and C=O. Absorption bands in the NIR are composed primarily of overtone and combination bands ofstretching and vibrational modes of organic molecules. These bands tend to be rather broad and overlapconsiderably, so the NIR region is not particularly well suited for qualitative analysis. However, thesignificantly reduced intensity of NIR absorption bands does allow for use of reasonable pathlengths inthe millimeter to centimeter range; when used with multivariate statistics, suitable quantitative informa-tion involving multiple analytes may be obtained.
NIR transmission spectroscopy (NIRS) and diffuse reflectance spectroscopy have been the primaryoptical approaches investigated for on-line glucose monitoring and process control.1–15 NIRS has beendeveloped extensively in the agricultural and food industries for the past 30 years. An advancement thathas enabled NIRS as an analytical tool has been the development of sophisticated multivariate dataanalysis or chemometric techniques. The use of NIRS for glucose monitoring in industrial and agriculturalapplications has been described in References 16 through 18. In this section we will focus on theapplication of NIRS to on-line measurement of glucose concentration in bioreactors and cell cultures.These applications represent the most challenging application of NIR glucose measurement because themedia involved are more complex and the analyte concentrations involved are significantly lower thanthose found in current industrial applications.
Cell culture applications require careful maintenance of a number of factors, including pH, temper-ature and, importantly, glucose concentration. The automated control of glucose concentration via on-line continuous monitoring could result in improved culture productivity and efficiency. Optical mea-surement of glucose is complicated by the complex nature of cell culture media, which contain proteins,amino acids, salts, and other small carbohydrates and nutrients including glucose. A typical NIR spectrumof GTSF-2 cell culture medium in the 2- to 2.5-�m range with respect to an air background is shown in
©2003 CRC Press LLC

Figure 18.1A. The NIR spectrum for aqueous glucose at a concentration of 500 mg/dl (27.5 mM), withthe other cell culture medium background removed, is shown in Figure 18.1B. Of particular importanceis the magnitude of the absorbance units on the y-axis. Note that the absorbance by water and proteinsis at least three orders of magnitude greater than that of glucose. Thus, the stability and signal-to-noiseratio of an NIR instrument must be very good if it is to be used to distinguish changes in the glucoseconcentration. Further, the temperature of the sample must also be very tightly controlled because, witheven a slight change in temperature, the absorbance of the background water spectrum will shift, severelyimpacting measurement of the glucose signal.
Figure 18.2 demonstrates the effect of varying temperature on the NIR spectrum of cell culturemedium. Fortunately, techniques such as digital filtering combined with high-order multivariate statisticshave been able to compensate for and model such variations. Additionally, cell culture applicationstypically exhibit well-controlled temperature and are amenable to inclusion of a fixed pathlength foroptical measurements, thus making on-line NIR glucose monitoring in cell culture promising. Detaileddiscussion of specific NIR spectroscopic studies of glucose measurement in cell culture media may befound in References 6, 15, and 19.
FIGURE 18.1 (A) NIR absorbance spectrum of cell culture media with air as the background. (B) NIR absorbancespectrum for glucose in the 2- to 2.5-�m wavelength range after baseline removal of the other cell culture mediacomponents. Note that the glucose signal amplitude is orders of magnitude smaller than the raw absorption, whichhas strong water and protein bands.
©2003 CRC Press LLC

18.2.2 Raman Spectroscopy for Biological Glucose Analysis
In addition to NIR, the optical method known as Raman spectroscopy may provide for potentially rapid,precise, and accurate analysis of glucose concentration and biochemical composition.20 Raman spectros-copy provides information about the inelastic scattering that occurs when vibrational or rotational energyis exchanged with incident probe radiation. When monochromatic radiation is incident upon Ramanactive media, most of the incident light of frequency �o is elastically scattered at the same frequency(Rayleigh scattering); however, a very small portion of the light undergoes Raman scattering and exhibitsfrequency shifts of ��m that are associated with transitions between the rotational and vibrationallevels.21,22 Energy decreases (�o – �m) are referred to as Stokes shifts and energy increases (�o + �m) arereferred to as anti-Stokes shifts. Because Stokes shifts are much more prevalent, most studies utilize the
FIGURE 18.2 (A) Water absorbance spectrum, referenced to air, showing the shift in the water peaks with temper-ature. (B) Glucose (500 mg/dl) absorbance spectrum taken at different temperatures, referenced to a water back-ground taken at one temperature showing the baseline water peak shifts.
Ab
sorb
ance
Wavelength (µm)
Ab
sorb
ance
2.1 2.2 2.3 2.4
Wavelength (µm)
2.1 2.2 2.3 2.4
A
B
3.5
3
2.5
2
1.5
1
0.25
0.2
0.15
0.1
0.05
0
-0.05
-0.1
10.6°C
40.6°C
25.4°C
25.6°C
42.2°C
36.6°C
©2003 CRC Press LLC
Stokes type of scattering bands. Therefore, the Raman bands of interest are shifted to longer wavelengthsrelative to the excitation wavelength.
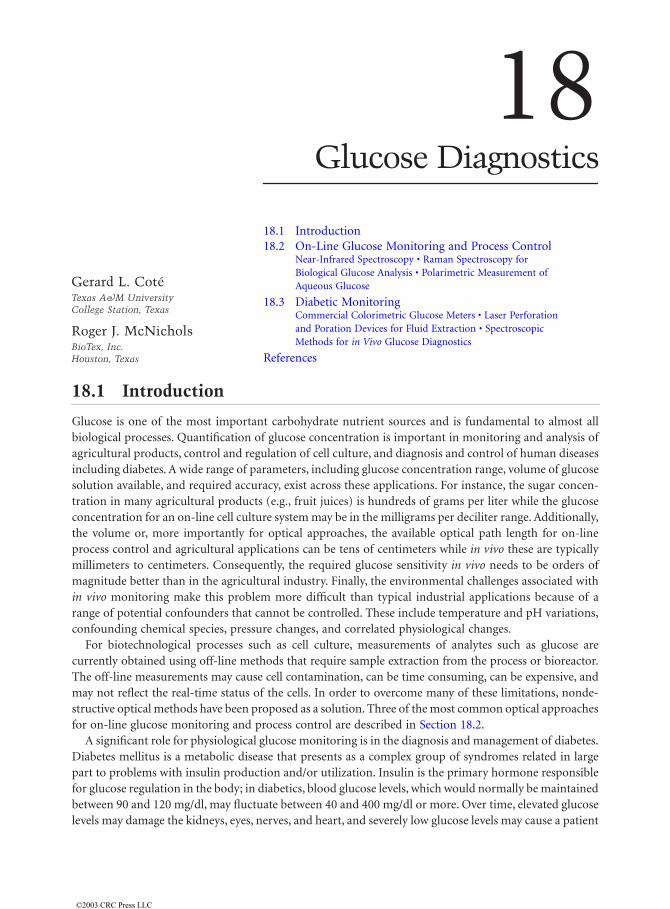
As with infrared spectroscopic techniques, Raman spectra can be utilized to identify molecules suchas glucose because these spectra are characteristic of variations in the molecular polarizability and dipolemoments. However, in contrast to infrared and NIRS, Raman spectroscopy has a spectral signature thatis less influenced by water. In addition, as shown in Figure 18.3, Raman spectral bands are considerablynarrower than those produced in NIR spectral experiments. Raman also has the ability to permit thesimultaneous estimation of multiple analytes, requires minimum sample preparation, and would allowfor direct sample analysis (i.e., would be on-line). Different bonds scatter different wavelengths of EMradiation, so this method gives quantitative information about the total biochemical composition of asample, without its destruction.
The fundamental instrumentation required to produce a Raman spectrum includes a monochromaticlight source such as a laser, a wavelength separation system such as a dispersive monochromater ornondispersive Fourier transform (FT) spectrometer, and a detection system such as a CCD array for thedispersive case or point detector for the FT Raman case. In either system, it is very important to eliminatethe elastically scattered light, which is roughly 105 times greater in intensity and occurs at the samewavelength. Normal optical filters are not adequate to remove enough of this elastically scattered lightand therefore holographic notch filters are typically required.
One application of dispersive Raman spectroscopy is the noninvasive, on-line determination of thebiotransformation by yeast of glucose to ethanol.23 Using a diode-laser exciting at 780 nm and a CCDdetector along with partial least squares multivariate analysis, glucose and ethanol could be measured towithin 5%.
Although Raman scattering can be used in on-line monitoring applications of analytes at the milli-molar level, it is a rather weak effect that typically requires a fairly powerful laser and cooled CCD array;it has substantial fluorescence interference from biological samples. However, the Raman effect can begreatly enhanced (by approximately 106- to 108-fold) if the molecules of interest in the monitoringprocess are attached to, or microscopically close to, a suitably undulating (roughened) surface, usuallyof the coinage metals Cu, Ag, or Au.24 This method, called surface-enhanced Raman scattering (SERS),25,26
has received much attention recently within biomedicine26 and genomics.27 Since the development ofreproducible SERS on a silver-coated alumina substrate by Vo-Dinh and colleagues,28 this technologyhas emerged as a very powerful biochemical detection method. It is noteworthy as well that the fluores-cence background typically observed in many on-line samples using dispersive Raman may potentiallybe reduced by using SERS.
FIGURE 18.3 Baseline corrected Raman spectra of glucose showing the narrow peaks that can be obtained whencompared with the NIR spectra of Figure 18.1B.
©2003 CRC Press LLC

18.2.3 Polarimetric Measurement of Aqueous Glucose
Polarimetry is a sensitive, nondestructive technique for measuring the optical activity exhibited byinorganic and organic compounds. A compound is considered to be chiral if it has at least one centerabout which no structural symmetry exists. Such molecules are said to be optically active because linearlypolarized light is rotated when passing through them. The amount of optical rotation is determined bythe molecular structure of the molecule, the concentration of chiral molecules in the substance, and thepathlength the light traverses through the sample. Each optically active substance has its own specificrotation as defined by Biot’s law:
(18.1)
where L is the layer thickness in decimeters, C is the concentration of solute in grams per 100 ml ofsolution, and � is the observed rotation in degrees. In the preceding equation the specific rotation [�]of a molecule is dependent on temperature, T, wavelength,��, and the pH of the solvent.
The polarimetric method is employed in quality control, process control, and research in the phar-maceutical, chemical, essential oil, flavor, and food industries. It is so well established that the UnitedStates Pharmacopoeia and the Food and Drug Administration include polarimetric specifications fornumerous substances.29 Historically, one of the earliest applications of polarimetry has been the devel-opment of bench-top polarimeters, known as saccharimeters, designed solely for the estimation of starchand sugar in foods and beverage manufacturing and in the sugar industry.30 For this agricultural industryapplication, in which the concentrations and path lengths are high, the commercial bench-top units areadequate. However, for the low glucose concentrations found in cell culture systems and in vivo, muchmore sophisticated polarimetry systems are required to monitor the glucose, as described next.
18.3 Diabetic Monitoring
18.3.1 Commercial Colorimetric Glucose Meters
Many of the home blood glucose monitors currently in use rely on the so-called colorimetric approachto glucose sensing. The colorimetric method consists of three basic steps: (1) the invasive withdrawal ofa small blood sample, (2) the application of the blood sample to a specially formulated “test strip,” and(3) the automated reading of the test strip results via optical means. In this section we focus on thesecond and third steps of this process.
Glucose monitor test strips are available from a number of manufacturers and in several varieties.However, all commercially available glucose monitor test strips (electroenzymatic or colorimetric) relyon the quantification of reaction of glucose with the naturally occurring enzyme glucose oxidase (GOX).While a number of red-ox reaction-based methods for determining the concentration of reducing sugarsexist, the specificity afforded by GOX makes it the standardly practiced assay. GOX is a protein approx-imately 160,000 Da in size and is composed of two identical 80-kDa subunits linked by disulfide bonds.Each subunit contains 1 mol of Fe and 1 mol of flavin–adenine–dinucleotide (FAD). During the oxidationof glucose, the FAD groups become temporarily reduced; thus, GOX is one of the family of flavoenzymes.The reaction that is catalyzed by GOX is shown in Figure 18.4. In the presence of oxygen, reduced GOXfurther reacts to drive the reaction to the right. This reaction, which results in the production of hydrogenperoxide, is shown in Figure 18.5.
Commercially available colorimetric sensors employ a peroxidase enzyme (commonly horseradishperoxidase) and a red-ox-coupled dye pair to generate chromophore concentrations proportional to theamount of hydrogen peroxide produced. One such dye pair is the oxygen acceptor 3-methyl-2-benzothi-azolinone hydrazone plus 3-(dimethylamino)benzoic acid (MBTH-DMAB), which has an absorptionpeak at 635 nm. Production of hydrogen peroxide by oxidation of glucose and reduction of oxygen drives
��
� � 100
LC
©2003 CRC Press LLC

the peroxidase catalyzed production of active MBTH-DMAB chormophore and thus results in a mea-surable increase in absorbance of light at 635 nm. Other oxygen acceptor dyes that can be used includeO-dianisidine, benzidine, and 4-aminoantipyrene and chromotropic acid (AAP-CTA), among others.31
Optical measurement of the dye product (and hence glucose concentration) is based on the Beer’s lawincrease in absorbance of the dye product. In practice, this increase in absorbance is usually quantifiedby measuring the attendant decrease in reflectance of the active site on a test strip. The relationshipbetween absorbance and reflectance is described by the Kubelka–Munk equation (see, for example,Reference 16), K/S = (1 – R)2/2R, where K is the concentration-dependent absorbance, S is a constantrelated to the scattering coefficient, and R is the measured reflectance.
Practical colorimetric measurement systems typically employ a multi- (at least two) wavelength detec-tion scheme to increase accuracy and account for variables like the background absorbance of blood, theoxygenation state of blood, and the hematocrit of the blood under test. For the case of the MBTH-DMABdye pair, the absorbance peak at 635 nm is fairly sharp and absorbance by the dye at 700 nm is negligible.Therefore, a second reflectance measurement at 700 nm affords a correction factor, which is used toaccount for background and sample variations. Since the GOX reaction is a progressive one, the timingof measurements is also extremely important. Early measurement systems required that a timer be startedwhen blood was placed on the strip and that a reading be taken after a specific period of time (typically15 to 60 s). Modern systems overcome this inconvenience by taking continuous reflectance measurementsas soon as a new test strip is inserted into the meter. When a drop of blood is placed on the meter, animmediate change in the reflectance signals the start of the reaction; multiple reflectance readings maybe taken during the reaction to further increase accuracy or dynamic range of the sensor.
18.3.2 Laser Perforation and Poration Devices for Fluid Extraction
High-powered medical lasers have been used for surgical applications for decades, but over the last fewyears they have found their way into glucose monitoring. Currently, two laser techniques can penetrateskin tissue: one that perforates deep enough into the skin tissue to provide for the collection of a capillaryblood sample, and a second poration technique that only removes the stratum corneum (the deaduppermost layer of the epidermis) of the skin to allow interstitial fluid to be collected. A standard glucoseanalysis method like the colorimetric one described earlier could be used on the blood sample, while amodified system would be needed for the interstitial fluid sample because it has different chemicalconfounding components and would have an overall lower glucose concentration level.
The laser perforation systems for collecting capillary blood typically use a pulsed laser such as anerbium yttrium aluminum garnet (Er:YAG) for ablation of the upper layers of skin.32,33 This particularlaser has a spectral peak of 2.94 �m, which is a primary absorption wavelength band for water. Thesesystems differ from previous surgical laser ablation systems in that they are small and battery operated,provide for a limited cutting depth, and do not heat collateral tissue or cauterize the delicate capillaryvessels. The typical opening it provides is on the order of 0.3 to 0.5 mm in diameter. Overall, the
FIGURE 18.4 Oxidation of glucose to gluconolactone by the flavoenzyme GOX.
FIGURE 18.5 Production of hydrogen peroxide by reduced GOX in the presence of oxygen.
+ +O
OHOHOH
OH
CH2OH CH2OH
OO
OHOHOH
β-D-GlucoseGlucose Oxidase(Oxidated form)
Glucose Oxidase(Reduced form) δ-D-Gluconolactone
GOX-FAD GOX-FADH2
GOX-FADH2 + O2 GOX-FAD + H2O2
©2003 CRC Press LLC

advantages of using laser light, as opposed to a stainless steel lancet tip, are that it reduces the blunt tissuetrauma, provides for less bruising and more rapid healing, and eliminates sharps as a potential sourceof cross contamination.
The laser poration approach has been described in the literature34 and is being commercially pursuedby SpectRx, Inc.35 The individuals at SpectRx are developing the laser system as well as the samplehandling system, which includes a suction system to remove the fluid and the sensor for measuringglucose. As mentioned, the biggest difference between this approach and the laser perforation systemcommercially available is that this approach removes only the stratum corneum and thus interstitial fluid(ISF) is obtained instead of capillary blood. This is illustrated in Figure 18.6, which shows a cross sectionof the skin comparing a standard lancet, laser perforation, and laser poration for drawing blood or ISF.Initially, a very short ultraviolet (UV) laser such as an argon-fluoride excimer was used, which operatesat 193 nm. The strong absorption of the UV radiation by the protein of the stratum corneum allows aslittle as 0.25 �m of tissue to be removed per pulse.34 Firing 80 pulses from the laser would thereforecreate a pore in the roughly 15-�m-thick stratum corneum. Er:YAG lasers similar to the type used in thelaser perforation approach and NIR diode lasers have been investigated as alternatives to excimer becauseof their strong absorbance by tissue water.34 After poration, an ISF harvesting device that potentiallyhouses the glucose assay must be employed, followed by a vacuum pump to help in fluid withdrawaland an ISF glucose-sensing meter.
18.3.3 Spectroscopic Methods for in Vivo Glucose Diagnostics
18.3.3.1 Fluorescence Spectroscopy
18.3.3.1.1 Glucose Oxidase and O2-Based Fluorescent SensorsThe specificity afforded by the catalytic enzyme GOX has been exploited to create a number of fiber-optic fluorescence-based sensors for glucose. Recall that, in the reaction of Figures 18.4 and 18.5, O2 andglucose are consumed to produce gluconolactone and H2O2. A simple approach for creating a sensorbased on this reaction is to incorporate an oxygen-sensitive dye such as a ruthenium complex. Ruthe-nium(II) complexes exhibit fluorescence quenching in the presence of oxygen; therefore, a decrease inlocal oxygen concentration can be detected as an increase in fluorescence of a ruthenium-based dye.Incorporating GOX and a ruthenium dye together results in a sensor whose fluorescence increases with
FIGURE 18.6 (Color figure follows p. 28-30.) Cross section of skin comparing the depth of penetration incurredfor a standard lancet to that of both the laser perforation and laser poration approaches.
©2003 CRC Press LLC

increased glucose concentration since increased glucose concentration will lead to the consumption ofmore O2. One example of such a sensor is described in References 36 and 37. A disadvantage of thissimple approach is that a decrease in local oxygen content may not be distinguished from a rise in glucoseconcentration. Li et al. have solved this problem by creating a dual-channel sensor with a ruthenium–GOXchannel and a second ruthenium-only channel.38 Thus, the second O2-sensitive channel can be used tocorrect for changes in local oxygen tension. Development of GOX-based fiber-optic sensors continues,and more elaborate sensors have been described.39,40
18.3.3.1.2 Nonoxygen-Based Fluorescent SensorsOne of the first nonoxygen-based fluorescence assays investigated for glucose monitoring in vivo usedan indwelling fiber optic approach and a semipermeable membrane.41,42 In this initial approach a fluo-rophore was linked to dextran, which was bound on the inner surface of the membrane to a lectin,concanavalin A (Con A) at the tip of the fiber, as shown in Figure 18.7A. Glucose has a higher affinityfor the membrane-based lectin and thus displaces the dextran with the fluorophore causing the fluores-cent light to be returned through the fiber. The use of concanavalin A (Con A) as the membrane-boundmolecule affords the technique fairly good sensitivity because of Con A’s strong affinity for glucose.Because the approach only used a single fluorophore, the probe was sensitive to alignment and had tobe made to ensure the beam did not shine on the walls of the membrane.
A second approach, which was independent of the beam path into the fiber, was also developed bythis group.43,44 This glucose monitoring approach is based on fluorescent resonance energy transfer(FRET) between two fluorescent molecules — in this case fluorescein isothiocyanate (FITC) bound todextran and tetramethylrhodamine isothiocyanate (TRITC) bound to Con A, as depicted in Figure 18.7B.When TRITC-Con A binds FITC-dextran, the fluorescent labels are brought to within the requiredmolecular proximity (~50 Å) for FRET-based quenching to occur.44 In this case, energy from excitedFITC is donated to the TRITC acceptor, resulting in quenching of the observed FITC fluorescence peak.Using this approach, glucose concentrations can be measured by a rise in amplitude of the FITC fluo-rescence peak with increasing glucose concentration as depicted in Figure 18.8. Another potential meansof monitoring the change with glucose is based on phase-modulation fluorimetry, a technique thatmeasures fluorescent lifetimes.45
In either approach, the fluorescence techniques are very specific to glucose and sensitive to glucoseconcentration, without interference from other constituents frequently found in blood. Other advantagesof the fiber-optic chemical sensors, specifically over electrochemical sensors, include miniaturization,geometric flexibility, and the lack of electrical contact between the sensor and sample. However, inherentproblems with an indwelling optical fiber-based approach are similar to the problems associated withelectrochemical approaches and include membrane fouling, encapsulation, increase in response time,and increased potential for infection. In addition, a fiber is small and thereby yields very low signal-to-noise-ratios.
As an alternative to fiber-optic-based assay sensing, it has been proposed that fully implantablefluorescence-based glucose assays, encapsulated using various membranes or polymers, could be used.46,47
It has been suggested that small particles containing the FRET-based assay chemistry described previouslycould be implanted in the superficial dermis and interrogated by external means. In order for this typeof implantable device to be useful, it must be biocompatible, must not exhibit acute reagent consumptionor degradation, and must provide a means of communicating the sensor output to the physician orpatient. Also, once injected, the implant will not be exposed to blood but will rather be exposed tointerstitial fluid. The fluorescent assay has the potential problem of limited chemical and photochemicalstability over the long term and the construct, such as the hydrogel or dialysis membrane that encasesthe assay, must be biocompatible.
18.3.3.2 Infrared and Near-Infrared Absorption Spectroscopy
Infrared and NIR absorption spectroscopy techniques have long been mainstays of nondestructive chemo-metric analysis and therefore hold great potential for the development of noninvasive blood glucose
©2003 CRC Press LLC

measurement techniques. Optical absorption methods are based on the concentration-dependent absorp-tion of specific wavelengths of light by glucose or other compounds of interest. The methods are attractivebecause, in theory, a beam of nonionizing radiation may be directed through a blood-containing portionof the body and the exiting light analyzed to determine the content of glucose or other molecules ofinterest. In the infrared region and, more specifically, the mid-infrared (MIR) region (from about 5 to50 �m), the so-called “fingerprint” spectrum can be found. Absorption bands in this region are due tofundamental resonances of specific functional groups and bonds contained within the molecule, and
FIGURE 18.7 Characterization of a fiber optic fluorescence assay using (A) a single fluorescent molecule bound todextran. Note that the light path is critical in this configuration since it is necessary to measure fluorescence onlyfrom the free dextran and not from that bound to Con A on the walls of the sensor. (B) A FRET approach that usestwo fluorescent molecules (FITC and TRITC), one bound to Con A and the other to dextran. Note that the FITC isquenched when placed in close proximity to the TRITC, as would be the case in the absence of glucose. The beamalignment is no longer critical.
B
A
Fiber probe
Con A without thefluorophore
FITC Dextran Glucose
Light pathfrom thefiber
Fiber probe
Con A with theTRITC fluorophore
FITC Dextran Glucose
©2003 CRC Press LLC

they tend to be rather sharp. The fingerprint spectrum, therefore, offers highly specific information aboutthe molecular makeup of the compound or mixture under study. In contrast, absorption bands in thenear infrared are composed of complex overtone or combination bands and tend to be broad, overlapping,and much less specific. Figures 18.9A and 18.9B show, respectively, portions of the MIR and NIRabsorption spectra for glucose.
Despite the specificity offered by infrared absorption spectroscopy, its application to quantitative bloodglucose measurement is limited. A strong background absorption by water and other components ofblood and tissue severely limits the pathlength that may be used for transmission spectroscopy to roughly100 �m or less. Further, the magnitude of the absorption peaks and the dynamic range required to recordthem make quantitation based on these sharp peaks difficult. Nonetheless, attempts have been made toquantify blood glucose using infrared absorption spectroscopy in vitro and in vivo.48–52
In contrast to the infrared and MIR spectrum, the NIR spectrum passes relatively easily through waterand body tissues allowing moderate pathlengths to be used for measurements. Further, NIR instrumen-tation is readily available and relatively easy to use. Thus, a large amount of effort has been devoted tothe development of NIR spectroscopy techniques for noninvasive measurement of blood glucose.
Though all optical glucose sensing methodologies require use of a prediction model relating opticalmeasurements to glucose concentration, the broad overlapping peaks and complicated nature of multi-component, NIR spectra make single or dual wavelength models inadequate. NIR absorption bands maybe significantly influenced by factors such as temperature, pH, and the degree of hydrogen bondingpresent; the unknown influence of background spectra further complicates the problem. For this reason,quantitative NIR spectroscopy has long relied on the development of very high-order multivariateprediction models and empirical calibration techniques. A brief analysis of the signal variation due toglucose in a typical sample should serve to illustrate the problem at hand.
The physiological range of glucose values seen in the normal human body may range from 80 to 120mg/dl and should ideally remain around 100 mg/dl (5.5 mM). In diabetics, blood sugar may rise as highas 500 mg/dl. The generally accepted figure of merit for required accuracy of a useful glucose meter is10 mg/dl (0.55 mM). For the most identifiable NIR glucose peak at approximately 2.27 �m, molar
FIGURE 18.8 Fluorescence spectra from a combined FITC-Dextran and TRITC-Con A FRET assay with glucoseconcentrations of 0 mg/dl (–), 200 mg/dl (�), 400 mg/dl (▫), and 600 mg/dl (�). An increase in the 520-nm FITCfluorescence relative to the 580-nm TRITC fluorescence is observed with increasing glucose concentration.
500 520 540 560 580 600 620 640 660 6800
1000
2000
3000
4000
5000
6000
7000
8000
9000
Wavelength (nm)
Co
un
ts
©2003 CRC Press LLC

absorptivity is roughly 0.23 M–1cm–1. The molar absorptivity of water at the same wavelength is 0.41M–1cm–1 and the concentration of the water in typical body tissues is approximately 39 M. Consider atransmission measurement made through 1 mm of body tissue. The background absorbance due to waterwill be about 1.6 and that due to glucose will be about 1.26 · 10–4. To meet the accuracy requirement,we must further be able to discern an absorbance change of about 1.26 · 10–5 on a background of 1.6,and it is evident that even a change in tissue hydration of 1/1000 of a percent would result in a largersignal change than would a 10 mg/dl change in glucose concentration.
For this reason, high-order multivariate models that incorporate analysis of entire spectra must beused to extract NIR glucose information. A number of excellent and authoritative sources on suchmethods are available,18,53,54 and these methods are not discussed here other than to introduce some ofthe terminology associated with their formulation, use, and practice.
FIGURE 18.9 Optical absorption spectra for glucose. (A) MIR region extending from 1600 to 900 cm–1 or 6.25 to11�����m and showing absorption peak assignments. (B) NIR region extending from 2.0 to 2.5 �m or 5000 to 4000cm–1. Note that the magnitude of the three absorbance peaks in the NIR region is much smaller.
©2003 CRC Press LLC

Multivariate calibration techniques focus on finding a response matrix suitable to describe spectralobservations obtained when analyzing a solution containing particular concentrations of a number ofanalytes. Once this response matrix has been found, it may then be inverted in order to relate analyteconcentrations to observed spectral readings. The most direct method is the classical least squares methodin which spectral observations are made of a number of samples with known analyte concentrations.The problem can be written mathematically as A = KC, where A is the matrix containing spectralobservations for each sample, K is the response matrix, and C is the concentration matrix containinganalyte concentrations for each known sample. In the classical least squares solution, K is computed fromA and C as K = ACT(CCT)–1, and estimates of the concentration of analytes in subsequent samples maybe determined from the spectral observations a as c = (KTK)–1KTa.
This approach assumes that all measurement errors occur in the spectral observations and that theconcentration matrix C is known exactly. This is often not the case, however, and alternative formulationsfor the least squares calibration model solution have been proposed that include inverse least squaresand partial least squares (PLS). The latter has become overwhelmingly popular due to its robust abilityto model complex data interactions and to formulate powerful prediction models. The PLS techniqueemploys an iterative singular value decomposition of the A matrix to extricate spectral changes moststrongly correlated to analyte concentration changes and thereby creates a number of model “factors,”which may be linear combinations of many of the observations in A.
In the practical application of PLS, data observations are typically split into two groups: one is usedfor formulation of the model (calibration) and the other is used for validation of the model (prediction).Two common statistics are the standard error of calibration (SEC), which is the RMS prediction errorof the model compared to the calibration data set, and standard error of prediction (SEP), which is theRMS prediction error of the model when applied to the validation set. A problem that can arise in PLSmodeling is “overfitting” of the data in which noise or spurious trends evident in the calibration datamay actually be factored into the model if chance correlation to analyte concentrations exists. Theseparation of calibration and validation data sets is one technique used to detect potential overfitting.
For the purposes of discussion of the literature, it is useful to break the NIR region into the very NIRregion (from 700 to 1300 nm) and the NIR region (from 2.0 to 5.0 �m). The attraction to the very NIRregion is that optical detectors and sources in this region are particularly easy to come by, transmissionthrough tissue is rather good, and transmissive fiber optics may be employed to facilitate probe design.However, glucose absorption bands are particularly weak in this region, and it may be difficult to acquiresignals with substantial signal to noise to allow robust measurement. Examples of very NIR studies ofglucose determination include References 55 through 58.
Longer in the NIR spectrum, a relative dip in the water absorbance spectrum opens a unique windowin the 2.0 to 2.5 �m wavelength region. This window, saddled between two large water absorbance peaks,allows pathlengths or penetration depths on the order of millimeters and contains specific glucose peaksat 2.13, 2.27, and 2.34 �m. So far, this region has offered the most promising results for quantifiableglucose measurement using NIR spectroscopy. The instrumentation required for spectral measurementsin this region is somewhat more expensive. Typically, FTIR spectrometers with InSb, HgCdTe, or extendedInGaAs are required to obtain spectra with sufficient signal to noise. A further challenge is that fiber-optic materials appropriate for this spectral region are not as readily available. Chalcogenide fibers havetypically high refactive indices leading to large Fresnel losses during coupling. They also exhibit sharpbands in transmission that may be bend dependent. Very low –OH glass fibers provide partial transmis-sion out to about 2.3 �m, but fall off very rapidly in this region. Sapphire fibers and now fluoride aretransmissive in this region and offer promise; however, they are quite expensive and typically more brittleand less flexible than glass fibers. Investigations of glucose determination using this spectral region includethose recounted in References 59 through 62.
18.3.3.3 Raman Spectroscopy
Early attempts to employ Raman techniques to measure glucose concentration directly in aqueoussolutions, serum, and plasma have met with some success in vitro.63–67 However, efforts to utilize these
©2003 CRC Press LLC

techniques in vivo for transcutaneous measurement of whole blood glucose levels have met with consid-erable difficulty.67,68 This is partly because whole blood and most tissues are highly absorptive; in addition,most tissues contain many fluorescent and Raman-active confounders.68 As a surrogate to blood glucosemeasurement, several investigators have suggested using Raman spectroscopy to obtain the glucose signalfrom the aqueous humor of the eye.68–70
The glucose content of the aqueous humor reflects an age-dependent steady-state value of approxi-mately 70% of that found in blood, and the time lag between aqueous humor and blood glucose hasbeen shown to be on the order of minutes. For Raman sensing, the aqueous humor of the eye is relativelynonabsorptive and contains many fewer Raman-active molecules than whole blood. However, eventhough only four or five Raman-active constituents are present in significant concentrations in theaqueous humor, it is still necessary to use both linear and nonlinear multifactor analytical techniques toobtain accurate estimates of glucose concentrations from the total Raman spectrum.71 In addition, aswith other tissues, when excited in the near-infrared region (700 to 1300 nm) Raman spectra encounterless fluorescence background. However, although the background fluorescence falls off when excitationis moved to the NIR region, the Raman signal also falls off to the fourth power with wavelength. Thusit remains to be seen if the Raman approach could be measured at laser intensities that can be used safelyin the eye.
18.3.3.4 Polarimetric Glucose Sensing
As mentioned in the in vitro analysis section earlier, molecules such as glucose have the ability to rotateplane polarized light and this rotation is proportional to the concentration of the molecule. For pola-rimetry to be used as a noninvasive technique for blood glucose monitoring, the polarized light signalmust be able to pass from the source, through the body, and to a detector without total depolarizationof the beam. Since most tissues, including the skin, possess high scattering coefficients, maintainingpolarization information in a beam passing through a thick piece of tissue (i.e., 1 cm), which includesskin, would not be feasible. Even highly scattering tissue thicknesses of less than 4 mm incur 95%depolarization of the light due to scattering from the tissue. In addition, in these highly scattering tissuesa large amount of proteins and other chiral substances have a much stronger rotation than that due toglucose, making it very difficult to measure the millidegree rotations required for physiologic glucoseconcentrations. Similar to the Raman approach, the aqueous humor of the eye as a site for detection ofin vivo glucose concentrations has been suggested as an alternative to transmitting light through theskin.72–77 For the polarimetric approach, the cornea and the aqueous humor provide a low scatteringwindow into the body and, because the aqueous humor is virtually devoid of proteins, the main opticallychiral molecule is glucose.
Unlike on line processing systems that measure relatively high sugar concentrations (grams) and allowfor longer pathlengths (10 cm), the in vivo glucose concentration is smaller and, if the eye is to be usedas the sensing site, the pathlength is only 1 cm. Therefore, advances in polarimetric instrumentation haveonly recently made it possible to measure the small rotations due to glucose at physiological levels. Forexample, at a wavelength of 670 nm (red), glucose will rotate the linear polarization of a light beamapproximately 0.4 millidegrees per 10 mg/dl for a 1-cm sample pathlength. In order to measure suchsmall rotations, a very sensitive and stable polarimeter must be employed. Throughout the past decademany researchers have investigated the development of such sensitive units.74–77 The primary approachbeing investigated today includes a light source (typically a laser), a means of modulating the polarization(photoelastic modulator, faraday rotator, etc.), and a means of detecting the signal, typically by using alock-in amplifier or some means of heterodyne detection.
The eye as a sensing site for polarimetric glucose monitoring is not without its share of problems thatneed to be overcome. The cornea is birefringent, which means it can change the polarization vector ofthe light (i.e., like a quartz crystal); this change is variable in the presence of eye motion, which canconfound the polarization signal due to glucose. For polarimetric monitoring, the light must travel acrossthe anterior chamber of the eye but, due to its curvature and change in refractive index, the eye naturallytries to focus all the light impinging on it toward the retina. Therefore, the key issues to be addressed
©2003 CRC Press LLC

for this approach to be feasible for monitoring glucose include building an instrument that can accom-modate for the large birefringence of the cornea, particularly in the presence of motion artifact, and todevelop an instrument that can safely and simply couple the light source across the anterior chamber ofthe eye.
18.3.3.5 Other Optical Glucose Diagnostic Approaches
18.3.3.5.1 Photoacoustic SpectroscopyPhotoacoustic spectroscopy (PAS) can be used to acquire absorption spectra noninvasively from samples,including biological ones. The photoacoustic signal is obtained by probing the sample with a monochro-matic radiation that is modulated or pulsed. Absorption of probe radiation by the sample results inlocalized short-duration heating. Thermal expansion then gives rise to a pressure wave, which can bedetected with a suitable transducer. An absorption spectrum for the sample can be obtained by recordingthe amplitude of generated pressure waves as a function of probe beam wavelength. Because high signal-to-noise measurements require reasonable penetration of the sample by the probe radiation, the NIRregion holds the same attraction as for more conventional NIR spectroscopy approaches. A purportedadvantage of PAS, however, is that the signal recorded is a direct result of absorption alone, and scatteror dispersion does not play a role in the acquired signal.
PAS techniques in the NIR region face many of the same challenges attendant to other NIR spectro-scopic methods, namely, that complicated and empirical calibration models must be created in order toaccount for the broad overlapping spectral bands associated with the NIR spectrum. Further, the tech-nique requires expensive instrumentation and the measurements are particularly sensitive to variablesincluding temperature, transducer pressure, and sample morphology. Some examples of PAS techniquesapplied to glucose sensing include those found in References 78 and 79.
18.3.3.5.2. Optical Property Measurements as Indicators of GlucoseThe refractive index (RI) of a material is routinely used to determine sugar concentrations in syrups,honey, molasses, tomato products, and jams for which the glucose concentration is very high. The RI ofa solution of carbohydrate such as glucose increases with increasing concentration and so can be usedto measure the amount of carbohydrate present. The RI of a liquid can easily be determined by opticallymeasuring the angle of refraction at a boundary between the liquid and a solid of known RI. The RI isalso temperature and wavelength dependent and so measurements are usually made at a specific tem-perature (20�C) and wavelength (589.3 nm). This method is quick and easy to carry out and can beperformed with simple handheld instruments.
The change in refractive index is also directly related to a change in the elastic scatter of a molecule.Therefore, the measurement of light scatter in the NIR region has been investigated for potentiallyquantifying glucose noninvasively; both in vitro and in vivo results have been obtained.80–82 This is muchmore challenging than for the agricultural measurement because in vivo blood glucose, as opposed toin vitro sugars such as that found in syrup, has very small concentrations. In addition, the specificity ispotentially problematic because other physiologic effects, unrelated to glucose concentration, couldproduce similar variations of the reduced scattering coefficient with time. The measurement precisionof the reduced scattering coefficient and separation of scatter and absorption changes is another potentialproblem with this approach. Tissue scattering is caused by a variety of substances and organelles (mem-branes, mitochondria, nucleus, etc.) and all have different RIs; thus, this approach also needs to take intoaccount the different RIs of tissue. Lastly, there is a need to account for factors that might change thereduced scattering coefficient such as variations in temperature, red blood cell concentration, electrolytelevels, and movements of extracellular and intracellular water.
18.3.3.5.3 Optical Coherence TomographyOptical coherence tomography (OCT) provides a particularly sensitive means for measuring the opticalproperties of turbid media including scatter and RI. OCT is an optical ranging technique in which a veryshort coherence length source is coupled to an interferometer with a sample in one arm and a referencereflector in the other. As the reference reflector is scanned, depth resolved interference fringes are produced
©2003 CRC Press LLC

with amplitude dependent on the amplitude of backscattered radiation. Because the scattering coefficientof tissue is dependent on the bulk index of refraction, an increase in RI and a decrease in scatter can bedetected as a change in the slope of fall-off of the depth-resolved OCT amplitude. At least one group hasexplored this detection technique for measurement of glucose in vivo.83
References
1. Schugerl, K., Progress in monitoring, modeling and control of bioprocesses during the last 20 years,J. Biotechnol., 85, 149, 2001.
2. Fayolle, P., Picque, D., and Corrieu, G., On-line monitoring of fermentation processes by a newremote dispersive middle-infrared spectrometer, Food Control, 11, 291, 2000.
3. Ducommun, P., Bolzonella, I., Rhiel, M., Pugeaud, M., Stockar, U.V., and Marison, I.W., On-linedetermination of animal cell concentration, Appl. Spectrosc., 72, 515, 2001.
4. Hagman, A. and Sivertsson, P., The use of NIR spectroscopy in monitoring and controlling bio-processes, Process Control Qual., 11, 125, 1998.
5. Heise, H.M., Bittner, A., and Marbach, R., Near-infrared reflectance spectroscopy for noninvasivemonitoring of metabolites, Clin. Chem. Lab. Med., 38, 137, 2000.
6. Lewis, C.B., McNichols, R.J., Gowda, A., and Coté, G.L., Investigation of near-infrared spectroscopyfor periodic determination of glucose in cell culture media in situ, Appl. Spectrosc., 54, 1453, 2000.
7. Hazen, K.H., Arnold, M.A., and Small, G.W., Measurement of glucose and other analytes in undi-luted human serum with near-infrared transmission spectroscopy, Appl. Spectrosc., 52, 1597, 1998.
8. Riley, M.R., Rhiel, M., Zhou, X., Arnold, M.A., and Murhammer, D.W., Simultaneous measurementof glucose and glutamine in insect cell culture media by near infrared spectroscopy, Biotechnol.Bioeng., 55, 11, 1997.
9. Riley, M.R., Arnold, M.A., Murhammer, D.W., Walls, E.L., and Delacruz, N., Adaptive calibrationscheme for quantification of nutrients and byproducts in insect cell bioreactors by near-infraredspectroscopy, Biotechnol. Prog., 14, 527, 1998.
10. Yeung, K.S.Y., Hoare, M., Thornhill, N.F., Williams, T., and Vaghjiani, J.D., Near-infrared spectros-copy for bioprocess monitoring and control, Biotechnol. Bioeng., 63, 684, 1999.
11. Fayolle, P., Picque, D., and Corrieu, G., Monitoring of fermentation processes producing lacticacid bacteria by mid-infrared spectroscopy, Vibrator Spectrosc., 14, 247, 1997.
12. Li, Y., Brown, C.W., Sun, F.M., Mccrady, J.W., and Traxler, R.W., Non-invasive fermentation analysisusing an artificial neural network algorithm for processing near infrared spectra, J. Near InfraredSpectrosc., 7, 101, 1999.
13. Cavinato, A.G., Mayes, D.M., Ge, Z., and Callis, J.B., Noninvasive method for monitoring ethanolin fermentations processes using fiberoptic near-infrared spectroscopy, Anal. Chem., 62, 1977, 1990.
14. Vaccari, G., Dosi, E., Campi, A.L., Gonzalezvaraa A., Matteuzzi, D., and Mantovani, G., A near-infrared spectroscopy technique for the control of fermentation processes — an application tolactic-acid fermentation, Biotechnol. Bioeng., 43, 913, 1994.
15. McShane, M.J. and Coté, G.L., Near-infrared spectroscopy for determination of glucose lactate,and ammonia in cell culture media, Appl. Spectrosc., 52, 1073, 1998.
16. Osbourne, B.G. and Fearn, T., Near Infrared Spectroscopy in Food Analysis, Longman Scientific andTechnical, Harlow, Essex, U.K., 1986.
17. Burns, D.A. and Ciurczak, E.W., Handbook of Near-Infrared Analysis, Marcel Dekker, New York,1992.
18. McClure, G.L., Computerized Quantitative Infrared Analysis, American Society for Testing andMaterials, Philadelphia, PA, 1987.
19. Mattu, M.J., Small, G.W., and Arnold, M.A., Application of multivariate calibration techniques toquantitative analysis of bandpass-filtered Fourier transform infrared interferogram data, Appl.Spectrosc., 51, 1369, 1997.
©2003 CRC Press LLC

20. Goodacre, R., Monitoring microbial bioprocesses for metabolite concentrations using dispersiveand surface enhanced Raman spectroscopies and machine learning, The Aberystwyth QuantitativeBiology Group Institute of Biological Sciences, http://gepasi.dbs.aber.ac.uk/roy/advert/pg00.htm,site accessed November 2001.
21. Berger, A.J., Introduction to concepts in laser technology for glucose monitoring, Diabetes Technol.Therapeutics, 1, 121, 1999.
22. Long, D.A., Raman Spectroscopy, McGraw-Hill, New York, 1977, pp. 1–12.23. Shaw A.D., Kaderbhai, N., Jones, A., Woodward, A.M., Goodacre, R., Rowland, J.J., and Kell, D.B.,
Non-invasive, on-line monitoring of the biotransformation by yeast of glucose to ethanol usingdispersive raman spectroscopy and chemometrics, Appl. Spectrosc., 53, 1419, 1999.
24. Moskovits, M., Surface enhanced spectroscopy, Rev. Mod. Phys., 57, 783, 1985.25. Chang, R.K. and Furtak, T.E., Surface Enhanced Raman Scattering, Plenum Press, New York, 1982.26. Kneipp, K., Kneipp, H., Itzkan, I., Dasari, R.R., and Feld, M.S., Surface-enhanced Raman scattering:
a new tool for biomedical spectroscopy, Curr. Sci., 77, 915, 1999.27. Vo-Dinh, T., Stokes, D.L., Griffin, G.D., Volkan, M., Kim.U.J., and Simon M.I., Surface-enhanced
Raman scattering (SERS) method and instrumentation for genomics and biomedical analysis,J. Raman Spectrosc., 30, 785, 1999.
28. Vo-Dinh, T., Surface enhanced Raman spectroscoppy using metallic nanostructures, Trends Anal.Chem., 17, 557, 1998.
29. Rudolph Research Analytical, 354 Route 206 Flanders, NJ 07836, http://www.rudolphresearch.com/polarimetry.htm, site accessed November 2001.
30. Browne, C.A. and Zerban, F.W., Physical and Chemical Methods of Sugar Analysis, 3rd ed., JohnWiley & Sons, New York, 1941, p. 263.
31. Phillips, R., McGarraugh, G., Jurik, F.A., and Underwood, R.D., U.S. patent 5,563,042, Whole bloodglucose test strip, October 8, 1996.
32. Marcus, A., Medical lasers bid to supplant needles, EEtimes.com, April 4, 2001, http://www.eet-imes.com/story/OEG20010404S0054, site accessed November 2001.
33. Lasette Plus, Cell Robotics International, Inc., 2715 Broadbent Parkway NE, Albuquerque, NM87107 USA, http://www.cellrobotics.com/, site accessed November 2001.
34. Jacques, S., Laser poration of skin for transdermal drug delivery and interstitial fluid and bloodgas collection, NewsEtc., from the Oregon Medical Laser Center, May, 1998, http://omlc.ogi.e.,du/news/may98/gallery_may98.html, site accessed November 2001.
35. SpectRx, Inc., Continuous Glucose Monitoring, http://www.spectrx.com/DevGlucose.html, siteaccessed November 2001.
36. Moreno-Bondi, M.C., Wolfbeis, O.S., Leiner, M.J., and Schaffar, B.P., Oxygen optrode for use in afiber-optic glucose biosensor, Anal. Chem., 62, 2377, 1990.
37. Rosenzweig, Z. and Kopelman, R., Analytical properties and sensor size effects of a micrometer-sized optical fiber glucose biosensor, Anal. Chem., 68, 1408, 1996.
38. Li, L. and Walt, D.R., Dual-analyte fiber-optic sensor for the simultaneous and continuous mea-surement of glucose and oxygen, Anal. Chem., 67, 3746, 1995.
39. Gunsingham, H., Tan, C.H., and Seow, J.K.L., Fiber-optic glucose sensor with electrochemicalgeneration of indicator reagent, Anal. Chem., 62, 755, 1990.
40. Abdel-Latif, M.S. and Guilbault, G.G., Fiber-optic sensor for the determination of glucose usingmicellar enhanced chemiluminescence of the peroxylate reaction, Anal. Chem., 60, 2671, 1988.
41. Schultz, J.S., A miniature optical glucose sensor based affinity binding, Biotechnology, 2, 885, 1984.42. Schultz, J.S., Mansouri, S., and Goldstein, I.J., Affinity sensor: a new technique for developing
implantable sensors for glucose and other metabolites, Diabetes Care, 5, 245, 1982.43. Meadows, D. and Schultz, J., Fiber-optic biosensors based on fluorescence energy-transfer, Talanta,
35, 150, 1988.44. Meadows, D. and Schultz, J., Design, manufacture and characterization of an optical-fiber glucose
affinity sensor-based on an homogeneous flouroscence energy-transfer assay system, Anal. Chem.Acta, 280, 21, 1993.
©2003 CRC Press LLC

45. Lakowicz, J.R. and Maliwal, B., Optical sensing of glucose using phase-modulation fluorimetry,Anal. Chim. Acta, 271, 155, 1993.
46. Ballerstadt, R. and Schultz, J.S., A fluorescence affinity hollow fiber sensor for continuous trans-dermal glucose monitoring, Anal. Chem., 72, 4185, 2000.
47. Russell, R., Gefrides, C., McShane, M., Coté, G.L., and Pishko, M., A fluorescence-based glucosebiosensor based on Concanavalin A and Dextran encapsulated in a poly(ethylene glycol) hydrogel,Anal. Chem., 71, 3126, 1999.
48. Bhandare, P., Mendelson, Y., Peura, R.A., Jantsch, G., Krüse-Jarres, J.D., Marbach, R., and Heise,H.M., Multivariate determination of glucose in whole blood using partial least-squares and artificialneural networks based on mid-infrared spectroscopy, Appl. Spectrosc., 47, 1214, 1993.
49. Zeller, F., Novak, P., and Landgraf, R., Blood glucose measurement by infrared spectroscopy, Int.J. Artif. Organs, 12, 129, 1989.
50. Bhandare, P., Mendelson, Y., Stohr, E., and Peura, R., Glucose determination in simulated plasmasolutions using infrared spectrophotometry, Proc. IEEE-EMBS, 14, 163, 1992.
51. Heise, H.M., Marbach, R., Janatsch, G., and Krüse-Jarres, J.D., Multivariate determination ofglucose in whole blood by attenuated total reflection infrared spectroscopy, Anal. Chem., 61, 2009,1989.
52. Robinson, K., Blood analysis: noninvasive methods hover on horizon, Biophotonics Int., 5, 48, 1998.53. Martens, H. and Naes, T., Multivariate Calibration, John Wiley & Sons, New York, 1989.54. Haaland, D.M. and Thomas, E.V., Partial least-squares methods for spectral analyses. 1. Relation
to other quantitative calibration methods and the extraction of qualitative information, Anal.Chem., 60, 1193, 1988.
55. Amato, I., Race quickens for non-stick blood monitoring technology, Science, 258, 892, 1992.56. Robinson, M.R., Eaton, R.P., Haaland, D.M., Koepp, G.W., Thomas, E.V., Stallard, B.R., and
Robinson, P.L., Noninvasive glucose monitoring in diabetic patients: a preliminary evaluation,Clin. Chem., 38, 1618, 1992.
57. Rosenthal, R.D., Paynter, L.N., and Mackie, L.H., Non-invasive measurement of blood glucose,U.S. patent 5,028,787, 1991.
58. Danzer, K., Fischbacher, C., Jagemann, K.U., and Reichelt, K.J., Near-infrared diffuse reflectionspectroscopy for non-invasive blood-glucose monitoring, IEEE-LEOS Newslett., 12, 9, 1998.
59. Haaland, D.M., Robinson, M.R., Koepp, G.W., Thomas, E.V., and Eaton, R.P., Reagentless near-infrared determination of glucose in whole blood using multivariate calibration, Appl. Spectrosc.,46, 1575, 1992.
60. Marbach, R., Koschinsky, T., Gries, F.A., and Heise, H.M., Noninvasive blood glucose assay bynear-infrared diffuse reflectance spectroscopy of the human inner lip, Appl. Spectrosc., 47, 875, 1993.
61. Shengtian, P., Chung, H., and Arnold, M.A., Near-infrared spectroscopic measurement of physi-ological glucose levels in variable matrices of protein and triglycerides, Anal. Chem., 68, 1124, 1996.
62. Chung, H., Arnold, M.A., Rhiel, M., and Murhammer, D.W., Simultaneous measurements ofglucose, glutamine, ammonia, lactate, and glutamate in aqueous solutions by near-infrared spec-troscopy, Appl. Spectrosc., 50, 270, 1996.
63. Wang, S.Y., Hasty, C.E., Watson, P.A., et al., Analysis of metabolites in aqueous solutions by usinglaser Raman spectroscopy, Appl. Opt., 32, 925, 1993.
64. Goetz, M.J., Coté, G.L., Ercken, R., et al., Application of a multivariate technique to Raman spectrafor quantification of body chemicals, IEEE Trans. Biomed. Eng., 42, 728, 1995.
65. Dou, X.M., Yamaguchi, Y., Yamamoto, H., Uenoyama, H., and Ozaki, Y., Biological applicationsof anti-Stokes Raman spectroscopy-quantitative analysis of glucose in plasma and serum by a highlysensitive multichannel Raman spectrometer, Appl. Spectrosc., 50, 1301, 1996.
66. Berger, A.J., Itzkan, I., and Feld, M.S., Feasibility of measuring blood glucose concentration by near-infrared Raman-spectroscopy, Spectrochim. Acta A Mol. Biomol. Spectrosc., 53, 287, 1997.
67. Koo, T.-W., Berger, A.J., Itzkan, I., Horowitz, G., and Feld, M.S., Reagentless blood analysis bynear-infrared Raman spectroscopy, Diabetes Technol. Ther., 1, 153, 1999.
©2003 CRC Press LLC
68. Lambert, J.L., Storrie-Lombardi, M.C., and Borchert, M.S., Measurement of physiologic glucoselevels using Raman spectroscopy in a rabbit aqueous humor model, LEOS Newslett., 12, 19, 1998.
69. Tarr, R.V. and Steffes, P.G., Non-invasive blood glucose measurement system and method usingstimulated Raman spectroscopy, U.S. patent 5243983, Sept. 14, 1993.
70. Wicksted, J.P., Erckens, R.J., Motamedi, M., and March, W.F., Raman spectroscopy studies ofmetabolic concentrations in aqueous solutions and aqueous humor specimens, Appl. Spectrosc.,49, 987, 1995.
71. Borchert, M.S., Storrie-Lombardi, M.C., and Lambert, J.L., A noninvasive glucose monitor: pre-liminary results in rabbits, Diabetes Technol. Ther., 1, 145, 1999.
72. March, W.F., Rabinovitch, B., and Adams, R.L., Noninvasive glucose monitoring of the aqueoushumor of the eye: part II. Animal studies and the scleral lens, Diabetes Care, 5, 259, 1982.
73. Rabinovitch, B., March, W.F., and Adams, R.L., Noninvasive glucose monitoring of the aqueoushumor of the eye. Part I. Measurement of very small optical rotations, Diabetes Care, 5, 254, 1982.
74. Coté, G.L., Fox, M.D., and Northrop, R.B., Noninvasive optical polarimetric glucose sensing usinga true phase measurement technique, IEEE Trans. Biomed. Eng., 39, 752, 1992.
75. Cameron, B.D. and Coté, G.L., Noninvasive glucose sensing utilizing a digital closed-loop polari-metric approach, IEEE Trans. Biomed. Eng., 44, 1221, 1997.
76. Chou, C., Han, C.Y., Kuo, W.C., Huang, Y.C., Feng, C.M., and Shyu, J.C., Noninvasive glucosemonitoring in vivo with an optical heterodyne polarimeter, Appl. Opt., 37, 3553, 1998.
77. Cameron, B.D., Baba, J.S., and Coté, G.L., Measurement of the glucose transport time-delaybetween blood and aqueous humor of the eye for the eventual development of a noninvasiveglucose sensor, Diabetes Technol. Ther., 3, 201, 2001.
78. Christison, G.B. and MacKenzie, H.A., Laser photoacoustic determination of physiological glucoseconcentration in human whole blood, Med. Biol. Eng. Comput., 31, S17, 1993.
79. Quan, K.M., Christison, G.B., MacKenzie, H.A., and Hodgson, P., Glucose determination by apulsed photoacoustic technique: an experimental study using a gelatin-based tissue phantom, Phys.Med. Biol., 38, 1911, 1993.
80. Kohl, M. and Cope, M., Influence of glucose concentration on light scattering in tissue-simulatingphantoms, Opt. Lett., 19, 2170, 1994.
81. Maier, J.S., Walker, S.A., Fantini, S., Franceschini, M.A., and Gratton, E., Possible correlationbetween blood glucose concentration and the reduced scattering coefficient of tissues in the nearinfrared, Opt. Lett., 19, 2062, 1994.
82. Bruulsema, J.T., Hayward, J.E., Farrell, J.T., Patterson, M.S., Heinemann, L., Berger, M., Koschinsky,T., Sandahl-Christiansen, J., Orskov, H., Essenpreis, M., Schmelzeisen-Redeker, G., and Böcker, D.,Correlation between blood glucose concentration in diabetics and noninvasively measured tissueoptical scattering coefficient, Opt. Lett., 22, 190, 1997.
83. Larin, K.V., Larina, I.V., Motamedi, M., Gelikonov, V.M., Kuranov, R.V., and Esenaliev, R.O.,Potential application of optical coherence tomography for noninvasive monitoring of glucoseconcentration, Proc. SPIE, 4263, 83, 2001.
©2003 CRC Press LLC