biomedical engineering online biomed central - home - …€¦ · · 2017-08-28biomedical...
TRANSCRIPT
BioMed CentralBioMedical Engineering OnLine
ss
Open AcceResearchCharacterization of mechanical behavior of a porcine pulmonary artery strip using a randomized uniaxial stretch and stretch-rate protocolChoon-Sik Jhun* and John C CriscioneAddress: Department of Biomedical Engineering, Texas A&M University, College Station, TX, 77843-3120, USA
Email: Choon-Sik Jhun* - [email protected]; John C Criscione - [email protected]
* Corresponding author
AbstractBackground: Much of the experimental work in soft tissue mechanics has been focused on fittingapproximate relations for specific tissue types from aggregate data on multiple samples of the tissue. Suchrelations are needed for modeling applications and have reasonable predictability – especially given thenatural variance in specimens. There is, however, much theoretical and experimental work to be done indetermining constitutive behaviors for particular specimens and tissues. In so doing, it may be possible toexploit the natural variation in tissue ultrastructure – so to relate ultrastructure composition to tissuebehavior. Thus, this study focuses on an experimental method for determining constitutive behaviors andillustrates the method with analysis of a porcine pulmonary artery strip. The method characterizes theelastic part of the response (implicitly in terms of stretch) and the inelastic part in terms of short termstretch history (i.e., stretch-rate) Ht2, longer term stretch history Ht1, and time since the start of testing T.
Methods: A uniaxial testing protocol with a random stretch and random stretch-rate was developed. Theaverage stress at a particular stretch was chosen as the hyperelastic stress response, and deviation fromthe mean at this particular stretch is chosen as the inelastic deviation. Multivariable Linear RegressionAnalysis (MLRA) was utilized to verify if Ht2, Ht1, and T are important factors for characterizing the inelasticdeviation. For acquiring Ht2 and Ht1, an integral function type of stretch history was employed with timeconstants chosen from the relaxation spectrum of an identical size strip from the same tissue with thesame orientation. Finally, statistical models that characterize the inelasticity were developed at various,nominal values of stretch, and their predictive capability was examined.
Results: Inelastic deviation from hyperelasticity was high (31%) for low stretch and declined significantlywith increasing stretch to a nadir of 3.6% for a stretch of 1.7. The inelastic deviation then increased withincreasing stretch at the same point in the stress-strain curve where stiffness began to increase strikingly.MLRA showed that T is a major inelastic parameter at low deformation. For moderate and highdeformations, Ht2 and Ht1 were dominant.
Discussion: A randomized uniaxial testing protocol was applied to a strip of porcine pulmonary artery tocharacterize the elasticity and inelasticity of a soft tissue. We were successful in determining the elasticresponse and the factors that gave rise to the inelastic deviation. This investigation seeks methods tobetter define, phenomenologically, the elastic and inelastic behavior of soft tissues.
Published: 23 January 2008
BioMedical Engineering OnLine 2008, 7:4 doi:10.1186/1475-925X-7-4
Received: 24 April 2007Accepted: 23 January 2008
This article is available from: http://www.biomedical-engineering-online.com/content/7/1/4
© 2008 Jhun and Criscione; licensee BioMed Central Ltd. This is an Open Access article distributed under the terms of the Creative Commons Attribution License (http://creativecommons.org/licenses/by/2.0), which permits unrestricted use, distribution, and reproduction in any medium, provided the original work is properly cited.
Page 1 of 11(page number not for citation purposes)
BioMedical Engineering OnLine 2008, 7:4 http://www.biomedical-engineering-online.com/content/7/1/4
IntroductionA great challenge in biomechanics, and its related disci-plines such as mechanobiology, is the determination ofmechanical constitutive behaviors for tissues that undergohigh strain. Even for homogeneous, single phase, rubber-like materials with behavior that is nearly isotropic andhyperelastic, the determination of constitutive behaviorshas been ambiguous and problematic [1]. For multi-phase, heterogeneous tissues with behavior that is aniso-tropic and visco-elastic, much theoretical and experimen-tal work remains [2], and this work is a small step towardimproving experimental methods to delineate tissuebehavior.
There are, of course, approximate constitutive relations formost tissue types that have been validated with fits toexperimental data and that have enabled modeling appli-cations in biomechanics. Rather than integrate tests frommultiple specimens to yield a generalized relation, thiswork is focused on a methodology to study individualspecimen variations. Our reason for doing so is to exploitthe natural variation in tissue structure to better under-stand the structure-function relationship. Each specimenhas differing amounts of elastin, collagen, water, etc.; andwith experimental methods that delineate rather thanaggregate behavior, we seek to relate ultrastructure param-eters to tissue response parameters. The ultimate goal ofthis work, albeit decades away, is to determine howultrastructure maps to tissue behavior.
Toward this end, we developed a random stretch and ran-dom stretch-rate protocol for a one-dimensional sample(longitudinal strip from a porcine pulmonary artery). Theaverage stress at a particular stretch is defined as the elasticor hyperelastic part of the response and the deviationfrom this average is defined as the inelastic part of theresponse. The inelastic response is assumed to be a func-tion of three variables: stretch rate related, short temstretch history Ht2; longer term stretch history Ht1; andtime T since the start of the test protocol. At a particularstretch value, the inelastic response is assumed to be a lin-ear function of these variables and dependence is foundby Multivariable Linear Regression Analysis (MLRA). Arandomized testing protocol eliminates any potential cor-relation among Ht2, Ht1, and T that conventional cyclictesting cannot. This randomness enables the use of MLRA.
Hoffman and Grigg have introduced the advantage ofapplication of random stress stimuli to the soft tissue [3].The difference here is that stretch herein, rather than stresstherein, is the independent variable that is randomized.Moreover, we seek to define and determine the elastic andinelastic parts of the response at particular chosen valuesof strain rather than fit behavior for the range tested.Though, there are many time-dependent theories that can
capture or fit inelastic behaviors, such as, linear/nonlinearviscoelastic [4-10], poroviscoelastic [11,12], and biphasic[13-16]., this study is focused on experimental methodol-ogy for hyperelastic constitutive behaviors.
Remark on HyperelasticityWe often mix the terms elastic and hyperelastic whenreferring to material behavior and certain aspects of thestress response. Conceptually, one can think about elastic-ity (i.e., stress as a function of stretch or strain) as differentthan hyperelasticity (i.e., strain energy as a function ofstretch or strain); yet in fact, elastic behavior must behyperelastic – or else it violates the first law of thermody-namics. This is easily shown by considering a closed,cyclic process involving an elastic material. An elasticmaterial does not have viscous losses, and the work of thereverse path (or cycle) is the opposite of the forward path(or cycle). This is a direct result of the stress-power law. Ifthe work done is zero for all closed paths, then there existsa state function (strain energy) that represents the storage,in a conservative manner, of work done on the material.This is hyperelasticity wherewith the constitutive law canbe defined by its strain energy function and the stress isgiven by the derivative of the strain energy with respect tothe strain. If the work done is not zero for all closed paths(i.e., non-hyperelastic), then choose one such path and goaround the cycle in the direction that produces work, andthen build a perpetual motion machine of the first kind.It is quite easy (in two and three dimensions) to fit anelastic model that violates the first law [17]; and yet it isimpossible for a hyperelastic model to violate the first law.To be explicit: 1) if an elastic model satisfies the first lawthen it can be expressed in a hyperelastic form, and 2) ifan elastic model cannot be expressed in a hyperelasticform, then it violates the first law. When we refer to elasticbehavior as hyperelastic, we are only excluding behaviorthat violates the first law of thermodynamics.
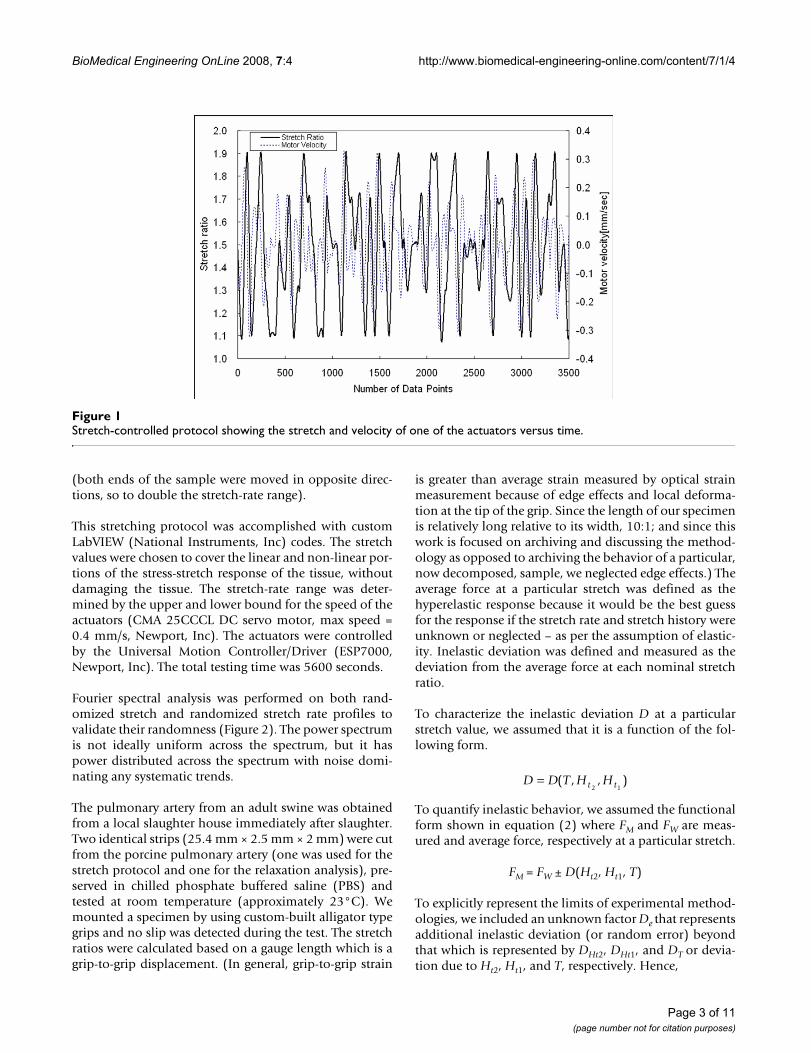
MethodsA uniaxial testing protocol wherein the stretch and stretchrate were randomized was developed to better delineatethe average stress vs. stretch response of soft tissue. Therandomized testing protocol was achieved by defining 71time points or nodes and then randomly choosing (at thenodes) nominal stretch values of λ = 1.1, 1.3, 1.5, 1.7, or1.9 and stretch-rate values in the range of [-5.26 s-1, 5.33s-1]. With 71 time nodes there are 70 intervals, and in eachinterval we defined 50 points. The stretch value at pointsbetween nodes was obtained from the nodal stretches andstretch-rates by use of cubic Hermite interpolation intime, so to achieve C1 continuity across intervals [18]. Fig-ure 1 displays the stretch versus time of the stretching pro-tocol. Upon inputting the reference length of the sample,the stretch versus time protocol was converted to displace-ment versus time and fed to opposing linear actuators
Page 2 of 11(page number not for citation purposes)
BioMedical Engineering OnLine 2008, 7:4 http://www.biomedical-engineering-online.com/content/7/1/4
(both ends of the sample were moved in opposite direc-tions, so to double the stretch-rate range).
This stretching protocol was accomplished with customLabVIEW (National Instruments, Inc) codes. The stretchvalues were chosen to cover the linear and non-linear por-tions of the stress-stretch response of the tissue, withoutdamaging the tissue. The stretch-rate range was deter-mined by the upper and lower bound for the speed of theactuators (CMA 25CCCL DC servo motor, max speed =0.4 mm/s, Newport, Inc). The actuators were controlledby the Universal Motion Controller/Driver (ESP7000,Newport, Inc). The total testing time was 5600 seconds.
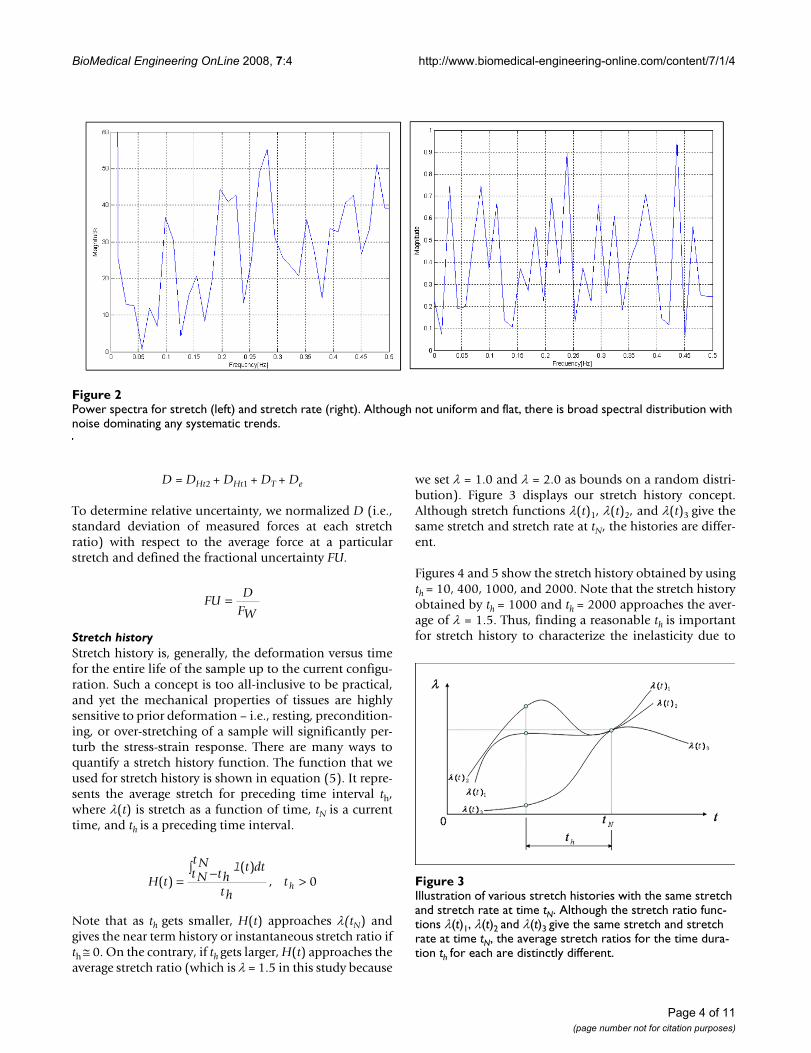
Fourier spectral analysis was performed on both rand-omized stretch and randomized stretch rate profiles tovalidate their randomness (Figure 2). The power spectrumis not ideally uniform across the spectrum, but it haspower distributed across the spectrum with noise domi-nating any systematic trends.
The pulmonary artery from an adult swine was obtainedfrom a local slaughter house immediately after slaughter.Two identical strips (25.4 mm × 2.5 mm × 2 mm) were cutfrom the porcine pulmonary artery (one was used for thestretch protocol and one for the relaxation analysis), pre-served in chilled phosphate buffered saline (PBS) andtested at room temperature (approximately 23°C). Wemounted a specimen by using custom-built alligator typegrips and no slip was detected during the test. The stretchratios were calculated based on a gauge length which is agrip-to-grip displacement. (In general, grip-to-grip strain
is greater than average strain measured by optical strainmeasurement because of edge effects and local deforma-tion at the tip of the grip. Since the length of our specimenis relatively long relative to its width, 10:1; and since thiswork is focused on archiving and discussing the method-ology as opposed to archiving the behavior of a particular,now decomposed, sample, we neglected edge effects.) Theaverage force at a particular stretch was defined as thehyperelastic response because it would be the best guessfor the response if the stretch rate and stretch history wereunknown or neglected – as per the assumption of elastic-ity. Inelastic deviation was defined and measured as thedeviation from the average force at each nominal stretchratio.
To characterize the inelastic deviation D at a particularstretch value, we assumed that it is a function of the fol-lowing form.
To quantify inelastic behavior, we assumed the functionalform shown in equation (2) where FM and FW are meas-ured and average force, respectively at a particular stretch.
FM = FW ± D(Ht2, Ht1, T)
To explicitly represent the limits of experimental method-ologies, we included an unknown factor De that representsadditional inelastic deviation (or random error) beyondthat which is represented by DHt2, DHt1, and DT or devia-tion due to Ht2, Ht1, and T, respectively. Hence,
D D T H Ht t= ( , , )2 1
Stretch-controlled protocol showing the stretch and velocity of one of the actuators versus timeFigure 1Stretch-controlled protocol showing the stretch and velocity of one of the actuators versus time.
Page 3 of 11(page number not for citation purposes)
BioMedical Engineering OnLine 2008, 7:4 http://www.biomedical-engineering-online.com/content/7/1/4
D = DHt2 + DHt1 + DT + De
To determine relative uncertainty, we normalized D (i.e.,standard deviation of measured forces at each stretchratio) with respect to the average force at a particularstretch and defined the fractional uncertainty FU.
Stretch historyStretch history is, generally, the deformation versus timefor the entire life of the sample up to the current configu-ration. Such a concept is too all-inclusive to be practical,and yet the mechanical properties of tissues are highlysensitive to prior deformation – i.e., resting, precondition-ing, or over-stretching of a sample will significantly per-turb the stress-strain response. There are many ways toquantify a stretch history function. The function that weused for stretch history is shown in equation (5). It repre-sents the average stretch for preceding time interval th,where λ(t) is stretch as a function of time, tN is a currenttime, and th is a preceding time interval.
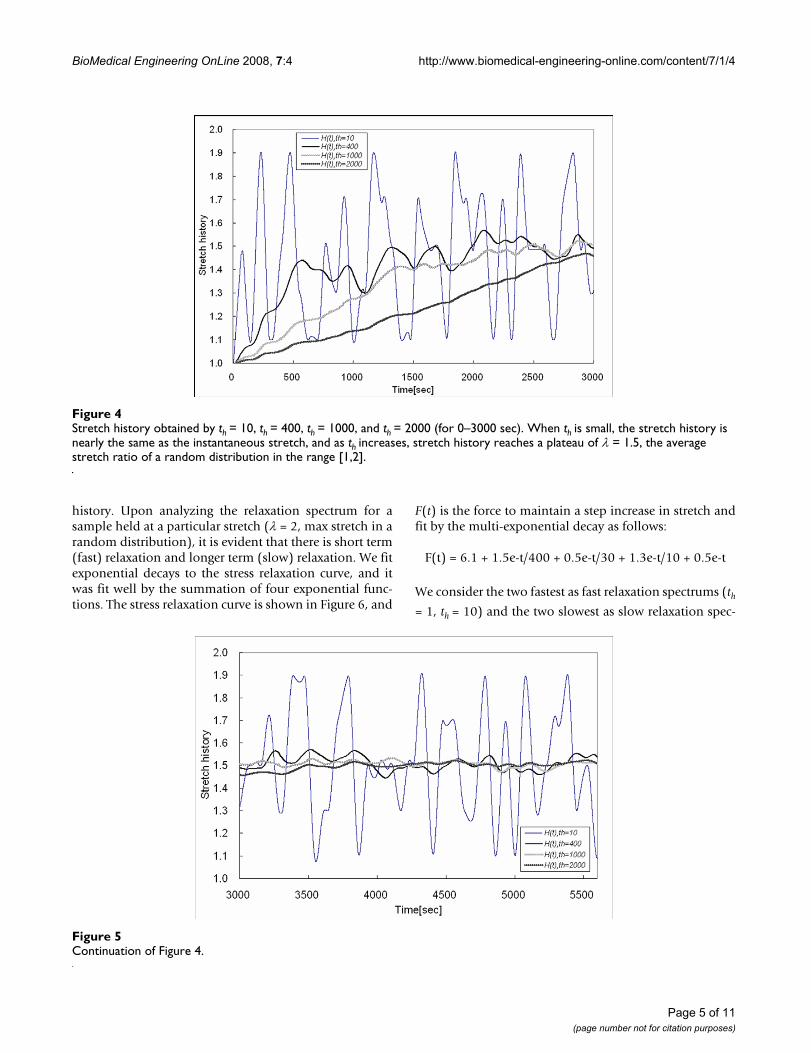
Note that as th gets smaller, H(t) approaches λ(tN) andgives the near term history or instantaneous stretch ratio ifth ≅ 0. On the contrary, if th gets larger, H(t) approaches theaverage stretch ratio (which is λ = 1.5 in this study because
we set λ = 1.0 and λ = 2.0 as bounds on a random distri-bution). Figure 3 displays our stretch history concept.Although stretch functions λ(t)1, λ(t)2, and λ(t)3 give thesame stretch and stretch rate at tN, the histories are differ-ent.
Figures 4 and 5 show the stretch history obtained by usingth = 10, 400, 1000, and 2000. Note that the stretch historyobtained by th = 1000 and th = 2000 approaches the aver-age of λ = 1.5. Thus, finding a reasonable th is importantfor stretch history to characterize the inelasticity due to
FUD
FW=
H tt dtt N th
t N
tht h( )
( ),= −∫
>l
0 Illustration of various stretch histories with the same stretch and stretch rate at time tNFigure 3Illustration of various stretch histories with the same stretch and stretch rate at time tN. Although the stretch ratio func-tions λ(t)1, λ(t)2 and λ(t)3 give the same stretch and stretch rate at time tN, the average stretch ratios for the time dura-tion th for each are distinctly different.
Power spectra for stretch (left) and stretch rate (right)Figure 2Power spectra for stretch (left) and stretch rate (right). Although not uniform and flat, there is broad spectral distribution with noise dominating any systematic trends.
Page 4 of 11(page number not for citation purposes)
BioMedical Engineering OnLine 2008, 7:4 http://www.biomedical-engineering-online.com/content/7/1/4
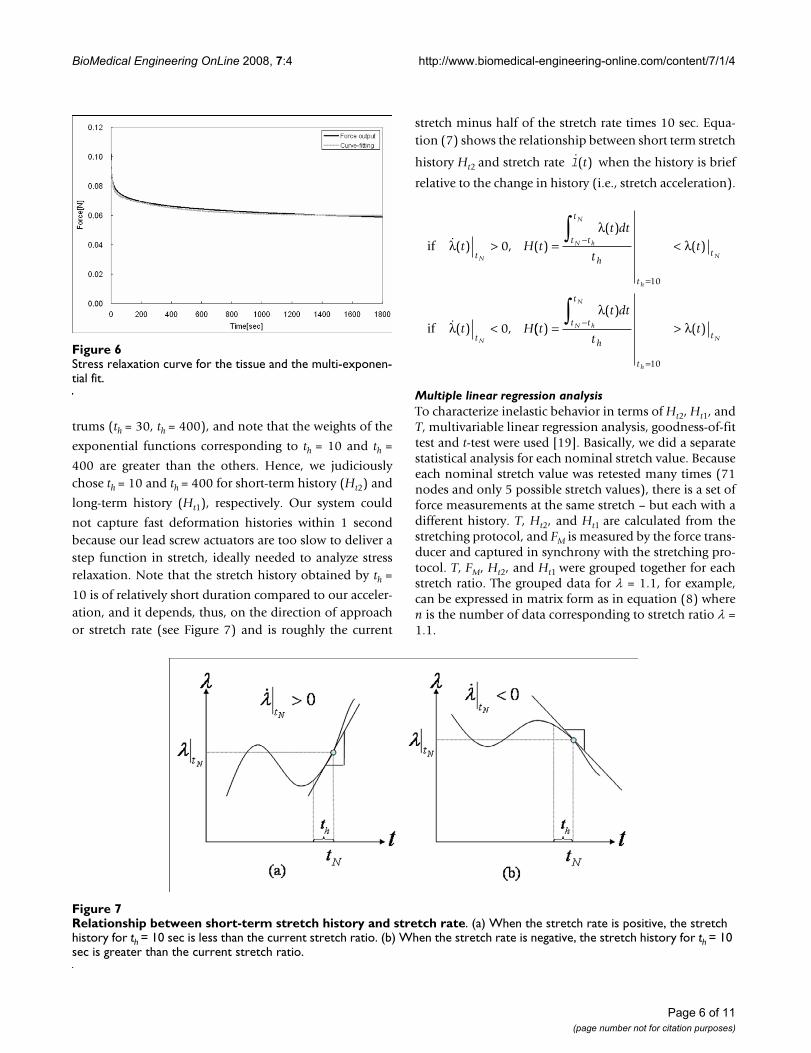
history. Upon analyzing the relaxation spectrum for asample held at a particular stretch (λ = 2, max stretch in arandom distribution), it is evident that there is short term(fast) relaxation and longer term (slow) relaxation. We fitexponential decays to the stress relaxation curve, and itwas fit well by the summation of four exponential func-tions. The stress relaxation curve is shown in Figure 6, and
F(t) is the force to maintain a step increase in stretch andfit by the multi-exponential decay as follows:
F(t) = 6.1 + 1.5e-t/400 + 0.5e-t/30 + 1.3e-t/10 + 0.5e-t
We consider the two fastest as fast relaxation spectrums (th= 1, th = 10) and the two slowest as slow relaxation spec-
Continuation of Figure 4Figure 5Continuation of Figure 4.
Stretch history obtained by th = 10, th = 400, th = 1000, and th = 2000 (for 0–3000 sec)Figure 4Stretch history obtained by th = 10, th = 400, th = 1000, and th = 2000 (for 0–3000 sec). When th is small, the stretch history is nearly the same as the instantaneous stretch, and as th increases, stretch history reaches a plateau of λ = 1.5, the average stretch ratio of a random distribution in the range [1,2].
Page 5 of 11(page number not for citation purposes)
BioMedical Engineering OnLine 2008, 7:4 http://www.biomedical-engineering-online.com/content/7/1/4
trums (th = 30, th = 400), and note that the weights of the
exponential functions corresponding to th = 10 and th =
400 are greater than the others. Hence, we judiciouslychose th = 10 and th = 400 for short-term history (Ht2) and
long-term history (Ht1), respectively. Our system could
not capture fast deformation histories within 1 secondbecause our lead screw actuators are too slow to deliver astep function in stretch, ideally needed to analyze stressrelaxation. Note that the stretch history obtained by th =
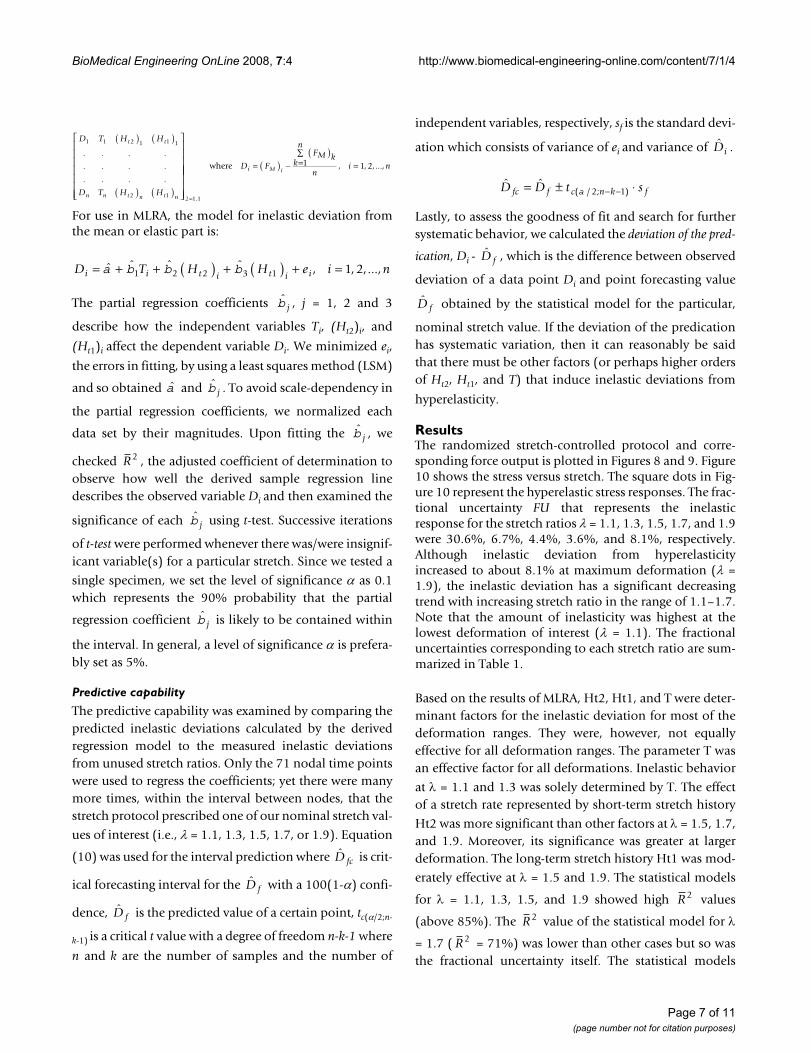
10 is of relatively short duration compared to our acceler-ation, and it depends, thus, on the direction of approachor stretch rate (see Figure 7) and is roughly the current
stretch minus half of the stretch rate times 10 sec. Equa-tion (7) shows the relationship between short term stretch
history Ht2 and stretch rate when the history is brief
relative to the change in history (i.e., stretch acceleration).
Multiple linear regression analysisTo characterize inelastic behavior in terms of Ht2, Ht1, andT, multivariable linear regression analysis, goodness-of-fittest and t-test were used [19]. Basically, we did a separatestatistical analysis for each nominal stretch value. Becauseeach nominal stretch value was retested many times (71nodes and only 5 possible stretch values), there is a set offorce measurements at the same stretch – but each with adifferent history. T, Ht2, and Ht1 are calculated from thestretching protocol, and FM is measured by the force trans-ducer and captured in synchrony with the stretching pro-tocol. T, FM, Ht2, and Ht1 were grouped together for eachstretch ratio. The grouped data for λ = 1.1, for example,can be expressed in matrix form as in equation (8) wheren is the number of data corresponding to stretch ratio λ =1.1.
l( )t
if
if
λλ
λ
λ
( ) , ( )( )
( )
( ) ,
t H tt dt
tt
t H
t
t t
t
h
t
t
t
N
N h
N
h
N
N
> = <
<
−
=
∫0
0
10
(( )( )
( )tt dt
ttt t
t
h
t
tN h
N
h
N= >−
=
∫ λλ
10
Relationship between short-term stretch history and stretch rateFigure 7Relationship between short-term stretch history and stretch rate. (a) When the stretch rate is positive, the stretch history for th = 10 sec is less than the current stretch ratio. (b) When the stretch rate is negative, the stretch history for th = 10 sec is greater than the current stretch ratio.
Stress relaxation curve for the tissue and the multi-exponen-tial fitFigure 6Stress relaxation curve for the tissue and the multi-exponen-tial fit.
Page 6 of 11(page number not for citation purposes)
BioMedical Engineering OnLine 2008, 7:4 http://www.biomedical-engineering-online.com/content/7/1/4
For use in MLRA, the model for inelastic deviation fromthe mean or elastic part is:
The partial regression coefficients , j = 1, 2 and 3
describe how the independent variables Ti, (Ht2)i, and
(Ht1)i affect the dependent variable Di. We minimized ei,
the errors in fitting, by using a least squares method (LSM)
and so obtained and . To avoid scale-dependency in
the partial regression coefficients, we normalized each
data set by their magnitudes. Upon fitting the , we
checked , the adjusted coefficient of determination toobserve how well the derived sample regression linedescribes the observed variable Di and then examined the
significance of each using t-test. Successive iterations
of t-test were performed whenever there was/were insignif-icant variable(s) for a particular stretch. Since we tested a
single specimen, we set the level of significance α as 0.1which represents the 90% probability that the partial
regression coefficient is likely to be contained within
the interval. In general, a level of significance α is prefera-bly set as 5%.
Predictive capability
The predictive capability was examined by comparing thepredicted inelastic deviations calculated by the derivedregression model to the measured inelastic deviationsfrom unused stretch ratios. Only the 71 nodal time pointswere used to regress the coefficients; yet there were manymore times, within the interval between nodes, that thestretch protocol prescribed one of our nominal stretch val-
ues of interest (i.e., λ = 1.1, 1.3, 1.5, 1.7, or 1.9). Equation
(10) was used for the interval prediction where is crit-
ical forecasting interval for the with a 100(1-α) confi-
dence, is the predicted value of a certain point, tc(α/2;n-
k-1) is a critical t value with a degree of freedom n-k-1 where
n and k are the number of samples and the number of
independent variables, respectively, sf is the standard devi-
ation which consists of variance of ei and variance of .
Lastly, to assess the goodness of fit and search for furthersystematic behavior, we calculated the deviation of the pred-
ication, Di - , which is the difference between observed
deviation of a data point Di and point forecasting value
obtained by the statistical model for the particular,
nominal stretch value. If the deviation of the predicationhas systematic variation, then it can reasonably be saidthat there must be other factors (or perhaps higher ordersof Ht2, Ht1, and T) that induce inelastic deviations from
hyperelasticity.
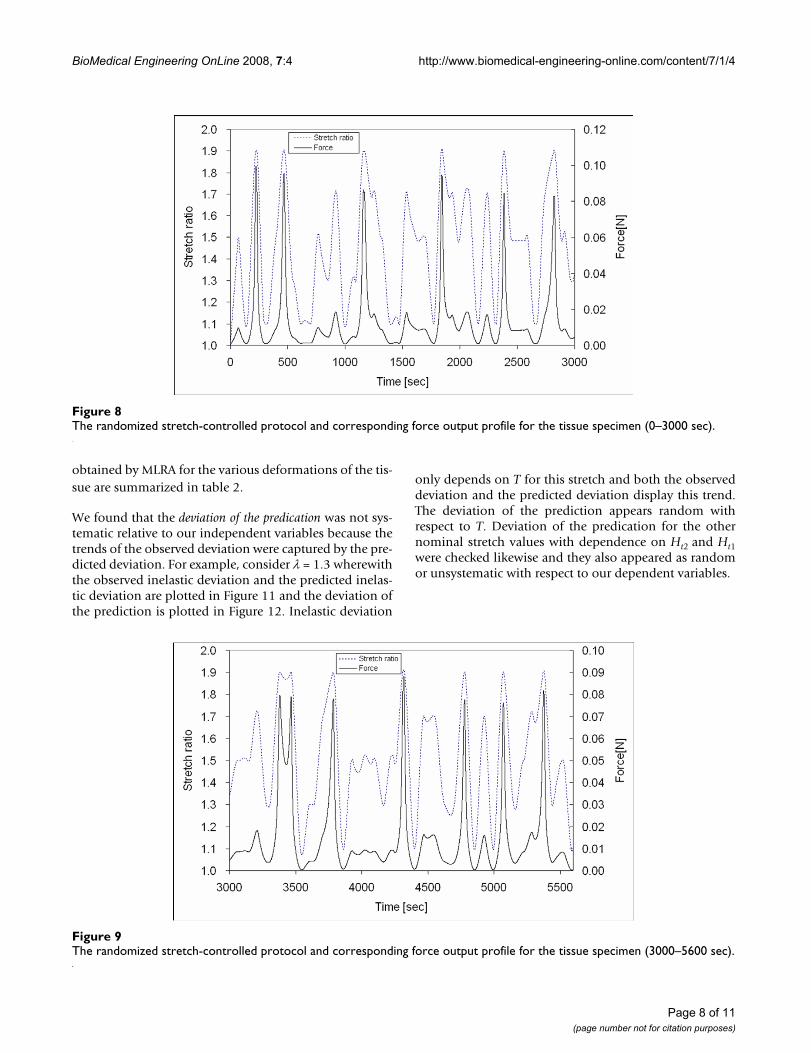
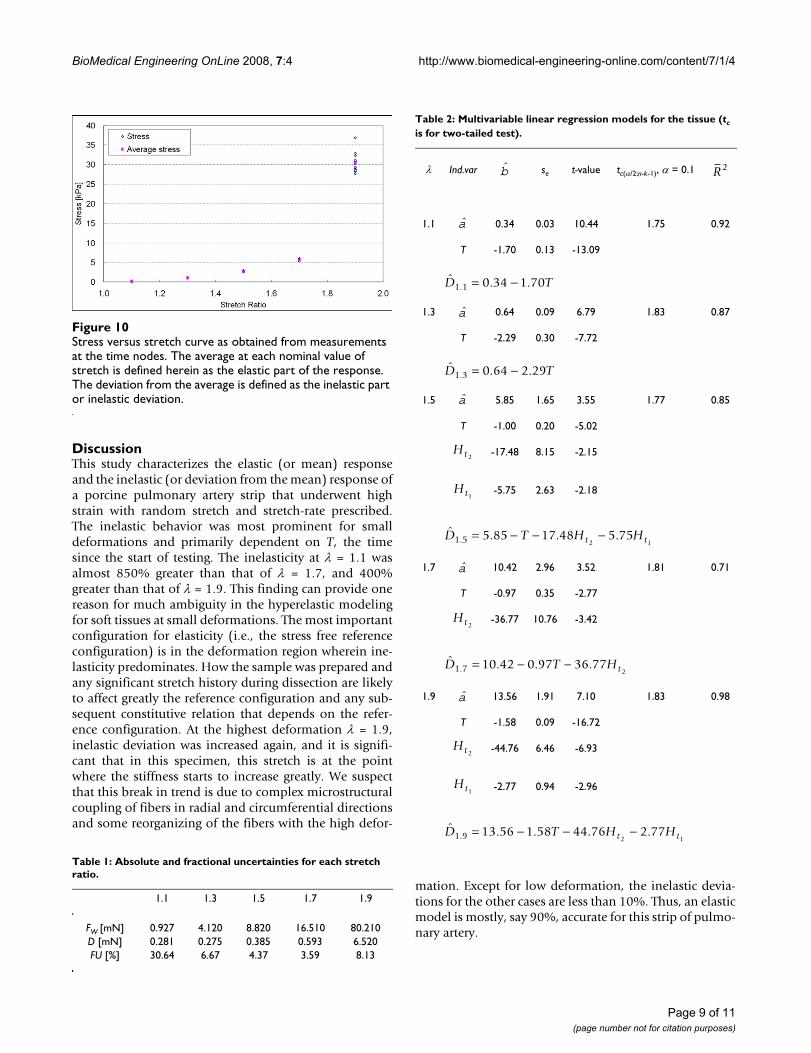
ResultsThe randomized stretch-controlled protocol and corre-sponding force output is plotted in Figures 8 and 9. Figure10 shows the stress versus stretch. The square dots in Fig-ure 10 represent the hyperelastic stress responses. The frac-tional uncertainty FU that represents the inelasticresponse for the stretch ratios λ = 1.1, 1.3, 1.5, 1.7, and 1.9were 30.6%, 6.7%, 4.4%, 3.6%, and 8.1%, respectively.Although inelastic deviation from hyperelasticityincreased to about 8.1% at maximum deformation (λ =1.9), the inelastic deviation has a significant decreasingtrend with increasing stretch ratio in the range of 1.1–1.7.Note that the amount of inelasticity was highest at thelowest deformation of interest (λ = 1.1). The fractionaluncertainties corresponding to each stretch ratio are sum-marized in Table 1.
Based on the results of MLRA, Ht2, Ht1, and T were deter-minant factors for the inelastic deviation for most of thedeformation ranges. They were, however, not equallyeffective for all deformation ranges. The parameter T wasan effective factor for all deformations. Inelastic behavior
at λ = 1.1 and 1.3 was solely determined by T. The effectof a stretch rate represented by short-term stretch history
Ht2 was more significant than other factors at λ = 1.5, 1.7,and 1.9. Moreover, its significance was greater at largerdeformation. The long-term stretch history Ht1 was mod-
erately effective at λ = 1.5 and 1.9. The statistical models
for λ = 1.1, 1.3, 1.5, and 1.9 showed high values
(above 85%). The value of the statistical model for λ
= 1.7 ( = 71%) was lower than other cases but so wasthe fractional uncertainty itself. The statistical models
D T H H
D T H H
t t
n n t n t n
1 1 2 1 1 1
2 1
( ) ( )
( ) ( )
⎡
⎣
⎢⎢⎢⎢⎢⎢⎢
⎤
⎦
⎥⎥⎥
. . . .
. . . .
. . . .⎥⎥⎥⎥⎥
= ( ) −( )
=∑
=
=l 1 1
1 1 2
.
, , , ...,where D F
FM kk
n
ni ni M i
D T H H e i ni i t i t i i= + + ( ) + ( ) + =ˆ ˆ ˆ ˆ , , , ...,a b b b1 2 2 3 1 1 2
b j
a b j
b j
R2
b j
b j
D fc
D f
D f
Di
ˆ ˆ( / ; )D D t sfc f c n k f= ± ⋅− −a 2 1
D f
D f
R2
R2
R2
Page 7 of 11(page number not for citation purposes)
BioMedical Engineering OnLine 2008, 7:4 http://www.biomedical-engineering-online.com/content/7/1/4
obtained by MLRA for the various deformations of the tis-sue are summarized in table 2.
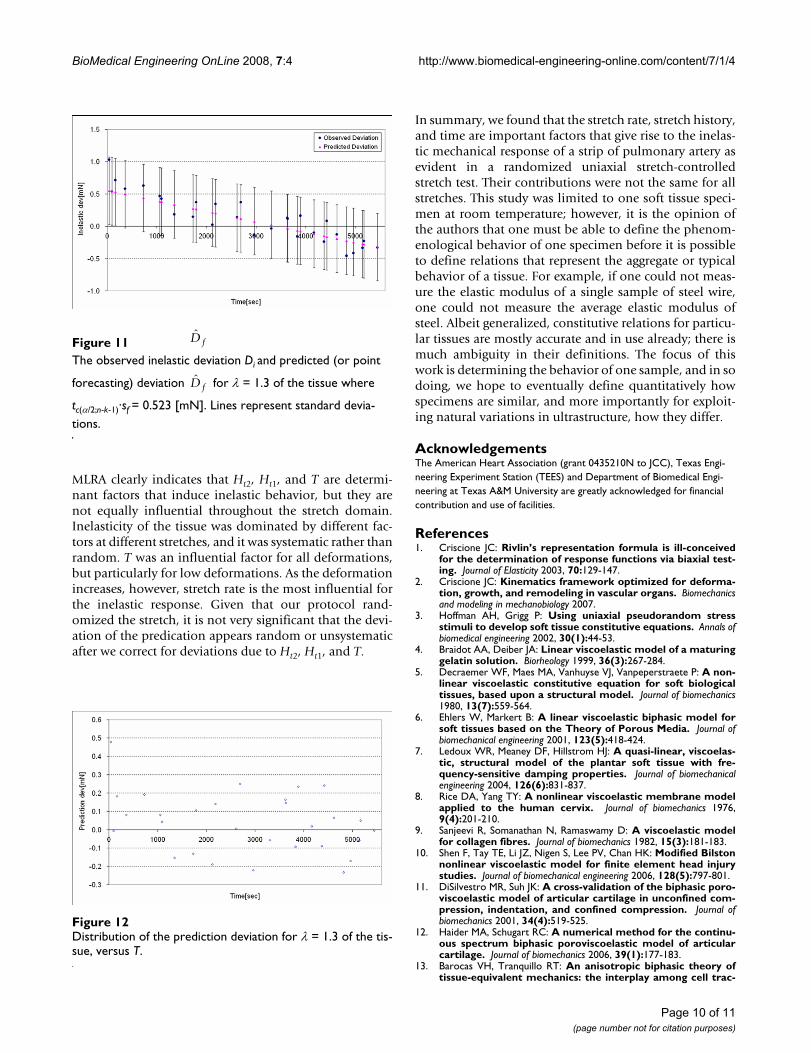
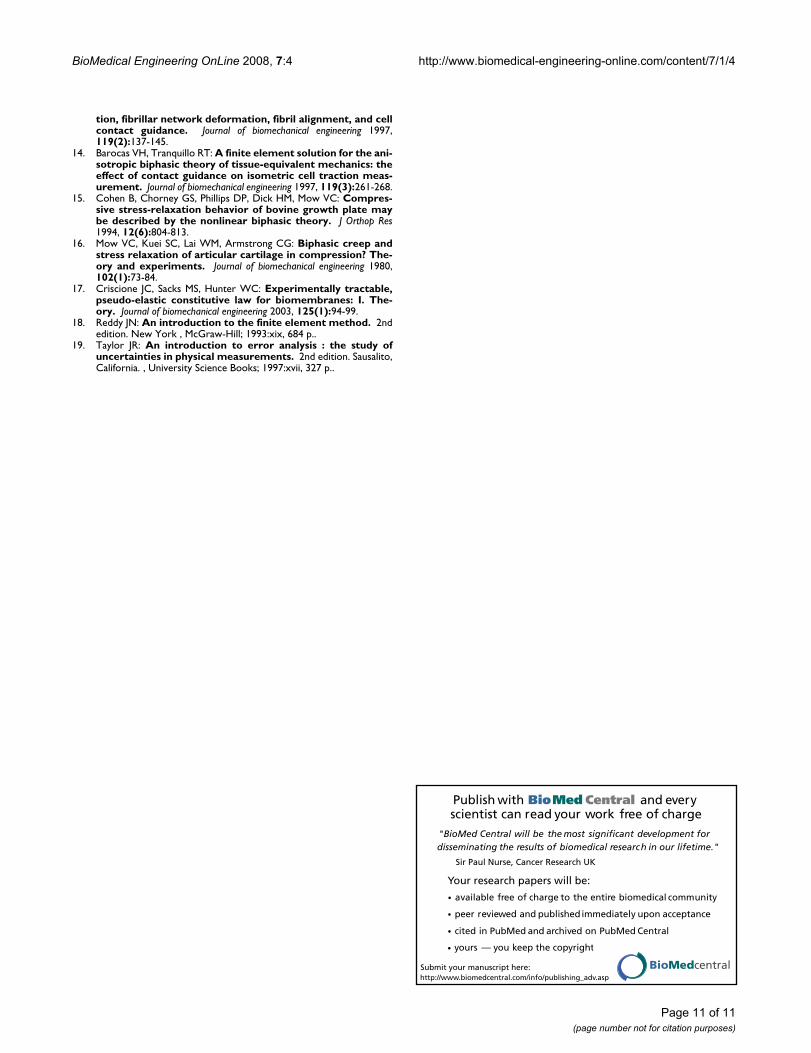
We found that the deviation of the predication was not sys-tematic relative to our independent variables because thetrends of the observed deviation were captured by the pre-dicted deviation. For example, consider λ = 1.3 wherewiththe observed inelastic deviation and the predicted inelas-tic deviation are plotted in Figure 11 and the deviation ofthe prediction is plotted in Figure 12. Inelastic deviation
only depends on T for this stretch and both the observeddeviation and the predicted deviation display this trend.The deviation of the prediction appears random withrespect to T. Deviation of the predication for the othernominal stretch values with dependence on Ht2 and Ht1were checked likewise and they also appeared as randomor unsystematic with respect to our dependent variables.
The randomized stretch-controlled protocol and corresponding force output profile for the tissue specimen (3000–5600 sec)Figure 9The randomized stretch-controlled protocol and corresponding force output profile for the tissue specimen (3000–5600 sec).
The randomized stretch-controlled protocol and corresponding force output profile for the tissue specimen (0–3000 sec)Figure 8The randomized stretch-controlled protocol and corresponding force output profile for the tissue specimen (0–3000 sec).
Page 8 of 11(page number not for citation purposes)
BioMedical Engineering OnLine 2008, 7:4 http://www.biomedical-engineering-online.com/content/7/1/4
DiscussionThis study characterizes the elastic (or mean) responseand the inelastic (or deviation from the mean) response ofa porcine pulmonary artery strip that underwent highstrain with random stretch and stretch-rate prescribed.The inelastic behavior was most prominent for smalldeformations and primarily dependent on T, the timesince the start of testing. The inelasticity at λ = 1.1 wasalmost 850% greater than that of λ = 1.7, and 400%greater than that of λ = 1.9. This finding can provide onereason for much ambiguity in the hyperelastic modelingfor soft tissues at small deformations. The most importantconfiguration for elasticity (i.e., the stress free referenceconfiguration) is in the deformation region wherein ine-lasticity predominates. How the sample was prepared andany significant stretch history during dissection are likelyto affect greatly the reference configuration and any sub-sequent constitutive relation that depends on the refer-ence configuration. At the highest deformation λ = 1.9,inelastic deviation was increased again, and it is signifi-cant that in this specimen, this stretch is at the pointwhere the stiffness starts to increase greatly. We suspectthat this break in trend is due to complex microstructuralcoupling of fibers in radial and circumferential directionsand some reorganizing of the fibers with the high defor-
mation. Except for low deformation, the inelastic devia-tions for the other cases are less than 10%. Thus, an elasticmodel is mostly, say 90%, accurate for this strip of pulmo-nary artery.
Table 2: Multivariable linear regression models for the tissue (tc
is for two-tailed test).
λ Ind.var se t-value tc(α/2;n-k-1), α = 0.1
1.1 0.34 0.03 10.44 1.75 0.92
T -1.70 0.13 -13.09
1.3 0.64 0.09 6.79 1.83 0.87
T -2.29 0.30 -7.72
1.5 5.85 1.65 3.55 1.77 0.85
T -1.00 0.20 -5.02
-17.48 8.15 -2.15
-5.75 2.63 -2.18
1.7 10.42 2.96 3.52 1.81 0.71
T -0.97 0.35 -2.77
-36.77 10.76 -3.42
1.9 13.56 1.91 7.10 1.83 0.98
T -1.58 0.09 -16.72
-44.76 6.46 -6.93
-2.77 0.94 -2.96
b R2
a
ˆ . ..D T1 1 0 34 1 70= −
a
ˆ . ..D T1 3 0 64 2 29= −
a
Ht2
Ht1
ˆ . . ..D T H Ht t1 5 5 85 17 48 5 752 1
= − − −
a
Ht2
ˆ . . ..D T Ht1 7 10 42 0 97 36 772
= − −
a
Ht2
Ht1
ˆ . . . ..D T H Ht t1 9 13 56 1 58 44 76 2 772 1
= − − −
Table 1: Absolute and fractional uncertainties for each stretch ratio.
1.1 1.3 1.5 1.7 1.9
FW [mN] 0.927 4.120 8.820 16.510 80.210D [mN] 0.281 0.275 0.385 0.593 6.520FU [%] 30.64 6.67 4.37 3.59 8.13
Stress versus stretch curve as obtained from measurements at the time nodesFigure 10Stress versus stretch curve as obtained from measurements at the time nodes. The average at each nominal value of stretch is defined herein as the elastic part of the response. The deviation from the average is defined as the inelastic part or inelastic deviation.
Page 9 of 11(page number not for citation purposes)
BioMedical Engineering OnLine 2008, 7:4 http://www.biomedical-engineering-online.com/content/7/1/4
MLRA clearly indicates that Ht2, Ht1, and T are determi-nant factors that induce inelastic behavior, but they arenot equally influential throughout the stretch domain.Inelasticity of the tissue was dominated by different fac-tors at different stretches, and it was systematic rather thanrandom. T was an influential factor for all deformations,but particularly for low deformations. As the deformationincreases, however, stretch rate is the most influential forthe inelastic response. Given that our protocol rand-omized the stretch, it is not very significant that the devi-ation of the predication appears random or unsystematicafter we correct for deviations due to Ht2, Ht1, and T.
In summary, we found that the stretch rate, stretch history,and time are important factors that give rise to the inelas-tic mechanical response of a strip of pulmonary artery asevident in a randomized uniaxial stretch-controlledstretch test. Their contributions were not the same for allstretches. This study was limited to one soft tissue speci-men at room temperature; however, it is the opinion ofthe authors that one must be able to define the phenom-enological behavior of one specimen before it is possibleto define relations that represent the aggregate or typicalbehavior of a tissue. For example, if one could not meas-ure the elastic modulus of a single sample of steel wire,one could not measure the average elastic modulus ofsteel. Albeit generalized, constitutive relations for particu-lar tissues are mostly accurate and in use already; there ismuch ambiguity in their definitions. The focus of thiswork is determining the behavior of one sample, and in sodoing, we hope to eventually define quantitatively howspecimens are similar, and more importantly for exploit-ing natural variations in ultrastructure, how they differ.
AcknowledgementsThe American Heart Association (grant 0435210N to JCC), Texas Engi-neering Experiment Station (TEES) and Department of Biomedical Engi-neering at Texas A&M University are greatly acknowledged for financial contribution and use of facilities.
References1. Criscione JC: Rivlin’s representation formula is ill-conceived
for the determination of response functions via biaxial test-ing. Journal of Elasticity 2003, 70:129-147.
2. Criscione JC: Kinematics framework optimized for deforma-tion, growth, and remodeling in vascular organs. Biomechanicsand modeling in mechanobiology 2007.
3. Hoffman AH, Grigg P: Using uniaxial pseudorandom stressstimuli to develop soft tissue constitutive equations. Annals ofbiomedical engineering 2002, 30(1):44-53.
4. Braidot AA, Deiber JA: Linear viscoelastic model of a maturinggelatin solution. Biorheology 1999, 36(3):267-284.
5. Decraemer WF, Maes MA, Vanhuyse VJ, Vanpeperstraete P: A non-linear viscoelastic constitutive equation for soft biologicaltissues, based upon a structural model. Journal of biomechanics1980, 13(7):559-564.
6. Ehlers W, Markert B: A linear viscoelastic biphasic model forsoft tissues based on the Theory of Porous Media. Journal ofbiomechanical engineering 2001, 123(5):418-424.
7. Ledoux WR, Meaney DF, Hillstrom HJ: A quasi-linear, viscoelas-tic, structural model of the plantar soft tissue with fre-quency-sensitive damping properties. Journal of biomechanicalengineering 2004, 126(6):831-837.
8. Rice DA, Yang TY: A nonlinear viscoelastic membrane modelapplied to the human cervix. Journal of biomechanics 1976,9(4):201-210.
9. Sanjeevi R, Somanathan N, Ramaswamy D: A viscoelastic modelfor collagen fibres. Journal of biomechanics 1982, 15(3):181-183.
10. Shen F, Tay TE, Li JZ, Nigen S, Lee PV, Chan HK: Modified Bilstonnonlinear viscoelastic model for finite element head injurystudies. Journal of biomechanical engineering 2006, 128(5):797-801.
11. DiSilvestro MR, Suh JK: A cross-validation of the biphasic poro-viscoelastic model of articular cartilage in unconfined com-pression, indentation, and confined compression. Journal ofbiomechanics 2001, 34(4):519-525.
12. Haider MA, Schugart RC: A numerical method for the continu-ous spectrum biphasic poroviscoelastic model of articularcartilage. Journal of biomechanics 2006, 39(1):177-183.
13. Barocas VH, Tranquillo RT: An anisotropic biphasic theory oftissue-equivalent mechanics: the interplay among cell trac-
Distribution of the prediction deviation for λ = 1.3 of the tis-sue, versus TFigure 12Distribution of the prediction deviation for λ = 1.3 of the tis-sue, versus T.
The observed inelastic deviation Di and predicted (or point forecasting) deviation for λ = 1Figure 11The observed inelastic deviation Di and predicted (or point
forecasting) deviation for λ = 1.3 of the tissue where
tc(α/2;n-k-1)·sf = 0.523 [mN]. Lines represent standard devia-tions.
D f
D f
Page 10 of 11(page number not for citation purposes)
BioMedical Engineering OnLine 2008, 7:4 http://www.biomedical-engineering-online.com/content/7/1/4
Publish with BioMed Central and every scientist can read your work free of charge
"BioMed Central will be the most significant development for disseminating the results of biomedical research in our lifetime."
Sir Paul Nurse, Cancer Research UK
Your research papers will be:
available free of charge to the entire biomedical community
peer reviewed and published immediately upon acceptance
cited in PubMed and archived on PubMed Central
yours — you keep the copyright
Submit your manuscript here:http://www.biomedcentral.com/info/publishing_adv.asp
BioMedcentral
tion, fibrillar network deformation, fibril alignment, and cellcontact guidance. Journal of biomechanical engineering 1997,119(2):137-145.
14. Barocas VH, Tranquillo RT: A finite element solution for the ani-sotropic biphasic theory of tissue-equivalent mechanics: theeffect of contact guidance on isometric cell traction meas-urement. Journal of biomechanical engineering 1997, 119(3):261-268.
15. Cohen B, Chorney GS, Phillips DP, Dick HM, Mow VC: Compres-sive stress-relaxation behavior of bovine growth plate maybe described by the nonlinear biphasic theory. J Orthop Res1994, 12(6):804-813.
16. Mow VC, Kuei SC, Lai WM, Armstrong CG: Biphasic creep andstress relaxation of articular cartilage in compression? The-ory and experiments. Journal of biomechanical engineering 1980,102(1):73-84.
17. Criscione JC, Sacks MS, Hunter WC: Experimentally tractable,pseudo-elastic constitutive law for biomembranes: I. The-ory. Journal of biomechanical engineering 2003, 125(1):94-99.
18. Reddy JN: An introduction to the finite element method. 2ndedition. New York , McGraw-Hill; 1993:xix, 684 p..
19. Taylor JR: An introduction to error analysis : the study ofuncertainties in physical measurements. 2nd edition. Sausalito,California. , University Science Books; 1997:xvii, 327 p..
Page 11 of 11(page number not for citation purposes)