biometrics results l e - wellworks for you · biometric screening executive report biometric...
TRANSCRIPT

Biometrics Results Aggregate Report March 21, 2012
Company: Sample Company Event: Health Fair Event February 1, 2012
S A M P L
E

Biometric Screening Executive Report
Biometric Screenings were administered to the eligible participants from WellDemo. The executive report provides an analysis of
key aspects of the health status of WellDemo participants.
The report provides an aggregate assessment for WellDemo of the following screenings in order of highest risk:
• Body Fat (93.8%)
• Blood Pressure (54.6%)
• BMI (49.5%)
• Glucose (28.9%)
• Cholesterol (14.4%)
How to Use this Information
• This report is intended to give an overview of health risk with a more in depth look at some ways these risks affect the health of
participants. It is not a full analysis of the causes of health risk.
• Biometric Screenings provide an overall view of potential health risk but are NOT intended to serve as a substitution for
laboratory tests that may be used to assist with the diagnosis of certain diseases and/or medical conditions. The report
highlights the areas of greatest risk based on prevalence. There may be areas of risk that have a low prevalence, but are of
concern for WellDemo. For example, there may be a low prevalence of participants whose results indicate high risk for
Diabetes based on glucose levels, but this may still be an area that can be targeted for improvement.
• The screening results can help WellDemo determine how to make adjustments to its health benefit plan, or establish which
screenings or other wellness programs to offer in the future.
Notes About this Report
The following information should be noted about the data in this report:
• All national normative data presented is based on national data from the Center for Disease Control (CDC) .
• Information regarding recommended screenings is based on standard government recommendations.
• All tests of statistical significance are assessed at the p < .05 level. A statistically significant test means that there is a
relationship or difference between two numbers that is not based on chance but some other factor.
Assessed Population
The data in this report is based upon 97 individuals who have participated in Biometric Screenings between 2/7/2007 and
5/14/2007.
To get an accurate assessment of WellDemo's population of 125, at least 94 (75.60%) people should be screened. At this point
WellDemo has met this minimum.
S A M P L
E

It is important that those individuals who participated in the screenings are reflective of the overall population for WellDemo. The
assessed population for this report has the following demographic characteristics:
0
4
8
12
16
20
24
28
20-2
9
30-3
9
40-4
9
50-5
960
+
6 7 3 4 15 8 25 23 15
F
M
Demographic Breakdown
For each section, opportunities for improvement are presented.
Summary of Screening Results
For each specific biometric screening conducted, participants received a score of “Ideal,” “Borderline,” or “High-Risk.” A score of
“Ideal” indicates that the participants have minimal or no risk in the given area. A score of “Borderline” indicates a moderate risk in
the given area. Finally, a score of “High-Risk” indicates that there is either a high potential risk or a current risk in the given area.
The following is a break down of health risk in the specific screenings conducted:
0
20
40
60
80
100
BloodPressure
BMI Body Fat Cholesterol Glucose
28 33 28 3053 48 91 14 2814 13 55 39
Borderline
High Risk
Ideal
Distribution of Screening Results
S A M P L
E

Body Mass Index and Weight
Weight was the 3rd riskiest screening result for the participants from WellDemo. Currently, there is significant attention paid to
the rising weight of the US population and the health risks it presents. Being overweight increases risk for health conditions
including heart disease, diabetes, and chronic musculoskeletal dysfunction which can result in increased absenteeism, increased chance
of onsite injuries, and reduced productivity.
Body Mass Index (BMI) is a reliable indicator of total body fat based on height and weight. Ideal BMI varies by age, but is
generally accepted as between 18.5 and 24.9. “Overweight” is considered between 25.0 and 29.9, with “Obese” being a BMI above
30. Having a BMI under 18.5 is considered “Underweight”.
How Can We Measure BMI?
BMI can be manually calculated by multiplying weight in pounds by 704, then dividing by the square of height in inches.
Alternatively, you can refer to the following chart:
S A M P L
E

The following chart represents the BMI distribution for WellDemo's participants compared to national averages.
0
10
20
30
40
50
U
nderw
eigh
t
Nor
mal
Weig
ht
Ove
rwei
ght
Obe
se
2 41 35 221 14 35 50
National Average
Your Company%
BMI vs National Norms
This data shows that:
• For the category "Underweight", WellDemo is not significantly different than the national average.
• For the category "Normal Weight", WellDemo has a significantly lower rate than the national average.
• For the category "Overweight", WellDemo is not significantly different than the national average.
• For the category "Obese", WellDemo has a significantly higher rate than the national average.
Body Fat
Body fat was the 1st riskiest screening result for the participants from WellDemo. Bodies consist of fat mass and fat free (bones,
blood, muscle, water etc.) mass. Body fat is a necessary component of the human body and comes in the form of "essential" and
"storage" fats. Essential fat is found mostly in body organs like the heart, liver, and kidneys. Storage fat surrounds body organs and
is found under the skin, and is measured in a percentage. Body fat is necessary for normal hormone activity and utilization of
nutrients. It also provides fuel, protection, and insulation.
How Much Body Fat is Too Much?
Too little body fat can lead to problems with fertility, depression, nutrition, hunger and temperature regulation, effecting
absenteeism, productivity, and worksite injury rates.
Too much body fat places added stress on cardiac, skeletal, and muscular systems. It also increases the risk of developing conditions
such as high blood pressure, diabetes, heart disease, stroke, gall bladder disease and cancer. Clinical studies have shown a relationship
between excess body fat and the incidence of cancer. In women, excess body fat has been linked to a higher rate of breast and
uterine cancers. Men with high amounts of body fat have a higher rate of colon and prostate cancers. Most conditions effected by
body fat levels can substantially add to medical costs.
S A M P L
E
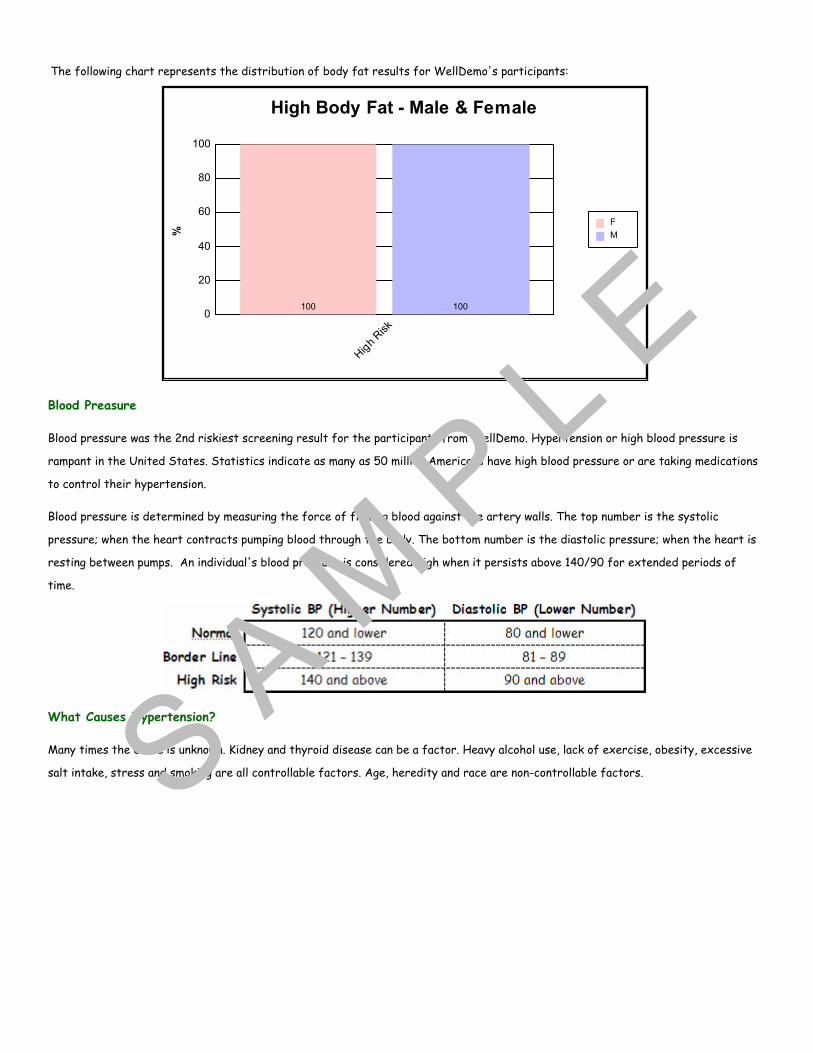
The following chart represents the distribution of body fat results for WellDemo's participants:
0
20
40
60
80
100
Hig
h Risk
100 100
F
M%
High Body Fat - Male & Female
Blood Preasure
Blood pressure was the 2nd riskiest screening result for the participants from WellDemo. Hypertension or high blood pressure is
rampant in the United States. Statistics indicate as many as 50 million Americans have high blood pressure or are taking medications
to control their hypertension.
Blood pressure is determined by measuring the force of flowing blood against the artery walls. The top number is the systolic
pressure; when the heart contracts pumping blood through the body. The bottom number is the diastolic pressure; when the heart is
resting between pumps. An individual's blood pressure is considered high when it persists above 140/90 for extended periods of
time.
What Causes Hypertension?
Many times the cause is unknown. Kidney and thyroid disease can be a factor. Heavy alcohol use, lack of exercise, obesity, excessive
salt intake, stress and smoking are all controllable factors. Age, heredity and race are non-controllable factors.S A M P L
E

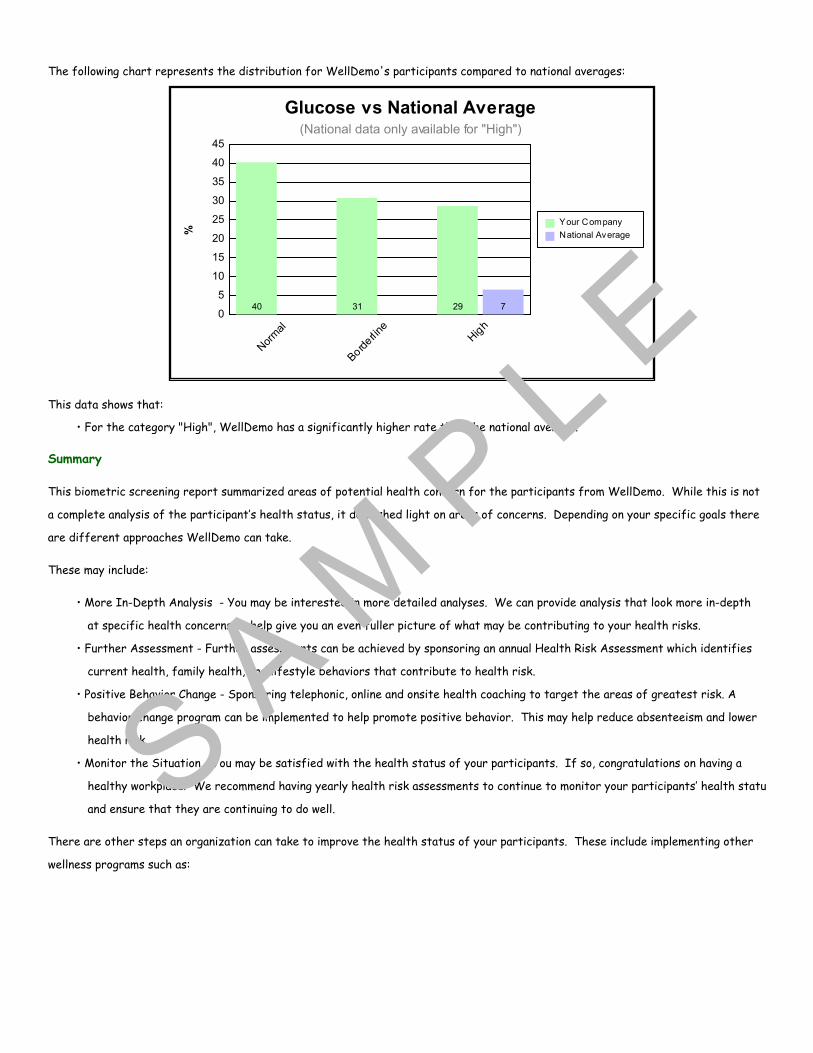
The following chart represents the distribution for WellDemo's participants compared to national averages:
0
10
20
30
40
50
60
Id
eal
Bord
erl ine
Hig
h Risk
15 29 56 25
Your Company
National Average%
Hypertension vs National Average(National data only available for "High Risk")
This data shows that:
• For the category "High Risk", WellDemo has a significantly higher rate than the national average.
Cholesterol
Cholesterol was the 5th riskiest screening result for the participants from WellDemo. Cholesterol is a fat-like substance found in all
body cells. Excess cholesterol is deposited in arteries, causing them to narrow and decreases blood flow to areas such as the heart.
Low-density lipoprotein, or LDL, is the "bad cholesterol". Too much LDL cholesterol can clog the arteries and increase the risk of
heart attack. High-density lipoprotein, or HDL, is the "good cholesterol". The body makes HDL cholesterol for its protection.
Recommended Levels of Total Cholesterol:
• Desirable = less than 200 mg/dL
• Borderline = 200- 240 mg/dL
• High = 240 mg/dL and above
Low Density Lipoproteins (LDL) carry most of the cholesterol in the blood and are the main source of damaging buildup and blockage
in the arteries. The more LDL cholesterol, the greater the risk of heart disease. In July 2004 the American Heart Association issued
new recommendations to high-risk patients (those with personal history of heart disease). These recommendations state that for
these patients, LDL should be as low as 70 mg/dL. For all others, the LDL guidelines are as follows:
• Desirable = less than 100 mg/dL
• Borderline = 100 - 129 mg/dL
• High = 130 and above
High Density Lipoproteins (HDL) carry excess cholesterol in the blood to the liver for removal from the body. HDL helps prevent
cholesterol from building up in the artery walls. For HDL, a higher level is desirable.
• Low = 40mg/dL
• Average = 40- 59 mg/dL
• Excellent = 60 mg/dL and above
S A M P L
E

The following chart represents the distribution for WellDemo's participants compared to national averages.
0
10
20
30
40
50
60
Nor
mal
Bord
erl ine
Hig
h
57 29 14 25
Your Company
National Average%
High Cholesteral vs National Average(National data only available for "High")
This data shows that:
• For the category "High", WellDemo has a significantly lower rate than the national average.
Glucose & Diabetes
Glucose was the 4th riskiest screening result for the participants from WellDemo. Glucose is a carbohydrate that is formed during
digestion to aid in body metabolism. Glucose travels through the blood and is the main energy source for the body’s cells. Blood
glucose levels are maintained within a very narrow range and are regulated by the pancreatic hormone insulin. When there are
problems with the production or action of insulin, blood glucose levels fall outside the "Ideal" range. Increased levels may indicate an
increased risk for developing diabetes. Diabetes is a disease that affects the ability to utilize and store sugars that enter the
bloodstream. As blood glucose levels increase, the risk of diabetes increases.
Non-Fasting Glucose Levels:
• Ideal = Less than 100 mg/dl
• Borderline = Between 100 mg/dl and 126 mg/dl
• High Risk = 126 mg/dl and aboveS A M P L
E
The following chart represents the distribution for WellDemo's participants compared to national averages:
0
5
10
15
20
25
30
35
40
45
Nor
mal
Bord
erl ine
Hig
h
40 31 29 7
Your Company
National Average%
Glucose vs National Average(National data only available for "High")
This data shows that:
• For the category "High", WellDemo has a significantly higher rate than the national average.
Summary
This biometric screening report summarized areas of potential health concern for the participants from WellDemo. While this is not
a complete analysis of the participant’s health status, it does shed light on areas of concerns. Depending on your specific goals there
are different approaches WellDemo can take.
These may include:
• More In-Depth Analysis - You may be interested in more detailed analyses. We can provide analysis that look more in-depth
at specific health concerns to help give you an even fuller picture of what may be contributing to your health risks.
• Further Assessment - Further assessments can be achieved by sponsoring an annual Health Risk Assessment which identifies
current health, family health, and lifestyle behaviors that contribute to health risk.
• Positive Behavior Change - Sponsoring telephonic, online and onsite health coaching to target the areas of greatest risk. A
behavior change program can be implemented to help promote positive behavior. This may help reduce absenteeism and lower
health risk.
• Monitor the Situation - You may be satisfied with the health status of your participants. If so, congratulations on having a
healthy workplace! We recommend having yearly health risk assessments to continue to monitor your participants’ health status
and ensure that they are continuing to do well.
There are other steps an organization can take to improve the health status of your participants. These include implementing other
wellness programs such as:
S A M P L
E

• Onsite seminars and classes
• Healthy food vending machines
• Healthy food choices in the company cafeteria
• Eliminating fatty and fried foods from the company cafeteria
• Rewarding receipt of annual screenings consistent with annual guidelines (see chart that follows)
• Ensuring the organization sponsored health plan cover 100% for preventive care including the following screenings:
S A M P L
E