biomonitoring results international symposium organised by the flemish center of expertise for...
TRANSCRIPT

Biomonitoring resultsBiomonitoring results
International Symposium organised by the Flemish Center of Expertise for Environment and HealthDecember 15,2006
Elly Den HondEnvironmental ToxicologyVITO

RecruitmentRecruitment
Newborns and mothers Period: Sept. 2002 – Dec. 2003Period: Sept. 2002 – Dec. 2003 Cord blood – questionnairesCord blood – questionnaires Medical files of maternityMedical files of maternity
Adolescents Period: Oct. 2003 – July 2004Period: Oct. 2003 – July 2004 Blood – urine – questionnairesBlood – urine – questionnaires Medical files of school doctorsMedical files of school doctors
Elderly Period: Sept. 2004 – June 2005Period: Sept. 2004 – June 2005 Blood – urine - questionnairesBlood – urine - questionnaires
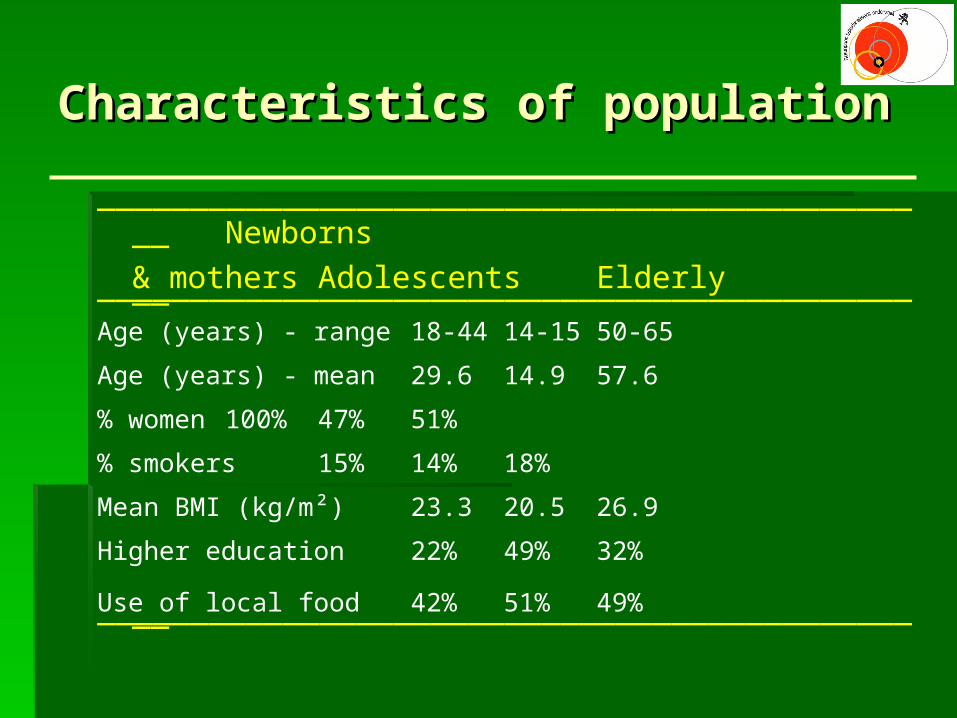
Characteristics of populationCharacteristics of population
______________________________________________Newborns
& mothers Adolescents Elderly______________________________________________Age (years) - range 18-44 14-15 50-65
Age (years) - mean 29.6 14.9 57.6
% women 100% 47% 51%
% smokers 15% 14% 18%
Mean BMI (kg/m²) 23.3 20.5 26.9
Higher education 22% 49% 32%
Use of local food 42% 51% 49%______________________________________________

Biomarkers of exposure Biomarkers of exposure

Biomarkers of exposureBiomarkers of exposure
Persistent chlorinated compounds (serum)Dioxin-like compounds (pg Calux TEQ/g fat)
Marker PCB 138.153 & 180 (ng/g fat)
p,p’-DDE (ng/g fat)
Hexachlorobenzene (ng/g fat)
Heavy metals (blood & urine) Blood lead (µg/L)
Blood cadmium (µg/L)
Urinary cadmium (µg/g creatinine)
Metabolites of PAH and benzene (urine)1-hydroxy-pyrene (ng/g creatinine)
t,t’-muconic acid (µg/g creatinine)
newborn adolesc. elderly
newborn adolesc. elderly
newborn adolesc. elderly
newborn adolesc. elderly
newborn adolesc. elderly
newborn elderly
elderly
adolesc. elderly
adolesc. elderly

Reference values – Reference values – persistent chlorinated persistent chlorinated compounds compounds
Marker PCBs
333
6468
0
100
200
300
400
500
600
Newborns Adolesc. Elderlyn
g/g
fa
t
p,p'-DDE
423
110 940
400
800
1200
1600
Newborns Adolesc. Elderly
ng
/g f
at
Hexachlorobenzene
57
1921
0
20
40
60
80
100
120
Newborns Adolesc. Elderlyn
g/g
fa
t
Bar: geometric mean Line: 90e percentile
Adjusted for sex (except newborns), age, smoking and BMI
* Dioxins + furanes + dioxin-like PCBs** Dioxins + furanes
Dioxin-like compounds
1923
0
10
20
30
40
50
60
Newborns Elderly
pg
Ca
lux
TE
Q/g
fa
t
* **

Reference values – Reference values – heavy metals heavy metals
Blood lead
40
2215
0
20
40
60
80
100
Newborns Adolesc. Elderly
µg
/L
Blood cadmium
0,420,360,21
0
0,3
0,6
0,9
1,2
1,5
Newborns Adolesc. Elderly
µg
/L
Bar: geometric mean; line: 90e percentile
Adjusted for sex (except newborns), age and smoking
Urinary cadmium
0,62
0
0,3
0,6
0,9
1,2
1,5
Elderly
µg
/g c
rea
tin
ine

Reference values – Reference values – metabolites of PAH and metabolites of PAH and benzene benzene
Urinary 1-hydroxy-pyrene
14788
0
100
200
300
400
500
600
700
Adolesc. Elderly
ng
/g c
rea
tin
ine
Bar: geometric mean; line: 90e percentile
Adjusted for sex, age and smoking.
Urinary t,t'-muconic acid
8572
0
50
100
150
200
250
300
350
Adolesc. Elderlyµ
g/g
cre
ati
nin
e

Regional comparisonRegional comparison
Dioxin-like compounds ! !PCBs ! ! ! !p,p'-DDE ! !HCB ! !Lead
B-Cadmium ! !U-Cadmium
1-OH-pyrene
t,t'-muconic acid
Dioxin-like compounds
PCBs !p,p'-DDE ! ! ! ! ! !HCB
Lead
B-Cadmium !U-Cadmium !1-OH-pyrene
t,t'-muconic acid
Harbour Non ferro industry (Olen)
Chemical industry (Albert canal)
Waste incinerators
City of Antwerp City of Ghent Fruit region Rural area
Significantly higher than reference valueSignificantly lower than reference value
! Significantly more than 10% of values above P90

Regional comparison –Regional comparison –fruit and rural areafruit and rural area
Dioxin-like compounds ! !PCBs ! ! !p,p'-DDE ! !HCB ! !Lead
B-Cadmium !U-Cadmium
1-OH-pyrene
t,t'-muconic acid
Fruit region Rural area
Significantly higher than reference valueSignificantly lower than reference value
! Significantly more than 10% of values above P90

Regional comparison –Regional comparison –non-ferro and chemical non-ferro and chemical industryindustry
Dioxin-like compounds
PCBs
p,p'-DDE ! ! ! ! !HCB
Lead
B-Cadmium !U-Cadmium !1-OH-pyrene
t,t'-muconic acid
Non ferro industry (Olen)
Chemical industry (Albert canal)
Significantly higher than reference valueSignificantly lower than reference value
! Significantly more than 10% of values above P90

DDT: a problem of the past?DDT: a problem of the past?
DDT is metabolised to DDE Ratio DDT / DDE is measure for more or less recent
exposure
0 1 2 3 4 5
City of Antwerp
City of Ghent
Fruit region
Rural area
Harbours
Non-ferro industry
Chemical industry
Waste incinerators
(DDT/p,p'-DDE)*100
n=58
n=49
n=16
n=38
n=26
n=56
n=53
n=25
ANOVA: p=0,04

Regional comparison –Regional comparison –urban areasurban areas
Significantly higher than reference valueSignificantly lower than reference value
! Significantly more than 10% of values above P90
Dioxin-like compounds
PCBs !p,p'-DDE
HCB
Lead
B-Cadmium !U-Cadmium
1-OH-pyrene
t,t'-muconic acid
City of Antwerp City of Ghent

Regional comparison –Regional comparison –waste incineratorswaste incinerators
Dioxin-like compounds
PCBs
p,p'-DDE
HCB
Lead
B-Cadmium
U-Cadmium
1-OH-pyrene
t,t'-muconic acid
Waste incinerators
Significantly higher than reference valueSignificantly lower than reference value
! Significantly more than 10% of values above P90
Dioxin-like compounds
PCBs
p,p'-DDE
HCB
Lead
B-Cadmium
U-Cadmium
1-OH-pyrene
t,t'-muconic acid
Menen Harelbeke Roeselare Wilrijk

Regional comparison –Regional comparison –harboursharbours
combination of 2 harbours: - port of Antwerp
- port of Ghent exposure differs between 2 ports exposure resembles the exposure of the neighboring city
Antw 'n H aven Antw 'n Gent H aven Gent0
50
100
150
200
250
300
350
so
m m
erke
r PC
Bs (n
g/g
ve
t)
b
73
78
76
60
63
62
0 20 40 60 80 100
verbrandingsovenGent
Gentse kanaalzone
Gentse agglomeratie
verbrandingsovenWilrijk
Antwerpshavengebied
Antwerpseagglomeratie
Merker PCB's (ng/g vet)
adolescentsnewborns

Comparison with reference Comparison with reference valuesvalues
Blood lead > 100 µg/L 0.2% 1.6%
Blood cadmium > 5 µg/L 0% n=1
Urinary cadmium > 2 µg/g crt - 2.3%
Urinary 1-OH-pyrene > 2 µg/g crt 0.2% 1.1%
Urinary t,t’-MA > 0.5 µg/g crt 3.5% 4.7%
adolescents elderly

Determinants of exposureDeterminants of exposure(stepwise multiple (stepwise multiple modelbuilding)modelbuilding)
Marker PCBtotally explained: 46,6%
0,1
0,2
0,4
0,4
0,4
0,4
0,6
2,7
2,9
6,2
13,3
19,1
0 5 10 15 20 25
dairy consumption
smoking
eel consumption
school type
milk consumption
mothers' smoking pregnancy
mothers' age at delivery
local meat consumption
area
breast feeding at birth
sex
BMI
% explainedadolescents

Determinants of exposureDeterminants of exposure
Sex higher in males for adolescentshigher in males for adolescents higher in females for elderlyhigher in females for elderly
Age Body-mass index, weight change
for persistent lipophylic compoundsfor persistent lipophylic compounds Smoking
for cadmium, lead, PAH and benzenefor cadmium, lead, PAH and benzene Nutrition
fat products for persistent lipophylic compoundsfat products for persistent lipophylic compounds vegetables for cadmium and lead (in elderly)vegetables for cadmium and lead (in elderly) local productslocal products breast feeding in adolescentsbreast feeding in adolescents
Area remains significant

Exposure: conclusionsExposure: conclusions
Area of residence determines exposure
No alarming trends were detected
People living in rural areas have high exposure to persistent chlorinated compounds
Cadmium is problematic in some regions
Although DDT is forbidden, metabolites are still detected in the human body in considerable amounts
Factors such as age, sex, smoking and nutritional intake are important determinants of exposure

Biomarkers of effectBiomarkers of effect
Asthma and allergy Asthma and allergy Endocrine effect markersEndocrine effect markersGenotoxic effect markersGenotoxic effect markers

Asthma & allergy – Asthma & allergy – reference meansreference means
______________________________________________14-15 y. 18-44 y. 50-65
y.______________________________________________Asthma - doctor 8.8% 4.3% 5.5%
Asthma - ever 25.3% 16.2% 15.3%
Hay fever - doctor 22.8% 34.2% 21.4%
Food allergy 25.5% 7.0% 22.7%
Contact allergy 21.5% 11.3% 24.9%
Allergy for animals 10.8% 12.0% 1.1%_______________________________________________________
mothers of newbornsadolesc. elderly

Asthma & allergy – Asthma & allergy – regional comparisonregional comparison
Asthma: more frequent in the cities Significant in mothersSignificant in mothers Trends in adolescents and Trends in adolescents and
elderlyelderly
Allergy for animals: less frequent in rural areas Significant in mothersSignificant in mothers Trends in adolescents and Trends in adolescents and
elderlyelderly
0
5
10
15
20
25
30
Antwerp Ghent Fruit Rural Harbour Non-fer. Chem. Incin.
Per
cen
t m
oth
ers
(%)
ASTHMA
0
5
10
15
20
25
30
35
Antwerp Ghent Fruit Rural Harbour Non-fer. Chem. Incin.
Per
cen
t m
oth
ers
(%)
ALLERGY FOR ANIMALS

Asthma & allergy – Asthma & allergy – dose-responsedose-response
Exposure Effect Odds for doubling pof exposure
Cadmium Asthma 1.15 (1.02-1.30) 0.02PCBs Hay fever 0.82 (0.72-0.94) 0.004
Lead Asthma 1.20 (1.04-1.39) 0.001Lead Hay fever 2.45 (1.06-5.66) 0.04Cadmium Asthma 3.10 (1.07-8.95) 0.04
PCBs Asthma 0.57 (0.41-0.78) <0.001p,p’-DDE Asthma 0.86 (0.76-0.97) 0.02HCB Asthma 0.79 (0.63-0.99) 0.04
Adolescents
Mothers of newborns
Elderly
asthma: adjusted for smoking and familial history; hay fever adjusted for smoking

Endocrine effectsEndocrine effects
Thyroid hormones (♀ & ♂) and sex hormones (♂) normal ranges, no regional differencesnormal ranges, no regional differences
Age at menarche (♀) and pubertal stages of Marshall and Tanner (♀ & ♂) validation against questionnaires and blood hormonesvalidation against questionnaires and blood hormones regional differences: significantly lower pubertal stage in regional differences: significantly lower pubertal stage in
Antwerp and harbourAntwerp and harbour
65
156
327
442449
0
100
200
300
400
500
G1 G2 G3 G4 G5
Genital stage in boys
Tes
tost
eron
(ng
/dL)
n=8 n=61 n=214 n=282 n=202
25
38
83
93
98
0
20
40
60
80
100
B1 B2 B3 B4 B5
Breast development in girls
% g
irls
at m
enar
che
n=4 n=8 n=41 n=264 n=307
Adolescents

Endocrine effectsEndocrine effects
pubertal stages of Marshall and Tanner In boys:In boys:
genital development (G) – stages 1,2 vs. 3,4,5 pubic hair development (P) – stages 1,2 vs. 3,4,5
In girls:In girls: breast development (B) – stages 1,2,3 vs. 4,5 pubic hair development (P) – stages 1,2,3 vs. 4,5
0
20
40
60
80
100
Antwerp Ghent Fruit Rural Harbour Non-ferro Chemical Inciner.
Sta
ge
4-5
(%
gir
ls)
B P B P B P B P B P B P B P B P0
20
40
60
80
100
Antwerp Ghent Fruit Rural Harbour Non-ferro Chemical Inciner.
Sta
ge
3-4
-5 (
% b
oys
)
G P G P G P G P G P G P G P G P

Endocrine effectsEndocrine effects
Reference mean: Time to pregnacy: 9.7 monthsTime to pregnacy: 9.7 months Fertility treatment: 7.6%Fertility treatment: 7.6% Miscarriages: 15.9%Miscarriages: 15.9%
No significant differences between 8 regions
Reference mean: Miscarriages: 17.7%Miscarriages: 17.7% Diabetes: 4.0%Diabetes: 4.0%
No significant differences between 8 regions
Mothers of newborns
Elderly

Endocrine effects – Endocrine effects – dose-responsedose-response
Exposure Effect Odds for doubling pof exposure
Lead pubic hair, girls 0.65 (0.45-0.93) 0.02
PCBs pubic hair, boys 2.58 (1.71-3.91) <0.001HCB pubic hair, boys 3.81 (2.18-6.66) <0.001p,p’-DDE pubic hair, boys 1.39 (1.13-1.72) 0.002
PCBs genital stage, boys 3.03 (1.87-4.89) <0.001HCB genital stage, boys 3.12 (1.69-5.75) <0.001 p,p’-DDE genital stage, boys 1.51 (1.18-1.93) 0.001
PCBs testosterone + 12% * <0.001
Adolescents
all relations: adjusted for age and BMI (+ oral contraceptive use in girls)* for doubling from 50 to 100 ng PCB/g fat

Endocrine effects – Endocrine effects – dose-responsedose-response
Exposure Effect Odds for doubling pof exposure
Calux fertility treatment 1.40 (1.09-1.80) 0.008
PCBs fertility treatment 1.29 (1.04-1.59) 0.002
HCB fertility treatment 1.21 (1.01-1.45) 0.04
Calux miscarriages 0.81 (0.65-0.99) 0.04
PCBs Diabetes 2.14 (1.32-3.50) 0.002
HCB Diabetes 1.99 (1.38-2.87) <0,001
Mothers of newborns
Elderly
fertility treatment and miscarriages: adjusted for age and smoking;diabetes: adjusted for age, smoking, sex and BMI

Genotoxic effects – Genotoxic effects – reference meansreference means
Comet assay: 1.03% DNA
Comet assay: 1.92% DNA Micronucleus: 6.6 mironucleï / 1000 binuclear cells 8-hydroxy-deoxguanosine: 14.9 µg/g creatinine Prostate specific antigen (PSA) – average: 1.03 µg/L
– PSA > 4 µg/L: 3.7% of men Carcino Embryonal Antigen (CEA): 1.82 ng/mL p53 – number above LOD: 35.6%
– average: 86.3 ng/mL (in subjects >LOD)
Cancer (self-report): 4.7%
Elderly
Adolescents

Genotoxic effects – Genotoxic effects – regional comparisonregional comparison
0,0
0,5
1,0
1,5
2,0
2,5
3,0
Antwerp Ghent Fruit Rural Harbour Non-ferro Chemical Inciner.
Co
met
ass
ay (
%D
NA
)
COMET ASSAYelderly
0
2
4
6
8
10
Antwerp Ghent Fruit Rural Harbour Non-ferro Chemical Inciner.
µn
uc
leï /
100
0 b
inu
clea
r ce
lls MICRONUCLEUSelderly
0
4
8
12
16
20
24
Antwerp Ghent Fruit Rural Harbour Non-ferro Chemical Inciner.
8-H
DG
(µ
g/g
cre
atin
ine)
8-HYDROXY-DEOXYGUANOSINEelderly
0,0
0,5
1,0
1,5
2,0
2,5
3,0
Antwerp Ghent Fruit Rural Harbour Non-ferro Chemical Inciner.
Co
met
ass
ay (
%D
NA
)
COMET ASSAYadolesc.
adjusted for age (in elderly only), sex and smoking

Endocrine effects – Endocrine effects – dose-responsedose-response
Exposure Effect Odds for doubling pof exposure
Lead comet assay +7% (2-12) 0.004
1-hydroxy-pyrene 8-DHG +3% (1-6) 0.01
Lead CEA +9% (3-15) 0.004
Urinary cadmium CEA +7% (2-13) 0.01
1-hydroxy-pyrene CEA +4% (1-7) 0.01
Elderly
comet assay adjusted for sex and smoking; 8-DHG adjusted for age, sex and smoking; CEA adjusted for age and smoking.
Adolescents

Health effects: conclusionsHealth effects: conclusions
Asthma and allergy occur frequently in Flanders; regional differences are present between cities and rural areas
Some endocrine and genotoxic markers differ between regions, but the clinical relevance is probably low
Several dose-response relationships were detected:
asthma and allergy asthma and allergy vs.vs. heavy metals and chlorinated persistent heavy metals and chlorinated persistent pollutantspollutants
endocrine effects endocrine effects vs. vs. lead and chlorinated persistent pollutantslead and chlorinated persistent pollutants
genotoxic markers genotoxic markers vs.vs. heavy metals and PAHs heavy metals and PAHs