biophysical and physicochemical methods for analyzing
TRANSCRIPT

Biophysical and physicochemical methods for analyzing plants in vivo and in situ (III):
X-ray spectroscopy for localising&quantifying metals
and for investigating metal ligands
Hendrik Küpper, Advanced Course on Bioinorganic Chemistry & Biophysics of Plants, summer semester 2021

a) chemical fixation and resin embedding
Advantages: over many years best established procedure in many laboratories
Disadvantages: Metals will inevitably be re-distributed ARTEFACTS
b) freeze substitution or freeze drying
Advantages: less element re-distribution than in (a)
Disadvantages: still at least intracellular (vacuole wall) re-distribution artefacts inevitable
c) frozen-hydrated tissues
Advantages: hardly any element-redistribution METHOD OF CHOICE!
Disadvantages: Required rapid-freeze techniques and cryostage ( expensive)
e) non-frozen fresh tissues
Advantages: NO preparation necessary, “in vivo” situation
Disadvantages: Strong beam damage MORE artefacts than in (c)!
X-ray spectroscopy on biological samplesGeneral comments on sample preparation techniques

Use of an electron microscope as an X-ray spectrometer
(1) X-ray emission spectroscopy(a) Energy Dispersive X-ray Analysis (EDXA)

Signals generated in the scanning electron microscope (SEM)
specimen
incident electron beam
backscattered electrons
secondary electrons
transmitted and inelastically scattered electrons
elastically scatteredelectrons
absorbedelectrons
visible light(cathode luminescence)
Bremsstrahlung
characteristic x-ray photons

Principle of Energy Dispersive X-ray Analysis (EDXA)
Principle of Particle Induced X-ray
Emission (PIXE)

The origin of the different lines in an EDXA spectrum

Analysis of EDXA spectra
Energy / keV
Cou
nts
continuous backgroundof bremsstrahlung
peaks of characteristic x-ray photons
Analysis: a) recording of complete spectrum, subtraction of background --> quantification of peak areas by comparison to internal standardb) recording of counts in spectral window --> dot maps, line scans
spectral window

Detection limits of EDXA

Methods of plant analysis using EDXASampling of single-cells saps with micropipettes
micropipette filled with silicon oil, connected to air-filled syringe for controlling pressure difference
turgor pressure of punctured cell fills pipette with 5-20 picolitres (10-12 l) of cell sap
Sample preparation:1) transfer to storage grid,addition of internal standard (e.g. RbF) and matrix (e.g. mannitol)
2) transfer to analysis grid,drying with isopentane
Analysis:1) recording of EDXA spectra in SEM2) data processing
typical dried sample20 µm
analysis gridKüpper H, Zhao F, McGrath SP (1999) Plant Physiol 119, 305-11

Methods of plant analysis using EDXAQuantification of elements in single-cells saps
1) net peak area is normalised by internal standard (an element not naturally present in the sample, e.g. Rb)
2) ratio obtained from 1) is quantified using calibration curve
1 10 100
1000
10000
100
Cadmium
coun
ts p
er 1
000
RbK
cou
nts
concentration / mM
Evaluation of the methodAdvantages:- potentially very accurate- enables measurement of
small concentrations
Disadvantages:- only few types of cells are accessible
to sampling with micropipettes- risk of preparation artefacts- no distinction between cytoplasm and
vacuole, measurement of cell walls impossible
- very difficult to obtain information about heterogeneity of element distribution inside the analysed tissue
Küpper H, Zhao F, McGrath SP (1999) Plant Physiol 119, 305-11

Methods of plant analysis using EDX or XRFFreeze-fracturing
Excise sample from plant, mount in/on stub or vice.The EDX/XRF spectrum of the vice must not interfere with that of the sample!
Shock-freeze the sample, e.g. in melting nitrogen slush (NOT regular liquid nitrogen!), transfer to cooled (-170°C) preparation chamber
Fracture / cut sample
For EDX: Produce conductive sample surface by evaporating carbon wire
Transfer to cooled (-150°C) sample stage or cryostream, analyse
Küpper H, Zhao F, McGrath SP (1999) Plant Physiol 119, 305-11

Tomographic X-ray emission spectroscopy (µ-XRF):Artefacts of slow freezing
shock-freezing in supercooled isopentane led to homogeneous standards (left), freezing in LN2 was too slow due to gas layer and led to de-mixing during the freezing process (right)
Mishra S, Wellenreuther G, Mattusch J, Stärk H-J, Küpper H (2013) Plant Physiology 163, 1396-1408

Methods of plant analysis using EDXAAnalysis of bulk-frozen samples
Effect of shadingshading inside a sample leads to absorption of low-energy x-rays
Dot -map of O Kα line (0.6) Normal x-ray spectrumX-ray spectrum in shadow of trichome
Effect of acceleration voltagehigh acceleration voltage leads to deeper penetration into the sample!
sec. e-
scatt. e-inc. e-
X-rays
fluorescence
ionisation volume

Methods of plant analysis using EDXAQualitative and semi-quantitative analysis of bulk-frozen samples
Line scansScan of the Zn K alpha line(0.6x half width) along the straight line. Amplitude represents the counts/s inside the selected spectral window.
Dot mapsScan of the Zn K alpha line(0.6x half width) over the whole image. Each dot represents one x-ray count inside the selected spectral window.
Küpper H, Lombi E, Zhao FJ, McGrath SP (2000) Planta 212, 75-84

EDXA imaging application example:Ni silicate accumulation in cell walls of Berkheya coddii
Dot maps (K α lines) of the upper side of a Berkheya coddii leaf. Quantitative relation between Si and Ni in metal accumulation spots: 3.5 (± 1) Si / Ni (P = 0.0055)
Dot maps (K α lines) showing the development of metal accumulation spots. Up: senescent leaf, down: young-mature leaf;blue: Ca, red: Mn, yellow: Ni
Küpper H (2001, doctoral thesis). UFO Atelier für Gestaltung und Verlag, Allensbach (ISBN 3-935511-07-8)4

EDXAQuantitative analysis of
bulk-frozen samples
Counts in spectra (A)can be normalised to either the background (B) or an internal standard. The oxygen Kα line has proven to be a reliable internal standard in bulk-frozen samples, in particular in aqueous compartments like vacuoles (C).
Küpper H, Lombi E, Zhao FJ, McGrath SP (2000) Planta 212, 75-84

EDXA quantification application example:Al accumulation in epidermal cell walls of tea (Camellia sinensis)
Young leaves
Old leaves
1
2
3
4
5
6
7
050
100150200250300350400Al
mM
upper epidermis palisade spongy lower epidermis
mesophyll
Cut OCW V ICW V CW V CW ICW V OCWElectronoptic picture of an old C. sinensis leaf (upper epidermis) and dot map of the Al K α line
Carr HP, Lombi E, Küpper H, McGrath SP, Wong MH* (2003) Agronomie 23, 705-710

Methods of plant analysis using EDXAAnalysis of bulk-frozen samples
Evaluation of the freeze-fracturing methodAdvantages:- All types of cells and tissues can be analysed - In situ-analysis with very little risk of preparation artefacts- Easy analysis of the heterogeneity of element distribution, by use of dot-maps even in
an imaging way
Disadvantages:- Limited sensitivity (min. 1mM) and accuracy (shading)- Elements in dead tissues with low water content cannot be reliably quantified
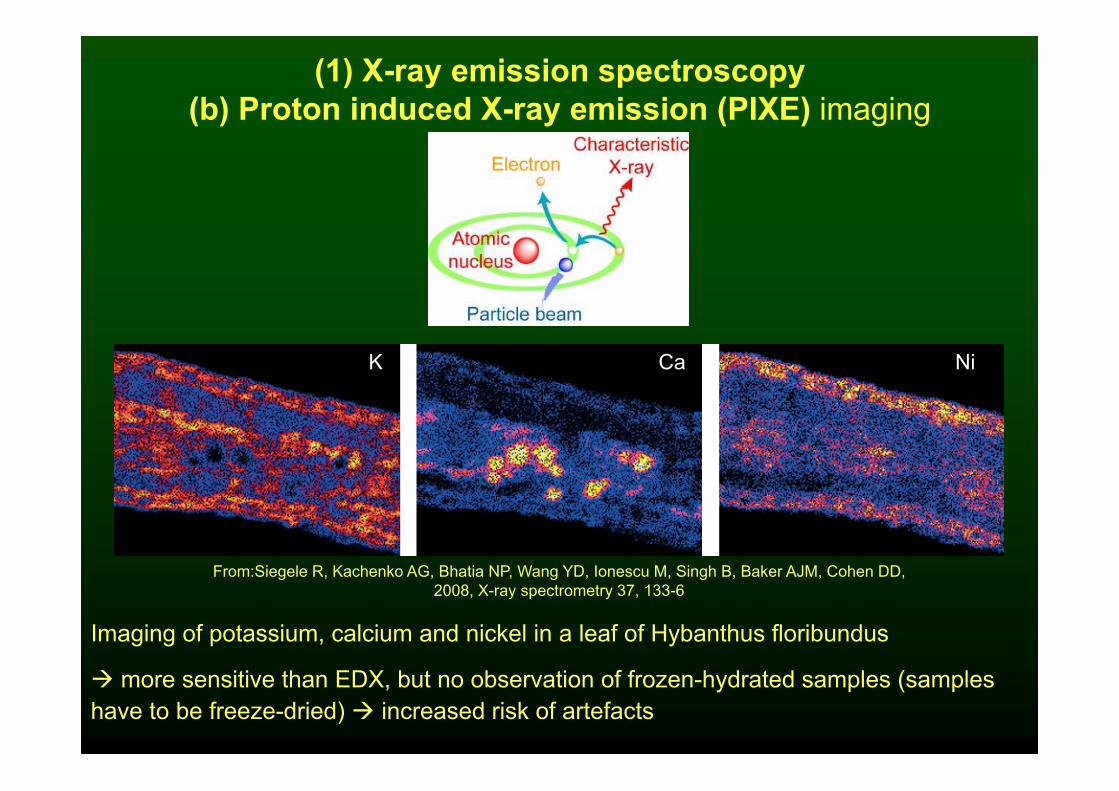
From:Siegele R, Kachenko AG, Bhatia NP, Wang YD, Ionescu M, Singh B, Baker AJM, Cohen DD, 2008, X-ray spectrometry 37, 133-6
Imaging of potassium, calcium and nickel in a leaf of Hybanthus floribundus
more sensitive than EDX, but no observation of frozen-hydrated samples (samples have to be freeze-dried) increased risk of artefacts
K Ca Ni
(1) X-ray emission spectroscopy(b) Proton induced X-ray emission (PIXE) imaging

From: Kim SA, Punshon T, Lanzirotti A, Li L, Alonso JM, Ecker JR, Kaplan J, Guerinot ML, 2006, Science 314, 1295-8
MUCH more sensitive than EDX and PIXE, but in contrast to EDX it requires a synchrotron for excitation at resolutions <15µm (limit of current commercial lab sources) limitation of beamtime
Tomographic X-ray emission spectroscopy:principle of X-ray fluorescence imaging (XRF)
Imaging of Fe, Mn, and Zn in seeds of Arabidopsis thaliana

MAIN advantage for our purposes: no thin sectioning necessary for large samples (e.g. roots, leaves)
drastic reduction of sample preparation artefacts analysed optical slice of sample is protected by surrounding sample and
mounting capillary, therefore less damage during storage, transport andanalysis
For small samples (e.g. microalgae): 3D analysis possible
Tomographic X-ray emission spectroscopy:Why is tomography better than 2D mapping
for biological samples?
From work of Mishra S, Alfeld M, Sobotka R, Andresen E, Falkenberg G, Küpper H on As-stress in Ceratophyllum demersum measured at the the PETRA III P06 beamline of DESY (Hamburg)

Where we measure (I): Synchrotrons
DESY
Bending Magnet
Undulator
P06 beamline at PETRA III, microprobe, focussing with KB mirror system, 0.6 µm beam size, Maia detector
Beamline L at DORIS, focussing with single-bounce capillary, 10 µm beam size, 2 Vortex SDD detectors

(1) X-ray emission spectroscopy(c) µ-XRF: Sample preparation and measurement
cameradetector
detector
cryostream
From work of Mishra S, Wellenreuther G, Küpper Hon As-stress in Ceratophyllum demersum
measured at the DESY (Hamburg)

Tomographic X-ray emission spectroscopy (µ-XRF):Cryostream extension for a bulky MAIA detector
MAI
A de
tect
or
From work of Mishra S, Alfeld M, Sobotka R, Andresen E, Falkenberg G, Küpper H on As-stress in Ceratophyllum demersum measured at the the PETRA III P06 beamline of DESY (Hamburg)
cryostream
detector
improved flow and insulation of cryostream extension
sample after 8h measurementsample after 8h measurement
cryo
stre
am
KB mirror system
optic
alm
icro
scop
e
sample

Tomographic X-ray emission spectroscopy (µ-XRF):Quantification with correction of self-absorption
intensity artefacts due to absorption inside the sample were corrected by taking the fluorescence intensity distribution in homogeneous standards resembling the shape of the sample as a reference
Mishra S, Wellenreuther G, Mattusch J, Stärk H-J, Küpper H (2013) Plant Physiology 163, 1396-1408
for minimising disturbance by background and neighbouring emission lines, full spectral deconvolution/fitting was used (in PyMCA for SDD data, Geopixe for Maia data).
for minimising reconstruction artefacts, the MLEM (maximum likelihood expectation maximization) algorithm was applied

Tomographic X-ray emission spectroscopy (µ-XRF):Using Flux and Compton tomograms for showing tissue structures
in frozen-hydrated plant samples
linear contrast stretching
original tomogram of photon flux after sample(32bit grey scale)
original tomogram of Compton scattering (32bit grey scale)
FFT bandpass filter
CLAHEalgorithm
division flux / compton
epidermis bettermesophyll better
Mishra S, Alfeld M, Sobotka R, Andresen E, Falkenberg G, Küpper H (2016) Journal of Experimental Botany 67, 4639-4646

Sub-cellular distribution of As in C. demersum leaves
Mishra S, Alfeld M, Sobotka R, Andresen E, Falkenberg G, Küpper H (2016) Journal of Experimental Botany 67, 4639-4646
2 phase response to As toxicity
A) Initially, at sublethal concentrations, As is accumulated mainly in the nucleus genotoxicity (besides inhibition of Chl biosynthesis)
B) At lethal concentration, As fills the whole cell various types of damage

Sub-cellular distribution of La(measured at La Kα with 0.2µm resolution at beamline ESRF ID16A)
Response to La toxicity
A) At sublethal La concentrations, La is usually accumulated inside the cells, often in small spots (biominerals?)
B) At lethal concentration, essential elements become released through leaky membranes, La binds in the whole cytoplasm
Ashraf N, Vitova M, Cloetens P, Mijovilovich A, Bokhari SNH, Küpper H* (2021) Effect of
nanomolar concentrations of lanthanum on Desmodesmus quadricauda cultivated under environmentally relevant conditions. Aquatic
Toxicology (accepted for publication)

Where we measure µXRF (II): At home
Customised Bruker Tornado M4 machine in our lab
- Purpose: Imaging measurement of element distribution (Z≥11 Na) with tissue-
level (15-20µm) resolution in vivo
- Special features: biology-optimised configuration with
2 SDD detectors of together 120 mm²active area and fast readout electronics
custom-made special shielding to reduce background counts in the range of the trace
elements that are important for our work
custom-made measuring chamber for keeping samples alive
Mijovilovich A, Morina F, Bokhari SNH, Wolff T, Küpper H* (2020) Analysis of trace metal distribution in plants with lab-based microscopic X-ray fluorescence imaging, Plant Methods, DOI: 10.1186/s13007-020-00621-5

Where we measure µXRF (I):
Customised Bruker Tornado M4 in our lab
Sample preparation and photosynthesis measurement
OJIP: Küpper H, Benedikty Z, Morina F, Andresen E, Mishra A, Trtílek M (2019) Plant Physiology 179, 369-381.
µXRF: Mijovilovich A, Morina F, Bokhari SNH, Wolff T, Küpper H* (2020) Plant Methods, DOI: 10.1186/s13007-
020-00621-5
leaf
petri dish with water

Verification of sample vitality during measurement in the in-house X-ray
fluorescence microscope for analysis of metal localization in living
tissues
Measurement of photosynthetic activity by direct fast imaging of OJIP chlorophyll fluorescence kinetics
Samples stay vital even after 20h total measurement time, but small effects on electron transport and non-photochemical
quenching can be seen
Mijovilovich A, Morina F, Bokhari SNH, Wolff T, Küpper H* (2020) Analysis of trace metal distribution in plants with lab-based microscopic X-ray fluorescence imaging, Plant Methods, DOI: 10.1186/s13007-020-00621-5

Examples of the use of the in-house X-ray fluorescence
microscope for analysis of metal localization
in living tissues: Capsicum annuum (pepper)
leaves
The sensitivity of the machine is sufficient for visualising trace metals in non-accumulator
crop plants
The spatial resolution (15µm beam size) is sufficient for imaging metal distribution
between tissues and larger cells
Mijovilovich A, Morina F, Bokhari SNH, Wolff T, Küpper H* (2020) Analysis of trace metal distribution in plants with lab-based microscopic X-ray fluorescence imaging, Plant Methods, DOI: 10.1186/s13007-020-00621-5

Examples of the use of the in-house X-ray fluorescence
microscope for analysis of metal
localization in living tissues: Arabidopsis halleri leaves
de-focussing affects the resolution of the optical image more than the µXRF maps
Due to the geometric arrangement of the optical camera vs. the X-ray optics
(polycapillary), de-focussing leads to a shift of the µXRF maps relative to the optical
image.
Mijovilovich A, Morina F, Bokhari SNH, Wolff T, Küpper H* (2020) Analysis of trace metal distribution in plants with lab-based microscopic X-ray fluorescence imaging, Plant Methods, DOI: 10.1186/s13007-020-00621-5

Examples of the use of the in-house X-ray fluorescence microscope for analysis of metal localization in living tissues:
Cd accumulation vs. PSII efficiency in Arabidopsis halleri leaves
In vivo measurement allows for direct correlation between physiology and metal accumulation!
Morina F, Küpper H* (2020) Direct inhibition of photosynthesis by Cd dominates over inhibition caused by micronutrient deficiency in the Cd/Zn hyperaccumulator Arabidopsis halleri. Plant Physiology and Biochemistry 155_252-261 (DOI: https://doi.org/10.1016/j.plaphy.2020.07.018)

X-ray absorption (I)

X-ray absorption (II)

XAS techniques

What can we learn from XAS?
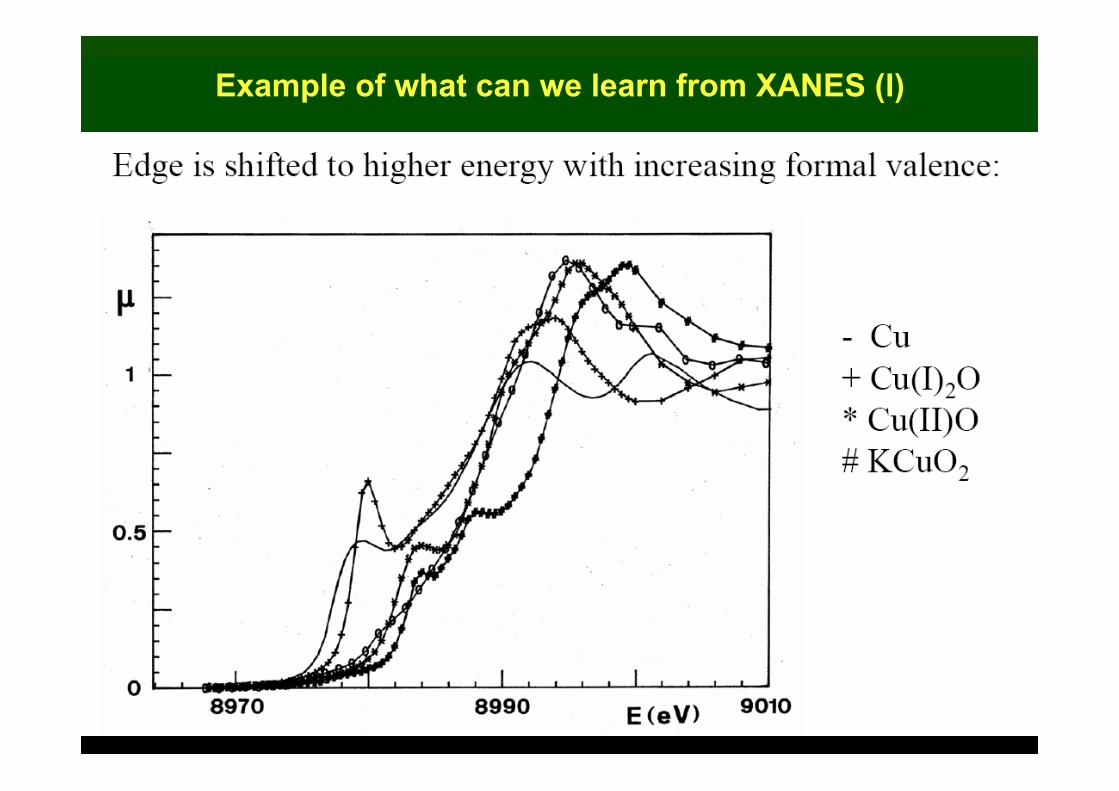
Example of what can we learn from XANES (I)

Example of what can we learn from XANES (II)

Principle of Extended X-ray Absorption Fine Structure (EXAFS)

Principle of single vs. multiple scattering contributions in EXAFS

Effects of single vs. multiple scattering contributions in EXAFS

Preparation of plant material for XAS (EXAFS and XANES)
Excise sample from plant
Freeze the sample in melting nitrogen slush
grind sample in mortar cooled by dry ice
fill the still frozen-hydrated powder into an EXAFS cuvette, seal with Kapton tapeThe EXAFS spectrum of the cuvette must not interfere with that of the sample!
Transfer to cooled (20 K) sample holder of beamline, analyse
Küpper H, Mijovilovich A, Meyer-Klaucke W, Kroneck PMH (2004) Plant Physiology 134 (2), 748-757

Analysis of EXAFS data (I)

Analysis of EXAFS data (II)

26700 26800 26900 27000 271000.00.20.40.60.81.01.21.4
2 4 6 8 10 12
-6-4-20246
0 1 2 3 4 5 605
1015202530
26750 268000.8
1.0
1.2 XASN
orm
alis
ed X
-ray
fluo
resc
ence
Excitation energy [eV]
k / Å-1
EXAFSEXAF
S [C
hi*k
3 ]
oxygen (aqueous) oxygen (citrate) histidine sulphur (glutathione)
EXAFS Fourier transform
Distance [Å]
Tran
sfor
m A
mpl
itude
26700 26800 26900 27000 271000.00.20.40.60.81.01.21.4
2 4 6 8 10 12
-4-20246
0 1 2 3 4 5 6048
12162024
26750 26800
1.0
1.2
measured data fi t with datasets of model compounds
XAS
Nor
mal
ised
X-r
ay fl
uore
scen
ce
Excitation energy [eV]
measured data fit with theoretical model
k / Å-1
EXAFSEXAF
S [C
hi*k
3 ]
measured data fit with theoretical model fit with datasets of
model compounds
EXAFS Fourier transform
Distance [Å]
Tran
sfor
m A
mpl
itude
Cd-ligands: model compounds Cd in hyperaccumulator leaves
Küpper H, Mijovilovich A, Meyer-Klaucke W, Kroneck PMH (2004) Plant Physiology 134 (2), 748-757

Application example: Speciation of cadmium and zinc hyperaccumulated by Thlaspi caerulescens (Ganges ecotype)
Küpper H, Mijovilovich A, Meyer-Klaucke W, Kroneck PMH (2004) Plant Physiology 134, 748-757
0.0
0.2
0.4
0.6
0.8
1.0
1 2 3 4 50.0
0.2
0.4
0.6
0.8
1.0
young leaves mature leaves mature stems
Zn
histidine contribution
young leaves senescent leaves mature stems
Distance [Å]
Four
ier T
rans
form
of
χ*k3
Cd
increase in sulphur contribution

young mature senescent dead0
20
40
60
80
Perc
ent o
f all
ligan
ds b
indi
ng to
Cd
Developmental stage of leaves sulphur ligands N/O ligands
stems petioles leaves0
20
40
60
80
Per
cent
of a
ll lig
ands
bin
ding
to C
d
Tissue
Application example: Speciation of cadmium and zinc hyperaccumulated by Thlaspi caerulescens (Ganges ecotype)
Küpper H, Mijovilovich A, Meyer-Klaucke W, Kroneck PMH (2004) Plant Physiology 134, 748-757

Microscopic X-ray absorption spectroscopyConfocal µ-XANES: Sample mounting and measurement
E
SX
M
P
µm
Mishra S, Wellenreuther G, Mattusch J, Stärk H-J, Küpper H (2013) Plant Physiology 163, 1396-1408
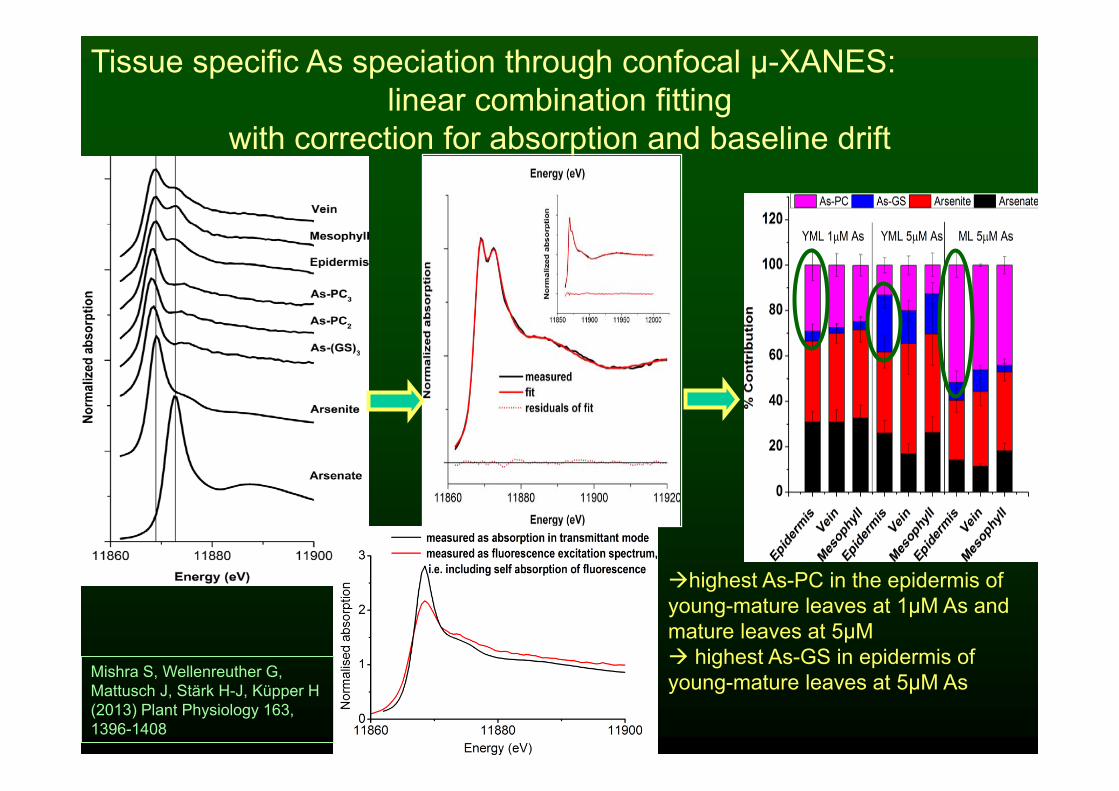
Tissue specific As speciation through confocal µ-XANES:linear combination fitting
with correction for absorption and baseline drift
highest As-PC in the epidermis of young-mature leaves at 1µM As and mature leaves at 5µM highest As-GS in epidermis of young-mature leaves at 5µM AsMishra S, Wellenreuther G,
Mattusch J, Stärk H-J, Küpper H (2013) Plant Physiology 163, 1396-1408

Arsenic: comparison of µXRF&µXANES with chromatography
Mishra S, Wellenreuther G, Mattusch J, Stärk H-J, Küpper H (2013) Plant Physiology 163, 1396-1408

Mijovilovich A, Mishra A, Brückner D, Spiers K, Andresen E, Garrevoet J, Falkenberg G, Küpper H (2019) Spectrochimica Acta B 157, 53-62
Biomineralisation in response to virus infection
Infection with Turnip Yellow Mosaic Virus leads to enhanced biomineralization as revealed by µXRF and µ-XANES tomography
Morina F, Mishra A, Mijovilovich A, Matoušková Š, Brückner D, Špak J, Küpper H. (2020) Frontiers in Plant Science. DOI: https://doi.org/10.3389/fpls.2020.00739
Tissue specific Zn speciation through µ-XANES tomography

a) Sample preparation
For analysing metals in biological samples, organisms need to be treated with metal concentrations they encounter in real life if meaningful results should be obtained
Samples should be prepared by shock-freezing and kept frozen-hydrated to minimise the risk of artefacts of element re-distribution and changes in speciation
b) Measurement
Compared to mapping of thin sections, tomography of larger samples minimises sample preparation (sectioning) and therefore the risk of artefacts
Detectors with large solid angle increase the ratio of signal / beam damage
c) Data analysis
Standards having the same shape and average composition as the samples allow for good correction of absorption effects
X-ray spectroscopy on biological samplesGeneral technical conclusions

All slides of my lectures can be downloaded from my workgroup homepage
Biology Centre CAS Institute of Plant Molecular Biology Departments Department of Plant Biophysics and Biochemistry,
or directlyhttp://webserver.umbr.cas.cz/~kupper/AG_Kuepper_Homepage.html