biosolids research activity · web viewsolar drying of biosolids- a baseline study august 8- august...
TRANSCRIPT

Biosolids Research ActivitySolar Drying of Biosolids- A Baseline Study
August 8- August 18, 2004
Sustainable Development of Dry Lands in Asia and the Middle East – Jordan Component
Written by: Susan O’Shaughnessy, Ph. D. StudentReviewed by: Dr. Chris Choi, Associate Professor
Department of Agricultural and Biosystems EngineeringThe University of Arizona, Tucson, Arizona, 85721, U.S.A.
August 24, 2004

Forward
The start of this parallel experimental activity was made possible due to the
foresight of Dr. Bob Freitas in allowing the purchase of the electronic equipment for
the remote data collection and communication system to be made in advance of this
trip as well as the funding of the media for the microbiological assays. In addition,
the administrative support of Esther Miklofsky is always vital in making for a
smooth trip. During the course of this visit, the work was carried out jointly by the
University of Arizona and the Royal Scientific Society in terms of both participation
and cooperation. It is the expectation of the two groups that we maintain close
communication during the ensuing weeks by sharing environmental and microbial
data and discussing results and conclusions.
Table of Contents
I. Introduction ……………………………………………………………….... 3
II. Table 1. Summary of Daily Activities………………………………….….. 5
III. Narrative
A. Wadi Hassan Wastewater Treatment Plant…………..…………….. 9
B. Experimental Set-up
Assembly of Weather Station and Thermocouples .……………11
Table of Sensors ………………………………………………...12
C. Experimental Design ……………………………………………….14
D. Microbiological Assays…………. ………………….……….…….. 19
E. Data Collection & Reporting ……………………………………..…21
IV. Final Comments ……………….………….……………………………….. 21
Appendices:
A. Microbial Assay Results
B. Photograph of the remote datalogger and data acquisition system
C. Loggernet file for Wadi Hassan Project
D. Salmonella Levels in Sewer Sludge
I. Introduction-
In many countries around the world, biosolids, treated sewer sludge, is recycled
extensively, mainly via land application on agricultural farm land. It beneficial uses also
extend to reclamation of mine tailings, devastated forest land, slope/erosion control,
garden fertilizer and as an additive in the production of compost. Biosolids are typically
rich in nitrates and phosphorous and therefore can be utilized in lieu of synthetic
commercial fertilizers.
Although Jordan developed standards for agricultural land application of biosolids in
1996 (Institute for Standards and Metrology of Jordan), biosolids are not recycled.
Instead, the common practice for mechanical wastewater treatment plants is the
utilization of drying beds for the purpose of thickening and dewatering biosolids for
storage on site (see photograph below, WWTP at Salt) or transportation and disposal to
dumping sites.

Biosolids generated from waste stabilization ponds are typically stored in anaerobic
lagoons or in open detention basins on site. However, with the advent of an increased
number of mechanical
Photo 1. Biosolids stored at Salt Wastewater Treatment Plant.
wastewater treatment plants and a growing population, storage space for biosolids is
becoming increasingly limited and the need to begin practicing reuse methods is
imminent.
Sustainable practices for the safe reuse of biosolids can evolve from the implementation
of best management practices of the land application of biosolids once complete
characterization studies for heavy metals and nutrient levels are performed and analyzed,
and time-temperature regimes for producing a specified pathogen quality of biosolids is
established. Commensurately important, is the collaboration among key governmental
organizations in Jordan to move towards the development of national guidelines for
sustainable recycling methods of biosolids.
The overall objective of this visit to Jordan is to begin a baseline project for the solar
drying of biosolids in a typically designed drying bed at a mechanical wastewater
treatment plant. It is critical to understand the baseline drying time and relative
environmental parameters that affect the conversion of Class B biosolids to Class A in
terms of pathogen criteria.

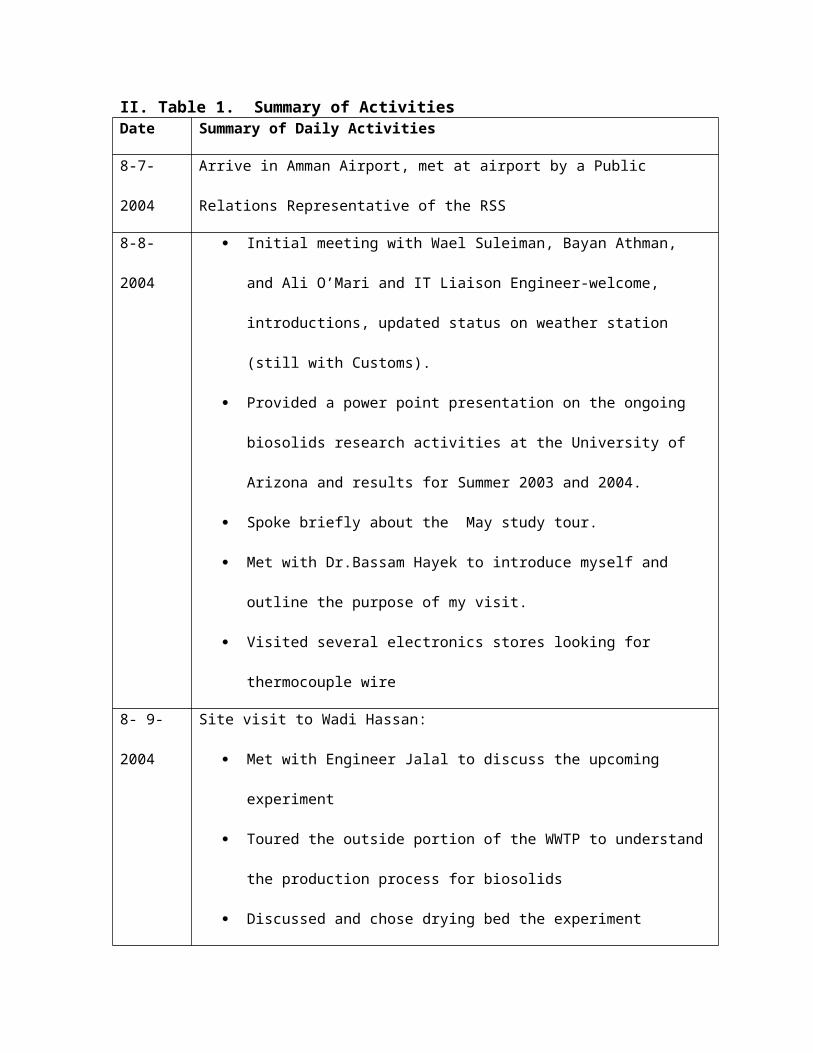
II. Table 1. Summary of ActivitiesDate Summary of Daily Activities
8-7-2004 Arrive in Amman Airport, met at airport by a Public Relations Representative of the
RSS
8-8-2004 Initial meeting with Wael Suleiman, Bayan Athman, and Ali O’Mari and IT
Liaison Engineer-welcome, introductions, updated status on weather station
(still with Customs).
Provided a power point presentation on the ongoing biosolids research
activities at the University of Arizona and results for Summer 2003 and 2004.
Spoke briefly about the May study tour.
Met with Dr.Bassam Hayek to introduce myself and outline the purpose of my
visit.
Visited several electronics stores looking for thermocouple wire
8- 9-2004 Site visit to Wadi Hassan:
Met with Engineer Jalal to discuss the upcoming experiment
Toured the outside portion of the WWTP to understand the production process
for biosolids
Discussed and chose drying bed the experiment
Took measurements for the siting of the weather station and length of the
probes
Took preliminary biosolids sample, placed on ice
Short trip to Irbid
Shopped for environmental sampling supplies
Date Summary of Daily Activities
8-10- 2004 Went to Customs Office to Identify Components of the Weather Station
Began fecal coliform and salmonella assay
Shopped for Environmental Sampling Equipment- trowel, rubber boots, long
gloves, aluminum pipe to position the rain gauge, etc.
Met with Wael to inform him of the progress
Searched stores for thermocouple wire
8-11-2004 Began assembly of the weather station
Met with the machine shop to have a pyranometer bracket fabricated as well as
hold-downs for moisture sensors
Continued fecal coliform and salmonella assays
Met with supplier of thermocouple wire to investigate use of Type K sample
8-12-04 Met with Biomedical Engineers to request their assistance in soldering
thermocouple wires to make the probes
Finished wiring and programming the weather station and datalogger
respectively
Continued fecal coliform and salmonella assay
8-13-04 Report Writing
Finished fecal coliform assay
Transferred presumptive salmonella colonies to TSA
Continued on Programming of the Datalogger
Date Summary of Daily Activities
8-15-04 Uploaded Loggernet onto RSS laptop, reviewed downloading of data and
uploading of datalogger programming with RSS IT Specialist
Disassembled the weather station and packed sensors for transport
Transported weather station and data collection system to Wadi Hassan
Sited weather station, moisture probes and thermocouples in experimental
drying bed
8-16-04 Returned to Wadi Hassan-checked datalogger for operation- o.k.
Leveled area beneath probes, measured distance from bed walls to probe
location for reference, installed identification stakes
Placed biosolids from sludge retention tank into experimental bed at depth of
25 cm
Sampled sludge for Day 0 assay
8-17-04 Confirmed presence of salmonella with Oxoid Latex Test Kit for preliminary
sample
Started sample Day 0 for experiment
Reviewed Loggernet software, basic operation of weather station,
thermocouples, and moisture probes including probe calibration with Bayan,
Ali, Ahmed and Wael
Returned borrowed thermocouple wire and probe to Sigma Thermolab
8-18-04 Continued microbial assays for Day 0
Reviewed MPN calculations with Ali
Reviewed data management with Excel software with Bayan and Ali
Exit meeting and Power Point presentation with Group
III. Narrative:
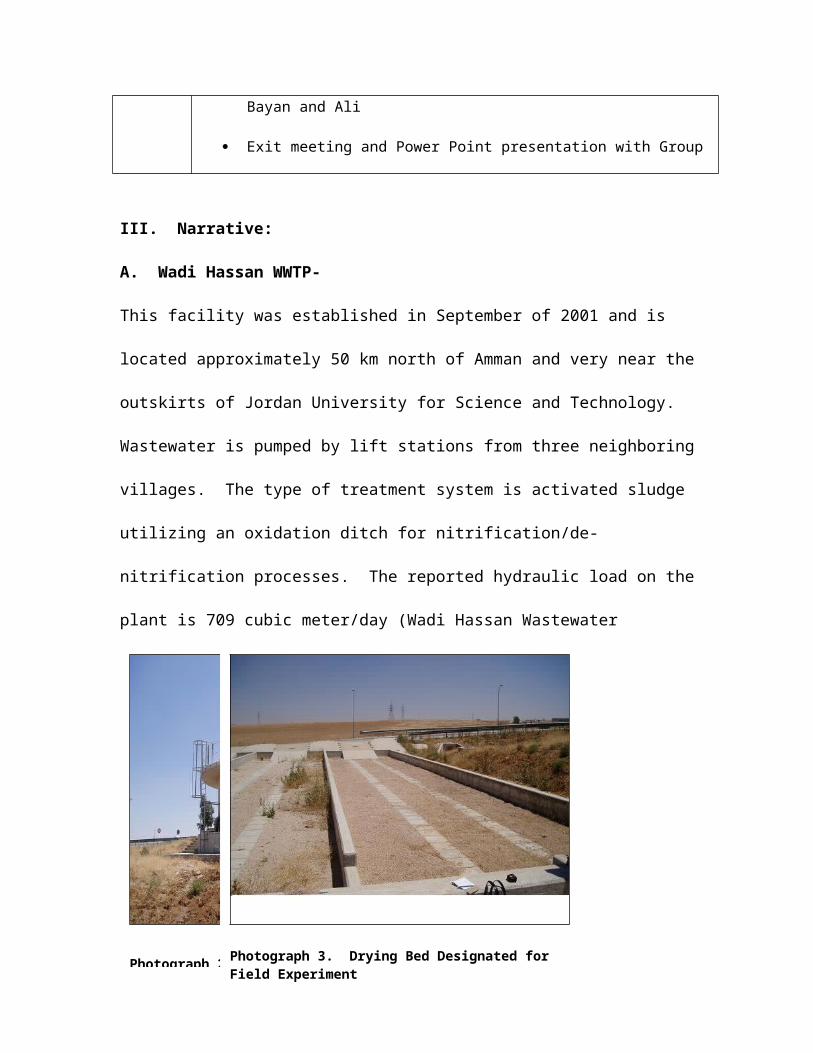
A. Wadi Hassan WWTP-

This facility was established in September of 2001 and is located approximately 50 km
north of Amman and very near the outskirts of Jordan University for Science and
Technology. Wastewater is pumped by lift stations from three neighboring villages. The
type of treatment system is activated sludge utilizing an oxidation ditch for
nitrification/de-nitrification processes. The reported hydraulic load on the plant is 709
cubic meter/day (Wadi Hassan Wastewater Treatment Plant, Monthly Report). Sludge is
aerobically digested and stored in a single sludge holding tank having a capacity of 800
cubic meters, photograph 1. There are 16 sand drying beds on location, which compared
to the hydraulic at this time is over capacity. From conversations with Engineer Jalal Al
jalouli, the depth of the sand layers (coarse, upper layer and fine, lower layer) are
approximately a total of 60 cm. Each bed is approximately 5 m x 15 m and receives a
depth of 25-30 cm of biosolids during the drying process. The floors of the beds are
sloped in a “V” configuration towards the centerline where a perforated pipe or French
Photograph 2. Sludge Holding TankPhotograph 3. Drying Bed Designated for Field Experiment
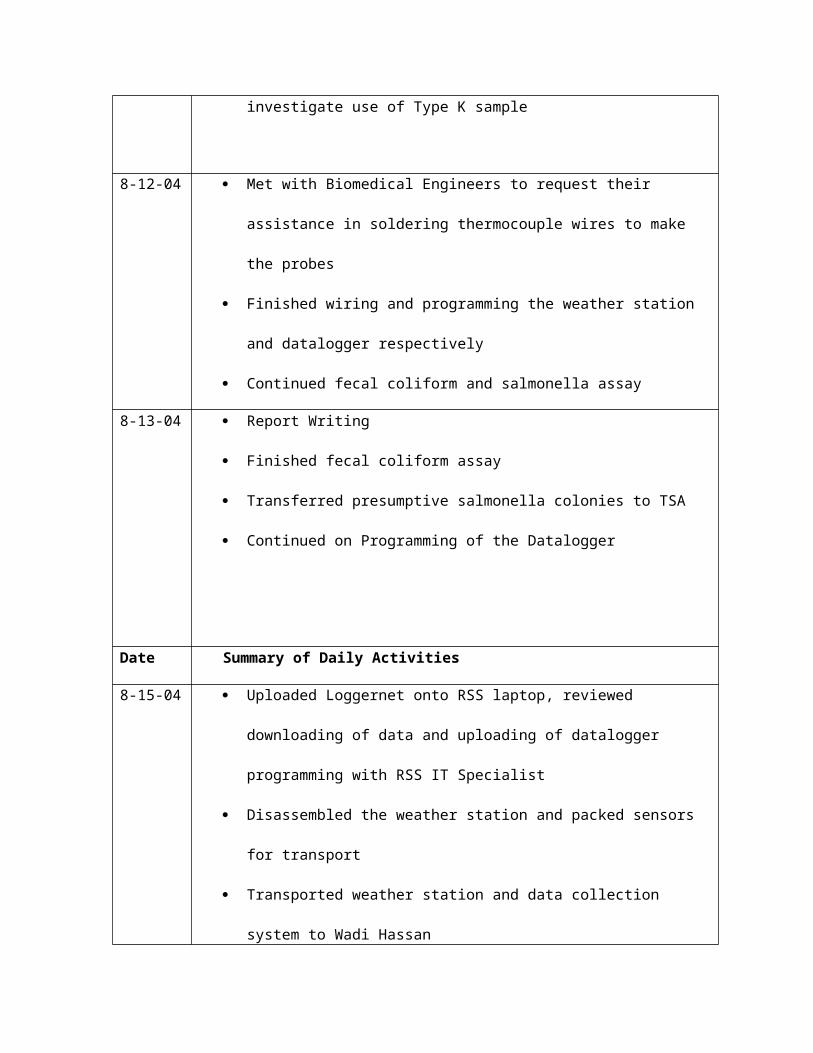
drain carries the drainage back to the head-works of the plant, photograph 2. Two rows
of pavement stones are aligned along the length of the bed floor to allow a small front
end loader to enter the bed and scoop up the dewatered biosolids. The typical retention
time for biosolids in the summer months is 2-3 weeks. An average of 53 cubic meters of
“dry” biosolids is removed from the plant on a monthly basis during the summer months.
Photograph 4- Row of Drying Beds at Wadi Hassan- depth of sand/gravel layer is approximately 25 cm. Bottom is conically shaped towards a French drain which carries the supernatant to the a pump station located southwest of the beds where it is eventually pumped to the head-works of the plant.
B. Experimental Set-Up:
Assembly of the weather station:
The weather station arrived in Amman on approximately August 3, 2004. Customs
contacted the RSS regarding the shipment on Monday, August 10th and released the
parcels for transport to the RSS the next day. Wednesday and Thursday were spent
assembling the weather station and wiring the datalogger accordingly. Ali O’Mari was
present the entire time and did the majority of wiring. Help was sought from the
Machine Shop and the Biomedical Department to manufacture a holding plate for the
pyranometer and weld thermocouple tips, respectively. Their work was satisfactory and
expedient. A one-point calibration was performed on the thermocouples and the wiring
of the datalogger was labeled and recorded by Ali, as well as incorporated in the text of
the datalogger program as comments.
Photograph 5– Ali Omari standing beside the weather station inside a warehouse building at the RSS. Ali was the primary person who installed the sensors and wired them to the datalogger
One drying bed will be utilized during the summer experiment; the drying bed located
nearest the sludge holding tank was chosen by Engineer Jalal.
The remote weather and communication system was established approximately 5 meters
northwest of the drying bed and situated at the nearest leveled area. The sensors on the
remote data collection system include the following:
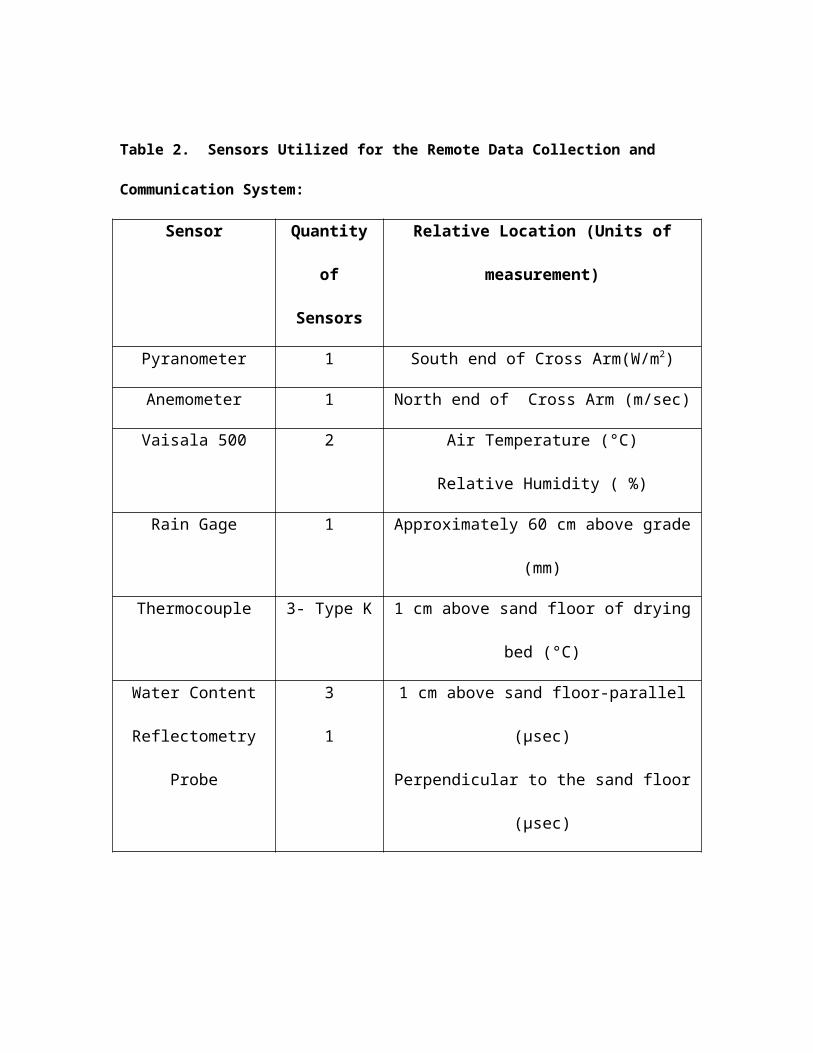
Table 2. Sensors Utilized for the Remote Data Collection and Communication System:
Sensor Quantity
of Sensors
Relative Location (Units of measurement)
Pyranometer 1 South end of Cross Arm(W/m2)
Anemometer 1 North end of Cross Arm (m/sec)
Vaisala 500 2 Air Temperature (°C)
Relative Humidity ( %)
Rain Gage 1 Approximately 60 cm above grade (mm)
Thermocouple 3- Type K 1 cm above sand floor of drying bed (°C)
Water Content
Reflectometry Probe
3
1
1 cm above sand floor-parallel (μsec)
Perpendicular to the sand floor (μsec)
The sensors are sampling every 10 seconds, data is being averaged and stored hourly.
Photograph 6- Engineer Jalal and Ahmed from the RSS Information Technology Department standing next to the weather station after it was anchored and grounded.

The remote data collection and communication system was sited at Wadi Hassan WWTP
on Sunday, August 15, 2004. The weather station was left to run for 24 hours prior to
starting the solar drying experiment.
C. Experimental Design:
Photograph 7- Water Content Reflectometry Probes and Thermocouples anchored onto floor of drying bed just prior to placement of sludge from the sludge holding tank, August 16, 2004. Probes
1
23
4

1-3 are anchored parallel to the floor of the sand bed. Thermocouples 1-3 are located approximately 1 meter to the north of each moisture content probe. Probe 4 is anchored perpendicular to the sand bed in order to provide a reading of the moisture held by the bed material.
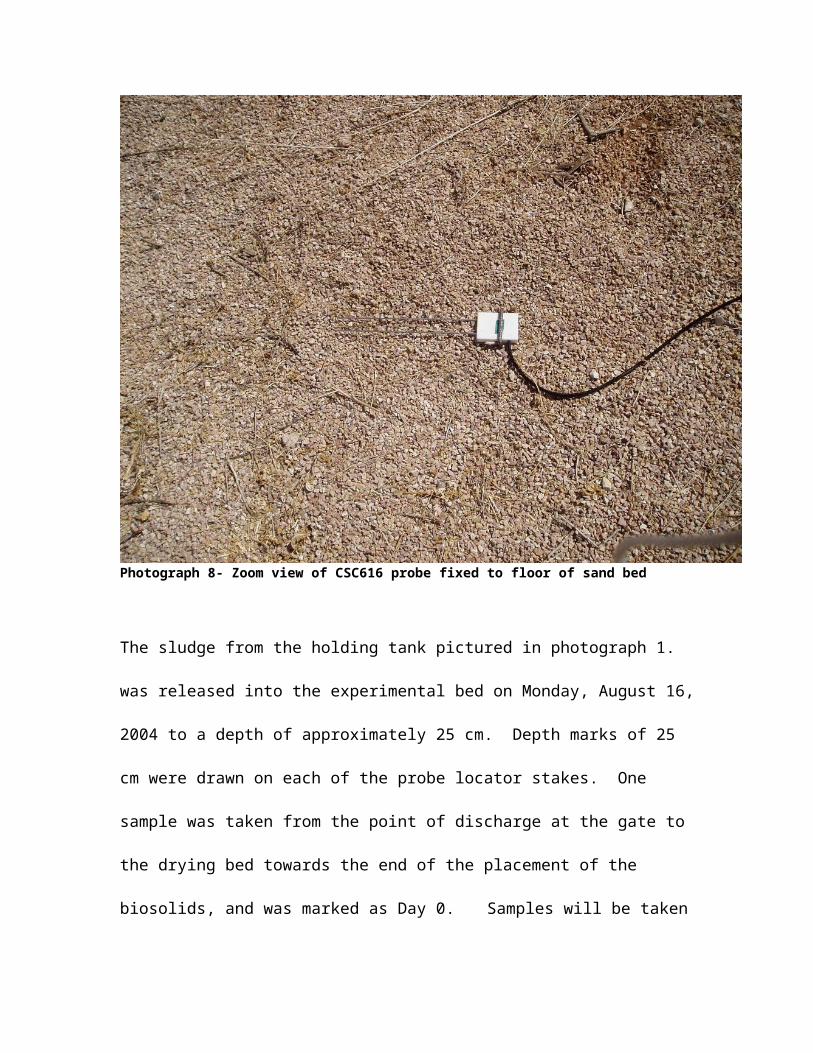
Photograph 8- Zoom view of CSC616 probe fixed to floor of sand bed
The sludge from the holding tank pictured in photograph 1. was released into the
experimental bed on Monday, August 16, 2004 to a depth of approximately 25 cm.
Depth marks of 25 cm were drawn on each of the probe locator stakes. One sample was
taken from the point of discharge at the gate to the drying bed towards the end of the
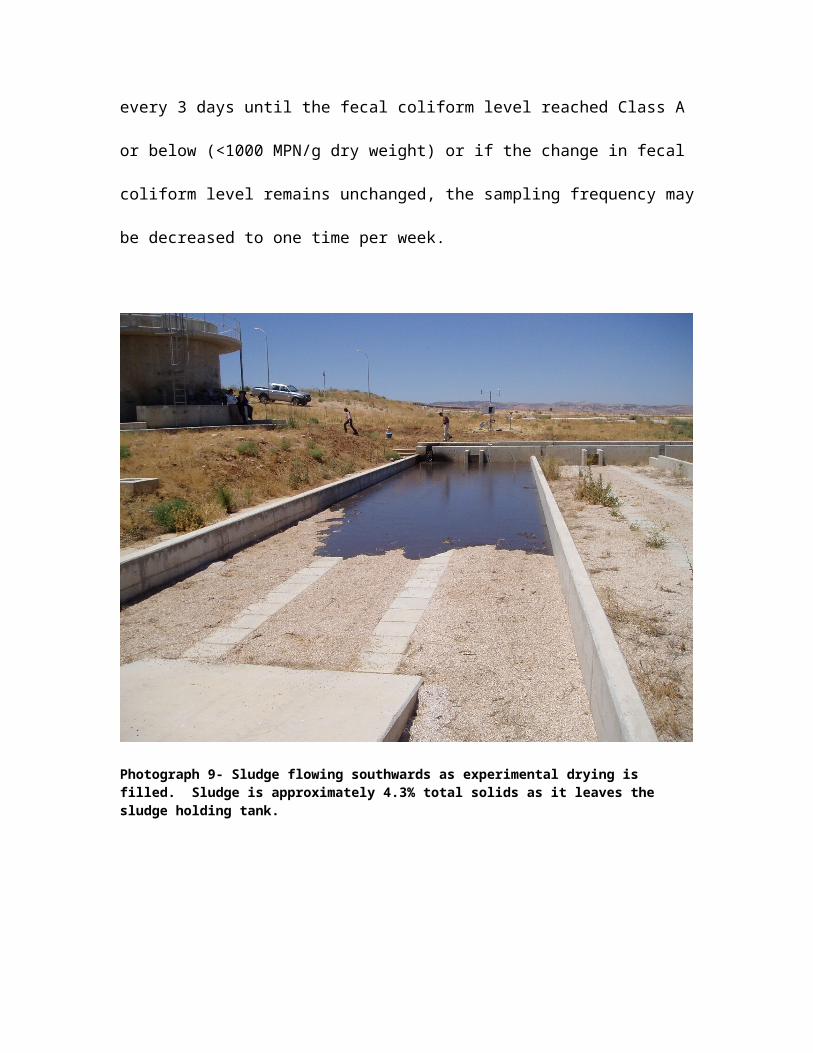
placement of the biosolids, and was marked as Day 0. Samples will be taken every 3
days until the fecal coliform level reached Class A or below (<1000 MPN/g dry weight)
or if the change in fecal coliform level remains unchanged, the sampling frequency may
be decreased to one time per week.

Photograph 9- Sludge flowing southwards as experimental drying is filled. Sludge is approximately 4.3% total solids as it leaves the sludge holding tank.
Photograph 10- Experimental Drying Bed filled to a depth of 25 cm. Probe cables are located in the foreground. Stakes indicate the location of the moisture probes.

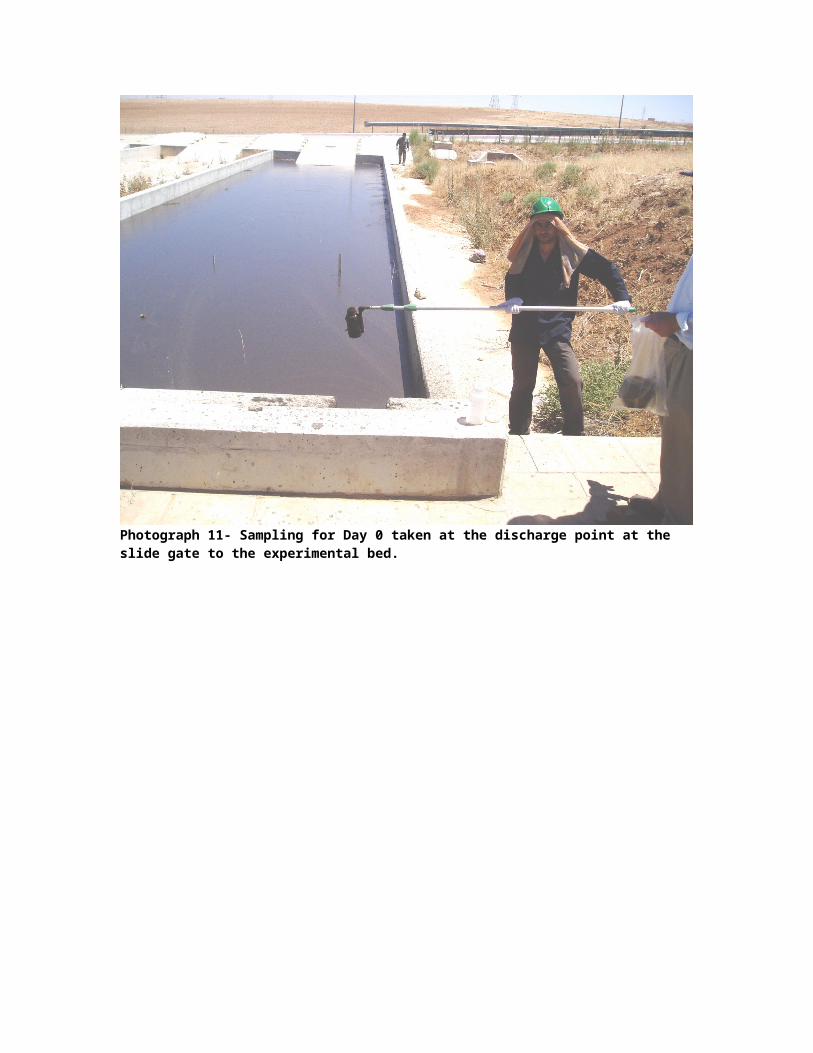
Photograph 11- Sampling for Day 0 taken at the discharge point at the slide gate to the experimental bed.

D. Microbiological Assays-
A trial run for the assays of fecal coliforms and salmonella was begun with the retrieval
of fresh biosolids from the sludge holding tank at Wadi Hassan on Monday, August 9,
2004. The presumptive tests for total coliforms were preformed by inoculating Laurel
Tryptose broth (LTB) with consecutive biosolids diluted in 0.1% peptone water from 10-1
to 10-6 dilutions. The inoculated LTB was placed in an incubator at 36°C for 48 hours. It
is important to wait until 48 hours to transfer any positive tubes, as the lower dilutions of
inoculated sample take additional time to ferment. Roughly 0.1 ml of positive LTB broth
was utilized to inoculated 10 ml of EC broth. The EC broth was then placed in a water
bath at 44.5°C for 24 hours. The total count for fecal coliforms was 1 x 10⁵ MPN/g dry
weight of biosolids. This value is very close to the thermal fecal coliform levels, 7 x 10⁵
MPN/g dry weight of biosolids, reported by the Royal Scientific Society (RSS) in their
report titled, “Biosolids Laboratory Analysis”, (May 2004).

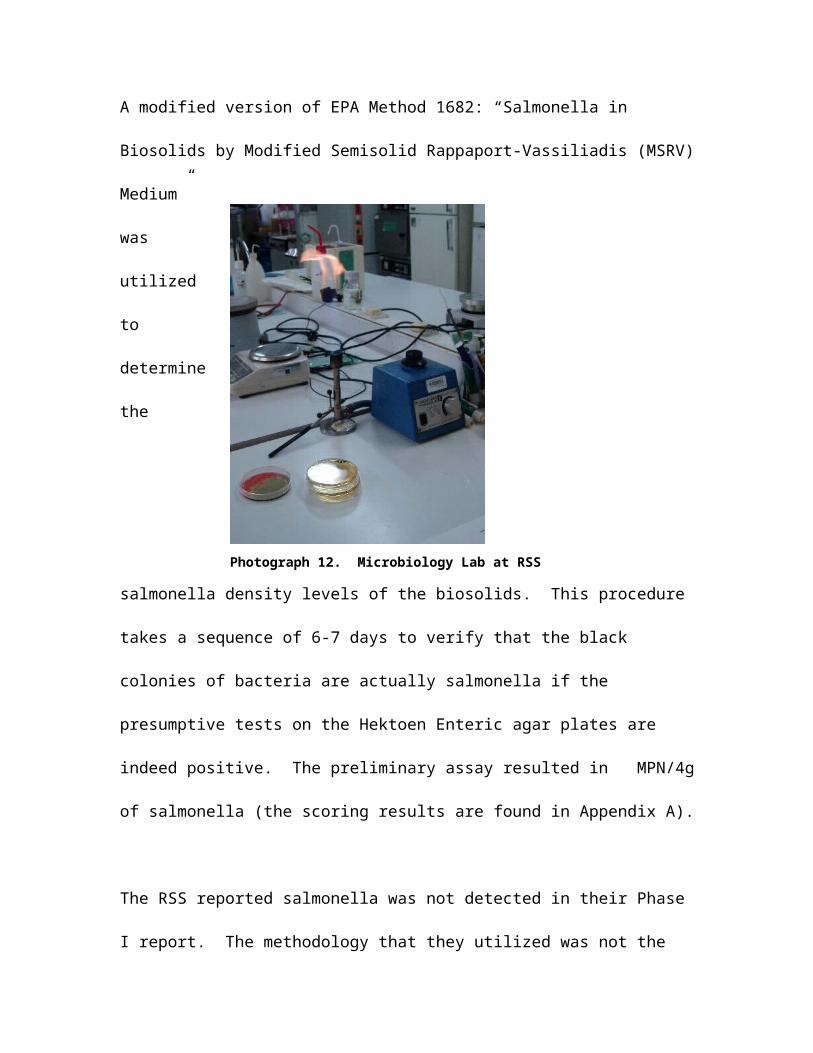
Photograph 12. Microbiology Lab at RSS
A modified version of EPA Method 1682: “Salmonella in Biosolids by Modified
Semisolid Rappaport-Vassiliadis (MSRV) Medium” was utilized to determine the
salmonella density levels of the biosolids. This procedure takes a sequence of 6-7 days to
verify that the black colonies of bacteria are actually salmonella if the presumptive tests
on the Hektoen Enteric agar plates are indeed positive. The preliminary assay resulted in
MPN/4g of salmonella (the scoring results are found in Appendix A).
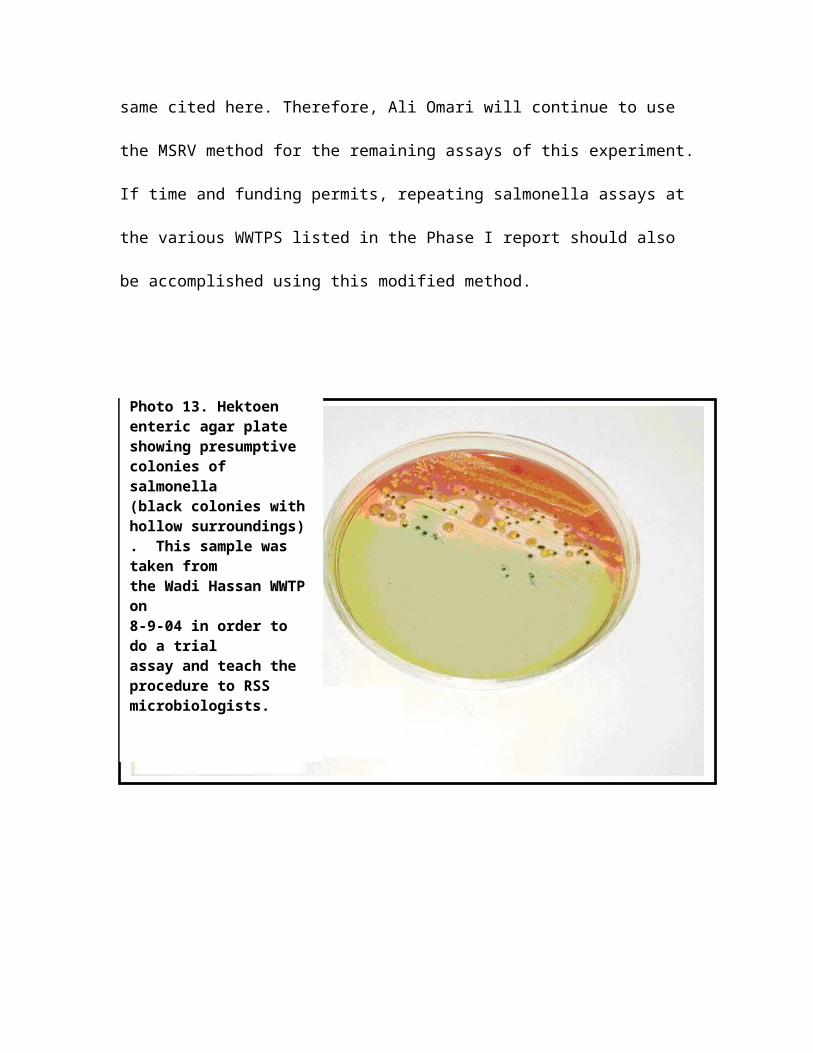
The RSS reported salmonella was not detected in their Phase I report. The methodology
that they utilized was not the same cited here. Therefore, Ali Omari will continue to use
the MSRV method for the remaining assays of this experiment. If time and funding
permits, repeating salmonella assays at the various WWTPS listed in the Phase I report
should also be accomplished using this modified method.
Photo 13. Hektoen enteric agar plate showing presumptive colonies of salmonella(black colonies with hollow surroundings) . This sample was taken fromthe Wadi Hassan WWTP on 8-9-04 in order to do a trialassay and teach the procedure to RSS microbiologists.
F. Data Collection & Reporting:
On Tuesday, August 17, time was spent with Wael Suleiman, Bayan Athamneh, Ali
Omari and Ahmad Alabed describing the Loggernet software, its use for establishing a
communication link to the datalogger- configuring network connections for direct
communication and for establishing a remote communication link when the cellular
modem is installed. Also, we did a dry-run sample on downloading data (we did a live
demonstration, yesterday, while at the WWTP site). Finally, we went over the method
for creating and changing the datalogger program. It was decided for now, that data will
be collected when the microbial samples are taken and then a single excel file will be e-
mailed to Susan on a weekly basis. Once the cellular modem is installed, data can be
collected daily and then the appended data will be sent in an Excel file to Susan, again on
a weekly basis. Ahmad will configure and install the cellular modem once it arrives.
IV. Final Comments:
On Wednesday, August 18, Ali and I began the fecal coliform and salmonella assay for
Day 0 of the experiment. Ali will sample on Day 3 as outlined in the experimental design
portion of this report. In the late morning, the group met with Dr. Bassam Hayak to
provide him with an update as to the progress that the team had made. We provided him
with a power point presentation of the work in chronological order and also described to
him the outcome of the preliminary microbiological assays. The salmonella levels caught
his attention and I explained to him the methodology which we used and reassured him
that it is an accepted protocol. It is my recommendation that the salmonella assays be
repeated for the wastewater treatment plants listed in the Phase I report in order that risk
assessment guidelines and best management practices for land application be based on
solid findings. (See Appendix D for literature citations regarding salmonella levels in
sewage).
I believe that Dr. Bassam is willing and very interested to repeat salmonella assays for the
pertinent treatment plant sites, depending on the availability of time and funding. He also
expressed interest in the upcoming study tour scheduled for December2004. His request
for this tour is that it be customized to match the current professional responsibilities of

the prospective attendees. Specifically, he is requesting that Wael Suleiman receive
specialized training on the topic of land application of biosolids. If Bayan is able to
attend, he requests that her training be of the same subject matter. On the other hand, he
prefers that the training for Ali Omari be dedicated to the microbiological aspects
involved with biosolids. In all cases, he would like for the participants to have a variety
of field trips dispersed between the classroom work.
Appendix A: Microbiological Results of Preliminary Sampling Sample collection date was August 9, 2004 from Wadi Hassan
Fecal Coliform Scoring:
Laurel Tryptose Broth:10 -̂1 10 -̂2 10 -̂3 10 -̂4 10 -̂5 10 -̂6
1 + + + + + -2 + + + + - -3 + + + + - -
EC Broth:10 -̂1 10 -̂2 10 -̂3 10 -̂4 10 -̂5 10 -̂6
1 + + + + - -2 + + + - - -3 + + + - - -
3-1-0Middle Dilution 10^4 %Total Solids = 4.3 g/g
431 x 105
Scoring Combination
MPN/100mlMPN/g
Salmonella Scoring:
10g 1g 0.1gA + - +B + + +C + + -
A + - +B + + +C + + -
A + - +B + + +C + + -
3-2-2% Total Solids
21048.84 4.3 g/g
195.35
Hektoen Entric Agar
Lysine Iron Agar
Triple Sugar Agar
MPN/4 g
Scoring CombinationMPN/100mlMPN/g

Appendix B:
Remote Data Collection and Communication System
Photograph 14– Remote system sited at Wadi Hassan WWTP. The unit is self supporting with a sealed battery and power regulator, trickle charged by a solar panel. The unit is fixed with a lightning rod and is grounded for safety reasons. A cable kit has been supplied to the RSS for further anchoring of the unit in the event of high winds.
Appendix C: Datalogger program
;{CR10X};;Program = C:\Campbell Sci\Loggernet;Date:8/14/04;*Table 1 Program 01: 5 Execution Interval (seconds);;measure datalogger internal temperture
1: Internal Temperature (P17) 1: 1 Loc [ Temp_int ];;measure datalogger battery voltage;
2: Batt Voltage (P10) 1: 8 Loc [ Battery ];
3: Temp (107) (P11) 1: 1 Reps 2: 1 SE Channel 3: 02 Excite all reps w/E2 4: 9 Loc [ Temp107 ] 5: 1.0 Mult 6: 0.0 Offset;Turn on CS500 (Humidity/Temp)
4: Do (P86) 1: 44 Set Port 4 High;;allow CS500 Air Temp & RH sensor to warm up & stabilize
5: Excitation with Delay (P22) 1: 2 Ex Channel 2: 0 Delay W/Ex (0.01 sec units) 3: 10 Delay After Ex (0.01 sec units) 4: 0 mV Excitation;;measure CS500 temperature;6: Volt (SE) (P1) 1: 1 Reps 2: 25 2500 mV 60 Hz Rejection Range 3: 3 SE Channel 4: 2 Loc [ CS500temp ] 5: 0.1 Mult 6: -40 Offset;;measure RH
7: Volt (SE) (P1)
1: 1 Reps 2: 25 2500 mV 60 Hz Rejection Range 3: 4 SE Channel 4: 3 Loc [ CS500RH ] 5: 0.1 Mult 6: 0 Offset
;Turn CS500 Off
8: Do (P86) 1: 54 Set Port 4 Low;;Limit the maximum relative humidity to 100%
9: If (X<=>F) (P89) 1: 3 X Loc [ CS500RH ] 2: 3 >= 3: 100 F 4: 30 Then Do
10: Z=F x 10^n (P30) 1: 100 F 2: 0 n, Exponent of 10 3: 3 Z Loc [ CS500RH ]
11: End (P95);;Pyranometer measurement;12: Volt (Diff) (P2) 1: 1 Reps 2: 23 25 mV 60 Hz Rejection Range 3: 3 DIFF Channel 4: 4 Loc [ Pyronomet ] 5: 100 Mult 6: 0 Offset;;Set negative values to 0;
13: If (X<=>F) (P89) 1: 4 X Loc [ Pyronomet ] 2: 4 < 3: 0.0 F 4: 30 Then Do
14: Z=F x 10^n (P30) 1: 0.0 F 2: 0 n, Exponent of 10 3: 4 Z Loc [ Pyronomet ]
15: End (P95);;Wind Speed Measurement

16: Pulse (P3) 1: 1 Reps 2: 2 Pulse Channel 2 3: 22 Switch Closure, Output Hz 4: 5 Loc [ Windspeed ] 5: 0.799 Mult 6: 0.0 Offset;;Set the windspeed to 0, if wind not blowing
17: If (X<=>F) (P89) 1: 5 X Loc [ Windspeed ] 2: 1 = 3: 0.2811 F 4: 30 Then Do
18: Z=F x 10^n (P30) 1: 0 F 2: 0 n, Exponent of 10 3: 5 Z Loc [ Windspeed ]
19: End (P95);;Wind Direction
20: AC Half Bridge (P5) 1: 1 Reps 2: 25 2500 mV 60 Hz Rejection Range 3: 9 SE Channel 4: 1 Excite all reps w/Exchan 1 5: 2500 mV Excitation 6: 6 Loc [ Wind_Dir ] 7: 720 Mult 8: 0.0 Offset
;Rain Bucket Gauge
21: Pulse (P3) 1: 1 Reps 2: 1 Pulse Channel 1 3: 2 Switch Closure, All Counts 4: 7 Loc [ RainGauge ] 5: 0.254 Mult 6: 0 Offset;################# Begin Mux program code and Wiring Comments #################;---------------AM16/32 w/switch set to 4x16 -----------------------------;;CR10X Datalogger ------------------------ AM16/32 Multiplexer (switch = 4x16);C1----------------------- Reset;C2----------------------- CLK;C3----------------------- Common Even Low;C4----------------------- to SW 12V CTRL for CS500;12V---------------------- 12 V;Gnd---------------------- Gnd;SE11--------------------- Common Even High

;SE8---------------------- Common Odd L;SE7---------------------- Common Odd H;----------------------------------------------- Pyranometer;SE6---------------------- Pyranometer (green);SE6---------------------- Jump to AG;SE5---------------------- Pyro (white);G ----------------------- Clear;----------------------------------------------- Temp/RH;SE4---------------------- CS500 RH (brown);SE3---------------------- CS500-Temp (black);SW12V-------------------- Red;;----------------------------------------------- Rain Gauge Bucket;P1----------------------- Black;G------------------------ White;G------------------------ Clear;----------------------------------------------- Wind;P2----------------------- Wind (black);G------------------------ White;G------------------------ Clear;------------------------------------------------TC Reference,107 Probe;CR10X-------------------- 107 Probe is connected to the CR10X;E2----------------------- Black;SE1---------------------- Red;AG----------------------- Purple;G ----------------------- Clear;---------------------------------------------------------------;--- CS616 Connections (Moisture Probes) Connect to the Multiplexer ---------;All CS616 RED'S ------------------- TO -- CR10X 12V;ALL CS616 BLACK's------------------ TO--- CR10X Ground;ALL CS616 CLEAR'S ----------------- TO--- CR10X Ground;CS616#1 ORANGE (Enable) ---------- TO--- AM 16/32 Bank#1_2L;CS616#1 GREEN (Signal) ---------- TO--- AM 16/32 Bank#1_2H;;CS616#1 ORANGE (Enable) ---------- TO--- AM 16/32 Bank#1_4L;CS616#1 GREEN (Signal) ---------- TO--- AM 16/32 Bank#1_4H;;Use Even Numbered Banks Only;;----------------------------------------------------------------;;---Thermocouple Connections on the Multiplexer ---------------------------;TC#1 (High/Red & White wire) --------------- TO-- AM 16/32 BANK#1_1H;TC#1 (low/White wire) ---------------- TO-- AM 16/32 BANK#1_1L;;TC#2 (High/Red & White wire) --------------- TO-- AM 16/32 BANK#1_3H;TC#2 (low/White wire) ---------------- TO-- AM 16/32 BANK#1_3L;;Use Odd Numbered Banks Only;;;;------TC Reference Temp --------------
22: Temp (107) (P11) 1: 1 Reps

2: 1 SE Channel 3: 2 Excite all reps w/E2 4: 10 Loc [ TC_Ref ] 5: 1.0 Mult 6: 0.0 Offset;Turn Multiplexer On23: Do (P86) 1: 41 Set Port 1 High
24: Do (P86) 1: 43 Set Port 3 High
25: Beginning of Loop (P87) 1: 0 Delay 2: 4 Loop Count;---------Mux clcok pulse-------- 26: Do (P86) 1: 72 Pulse Port 2
27: Excitation with Delay (P22) 1: 2 Ex Channel 2: 0 Delay W/Ex (0.01 sec units) 3: 2 Delay After Ex (0.01 sec units) 4: 0 mV Excitation
28: Thermocouple Temp (DIFF) (P14) 1: 1 Reps 2: 22 7.5 mV 60 Hz Rejection Range 3: 4 DIFF Channel 4: 1 Type T (Copper-Constantan) 5: 10 Ref Temp (Deg. C) Loc [ TC_Ref ] 6: 11 -- Loc [ TC_1 ] 7: 1.0 Mult 8: 0.0 Offset
29: Period Average (SE) (P27) 1: 1 Reps 2: 4 200 kHz Max Freq @ 2 V Peak to Peak, Period Output 3: 11 SE Channel 4: 100 No. of Cycles 5: 1 Timeout (0.01 sec units) 6: 15 -- Loc [ Moist1 ] 7: 1.0 Mult 8: 0.0 Offset
30: End (P95);--------Set MUX Port Low------------31: Do (P86) 1: 51 Set Port 1 Low;--------Set CS616 lines low---------32: Do (P86) 1: 53 Set Port 3 Low;--------Convert CS616 Period to VWC-------33: Beginning of Loop (P87) 1: 0 Delay 2: 4 Loop Count

34: Polynomial (P55) 1: 1 Reps 2: 15 -- X Loc [ Moist1 ] 3: 19 -- F(X) Loc [ VWC_1 ] 4: -0.0663 C0 5: -0.0063 C1 6: 0.0007 C2 7: 0.0 C3 8: 0.0 C4 9: 0.0 C5
35: End (P95);end CS616 period to VWC conversion;;### calibrate thermocouples #########;36: Z=X+F (P34) 1: 11 X Loc [ TC_1 ] 2: 0.45 F 3: 11 Z Loc [ TC_1 ]
37: Z=X+F (P34) 1: 12 X Loc [ TC_2 ] 2: 0.28 F 3: 12 Z Loc [ TC_2 ]
38: Z=X+F (P34) 1: 13 X Loc [ TC_3 ] 2: 0.21 F 3: 13 Z Loc [ TC_3 ]
;####### End MUX Program #############;;Save Output Flag High and save 60 minute data to final storage ---
39: If time is (P92) 1: 0 Minutes (Seconds --) into a 2: 60 Interval (same units as above) 3: 10 Set Output Flag High (Flag 0)
40: Set Active Storage Area (P80)^4190 1: 1 Final Storage Area 1 2: 60 Array ID
41: Real Time (P77)^12029 1: 1220 Year,Day,Hour/Minute (midnight = 2400)
42: Average (P71)^1696 1: 4 Reps 2: 1 Loc [ Temp_int ]
43: Totalize (P72)^22065

1: 1 Reps 2: 7 Loc [ RainGauge ]
44: Sample (P70)^32717 1: 2 Reps 2: 8 Loc [ Battery ]
45: Wind Vector (P69)^2694 1: 1 Reps 2: 0 Samples per Sub-Interval 3: 0 S, é1, & å(é1) Polar 4: 5 Wind Speed/East Loc [ Windspeed ] 5: 6 Wind Direction/North Loc [ Wind_Dir ];----############ Output MUX Readings #################------;;Average Thermocouples 46: Average (P71)^10084 1: 3 Reps 2: 11 -- Loc [ TC_1 ];Average Soil Moisture Content 47: Average (P71)^29313 1: 4 Reps 2: 15 -- Loc [ Moist1 ];Average VWC
48: Average (P71)^3807 1: 4 Reps 2: 19 -- Loc [ VWC_1 ]
*Table 2 Program 02: 0.0000 Execution Interval (seconds)
*Table 3 Subroutines
End Program
-Input Locations-1 Temp_int 1 1 12 CS500temp 1 1 13 CS500RH 1 2 24 Pyronomet 1 2 25 Windspeed 1 2 26 Wind_Dir 1 1 17 RainGauge 1 1 18 Battery 1 1 19 Temp107 1 1 110 TC_Ref 1 1 111 TC_1 1 2 212 TC_2 1 2 113 TC_3 1 2 114 _________ 0 0 015 Moist1 1 2 116 Moist2 1 1 017 Moist3 1 1 018 Mosit4 1 1 019 VWC_1 1 1 1

20 VWC_2 1 1 021 VWC_3 1 1 022 VWC_4 1 1 023 _________ 0 0 024 _________ 0 0 025 _________ 0 0 026 _________ 0 0 027 _________ 0 0 028 _________ 0 0 029 _________ 0 0 0-Program Security-000000000000-Mode 4--Final Storage Area 2-0-CR10X ID-0-CR10X Power Up-3-CR10X Compile Setting-3-CR10X RS-232 Setting--1-DLD File Labels-0-Final Storage Labels-0,60,41901,Year_RTM,120291,Day_RTM1,Hour_Minute_RTM2,Temp_int_AVG~1,16962,CS500temp_AVG~22,CS500RH_AVG~32,Pyronomet_AVG~43,RainGauge_TOT~7,220654,Battery~8,327174,Temp107~95,Windspeed_S_WVT~5,26945,Wind_Dir_D1_WVT~65,Wind_Dir_SD1_WVT~66,TC_1_AVG~11,100846,TC_2_AVG~126,TC_3_AVG~137,Moist1_AVG~15,293137,Moist2_AVG~167,Moist3_AVG~177,Mosit4_AVG~188,VWC_1_AVG~19,38078,{VWC_2_AVG~208,VWC_3_AVG~218,VWC_4_AVG~22

Appendix D: Salmonella in Sewer Sludge
E. coli (cfu/g) Salmonella Fecal ColiformsCountry Influent Biosolids Influent Biosolids Influent BiosolidsPoland (1) 104 -108 102 - 105 102-103 102- n.d.United Kingdom (2)
105-106 3.36 log removal *
60-80/g DS
4 log removal**
Spain (3) 105 104 108*** 8 log removal
United States (4)
107-109++
+102-104+ 18
MPN/g++106-108++
+106-108++++
Biosolids in this table refers to treated solid residuals which have been assayed after full retention time in secondary sludge digesters
(1) Mechanical-Biological Sewage Treatment Plant in Torun, Polandn.d.= none detected. The level of E. coli in the influent flow of wastewater at the sewage treatment plant in Torun, Poland ranges from 108 to 104 (Paluszak, et al., 2003). The concentration of E. coli in the effluent after biological treatment was 105 to 102, representing log reductions between 1-4.
Paluzsek declares the main factor contributing to pathogen reduction in the sewage treatment plant in Torun to be biological treatment. However, the rate of reduction also varies seasonally. During the warmer months the survival rate of E. coli was reduced. Similarly, the greatest survival rate of salmonella spp. is recorded below 10◦C and at a %TS> 5 (Sobsey, M.D., 1989)
(2) United Kingdom (Horan, et al., 2004). *E. coli was not spiked
**Feed sludge was spiked with S. senftenberg to 1.28 x 10⁷ during primary sludge digestion and held for 12 days at 35◦C. The sludge was then retained in a second digester for 15 days at 15◦C (open to the atmosphere). A log of 2.23 occurred in the primary digester while a log reduction of 2 occurred in the second stage of digestion.
(3) WWTP at Gava-Viladecans, Spain (Moce-Llivina, L., et al., 2003). ***Sludge was seeded with Salmonella chloreraesuis to 108. After temperature-time regimes of 80◦C for 60 minutes and 60◦C for 30 minutes, the salmonella was reduced by 8 logs.
(4) +Information for WWTPS in the United States. (Metcalf & Eddy, 2003). ++Number of salmonella per gram of digested biosolids is 18 MPN/gram.. Number of Salmonella per gram of raw biosolids is 1800 MPN/g. (Epstein, Land Application of Sewage Sludge and Biosolids, 2003). Thermal destruction = death within 1 hour at 56C, death within 15 to 20 min at 60C, p. 115).

+++Metcalf & Eddy, 2003, p.111
++++Experimental data gathered from the summer of 2003 and 2004 (Choi, Pepper, and Gerba, Pathogen Reduction in Biosolids in Response to Stress Units, 2003 & 2004). 106 detected in Pima County WWTP, 108 detected from LA County biosolids trucked for 5 hours from California to Quartzsite, Arizona. MPN assays performed on treated anaerobically digested biosolids (Ina Road WWTP) prior to centrifugation have yielded results of 40 MPN/4g, 156 MPN/4g, 1440 MPN/4g, and 1920 MPN/4g.