biosonar performance of foraging beaked whales (mesoplodon ... · by 6·db·dh–1, but that the...
TRANSCRIPT

181
Species belonging to the suborders Odontoceti (toothedwhales) and Microchiroptera (bats), encompassing one in fiveof all known mammalian species, explore their environment bylistening for echoes from emitted ultrasonic sound pulses. Thisprocess was coined echolocation by Griffin (1958) after aseries of seminal studies showing that bats orient themselvesand acquire aerial prey by the aid of biosonar. The 800 speciesof microchiropteran bats inhabit a suite of diverse niches, andnumerous studies have demonstrated that different bat specieshave adapted their sonar systems to the differing acousticcharacteristics of these habitats (Neuweiler, 1990; Schnitzlerand Kalko, 2001; Denzinger et al., 2004) and to the size andbehavior of their prey (Fenton, 1984; Barcley and Brigham,1991; Surlykke et al., 1993; Houston et al., 2004). Toothedwhales encompassing some 70 species also inhabit verydifferent aquatic environments from shallow freshwater riversto mesopelagic depths where they target diverse groups ofprey. But little is known about how toothed whales may haveadapted their sonar systems to different habitats, foragingniches and prey types, and how they use echolocation in theprocess of orientation and foraging.
Vespertilionid bats targeting aerial prey employ astereotypical pattern of vocal behavior as they detect, locateand capture prey items. Their acoustic behavior duringforaging can generally be divided into search, approach andterminal phases (Griffin, 1958; Griffin et al., 1960). The searchphase in FM bats involves emission of 2–10·ms, frequency-modulated (FM) cries with stable interpulse (or interclick)intervals (IPI or ICI) (Kalko and Schnitzler, 1998). Theapproach phase starts when a prey is detected at maximumranges of 2–4·m (Kalko, 1995). The ICI decreases during theapproach phase as a function of reducing range between theensonified prey and the approaching bat (Kalko, 1995; Wilsonand Moss, 2004), and the pulse duration is often reduced toavoid overlap between emitted pulses and returning echoes(Cahlander et al., 1964). In the terminal phase just prior tocapture, the repetition rate rapidly increases to some 200·Hzand pulse durations are reduced along with amplitudes and insome cases the pulse frequencies (Griffin et al., 1960;Simmons et al., 1979; Schnitzler and Kalko, 1998). A completecapture event of aerial prey by Vespertilionids normally lastsless than 500·ms, and it is repeated many hundreds of times
The Journal of Experimental Biology 208, 181-194Published by The Company of Biologists 2005doi:10.1242/jeb.01327
Toothed whales (Cetacea, odontoceti) emit sound pulsesto probe their surroundings by active echolocation. Non-invasive, acoustic Dtags were placed on deep-divingBlainville’s beaked whales (Mesoplodon densirostris) torecord their ultrasonic clicks and the returning echoesfrom prey items, providing a unique view on how a whaleoperates its biosonar during foraging in the wild. Theprocess of echolocation during prey capture in this speciescan be divided into search, approach and terminal phases,as in echolocating bats. The approach phase, defined bythe onset of detectable echoes recorded on the tag for clicksequences terminated by a buzz, has interclick intervals(ICI) of 300–400·ms. These ICIs are more than amagnitude longer than the decreasing two-way travel timeto the targets, showing that ICIs are not given by thetwo-way-travel times plus a fixed, short lag time. Duringthe approach phase, the received echo energy increasesby 10.4(±2)·dB when the target range is halved,
demonstrating that the whales do not employ range-compensating gain control of the transmitter, as has beenimplicated for some bats and dolphins. The terminal/buzzphase with ICIs of around 10·ms is initiated when one ormore targets are within approximately a body length ofthe whale (2–5·m), so that strong echo returns in theapproach phase are traded for rapid updates in theterminal phase. It is suggested that stable ICIs in thesearch and approach phases facilitate auditory sceneanalysis in a complex multi-target environment, and that aconcomitant low click rate allows the whales to maintainhigh sound pressure outputs for prey detection anddiscrimination with a pneumatically driven, bi-modalsound generator.
Key words: beaked whale, Mesoplodon densirostris, echolocation,biosonar, automatic gain control, foraging, click interval, soundproduction.
Summary
Introduction
Biosonar performance of foraging beaked whales (Mesoplodon densirostris)
P. T. Madsen1,*, M. Johnson1, N. Aguilar de Soto2, W. M. X. Zimmer3 and P. Tyack1
1Woods Hole Oceanographic Institution, Woods Hole, MA 02543, USA, 2La Laguna University, Tenerife, CanaryIslands, Spain and 3NATO Undersea Research Center, viale San Bartolomeo 400, 19138 La Spezia, Italy
*Author for correspondence (e-mail: [email protected])
Accepted 11 October 2004
THE JOURNAL OF EXPERIMENTAL BIOLOGY
182
during a nocturnal foraging bout (Kalko, 1995). Other batfamilies make constant frequency (CF) or short-CF, Doppler-sensitive cries for prey finding and orientation (Schnitzler andKalko, 2001), underlining the diversity of biosonar signals inthe microchiropteran suborder.
In addition to the gradual reduction in ICI with reducingtwo-way travel time (TWT) during the approach phase, the batmakes sensori–motor adjustments of its vocal apparatus, andauditory and neural systems in a response to the incomingechoes (Simmons, 1989; Wadsworth and Moss, 2000). Insituations where both the vocalizing bat (if using a constantoutput) and its prey target can be modeled as point sources, thereceived echo levels will increase by a factor of four when thetarget range is reduced by a factor two, meaning that the echolevel increases 12·dB when the target range is halved (plus gainfrom reduced frequency-dependent absorption). To avoid highsensation levels of echoes from targets at close quarters andthe possible deafening effects of their own vocalizations, atleast some bat species have automatic gain control (AGC) intheir auditory system (Henson, 1965; Suga and Jen, 1975).They reduce the sensitivity of the ear just prior to a vocalizationby tightening their stapedial muscles in the middle ear, andthen gradually increase the sensitivity during the next 6.4·mscorresponding to a target range of 1.4·m (Suga and Jen, 1975).This gain control on the receiving side is further augmented byneural attenuation in the midbrain operating synchronouslywith the vocalizations (Suga and Schlegel, 1973). Kick andSimmons (1984) reported that AGC stabilizes the echosensation level of the ear with an 11·dB attenuation perdistance halved (dh) that almost compensates for the12·dB·dh–1 increase in echo level. They argued thatstabilization of the echo sensation levels renders target-specificvariations in target strength (such as wing fluttering) moredetectable to the bats (Kick and Simmons, 1984), and thatstable echo levels may serve to minimize amplitude-inducedlatency shifts that disrupt accurate ranging (Simmons andKick, 1984). Using a different experimental setup, Hartley(1991) concluded that the AGC only reduces the received levelby 6·dB·dh–1, but that the bats concomitantly lower the sourcelevels by 6·dB·dh–1 to achieve a similar stabilizing effecton echo-sensation levels. An AGC of 6·dB·dh–1 on thetransmitting side was also reported by Kobler et al. (1985), butboth studies used targets with much higher target strengths thannatural prey, so it remains at present unresolved if AGC of thetransmitter also applies for free-ranging bats in foragingsituations. In summary, bats approaching a target in the labreduce their ICIs and use AGC in the auditory system, andmaybe also in their vocal apparatus, in adaptation to thetemporal and energetic changes in the returning echoes.
With the exception of visual observations of bottom-foraging dolphins (Herzing and Santos, 2004), there is little ifany information about how free-ranging toothed whales useecholocation to find and collect their prey. Studies in captivityhave shown that harbor porpoises terminate a prey pursuit witha buzz similar to that reported for bats (Verfuss et al., 2000).Recordings from narwhals (Miller et al., 1995) and sperm
whales (Madsen et al., 2002a; Miller et al., 2004) duringforaging show that they too terminate capture with fast clicktrains, but the biosonar analogy to bats remains conjectural.There is no information about the ranges at which prey targetsare detected or how echolocating toothed whales respond andadapt to incoming prey echoes.
However, elaborate studies on trained dolphins haveprovided great insight into the detection capabilities ofecholocation for artificial targets in different experimentalsettings (Au, 1993). Delphinids have a dynamic soundproduction apparatus capable of varying the frequency peaksof clicks by more than an octave (Moore and Pawloski, 1990).In addition, dolphins can modify click source levels by 60·dBor more depending on the acoustic environment and thedetection task (Au, 1993). Bottlenose dolphins can detect steeltargets at ranges in excess of 100·m in high background noiselevels by producing clicks with source levels up to228·dB·relative·to·(re.)·1·µPa (peak-to-peak; pp) (Au et al.,1974). During target detection experiments, the bottlenosedolphin waits 19–45·ms after the return of the echo beforeemitting a new click. This additional lag time (after the roundtrip travel time of the sonar signal) has been interpreted as adelay for echo reception, processing and activation of motor-systems (Au, 1993). Thus, most delphinids in target-detectionexperiments use ICIs given by the TWT plus a short, fixed lagtime (Au, 1993).
When delphinids are in small tanks or are faced with easydetection tasks at close range, they produce clicks withsource levels (SL) below 200·dB·re.·1·µPa (pp) (Au, 1993).Conversely, if the echo-to-noise ratio (ENR) is reduced, thedolphins will often increase their SLs to improve the ENR (Au,1993). This picture has recently been supported by data fromseveral species of free-ranging delphinids echolocating on ahydrophone array. Au and Benoit-Bird (2003) reported that thesource levels of dolphins’ clicks are range dependent with areduction of 6dB·dh–1 as the dolphins approach the array.Au and Benoit-Bird (2003) argued that this is the result of anAGC built into the sound production apparatus where ICIadjustments to the reduction in TWT causes a reduction in theacoustic output. Thus, echolocating dolphins have a dynamicvocal-motor apparatus in which source level increases withICI. If the dolphin adjusts to reducing target range by reducingICI with TWT, this relation between SL and ICI may functionas an AGC that stabilizes echo levels. Still, it remains unknownhow toothed whale biosonar operates when free-ranginganimals echolocate for prey.
In a recent brief communication, we reported acoustic datacollected with archival Dtags, which store acoustic and divingdata (Johnson and Tyack, 2003), on two elusive deep-divingbeaked whale species, Ziphius cavirostris and Mesoplodondensirostris (Johnson et al., 2004). On the basis of detectableprey echoes, we showed that beaked whales echolocate forfood during deep foraging dives by using ultrasonic clicks toensonify their prey. Foraging events were terminated by a rapidclick train, coined a buzz in analogy with bats, and impactsounds could often be heard when the prey was caught during
P. T. Madsen and others
THE JOURNAL OF EXPERIMENTAL BIOLOGY
183Biosonar performance of foraging beaked whales
increased dynamic acceleration by the foraging whale(Johnson et al., 2004).
In the present study, we explore the biosonar performanceof one of the beaked whale species, Mesoplodon densirostris,in the context of the dynamic auditory scene (Moss andSurlykke, 2001) it encounters during foraging. We quantifyhow an echolocating toothed whale responds to information inincoming prey echoes, and we discuss the results in the lightof reported biosonar performance and dynamics of bats anddolphins. We demonstrate that beaked whales do not employAGC of their transmitter as they close in on a target, and thatthe ICIs are not given by TWTs plus a fixed, short lag time inthe approach phase of prey pursuits. We suggest that stableICIs in the search and approach phases facilitate auditory sceneanalysis in a multi-target environment, and that the longdurations of these ICIs allow the whale to maintain high sound-pressure outputs for prey detection and selection with apneumatically driven sound generator.
Materials and methodsHabitat, animals and tag deployment
Field work was performed off El Hierro in the CanaryIslands during October, 2003. At the El Hierro field site,foraging Blainville’s beaked whales (Mesoplodon densirostrisL.) can be found less than 4·km off shore. Blainville’s beakedwhales (from here on Mesoplodon) are among the smallerbeaked whales with an adult body length of around 4.5·m andweigh ~600·kg (Mead, 1989). They are found in tropical andtemperate waters, and stomach contents from stranded animalshave shown that they forage on mesopelagic squid and fish(Mead, 1998).
For tagging, surfacing whales were slowly approached in asmall inflatable boat. The tags were deployed by a handheldpole and attached with suction cups. Due to positive buoyancy,the tags floated to the surface after a maximum programmedrelease time of 16·h after which they were recovered by takingbearings to built-in radio transmitters. Two adult Blainville’sbeaked whales were tagged for 15.4·h (male, eight deepforaging dives) and 3·h (female or juvenile, two deep foragingdives), respectively. The 3·h tag was placed behind the head(Fig.·1), whereas the tag on the second animal was attachedcloser to the dorsal fin. The whales were foraging on the slopeof an underwater ridge with variable water depths between 500and 1500·m.
Recordings
Data were collected with Dtags that recorded sound andorientation of the tagged animal (Johnson and Tyack, 2003).Sounds were recorded with 16·bit resolution and 96·kHzsampling rate, providing an overall flat (±1·dB) frequencyresponse of the recording system from 0.6 to 45·kHz. Lowfrequency flow noise was reduced by a built-in 1·pole(6·dB·octave–1) high-pass filter (–3·dB at 400·Hz), and aliasingwas avoided by use of sigma–delta conversion. The tags store3·GByte of data corresponding to 16·h of sound recordings
when using a loss-less audio-compression algorithm. Nosounds saturated the recorder with clipping levels at181·dB·re.·1·µPa (peak).
The whales were not recorded making sounds at depthsshallower than 200·m. However, they clicked almostcontinuously during foraging dives at depth (Johnson et al.,2004). Echoes from incoming prey could be detected inrecordings from both tag deployments, but the 3·h tag, placedin the most favorable position behind the head (Fig.·1),rendered the only echo trains with sufficient signal-to-noise-ratios (SNR) for quantification of the echoes. We cannot provethat the incoming echoes are from prey items (Johnson etal., 2004) but, as demonstrated here, there is significantcircumstantial evidence to support that parsimoniouscontention. However, the discussion and the results should bemade with this inference in mind. The quantitative data on theechoes are derived from two dives of a single individual,whereas the general acoustic performance is based on both tagdeployments. A large number of echoes were recorded inlonger or shorter trains. It is assumed that the changes inrecorded echo properties reflect the echo changes received bythe auditory system of the whale with the exception that thetag recordings were limited to 48·kHz, excluding click and theecho energy above the Nyquist frequency of the tag (Johnsonet al., 2004). This, however, is not likely to affect the relativeenergetic changes in the recorded echoes.
Targets may be ensonified during several clicks, but thensuddenly disappear either because the prey item moved out ofthe beam as the whale ensonified a different target or becausethe prey successfully eluded the predator. To maximize theprobability that we analyzed echo trains from targets the whaleactually intended to capture and therefore tried hard to keepwithin the sonar beam, we selected sequences containingechoes terminated within 5·s before a buzz, strongly suggestingcapture of the ensonified prey (Johnson et al., 2004). Secondly,we only included echolocation runs during which the echodelay was halved to ensure enough data points for evaluationof possible range effects on ICI and AGC. These criteriarestricted the number of echolocation runs to 11 out the totalnumber of 48 foraging buzzes made by the favorably taggedwhale during two foraging dives.
Analysis
Analysis and signal processing was performed with custom-
SL TS T
RL, AO
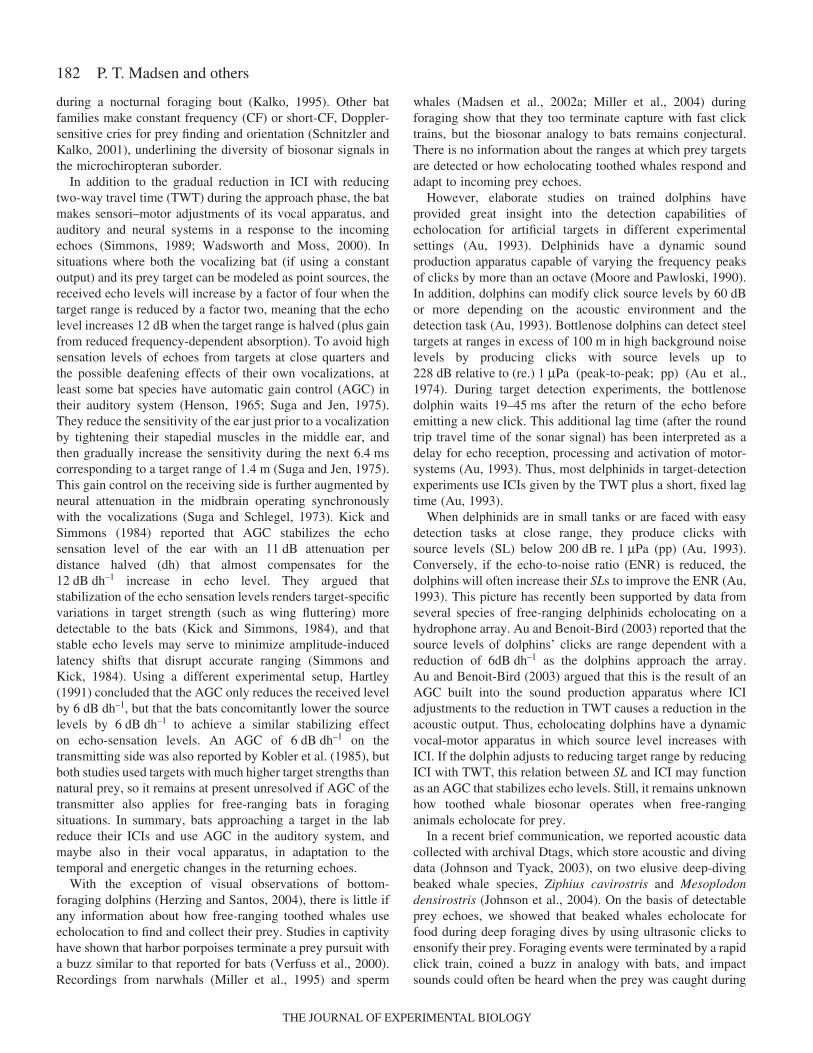
1 m
Fig.·1. Echolocation in Mesoplodon densirostris, showing theplacement of the tag, and definition of acoustic parameters. SL issource level, TS is target strength, RL and AO are the echo levels andapparent output received at the tag, respectively, and T marks theunknown target.
THE JOURNAL OF EXPERIMENTAL BIOLOGY

184
written software in Matlab 6.0 (Mathworks; Natick, MA,USA). Click rates were derived with a click-detecting routinemeasuring the time differences between the peaks of theenvelopes generated from consecutive clicks in a train. Therelative acoustic output of the echolocating whale wasestimated by quantifying the relative peak–peak amplitudes ona dB scale. Because the tag was placed behind the soundgenerator and out of the forward directed acoustic beam of theanimals (Johnson et al., 2004), these measures do not reflect
source levels, but we argue in line with Madsen et al. (2002b),that changes up or down in source level may also be seen asincreases or reductions in the apparent output (AO) of clicksas measured by the tags (Fig.·1). Changing the shape ordirectivity of the acoustic beam could partly invalidate such aconjecture, but we have no means of assessing if that is takingplace or not.
Echolocation sequences were identified by scrolling throughthe click trains with a Matlab script presenting sound power ona color scale in a click versus time plot, with a 25·s window.Returning echoes have a frequency content similar to on-axisclicks measured from clicking conspecifics that ensonify thetagged animal (Johnson et al., 2004). The clicks recorded fromthe tagged animal contain both weak high-frequencycomponents and more-powerful low-frequency componentsgenerated by recording on, or close to, the sound generator. Tomeasure the delay between the emitted click and the returningecho (Fig.·2B), we cross-correlated a window containing theoutgoing click and the returning echo with an on-axis clickrecorded in the far field from an echolocating conspecific(Fig.·2C). The delay was subsequently determined by the timedifference between peaks of the envelopes of the Hilbert-transformed cross-correlator output (Fig. 2C). The delay equalsthe TWT of the sound pulse to and from the ensonified target,and the delay can thus be converted to target range if the soundspeed is known. Using the Leroy equation (Urick, 1983), thesound speed at 400–800·m depth was calculated to be
P. T. Madsen and others
0
1
A
B
–12
+12
5 ms
–15
+15
5 s
Buzz
Regular clicks
Echo
Click
A
5 ms
∆tC
Am
plitu
dePa
scal
sPa
scal
s
Fig.·2. (A) Click train of an echolocation event with a search,approach and buzz phases. Arrow marks start of the approach phase,where the first echo is received by the tag. (B) Expanded version ofone of the clicks in A, showing the emitted click and a returning preyecho. (C) Envelope of the cross-correlation of the waveform displayedin B. ∆t marks the delay between the sounds and thereby the two-way-travel time (TWT).
0.01 0.1 1
–30
–20
–10
0
App
aren
t out
put (
dB, p
p)
ICI (s)
Buzz clicks
Regular clicks
Fig.·3. Bimodal sound production in Mesoplodon. Apparent output(AO) plotted against the corresponding interclick interval (ICI) for5000 clicks from sequences randomly picked for both of the taggedanimals. Regular clicks have ICIs between 200 and 500·ms with anemphasis around 400·ms. Buzz clicks have apparent outputs15–20·dB lower and ICIs between 5 and 20·ms. Note the fewintermediate data points between the two clusters of regular and buzzclicks, emphasizing the rapid transition between the regular clickmode and the buzz mode of the sound generator.
THE JOURNAL OF EXPERIMENTAL BIOLOGY

185Biosonar performance of foraging beaked whales
1485·m·s–1 based on a temperature of 9°C and a salinity of38‰ measured with a CTD (conductivity–temperature–depth)probe at 800·m depth on location.
The mammalian ear operates as an energy detector thatintegrates intensity over a time window τ (Green and Swets,1966). When evaluating the echo levels received by the taggedwhale, the echo return should therefore be quantified by energyflux density and not sound pressure (Au, 1993, 2004). Energyflux density (dB·re.·1·µPa2·s) is given by the RMS intensityover an integration window T:
RMS sound pressure of returning echoes was calculated byintegrating the square of the instantaneous pressure, p(t), as afunction of time over the echo signal duration (T) (Equation 1)relative to the same integral over the same time, T, of acalibration signal based on the sensitivity of the tag. Echoduration (T) was determined from the relative signal energyderived by integrating the squared pressure over a 1·ms timewindow symmetrical around the peak of the echo envelope.
Onset of the signal was defined as the point at which 5% ofthe relative signal energy was reached, and the terminationof the signal was defined as the point at which 95% ofthe relative signal energy was reached. A 15·kHz high-passfilter (–12·dB·octave–1) was applied to improve SNR. Theintegration time for the auditory system of Mesoplodon isunknown, so the best available figure is the echo duration, T,of 250 to 320·µs, which is close to the measured integrationtime of 263·µs for the bottlenose dolphin (Au et al., 1988).
ResultsAcoustic behavior
No sounds were recorded from the whales within 200·m ofthe surface, but the animals start to click at a depth between200 and 500·m during the descent part of foraging dives. Thewhales generally produce click sounds in two modes: regularclicking and buzzes (Figs·2A,·3). Regular clicking involvesproduction of long click trains with regular ICIs of200–500·ms, with most ICIs being around 400·m (Fig.·3). Thebimodal nature of the sound production is seen in Fig.·3, wherethe apparent output (AO) is plotted as function of interclickintervals (ICI). It is seen that buzz clicks are produced with AO
⌠⎮⌡
(1)
T
0p2(t)dt
1
T10 log =
⎛⎜⎝
⎞⎟⎠
⌠⎮⌡
T
0p2(t)dt10 log + 10 log(T)
(p(t)=instant pressure) .
⎛⎜⎝
⎞⎟⎠
Fig.·4. (A) Clicks and echoes displayed in an echogram from a 250·s time span during the acoustically active part of a Mesoplodon dive. Timeis on the x-axis, and the y-axis gives the time elapsed from the emitted click to the returning echoes expressed as target range by using the two-way-travel time at a sound speed of 1485·m·s–1 akin to the upside-down display of an echosounder. The dense line at time 0 on the y-axis isthe emitted clicks that trigger the beginning of the time window. Sound intensity is indicated by the color, so that yellow is strong and blue isweak. Note the many trains of incoming echoes throughout the sequence, and the bottom echoes emerging between 48 and 95·s. (B) Expandedversion of the first 25·s shown in A, showing that the whale at times passes through clouds of echo sources without engaging in capture attempts.(C) Expanded version of 16·s shown in A, showing a click train with echoes from an approaching prey target that is terminated by a buzz duringcapture. The target echoes disappear right at the buzz and reappear around 224·s during the buzz. Note that the ICIs of the buzz are so shortthat the clicks are displayed repeatedly like harmonics within a time span of 26·ms corresponding to a two-way-travel path of 20·m.
THE JOURNAL OF EXPERIMENTAL BIOLOGY

186
some 15·dB lower than regular clicks(Figs·2A,·3), and that the interclickintervals are between 5 and 20·ms.Regular clicks, conversely, have highapparent outputs, and long ICIsbetween 200 and 500·ms, withclustering around 400·ms (Fig.·3).
The regular clicks are directional,ultrasonic transients with durationsaround 250·µs and energy from20·kHz and up to, and probablybeyond, the Nyquist frequency of therecording system at 48·kHz (Johnsonet al., 2004). The whales produce4000–5000 regular clicks per dive.Buzzes, terminating some of theregular click trains, consist of 2–5·shigh-repetition click trains where theICIs are reduced to 5–20·ms(Fig.·2A). When analyzing assumedon-axis buzz clicks from nearbyconspecifics ensonifying the taggedanimal (sensu Johnson et al., 2004),buzz clicks have the same apparentfrequency content (with thereservation of limited sampling) asregular clicks, but their duration isaround 150·µs, which is only aroundhalf of that of regular clicks (Johnsonet al., 2004). The whales produce 23buzzes on average per dive (Johnsonet al., 2004), amounting to some10,000 buzz clicks per dive. Thus, atotal of some 15,000 clicks areproduced during each foraging dive.
The acoustic behavior ofecholocating Mesoplodons duringforaging can be divided into threephases: the search, approach andterminal phases. The initial searchphase part of the vocal behaviorinvolves long (10–30·s) trains ofregular clicks interrupted by shortpauses of 1–3·s. During regularclicking with ICIs between 300 and400·ms, the whale passes throughclouds of echo sources of varyingecho return relating to the targetstrength (TS) and the degree ofensonification (Fig.·4A). This phaseis coined the search phase. When thewhales eventually focus on an objectby ensonifying it during severalclicks, the approach phase is initiated(Figs·4C,·5). This phase ischaracterized by a continuous
P. T. Madsen and others
–15 –10 –5 0 50
2
4
6
8
10
12
14
Ran
ge (
m)
Time (s)
B
A
Pseudo distance
Echo distance
Buzz
2
0
–2
–4
–20–15
–10–5
05
Dep
th (
m)
Distance N–S (m)
–90
0
90
Distance
E–W (m)
710
705
700
695
Fig.·5. (A) 3-D rendering of a pseudotrack computed for a foraging event at 675·m depth. Theblack line marks the swimming track of the whale moving right to left through a 20·s periodaround a prey capture event. Each dot on the line marks a click, and it is seen how the whaleswitches from regular click mode to buzz mode (bordered by circles in 2-D projections) witha high repetition rate. Coloration of the dots signifies the roll of the animal. Dark blue is dorsalside up and red is ventral side up. Note how the animal rolls up-side down during the preyinterception. Dashed lines in x–y, x–z and y–z planes show the projected 2-D swim track. Theclosing speed is 1·m·s–1. (B) Plot of time before impact (time 0) and target range estimatedfrom a constant swimming speed (blue line) relative to the target and measured from the echodelay (red line and dots). The good fit supports the conjecture that the impact sound was causedby interception of the ensonified target and that movements of the whale were associated withcapture of that given prey.
THE JOURNAL OF EXPERIMENTAL BIOLOGY
187Biosonar performance of foraging beaked whales
ensonification of the target as the whale homes inon it (Figs·2,·4C). Thus, the approach phase isdefined as the part of a click train where the whalescontinuously ensonify a prey item and receiveechoes all the way to the transition to thebuzz/terminal phase. Echoes will often becomeweaker or disappear from the tag recordings justbefore a buzz (Figs·4C,·5B), and then reappearwithin the buzz. This phenomenon probably relatesto the fact that the whales start to roll upside downjust before or in the beginning of the buzz, and thebody shades the tag for the echoes (Fig.·5A). Thereare no apparent differences between the ICI and AObetween the search and the approach phases. Thethird and terminal phase is characterized by a rapidincrease of the click rate, the so-called buzz, and areduction in the apparent output (Figs·2A,·3). Thewhale intercepts the prey in the terminal phase oftenby a sharp turn and increased dynamic acceleration(Fig.·5A,B).
The auditory scene (Bregman, 1990) of theecholocating whales comprises passive and activeparts. The passive part arises from sounds in theacoustic Umwelt of the whales (Bregman, 1990),whereas the active part is generated and, to somedegree, controlled by the echolocating whale byensonification of objects in the water column (sensuMoss and Surlykke, 2001). Fig.·4 provides an example of theactive part of the auditory scene of an echolocating beakedwhale. Fig.·4A shows a one-dimensional version of a three-dimensional auditory scene as received by the whale in a 250·stime span. The complexity of the auditory scene isdemonstrated by the large number of echoes when the whalepasses and ensonifies target aggregations in the water column(Fig.·4B). On top of echoes coming from marine organismswithin a range of some 20·m, the whale also receives strongechoes from the bottom when directing its sonar beam towardsit (Fig.·4A). Thus, the actively generated acoustic Umwelt ofbeaked whales is a perceptually complex, multi-target auditoryscene of echoes with temporal, spatial and spectral differences.
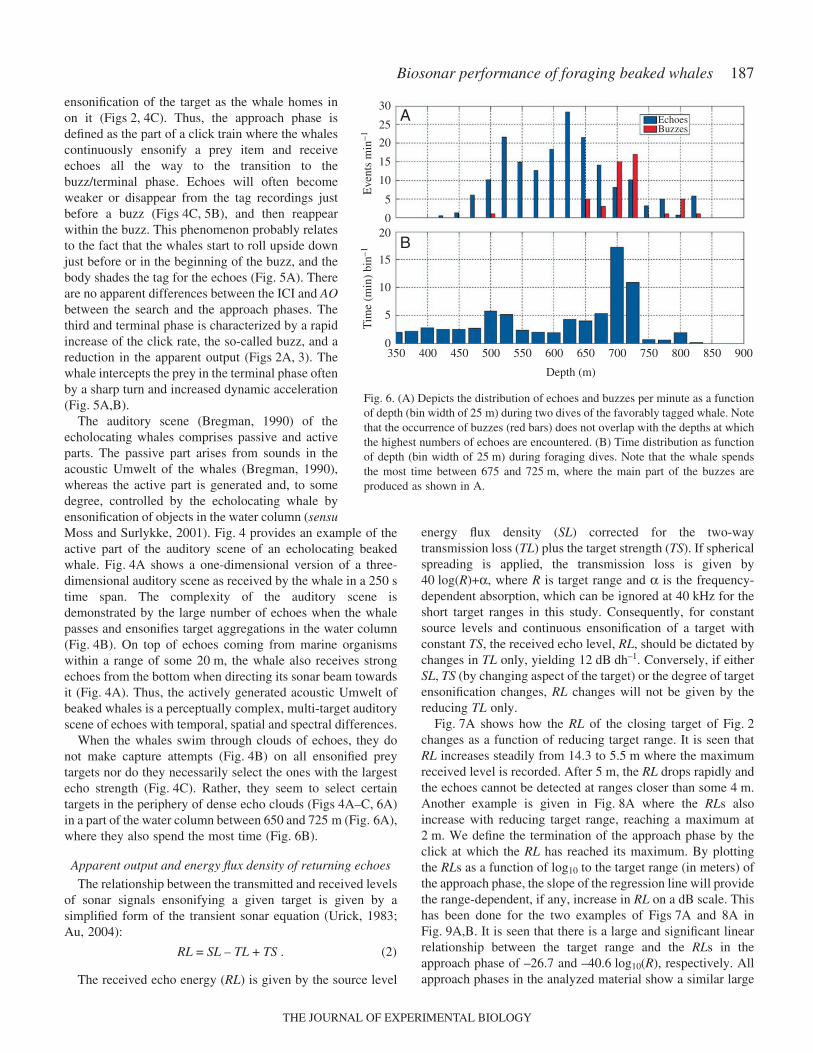
When the whales swim through clouds of echoes, they donot make capture attempts (Fig.·4B) on all ensonified preytargets nor do they necessarily select the ones with the largestecho strength (Fig.·4C). Rather, they seem to select certaintargets in the periphery of dense echo clouds (Figs·4A–C,·6A)in a part of the water column between 650 and 725·m (Fig.·6A),where they also spend the most time (Fig.·6B).
Apparent output and energy flux density of returning echoes
The relationship between the transmitted and received levelsof sonar signals ensonifying a given target is given by asimplified form of the transient sonar equation (Urick, 1983;Au, 2004):
RL = SL – TL + TS . (2)
The received echo energy (RL) is given by the source level
energy flux density (SL) corrected for the two-waytransmission loss (TL) plus the target strength (TS). If sphericalspreading is applied, the transmission loss is given by40·log(R)+α, where R is target range and α is the frequency-dependent absorption, which can be ignored at 40·kHz for theshort target ranges in this study. Consequently, for constantsource levels and continuous ensonification of a target withconstant TS, the received echo level, RL, should be dictated bychanges in TL only, yielding 12·dB·dh–1. Conversely, if eitherSL, TS (by changing aspect of the target) or the degree of targetensonification changes, RL changes will not be given by thereducing TL only.
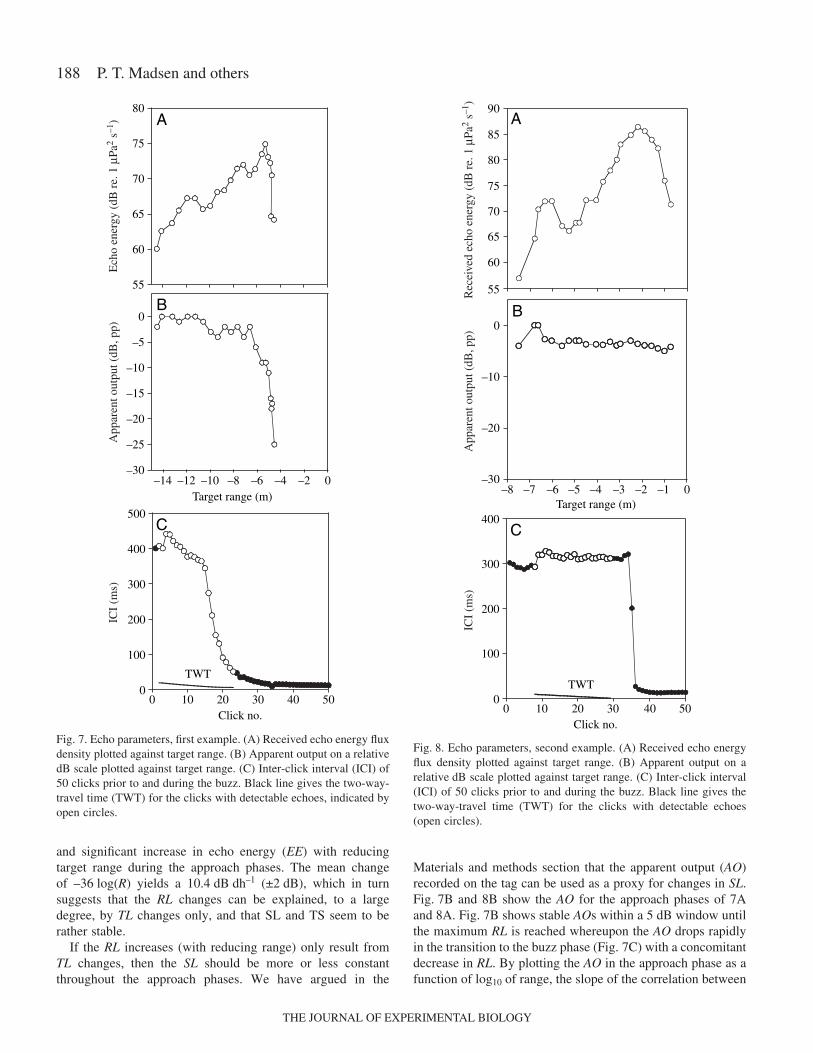
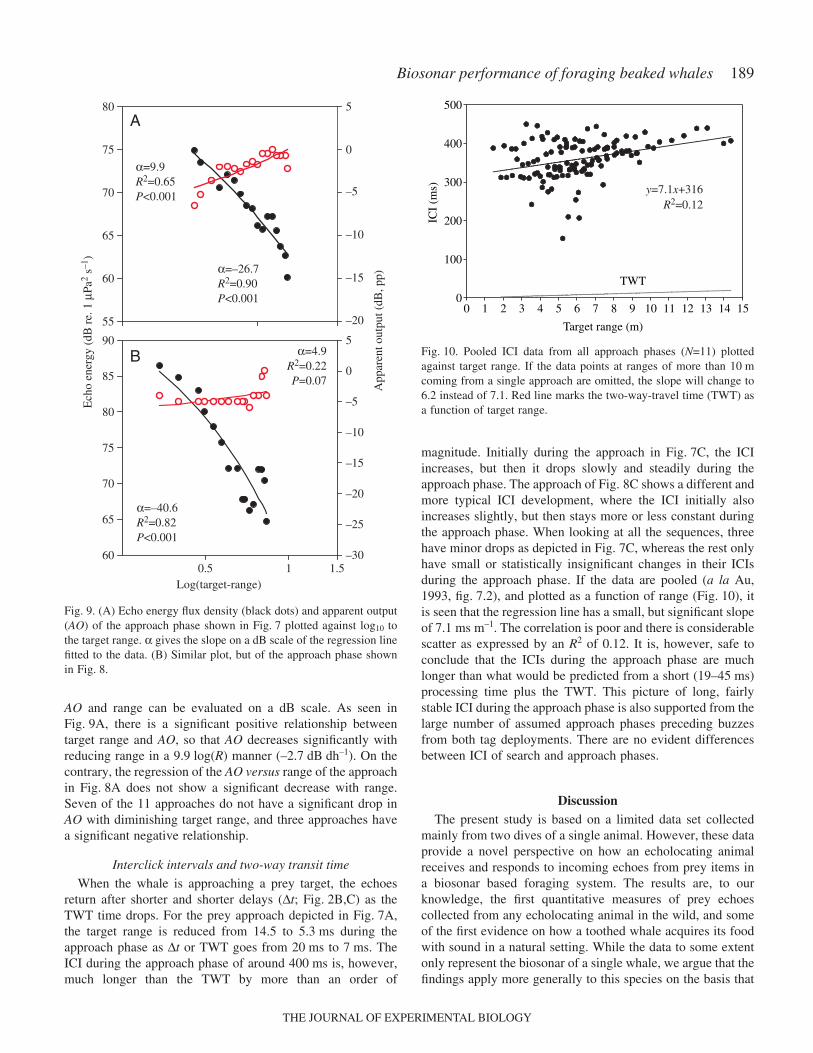
Fig.·7A shows how the RL of the closing target of Fig.·2changes as a function of reducing target range. It is seen thatRL increases steadily from 14.3 to 5.5·m where the maximumreceived level is recorded. After 5·m, the RL drops rapidly andthe echoes cannot be detected at ranges closer than some 4·m.Another example is given in Fig.·8A where the RLs alsoincrease with reducing target range, reaching a maximum at2·m. We define the termination of the approach phase by theclick at which the RL has reached its maximum. By plottingthe RLs as a function of log10 to the target range (in meters) ofthe approach phase, the slope of the regression line will providethe range-dependent, if any, increase in RL on a dB scale. Thishas been done for the two examples of Figs·7A and 8A inFig.·9A,B. It is seen that there is a large and significant linearrelationship between the target range and the RLs in theapproach phase of –26.7 and –40.6·log10(R), respectively. Allapproach phases in the analyzed material show a similar large
350 400 450 500 550 600 650 700 750 800 850 9000
5
10
15
20
Tim
e (m
in)
bin–1
Depth (m)
B
0
5
10
15
20
25
30
Eve
nts
min
–1
A EchoesBuzzes
Fig.·6. (A) Depicts the distribution of echoes and buzzes per minute as a functionof depth (bin width of 25·m) during two dives of the favorably tagged whale. Notethat the occurrence of buzzes (red bars) does not overlap with the depths at whichthe highest numbers of echoes are encountered. (B) Time distribution as functionof depth (bin width of 25·m) during foraging dives. Note that the whale spendsthe most time between 675 and 725·m, where the main part of the buzzes areproduced as shown in A.
THE JOURNAL OF EXPERIMENTAL BIOLOGY
188
and significant increase in echo energy (EE) with reducingtarget range during the approach phases. The mean changeof –36·log(R) yields a 10.4·dB·dh–1 (±2·dB), which in turnsuggests that the RL changes can be explained, to a largedegree, by TL changes only, and that SL and TS seem to berather stable.
If the RL increases (with reducing range) only result fromTL changes, then the SL should be more or less constantthroughout the approach phases. We have argued in the
Materials and methods section that the apparent output (AO)recorded on the tag can be used as a proxy for changes in SL.Fig.·7B and 8B show the AO for the approach phases of 7Aand 8A. Fig.·7B shows stable AOs within a 5·dB window untilthe maximum RL is reached whereupon the AO drops rapidlyin the transition to the buzz phase (Fig.·7C) with a concomitantdecrease in RL. By plotting the AO in the approach phase as afunction of log10 of range, the slope of the correlation between
P. T. Madsen and others
55
60
65
70
75
80
Target range (m)–14 –12 –10 –8 –6 –4 –2 0
–30
–25
–20
–15
–10
–5
0
Click no.
0
100
200
300
400
500C
B
A
TWT
0 10 20 30 40 50
App
aren
t out
put (
dB, p
p)IC
I (m
s)E
cho
ener
gy (
dB r
e. 1
µPa
2 s–1
)
Fig.·7. Echo parameters, first example. (A) Received echo energy fluxdensity plotted against target range. (B) Apparent output on a relativedB scale plotted against target range. (C) Inter-click interval (ICI) of50 clicks prior to and during the buzz. Black line gives the two-way-travel time (TWT) for the clicks with detectable echoes, indicated byopen circles.
C
B
A
TWT
55
60
65
70
75
80
85
90
Target range (m)–7–8 –6 –5 –4 –3 –2 –1 0
–30
–20
–10
0
Click no.
0
100
200
300
400
0 10 20 30 40 50
App
aren
t out
put (
dB, p
p)IC
I (m
s)R
ecei
ved
echo
ene
rgy
(dB
re.
1 µ
Pa2
s–1)
Fig.·8. Echo parameters, second example. (A) Received echo energyflux density plotted against target range. (B) Apparent output on arelative·dB scale plotted against target range. (C) Inter-click interval(ICI) of 50 clicks prior to and during the buzz. Black line gives thetwo-way-travel time (TWT) for the clicks with detectable echoes(open circles).
THE JOURNAL OF EXPERIMENTAL BIOLOGY
189Biosonar performance of foraging beaked whales
AO and range can be evaluated on a dB scale. As seen inFig.·9A, there is a significant positive relationship betweentarget range and AO, so that AO decreases significantly withreducing range in a 9.9·log(R) manner (–2.7·dB·dh–1). On thecontrary, the regression of the AO versus range of the approachin Fig.·8A does not show a significant decrease with range.Seven of the 11 approaches do not have a significant drop inAO with diminishing target range, and three approaches havea significant negative relationship.
Interclick intervals and two-way transit time
When the whale is approaching a prey target, the echoesreturn after shorter and shorter delays (∆t; Fig.·2B,C) as theTWT time drops. For the prey approach depicted in Fig.·7A,the target range is reduced from 14.5 to 5.3·ms during theapproach phase as ∆t or TWT goes from 20·ms to 7·ms. TheICI during the approach phase of around 400·ms is, however,much longer than the TWT by more than an order of
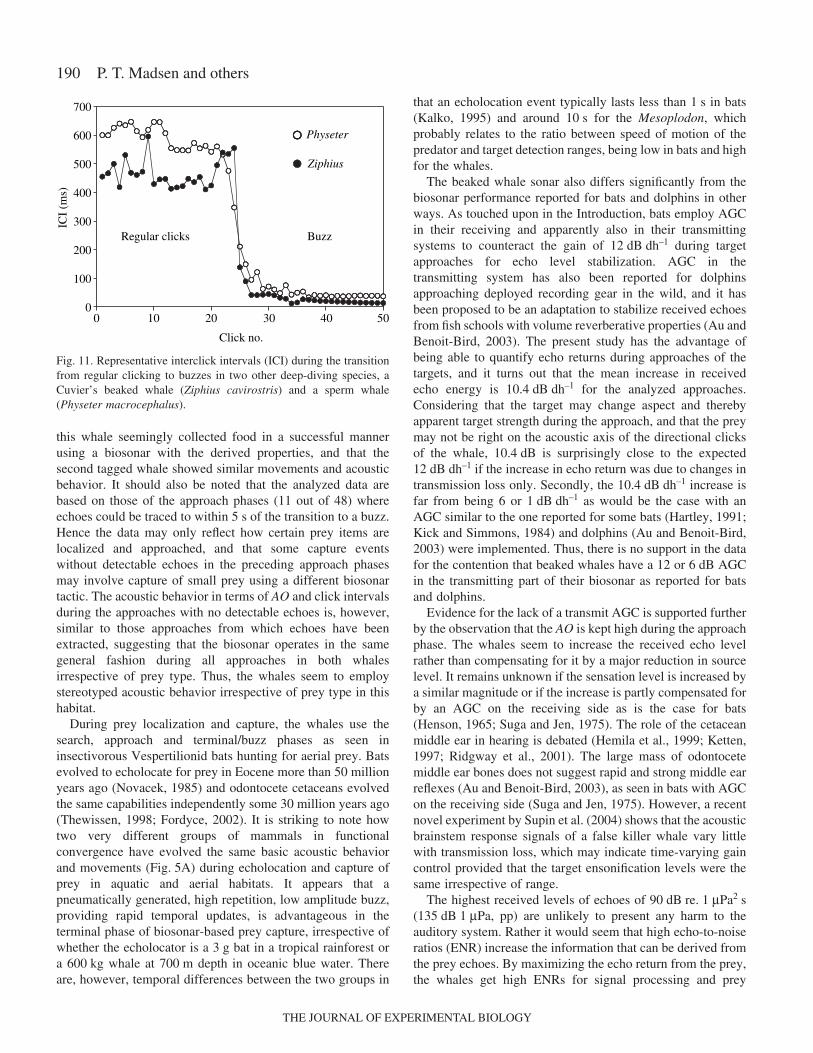
magnitude. Initially during the approach in Fig.·7C, the ICIincreases, but then it drops slowly and steadily during theapproach phase. The approach of Fig.·8C shows a different andmore typical ICI development, where the ICI initially alsoincreases slightly, but then stays more or less constant duringthe approach phase. When looking at all the sequences, threehave minor drops as depicted in Fig.·7C, whereas the rest onlyhave small or statistically insignificant changes in their ICIsduring the approach phase. If the data are pooled (a la Au,1993, fig.·7.2), and plotted as a function of range (Fig.·10), itis seen that the regression line has a small, but significant slopeof 7.1·ms·m–1. The correlation is poor and there is considerablescatter as expressed by an R2 of 0.12. It is, however, safe toconclude that the ICIs during the approach phase are muchlonger than what would be predicted from a short (19–45·ms)processing time plus the TWT. This picture of long, fairlystable ICI during the approach phase is also supported from thelarge number of assumed approach phases preceding buzzesfrom both tag deployments. There are no evident differencesbetween ICI of search and approach phases.
DiscussionThe present study is based on a limited data set collected
mainly from two dives of a single animal. However, these dataprovide a novel perspective on how an echolocating animalreceives and responds to incoming echoes from prey items ina biosonar based foraging system. The results are, to ourknowledge, the first quantitative measures of prey echoescollected from any echolocating animal in the wild, and someof the first evidence on how a toothed whale acquires its foodwith sound in a natural setting. While the data to some extentonly represent the biosonar of a single whale, we argue that thefindings apply more generally to this species on the basis that
0.5 1.560
65
70
75
80
85
90
–30
–25
–20
–15
–10
–5
0
5
–20
–15
–10
–5
0
5
55
60
65
70
75
80A
α=4.9R2=0.22P=0.07
α=–40.6R2=0.82P<0.001
Log(target-range)
B
1
α=–26.7R2=0.90P<0.001
α=9.9R2=0.65P<0.001
App
aren
t out
put (
dB, p
p)
Ech
o en
ergy
(dB
re.
1 µ
Pa2
s–1)
Fig.·9. (A) Echo energy flux density (black dots) and apparent output(AO) of the approach phase shown in Fig.·7 plotted against log10 tothe target range. α gives the slope on a dB scale of the regression linefitted to the data. (B) Similar plot, but of the approach phase shownin Fig.·8.
Target range (m)
15141312111098765432100
100
200
300
400
500
TWT
R2=0.12y=7.1x+316
ICI
(ms)
Fig.·10. Pooled ICI data from all approach phases (N=11) plottedagainst target range. If the data points at ranges of more than 10·mcoming from a single approach are omitted, the slope will change to6.2 instead of 7.1. Red line marks the two-way-travel time (TWT) asa function of target range.
THE JOURNAL OF EXPERIMENTAL BIOLOGY
190
this whale seemingly collected food in a successful mannerusing a biosonar with the derived properties, and that thesecond tagged whale showed similar movements and acousticbehavior. It should also be noted that the analyzed data arebased on those of the approach phases (11 out of 48) whereechoes could be traced to within 5·s of the transition to a buzz.Hence the data may only reflect how certain prey items arelocalized and approached, and that some capture eventswithout detectable echoes in the preceding approach phasesmay involve capture of small prey using a different biosonartactic. The acoustic behavior in terms of AO and click intervalsduring the approaches with no detectable echoes is, however,similar to those approaches from which echoes have beenextracted, suggesting that the biosonar operates in the samegeneral fashion during all approaches in both whalesirrespective of prey type. Thus, the whales seem to employstereotyped acoustic behavior irrespective of prey type in thishabitat.
During prey localization and capture, the whales use thesearch, approach and terminal/buzz phases as seen ininsectivorous Vespertilionid bats hunting for aerial prey. Batsevolved to echolocate for prey in Eocene more than 50 millionyears ago (Novacek, 1985) and odontocete cetaceans evolvedthe same capabilities independently some 30 million years ago(Thewissen, 1998; Fordyce, 2002). It is striking to note howtwo very different groups of mammals in functionalconvergence have evolved the same basic acoustic behaviorand movements (Fig.·5A) during echolocation and capture ofprey in aquatic and aerial habitats. It appears that apneumatically generated, high repetition, low amplitude buzz,providing rapid temporal updates, is advantageous in theterminal phase of biosonar-based prey capture, irrespective ofwhether the echolocator is a 3·g bat in a tropical rainforest ora 600·kg whale at 700·m depth in oceanic blue water. Thereare, however, temporal differences between the two groups in
that an echolocation event typically lasts less than 1·s in bats(Kalko, 1995) and around 10·s for the Mesoplodon, whichprobably relates to the ratio between speed of motion of thepredator and target detection ranges, being low in bats and highfor the whales.
The beaked whale sonar also differs significantly from thebiosonar performance reported for bats and dolphins in otherways. As touched upon in the Introduction, bats employ AGCin their receiving and apparently also in their transmittingsystems to counteract the gain of 12·dB·dh–1 during targetapproaches for echo level stabilization. AGC in thetransmitting system has also been reported for dolphinsapproaching deployed recording gear in the wild, and it hasbeen proposed to be an adaptation to stabilize received echoesfrom fish schools with volume reverberative properties (Au andBenoit-Bird, 2003). The present study has the advantage ofbeing able to quantify echo returns during approaches of thetargets, and it turns out that the mean increase in receivedecho energy is 10.4·dB·dh–1 for the analyzed approaches.Considering that the target may change aspect and therebyapparent target strength during the approach, and that the preymay not be right on the acoustic axis of the directional clicksof the whale, 10.4·dB is surprisingly close to the expected12·dB·dh–1 if the increase in echo return was due to changes intransmission loss only. Secondly, the 10.4·dB·dh–1 increase isfar from being 6 or 1·dB·dh–1 as would be the case with anAGC similar to the one reported for some bats (Hartley, 1991;Kick and Simmons, 1984) and dolphins (Au and Benoit-Bird,2003) were implemented. Thus, there is no support in the datafor the contention that beaked whales have a 12 or 6·dB AGCin the transmitting part of their biosonar as reported for batsand dolphins.
Evidence for the lack of a transmit AGC is supported furtherby the observation that the AO is kept high during the approachphase. The whales seem to increase the received echo levelrather than compensating for it by a major reduction in sourcelevel. It remains unknown if the sensation level is increased bya similar magnitude or if the increase is partly compensated forby an AGC on the receiving side as is the case for bats(Henson, 1965; Suga and Jen, 1975). The role of the cetaceanmiddle ear in hearing is debated (Hemila et al., 1999; Ketten,1997; Ridgway et al., 2001). The large mass of odontocetemiddle ear bones does not suggest rapid and strong middle earreflexes (Au and Benoit-Bird, 2003), as seen in bats with AGCon the receiving side (Suga and Jen, 1975). However, a recentnovel experiment by Supin et al. (2004) shows that the acousticbrainstem response signals of a false killer whale vary littlewith transmission loss, which may indicate time-varying gaincontrol provided that the target ensonification levels were thesame irrespective of range.
The highest received levels of echoes of 90·dB·re.·1·µPa2·s(135·dB·1·µPa, pp) are unlikely to present any harm to theauditory system. Rather it would seem that high echo-to-noiseratios (ENR) increase the information that can be derived fromthe prey echoes. By maximizing the echo return from the prey,the whales get high ENRs for signal processing and prey
P. T. Madsen and others
Click no.
0
100
200
300
400
500
600
700
Physeter
Ziphius
BuzzRegular clicks
50403020100
ICI
(ms)
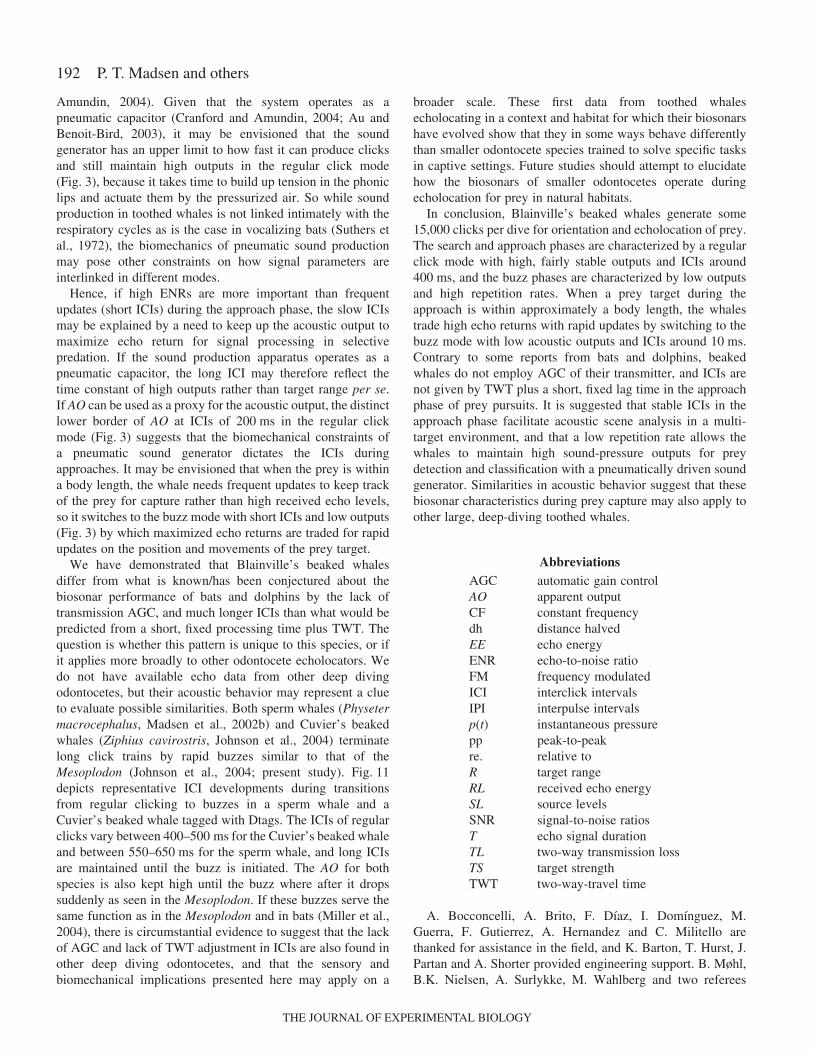
Fig.·11. Representative interclick intervals (ICI) during the transitionfrom regular clicking to buzzes in two other deep-diving species, aCuvier’s beaked whale (Ziphius cavirostris) and a sperm whale(Physeter macrocephalus).
THE JOURNAL OF EXPERIMENTAL BIOLOGY

191Biosonar performance of foraging beaked whales
classification. The fact that the whale ensonifies a large numberof targets with only engaging in a few pursuits (Figs·4A,B and6) suggests that the whale was selecting certain types of prey.In order to do so, it seems advantageous to gather as much echoinformation about the targets as early on in the approach aspossible to maximize the time for classification rather than justdetection. Selective foraging seems to be employed by somebats (Black, 1972; Houston et al., 2004), but not all species(Barcley and Brigham, 1994). For Mesoplodon, selectiveforaging does seem plausible in a heterogeneous preycommunity where long, deep dives render capture of prey withthe highest energy returns per dive effort beneficial. Dolphinshave acute discrimination capabilities (Roitblat et al., 1995)that will deteriorate with decreasing SNR. Thus, the lack ofAGC in the transmit system of beaked whales may serve tomaximize ENR for target classification in a selective foragingscheme to maximize energy return per unit dive effort. Futurestudies should test if selective foraging relates to nichesegregation in habitats with competitive resource partitioningamong deep diving odontocete species.
While the animals seem to maximize echo return during theapproach, there is little support for acoustic prey debilitation(Norris and Møhl, 1983) to occur. The identity of the sonartargets assumed to be prey is unknown, but stomach contentsof Mesoplodon densirostris suggest the prey are likely to besquid or deep water fish (Mead, 1989). If the whales were toexpose the prey to sound pressure levels of more than230·dB·re.·1·µPa (0-p) required to debilitate fish (Zagaeski,1987), they should continue to emit the high-powered clicks ofthe approach phase right up to the prey. Thus, considering thatthe sound pressure levels are reduced significantly at 2–5·mtarget range when a buzz is initiated, it seems that the soundsare used to locate the prey, but not to facilitate capture byacoustic debilitation. It remains, however, to be seen if squidand fish may be affected by high repetition, low level clicktrains in the buzzes.
A shared property of the biosonars of bats and dolphins isthat the animals do not emit a sound pulse before they havereceived the echo from the previous sound pulse (Cahlanderet al., 1964; Au, 1993). ICIs are, therefore, generally given bythe TWT plus a short lag time. The biosonar of theecholocating whales in the present study performs likewise inthat the whales do not emit a click before reception of theecho(s) from the previous click. The small, but significantslope of the regression line fitted to the pooled ICI againstrange (Fig.·10) suggest, at least in some approaches, a drop inICI with reducing range/TWT. However, the ICI between300 and 400·m during the approach phase of Mesoplodon isan order of magnitude longer than the ICIs of 20–50·msreported for dolphins echolocating at stationary targets atsimilar ranges (Au, 1993). Using the ICI and a lag time of some30·ms, as has been found in dolphins (Au, 1993), muchlarger target ranges would be predicted: (400·ms –30·ms)·� 1.485·m·ms–1·� 0.5·=·275·m. The lack of anintimate relationship between the ICI and TWT during theapproach phase is also very different from bats, where such a
correlation defines the onset of the approach phase acoustically(Simmons, 1989).
While ICIs of 300–400·ms may indicate the maximumrelevant target ranges during the initial search for preyaggregations during the descent part of the dive, they do notreflect the likely much shorter, actual target range whileforaging at depth. Recent studies have modeled the preydetection ranges of large delphinids to be 50–300·m (Au et al.,2004; Madsen et al., 2004) and, if Mesoplodons can generatethe same source levels as these delphinids of some220·dB·re.·1·µPa (pp), it is not inconceivable that the estimated275·m search range reflects detection ranges for preyaggregations during the descent part of the dive. But when theprey echo during approaches has been received and, probably,processed within the first 50·ms after emission of the clicks(Fig.·3A,B), it is puzzling why the whales would wait another300·ms before emission of the next click.
One possible answer to that question may relate to how thewhales perceptually organize and analyze the auditory scenepartly generated by their own clicks. Temporal control of vocalbehavior affects the perceptually guided segregation of manytargets in a complex, dynamic acoustic scene (Bregman, 1990),and bats have been inferred to implement auditory streamingby using stable ICIs in the search phase (Moss and Surlykke,2001). The auditory scene displayed in Fig.·4 shows that deep-diving Mesoplodons generate a complex, 3-D-multi-targetinput flow to the auditory system that also seems to call for asimilar perceptual organization. We propose that the stableICIs of foraging Mesoplodons may be another example of theacoustic streaming inferred for bats for perceptual processingof a dynamic, actively generated auditory scene comprisingback-scattering surroundings and prey targets (Moss andSurlykke, 2001).
Perceptual organization and processing of the auditory scenemay help the whales to identify patches of preferred prey, andto keep track of such patches in time and space. As exemplifiedin Fig.·6, the whale does not engage in foraging where the echodensity is the highest. Rather, it seems that the foraging occursin a simpler acoustic scene (Figs·4 and 6). By keeping the ICIslong and stable both in the search and in the approach phases,the animals may be able to keep more distant echo sources suchas prey patches and the bottom perceptually organized, so thatthis spatial and temporal information can be exploited eitherafter a successful capture or if the approach is aborted.
A second, and not mutually exclusive, explanation for themuch longer ICI than would be predicted from the TWT plusa short lag time, may relate to the biomechanics of the soundgenerator. Toothed whales generate sound by forcingpressurized air past monkey-lips-dorsal-bursae (MLDB)complexes in their foreheads (Ridgway et al., 1980; Cranfordet al., 1996). Emission of clicks is preceded by an air-pressurebuild up in the bony nares (Ridgway et al., 1980) thateventually overcomes the variable tension of the closedMLDB-complexes by which a click is generated either whenthe monkey (phonic) lips separate (Dubrowskiy and Giro,2004) or when they slap back together (Cranford and
THE JOURNAL OF EXPERIMENTAL BIOLOGY
192
Amundin, 2004). Given that the system operates as apneumatic capacitor (Cranford and Amundin, 2004; Au andBenoit-Bird, 2003), it may be envisioned that the soundgenerator has an upper limit to how fast it can produce clicksand still maintain high outputs in the regular click mode(Fig.·3), because it takes time to build up tension in the phoniclips and actuate them by the pressurized air. So while soundproduction in toothed whales is not linked intimately with therespiratory cycles as is the case in vocalizing bats (Suthers etal., 1972), the biomechanics of pneumatic sound productionmay pose other constraints on how signal parameters areinterlinked in different modes.
Hence, if high ENRs are more important than frequentupdates (short ICIs) during the approach phase, the slow ICIsmay be explained by a need to keep up the acoustic output tomaximize echo return for signal processing in selectivepredation. If the sound production apparatus operates as apneumatic capacitor, the long ICI may therefore reflect thetime constant of high outputs rather than target range per se.If AO can be used as a proxy for the acoustic output, the distinctlower border of AO at ICIs of 200·ms in the regular clickmode (Fig.·3) suggests that the biomechanical constraints ofa pneumatic sound generator dictates the ICIs duringapproaches. It may be envisioned that when the prey is withina body length, the whale needs frequent updates to keep trackof the prey for capture rather than high received echo levels,so it switches to the buzz mode with short ICIs and low outputs(Fig.·3) by which maximized echo returns are traded for rapidupdates on the position and movements of the prey target.
We have demonstrated that Blainville’s beaked whalesdiffer from what is known/has been conjectured about thebiosonar performance of bats and dolphins by the lack oftransmission AGC, and much longer ICIs than what would bepredicted from a short, fixed processing time plus TWT. Thequestion is whether this pattern is unique to this species, or ifit applies more broadly to other odontocete echolocators. Wedo not have available echo data from other deep divingodontocetes, but their acoustic behavior may represent a clueto evaluate possible similarities. Both sperm whales (Physetermacrocephalus, Madsen et al., 2002b) and Cuvier’s beakedwhales (Ziphius cavirostris, Johnson et al., 2004) terminatelong click trains by rapid buzzes similar to that of theMesoplodon (Johnson et al., 2004; present study). Fig.·11depicts representative ICI developments during transitionsfrom regular clicking to buzzes in a sperm whale and aCuvier’s beaked whale tagged with Dtags. The ICIs of regularclicks vary between 400–500·ms for the Cuvier’s beaked whaleand between 550–650·ms for the sperm whale, and long ICIsare maintained until the buzz is initiated. The AO for bothspecies is also kept high until the buzz where after it dropssuddenly as seen in the Mesoplodon. If these buzzes serve thesame function as in the Mesoplodon and in bats (Miller et al.,2004), there is circumstantial evidence to suggest that the lackof AGC and lack of TWT adjustment in ICIs are also found inother deep diving odontocetes, and that the sensory andbiomechanical implications presented here may apply on a
broader scale. These first data from toothed whalesecholocating in a context and habitat for which their biosonarshave evolved show that they in some ways behave differentlythan smaller odontocete species trained to solve specific tasksin captive settings. Future studies should attempt to elucidatehow the biosonars of smaller odontocetes operate duringecholocation for prey in natural habitats.
In conclusion, Blainville’s beaked whales generate some15,000 clicks per dive for orientation and echolocation of prey.The search and approach phases are characterized by a regularclick mode with high, fairly stable outputs and ICIs around400·ms, and the buzz phases are characterized by low outputsand high repetition rates. When a prey target during theapproach is within approximately a body length, the whalestrade high echo returns with rapid updates by switching to thebuzz mode with low acoustic outputs and ICIs around 10·ms.Contrary to some reports from bats and dolphins, beakedwhales do not employ AGC of their transmitter, and ICIs arenot given by TWT plus a short, fixed lag time in the approachphase of prey pursuits. It is suggested that stable ICIs in theapproach phase facilitate acoustic scene analysis in a multi-target environment, and that a low repetition rate allows thewhales to maintain high sound-pressure outputs for preydetection and classification with a pneumatically driven soundgenerator. Similarities in acoustic behavior suggest that thesebiosonar characteristics during prey capture may also apply toother large, deep-diving toothed whales.
AbbreviationsAGC automatic gain controlAO apparent outputCF constant frequency dh distance halvedEE echo energyENR echo-to-noise ratioFM frequency modulatedICI interclick intervals IPI interpulse intervals p(t) instantaneous pressurepp peak-to-peakre. relative toR target rangeRL received echo energySL source levelsSNR signal-to-noise ratiosT echo signal durationTL two-way transmission lossTS target strengthTWT two-way-travel time
A. Bocconcelli, A. Brito, F. Díaz, I. Domínguez, M.Guerra, F. Gutierrez, A. Hernandez and C. Militello arethanked for assistance in the field, and K. Barton, T. Hurst, J.Partan and A. Shorter provided engineering support. B. Møhl,B.K. Nielsen, A. Surlykke, M. Wahlberg and two referees
P. T. Madsen and others
THE JOURNAL OF EXPERIMENTAL BIOLOGY
193Biosonar performance of foraging beaked whales
provided analytical suggestions and constructive criticismon earlier versions of the manuscript. Funding for tagdevelopment was provided by the Cecil H. and Ida M. GreenAward and the US Office of Naval Research. Funding forfield work was provided by the Strategic EnvironmentalResearch and Development Program (SERDP) under programCS-1188 and the Packard Foundation. Fieldwork wassupported by University of La Laguna and Governments of ElHierro and the Canary Islands. Research was conducted underUS NMFS permits # 981-1578-02 and 981-1707-00 and apermit from the government of the Canary Islands. Thispublication is contribution number 11268 from the WoodsHole Oceanographic Institution.
ReferencesAu W. W. L. (1993). Sonar of Dolphins. New York: Springer Verlag. Au, W. W. L., Floyd, R. W., Penner, R. H. and Murchinson, A. E. (1974).
Measurement of echolocation signals of the Atlantic bottlenose dolphin,Tursiops truncatus Montagu, in open waters. J. Acoust. Soc. Am. 56, 1280-1290.
Au, W. W. L., Moore, P. W. and Pawloski, D. A. (1988). Detection ofcomplex echoes in noise by an echolocating dolphin. J. Acoust. Soc. Am.83, 662-668.
Au, W. W. L. (2004). A comparison of the sonar capabilities of bats anddolphins. In Echolocation in Bats and Dolphins (ed. J. Thomas, C. F. Mossand M. Vater). Chicago: Chicago University Press.
Au, W. W. L. and Benoit-Bird, K. J. (2003). Automatic gain control in theecholocation system of dolphins. Nature 423, 861-863.
Au, W. W. L., Ford, J. K., Horne, J. K. and Allman, K. A. N. (2004).Echolocation signals of free-ranging killer whales (Orcinus orca) andmodelling of foraging for Chinook salmon (Oncorhyncus tshawytscha). J.Acoust. Soc. Am. 115, 1-9.
Barclay, R. M. and Brigham, R. M. (1991). Prey detection, dietary nichebreadth, and body size in bats: why aerial insectivorous bats are so small?Am. Nat. 137, 693-703.
Barclay, R. M. and Brigham, R. M. (1994). Constraints on optimal foraging:a field test of prey discrimination by echolocating insectivorous bats. Anim.Behav. 48, 1013-1021.
Black, H. L. (1972). Differential exploitation of moths by the bats Eptesicusfuscus and Lasiurus cinereus. J. Mammol. 56, 598-601.
Bregman, A. S. (1990). Auditory Scene Analysis. Boston: MIT Press. Cahlander, D. A., McCue, J. J. G. and Webster, F. A. (1964). The
determination of distance by echolocating bats. Nature 201, 544-546.Cranford, T. W. and Amundin, M. (2004). Biosonar pulse production in
Odontocetes: The state of our knowledge. In Echolocation in Bats andDolphins (ed. J. Thomas, C. F. Moss and M. Vater), pp. 27-35. Chicago:University of Chigaco Press.
Cranford, T. W., Amundin, M. and Norris, K. S. (1996). Functionalmorphology and homology in the odontocete nasal complex: implicationsfor sound generation. J. Morphol. 228, 223-285.
Denzinger, A., Kalko, E. K. V. and Jones, G. (2004). Introduction:ecological and evolutionary aspects of echolocation in bats. In Echolocationin Bats and Dolphins (ed. J. Thomas, C. F. Moss and M. Vater), pp. 311-327. Chicago: Chicago University Press.
Dubrowskiy, N. and Giro, L. (2004). Modelling the Click-productionmechanism in the dolphin. In Echolocation in Bats and Dolphins (ed. J.Thomas, C. F. Moss and M. Vater), pp. 59-64. Chicago: University ofChicago Press.
Fenton, M. B. (1984). Echolocation: implications for the ecology andevolution of bats. Quart. Rev. Biol. 59, 33-53.
Fordyce, R. E. (2002). Cetacean Evolution. In Encyclopedia of MarineMammals (ed. W. A. Perrin, B. Wursig and J. G. Thewissen), pp. 214-220.San Diego: Academic Press.
Green, D. M. and Swets, J. A. (1966). Signal Detection Theory andPsychophysics. Los Altos: Peninsula Publishing.
Griffin, D. R. (1958). Listening in the Dark. New York: Cornell UniversityPress.
Griffin, D. R., Friend, J. H. and Webster, F. A. (1960). Targetdiscrimination by bats. J. Exp. Zool. 158, 155-168.
Hartley, D. J. (1991). Stabilization of perceived echo amplitudes inecholocating bats. I. Echo detection and automatic gain control in the bigbrown bat, Eptesicus fuscus, and the fishing bat, Noctilio leporinus. J.Acoust. Soc. Am. 91, 1120-1132.
Hemila, S., Nummela, S. and Reuter, T. (1999). A model of the odontocetemiddle ear. Hearing Res. 133, 82-97.
Henson, O. W., Jr (1965). The activity and function of the middle-ear musclesin echolocating bats. J. Physiol. 180, 871-887.
Herzing, D. L. and Santos, M. E. (2004). Functional aspects of echolocationin dolphins. In Echolocation in Bats and Dolphins (ed. J. Thomas, C. F.Moss and M. Vater), pp. 386-393. Chicago: Chicago University Press.
Houston, R. D., Boonman, A. and Jones, G. (2004). Do echolocationparameters restrict bats’ choice of prey. In Echolocation in Bats andDolphins (ed. J. Thomas, C. F. Moss and M. Vater), pp. 339-345. Chicago:Chicago University Press.
Johnson, M. P. and Tyack, P. L. (2003). A digital acoustic recording tag formeasuring the response of wild marine mammals to sound. IEEE J. OceanicEng. 28, 3-12.
Johnson, M. P., Madsen, P. T., Aguilar-De Soto, N., Zimmer, W. M. X.and Tyack, P. (2004). Beaked whales echolocate for prey. Proc. R. Soc.Lond. B. doi 10.1098.
Kalko, E. (1995). Insect pursuit, prey capture and echolocation in pipistrellebats (microchiroptera). Anim. Behav. 50, 861-880.
Kalko, E. and Schnitzler, H. U. (1998). How echolocating bats approach andacquire food. In Bat Biology and Conservation (ed. T. H. Kunz and P. A.Racey), pp. 197-204. Washington: Smithsonian Institution Press.
Ketten, D. R. (1997). Structure and function in whale ears. Bioacoustics 8,103-135.
Kick, S. A. and Simmons, J. A. (1984). Automatic gain control in the bat’ssonar receiver and the neuroethology of echolocation. J. Neurosci. 4, 2725-2737.
Kobler, J. B., Wilson, B. S., Henson, O. W. and Bishop, A. L. (1985). Echointensity compensation by echolocating bats. Hear. Res. 20, 99-108.
Madsen, P. T., Wahlberg, M. and Møhl, B. (2002a). Male sperm whale(Physeter macrocephalus) acoustics in a high latitude habitat: implicationsfor echolocation and communication. Behav. Ecol. Sociobiol. 53, 31-41.
Madsen, P. T., Payne, R., Kristiansen, N. U., Wahlberg, M., Kerr, I. andMoehl, B. (2002b). Sperm whale sound production studied with ultrasoundtime/depth- recording tags. J. Exp. Biol. 205, 1899-1906.
Madsen, P. T., Kerr, I. and Payne, R. (2004). Echolocation clicks of twofree-ranging delphinids with different food preferences: false killer whales(Pseudorca crassidens) and Risso’s dolphin (Grampus griseus). J. Exp.Biol. 207, 1811-1823.
Mead, J. G. (1989). Beaked whales of the genus Mesoplodon. In Handbookof Marine Mammals (ed. S. Ridgway and R. Harrison), pp. 349-364.London: Academic Press.
Miller, L. A., Pristed, J., Moehl, B. and Surlykke A. (1995). Click soundsfrom narhwals (Monodon monoceros) in Inglefield Bay, NorthwestGreenland. Mar. Mamm. Sci. 11, 491-502.
Miller, P. J. O., Johnson, M. and Tyack, P. L. (2004). Sperm whalebehaviour indicates use of echolocation click buzzes ‘creaks’ in preycapture. Proc. R. Soc. Lond. B doi 10.1098/rspb.2004.2863.
Moore, P. and Pawloski, J. (1990). Investigations on the control ofecholcation pulses in the dolphin (Tursiops truncatus). In Sensory Abilitiesof Cetaceans (ed. J. Thomas and R. Kastelein), pp. 305-316. New York:Plenum Press.
Moss, C. F. and Surlykke, A. (2001). Auditory scene analysis byecholocation in bats. J. Acoust. Soc. Am. 110, 2207-2226.
Neuweiler, G. (1990). Auditory adaptations for prey capture in echolocatingbats. Physiol. Rev. 70, 615-641.
Norris, K. S. and Møhl, B. (1983). Can Odontocetes debilitate prey withsound? Am. Nat. 122, 85-104.
Novacek, M. J. (1985). Evidence for echolocation in the oldest known bat.Nature 315, 140-141.
Ridgway, S. H., Carder, D. A., Green, R. F., Gaunt, S. L. and Evans, W.E. (1980). Electromyographic and pressure events in the nasolaryngealsystem of dolphins during sound production. In Animal Sonar Systems (ed.R. G. Busnel and J. F. Fish), pp. 239-249. New York: Plenum Press.
Ridgway, S. H., Carder, D. A., Kamolnick, T., Smith, R. R., Schlundt, C.E. and Elsberry, W. R. (2001). Hearing and whistling in the deep sea: depthinfluences whistle spectra but does not attenuate hearing by white whales(Delphinapterus leucas) (Odontoceti, Cetacea). J. Exp. Biol. 204, 3829-3841.
Roitblat, H. L., Helweg, D. and Harley, H. E. (1995). Echolocation and
THE JOURNAL OF EXPERIMENTAL BIOLOGY
194
imagery. In Sensory Systems of Aquatic Mammals (ed. R. Kastelein, J.Thomas and D. Helweg), pp. 171-181. Woerden: De Spil Publishers.
Schnitzler, H. U. and Kalko, E. K. V. (1998). How echolocating batsapproach and acquire food. In Bat Biology and Conservation (ed. T. H. Kunzand P. A. Racey), pp. 183-196. Washington: Smithsonian Institution Press.
Schnitzler, H. U. and Kalko, E. K. V. (2001). Echolocation by insect-eatingbats. Bioscience 51, 557-569.
Simmons, J. A. (1989). A view of the world through the bat’s ear: theformation of acoustic images in echolocation. Cognition 33, 155-199.
Simmons, J. A. and Kick, S. A. (1984). Physiological mechanisms for spatialfiltering and image enhancement in the sonar of bats. Annu. Rev. Physiol.46, 599-614.
Simmons, J. A., Fenton, M. B. and O’Farrell, M. J. (1979). Echolocationand pursuit of prey by bats. Science 203, 16-21.
Suga, N. and Jen, P. H. (1975). Peripheral control of acoustic signals in theauditory system of echolocating bats. J. Exp. Biol. 62, 277-311.
Suga, N. and Schlegel, P. A. (1973). Coding and processing in the auditorysystems of FM-signal-producing bats. J. Acoust. Soc. Am. 54, 174-190.
Supin, A. Y., Nachtigall, P. E., Au, W. W. L. and Breese, M. (2004). Theinteraction of outgoing echolocation pulses and echoes in the false killerwhale’s auditory system: evoked-potential study. J. Acoust. Soc. Am. 115,3218-3225.
Surlykke, A., Miller, L. A., Moehl, B., Andersen, B. B., Christensen-
Dalsgaard, J. and Joergensen, M. B. (1993). Echolocation in two verysmall bats from Thailand – Craseonycteris-Thonglongyai and Myotis-Siligorensis. Behav. Ecol. Sociobiol. 33, 1-12.
Suthers, R. A., Thomas, S. P. and Suthers, B. J. (1972). Respiration, wing-beat and ultrasonic pulse emission in an echolocating bat. J. Exp. Biol. 56,37-48.
Thewissen, J. G. (1998). The Emergence of Whales, Evolutionary Patterns inthe Origin of Cetacea. New York: Plenum Press.
Urick, R. J. (1983). Principles of Underwater Sound. Los Altos: PeninsulaPublishing.
Verfuss, U. K., Miller, L. A. and Schnitzler, H. U. (2000) Fish catch andecholocation behavior of the harbour porpoise (Phocoena phocoena).Proceedings of the fourteenth annual conference of the European CetaceanSociety.
Wadsworth, J. and Moss, C. F. (2000). Vocal control of acoustic informationfor sonar discriminations by the echolocating bat, Eptesicus fuscus. J.Acoust. Soc. Am. 107, 2265-2271.
Wilson, W. W. and Moss, C. F. (2004). Sensory-motor behavior of free-flyingFM bats during target capture. In Echolocation in Bats and Dolphins (ed.J. Thomas, C. F. Moss and M. Vater), pp. 22-26. Chicago: University ofChicago Press.
Zagaeski, M. (1987). Some observations on the prey stunning hypothesis.Mar. Mamm. Sci. 3, 275-279.
P. T. Madsen and others
THE JOURNAL OF EXPERIMENTAL BIOLOGY