biostatistics breakdown common statistical tests special thanks to: christyn mullen, pharm.d....
TRANSCRIPT

Biostatistics BreakdownCommon Statistical tests
Special thanks to:Christyn Mullen, Pharm.D.Clinical Pharmacy SpecialistJohn Peter Smith Hospital
1
Objectives
•Briefly review important terms needed to understand common types of statistical analysis
•Review the different types of data and how they determine what type of statistical analysis is appropriate to use
•Explore real examples of common statistical analysis and their relevance to that particular study
2
Types of Variables
•Independent▫Variables that occur regardless of other
variables or factors Intervention in a trial
•Dependent ▫Variables that are dependent upon other
variables or factors Outcome in a trial
3
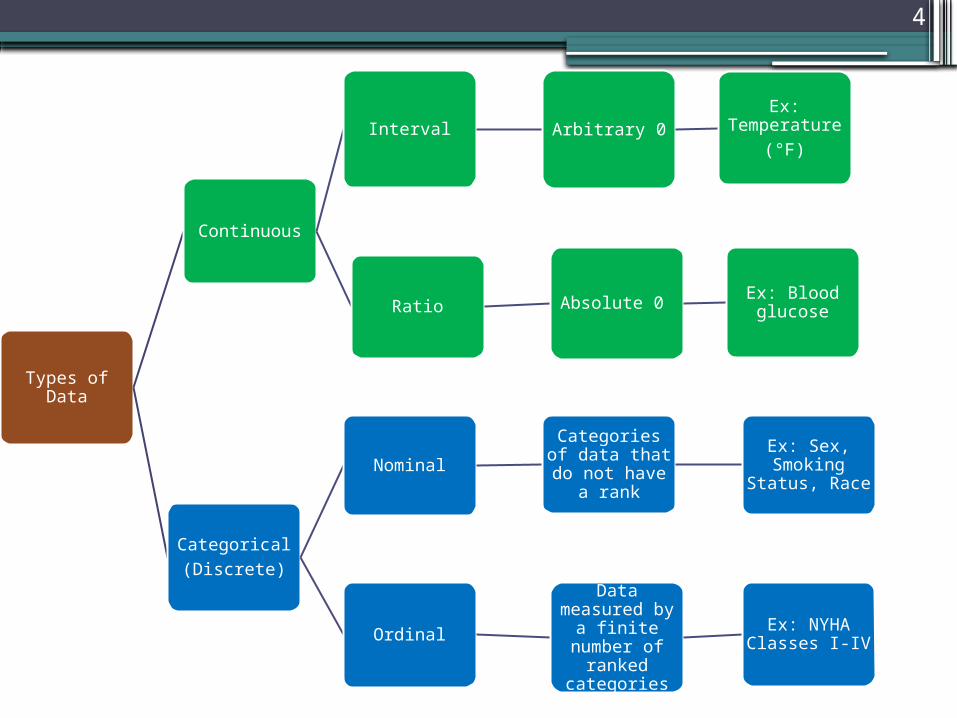
Types of Data
Continuous
Interval Arbitrary 0Ex:
Temperature(°F)
Ratio Absolute 0 Ex: Blood glucose
Categorical(Discrete)
Nominal
Categories of data that do not have a
rank
Ex: Sex, Smoking
Status, Race
Ordinal
Data measured by a finite number
of ranked categories
Ex: NYHA Classes I-IV
4
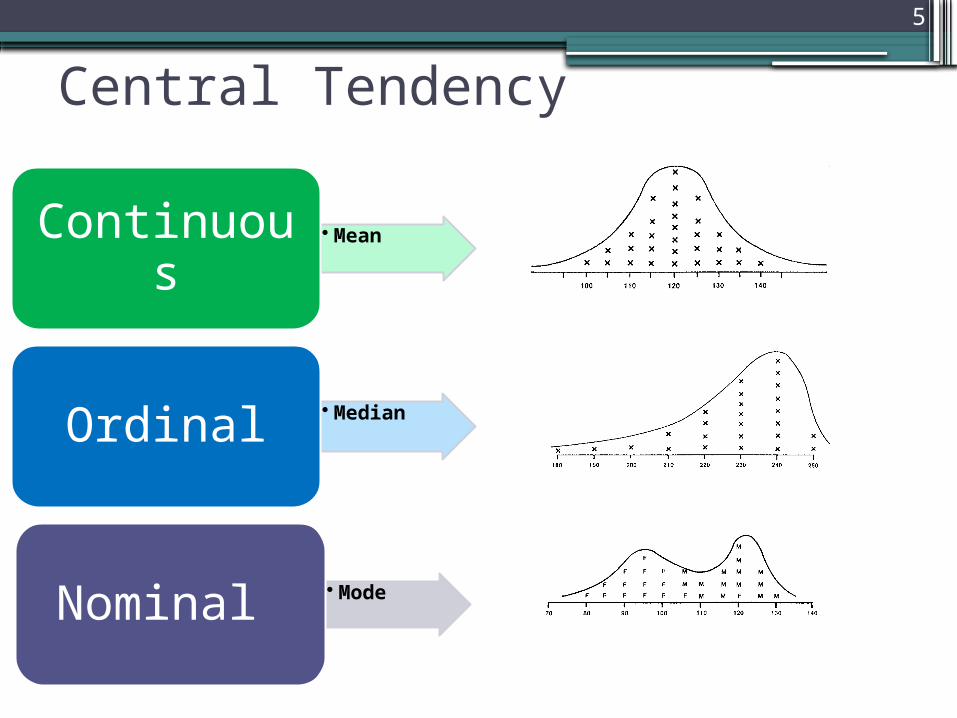
Central Tendency
• Mean
Continuous
• Median
Ordinal
• Mode Nominal
5

Distribution
• Parametric
Normal Distribution
Continuous Data
• Nonparametric
Non-Normal Distribution
Ordinal or Nominal Data
6

Measures of Variability
Range Interval between lowest and highest values within a data
set
Interquartile Range Describes interval between 25th and 75th percentile
(middle 50% of measures)
Standard Deviation Describes the distribution of values in a data set by
comparing each measured value to the mean (continuous data only)
Variance Deviation from the mean
7

Statistical Significance
• P-Value – indicates statistical significance ▫ A p-value < 0.05 means that 5% of the time, the null
could be rejected in error
• Confidence Interval (typically 95%) ▫ The range in which sample values are likely
representative of the true population
• Power ▫ The ability of a study to detect specified differences
between groups ▫ Increasing sample size can increase power
8

CommonStatistical Analyses
9
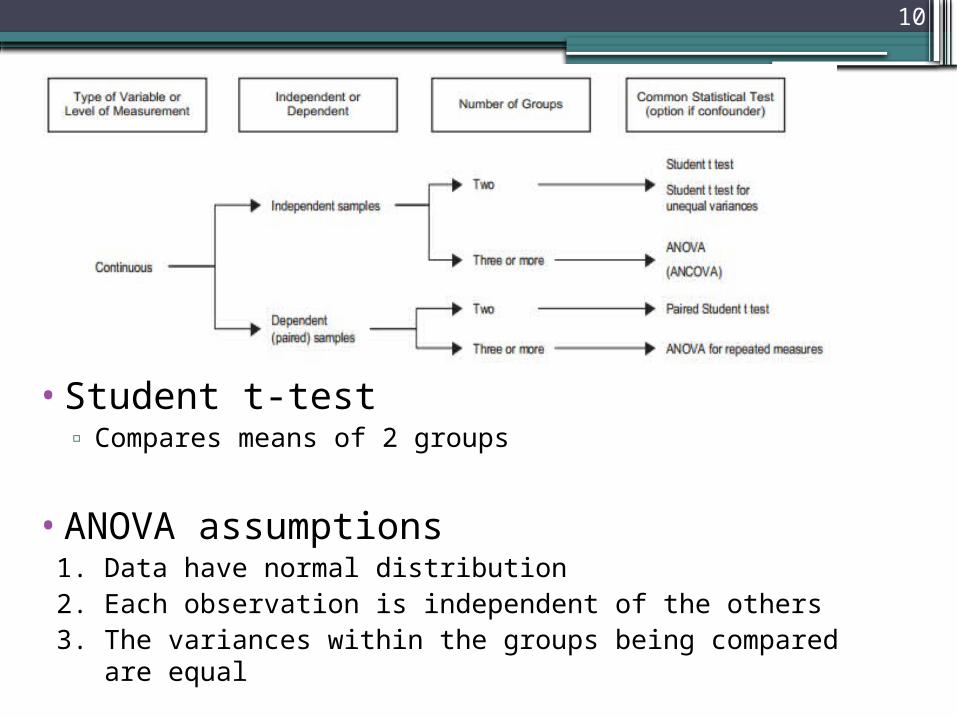
•Student t-test▫ Compares means of 2 groups
•ANOVA assumptions1. Data have normal distribution2. Each observation is independent of the others3. The variances within the groups being compared are
equal
10
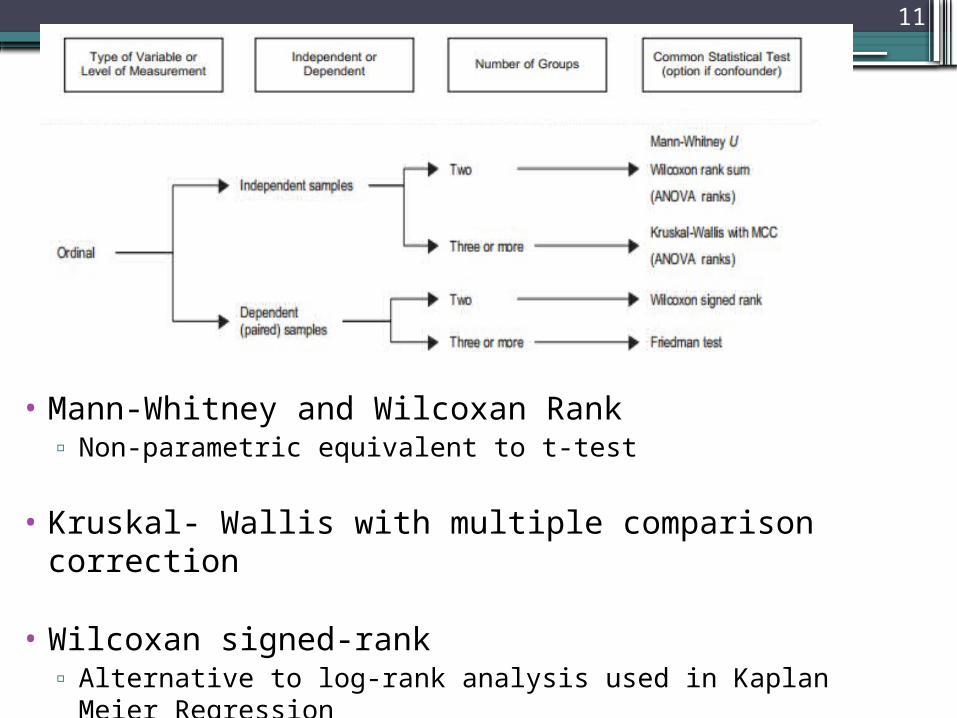
• Mann-Whitney and Wilcoxan Rank ▫ Non-parametric equivalent to t-test
• Kruskal- Wallis with multiple comparison correction
• Wilcoxan signed-rank ▫ Alternative to log-rank analysis used in Kaplan Meier
Regression
11
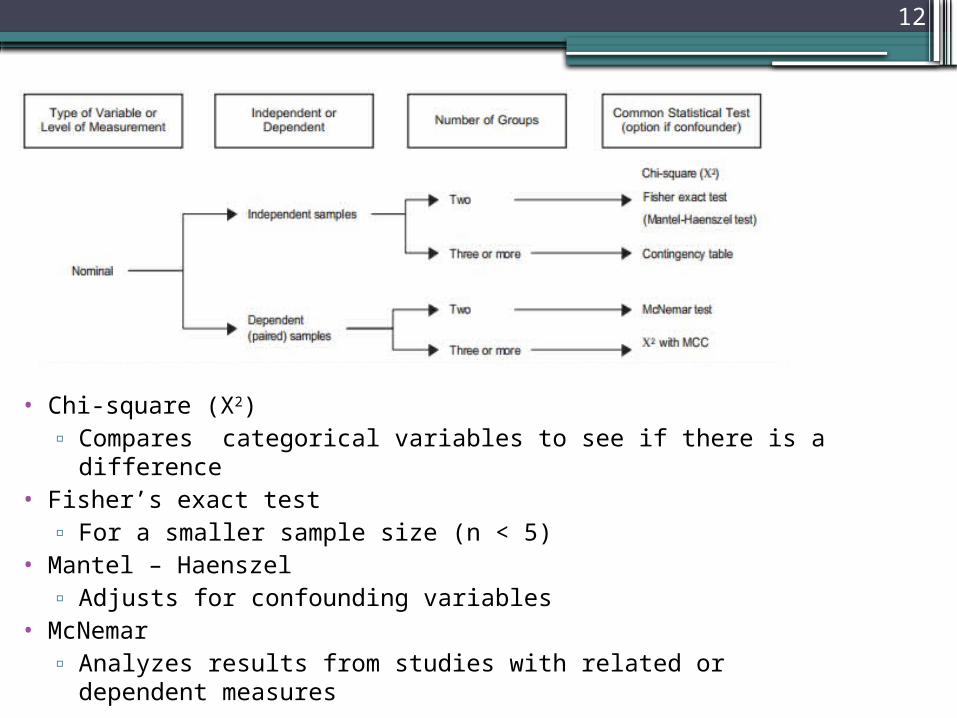
• Chi-square (X2)
▫ Compares categorical variables to see if there is a difference • Fisher’s exact test
▫ For a smaller sample size (n < 5)• Mantel – Haenszel
▫ Adjusts for confounding variables • McNemar
▫ Analyzes results from studies with related or dependent measures
12
Regression
•Predicts the effect of independent variables on the outcome (Framingham Risk Score)
•Multiple linear regression▫Used when outcome data is continuous
•Logistic regression ▫Used when outcome data is categorical
(binary)
13

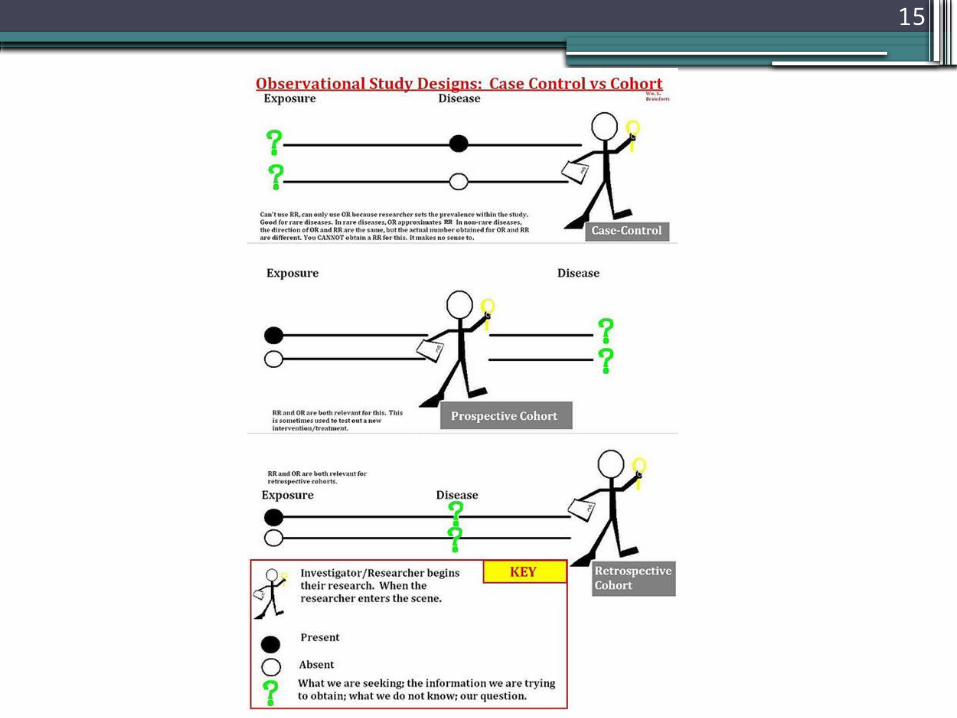
Relative Risk and Odds Ratio
• Relative Risk▫Ratio of incidence of disease in exposed group
divided by incidence in unexposed group Cohort Studies
• Odds Ratio▫Odds of exposure in the group with the
disease divided by odds in control group Case-Control Studies (approximates relative risk
b/c patients already have the disease)
If the Confidence Interval includes 1, there is NO statistical difference between groups
14
15

• Kaplan- Meier Curve▫ Assesses time to an event
▫ Log-Rank test will tell if differences between 2 groups are significant
•Cox Proportional Hazard Model▫ Assesses the effects of covariates (2 or more) on survival or
time to an event (adjusts for confounders)▫ Uses Hazard Ratio as a function of relative risk
Survival Analysis 16
Propensity Matching
• Used to decrease selection bias by matching participants based on characteristics ▫ Matching can be done based on a score▫ Can set number of significant digits depending on how
precise you want to be
• Allows for a more confident assessment of the intervention
• Instrumental variable analysis ▫ Gives each participant a probability of receiving an
intervention and then apply it to an entire group (grouped-treatment rate)
▫ Takes away selection bias based on prognosis or
prescriber preference
17

Questions?
18

References
• Allen, J. Applying study results to patient care: Glossary of study design and statistical terms. Pharmacists Letter.. 2004;20:3-14.
• Gaddis, GM and Gaddis, ML. Introduction to biostatistics: Parts 1-6. Annals of Emergency Medicine. 1990; 19. • Israni, RK. ‘Guide to Biostatistics.” MedPageToday. 2007. http://medpagetoday.com• DeYoung GR. Understanding statistics: An approach for the clinician. Pharmacotherapy Self-Assessment
Program, 5th Edition. Pg 1-15. • Al-Qadheeb NS, et al. Impact of enteral methadone on the ability to wean off continuously infused opioids in
critically ill, mechanically ventilated adults: A case control study. The Annals of Pharmacotherapy. 2012;46:1160-1166.
• Marcus M, et al. Kinematic shoulder MRI: The diagnostic value in acute shoulder dislocations. European Radiology. 2012;1-6.
• Stefan MS, Rothberg MB, Priyaa, et al. Association between B-blocker therapy and outcomes in patients hospitalized with acute exacerbations in chronic obstructive lung disease with underlying ishaemic heart disease, heart failure or hypertension. Thorax. (2012): DOI:10.1136/Thorax.JNL-2012-201945
• http://stat.ethz.ch/education/semesters/ss2011/seminar/contents/presentation_2.pdf. Accessed 20 Sept 2012.
• http://www.gog.org/sdcstaff/MikeSill/Classes/STA575/Lectures/LectureNotesChp5.pdf. Accessed 25 Sept 2012.
• https://statistics.laerd.com/spss-tutorials/mann-whitney-u-test-using-spss-statistics.php. Accessed 24 Sept 2012.
• http://www.experiment-resources.com/mann-whitney-u-test.html. Accessed 26 Sept 2012.
19