biostratigraphy of the lower palaeozoic haima supergroup ... · stratigraphy plays a major role in...
TRANSCRIPT

Molyneux et al._Haima paper Page 1 12/15/2009
Front Page Title: Lower Palaeozoic Biostratigraphy, Oman Running Title: Lower Palaeozoic Biostratigraphy, Oman Manuscript received 24 March 2005 Revised Accepted Proofread by Authors
Biostratigraphy of the Lower Palaeozoic Haima Supergroup, Oman; its application in sequence stratigraphy and hydrocarbon
exploration
Stewart Molyneux, Peter Osterloff, Randall Penney and Pieter Spaak
ABSTRACT The siliciclastic Haima Supergroup (Cambrian-Silurian) on the west flank of the Ghaba Salt Basin in Oman is currently a target for gas exploration following the discovery of significant gas reserves. An understanding of stratigraphical and facies relationships within the Haima is crucial for their exploration and exploitation, and biostratigraphy is one of the more powerful and cost-effective tools that can be deployed to aid such understanding. The biostratigraphy of the Haima Supergroup is based primarily on palynomorphs. The pre-existing biozonation, comprising conventional interval zones, is of low resolution and incorporates misconceptions over the ranges of key species. The work reported here explicitly considered the biostratigraphy of the Haima Supergroup in the context of genetic sequence stratigraphy. It shows that each of the postulated marine flooding events in the Haima Supergroup is characterised by a unique assemblage of marine palynomorphs. Intervening strata are characterised by low diversity and sometimes sparse marine palynomorph assemblages, often comprising only sphaeromorph acritarchs, accompanied by terrestrial cryptospores. These low diversity assemblages indicate proximal marine to non-marine conditions, consistent with progradation following each marine flood. The sandy prograding deposits in the Haima Supergroup form reservoirs, which are sealed by the shales and mudstones deposited by the succeeding marine flooding event. Lateral changes in marine assemblages indicate onshore-offshore relationships, and have contributed towards mapping the extent of each marine flooding event, critical for evaluation of the potential areal extent of seals. The result is improved biostratigraphical resolution, which enables more precise correlation between wells, and which has contributed to more detailed palaeogeographical maps and to a better assessment of the distribution of reservoir-seal pairs.
INTRODUCTION The Haima Supergroup of Oman is currently a target for gas exploration, following the discovery of considerable reserves in the Amin, Miqrat and Barik sandstones on the western flank of the Ghaba Salt Basin (Figures 1, 2). The application of existing and development of new play concepts depends in part on an understanding of the stratigraphical architecture and facies relationships, especially the distribution of reservoir-seal pairs. Sequence stratigraphy plays a major role in developing such an understanding, and in turn is underpinned by other geological and geophysical studies, notably biostratigraphy and seismic studies. Biostratigraphy has a key role to play in identifying and correlating marine flooding events in the Haima Supergroup, and in applying the genetic sequence stratigraphy being developed for the Arabian Plate to well sections. Even so, the use of biostratigraphy in the Haima Supergroup has been limited until now because of the low resolution of existing biozonal

Molyneux et al._Haima paper Page 2 12/15/2009
schemes (Droste, 1997). New work, reported here, has greatly improved the resolution of Haima biostratigraphy. It has also contributed to an understanding of the spatial distribution of facies during Haima deposition, and therefore to an understanding of the distribution of reservoir-seal pairs, by taking note of the palaeoenvironmental signal deduced from fossil assemblages as well as the evidence they provide for age and correlation. In this paper, we review briefly the geological context of new biostratigraphical work on the Haima Supergroup, describe the methodology and results, and discuss the impact of the new work on developing an understanding of Haima stratigraphy and facies relationships, with particular reference to the distribution of reservoir-seal pairs.
HAIMA STRATIGRAPHY AND TECTONIC SETTING The geological setting, stratigraphy and sedimentology of the Haima Supergroup, summarised here, is based on fuller accounts by Millson et al. (1996) and Droste (1997). Oterdoom et al. (1999) have discussed tectonic, petrological and geochronological aspects relating to Haima sedimentation and stratigraphy. The sequence stratigraphic framework followed in this paper is that of Sharland et al. (2001), who identified a series of 63 candidate maximum flooding surfaces (MFS) from the Neoproterozoic to Neogene (Miocene) in the successions on the Arabian Plate, each MFS defining the top of a genetic stratigraphic sequence (GSS). However, Sharland et al. (2001, p. 18) noted that it was perhaps more accurate to regard their maximum flooding surfaces as ‘maximum flooding intervals’. This concept is adopted in this paper, and the terminology is adapted accordingly, i.e. MFI O10, for example, is used rather than MFS O10. The time scale used in this paper is GTS2004 (Gradstein et al., 2004). The Haima Supergroup is found in three north-east to south-west trending basins and on the intervening basement highs in central and south Oman, where it comprises the predominantly siliciclastic upper part of the Neoproterozoic–Lower Palaeozoic basin infill (Figures 1, 2). The basins originated as rift-basins, with the initial rifting occurring towards the end of a protracted collision between East and West Gondwana in late Precambrian, Neoproterozoic times, about 560 Ma (Oterdoom et al., 1999). Two episodes of tectonic activity ascribed to rifting or, in the case of the second episode, possible foreland basin development (Oterdoom et al., 1999), have been recognised in the Huqf Supergroup of Neoproterozoic–Early Cambrian age, which underlies the Haima Supergroup (Figure 2). The Angudan Unconformity, which separates the Huqf and Haima supergroups, marks the change from the extensional tectonic phase associated with rifting to a sag phase during which the Mahatta Humaid Group of the Haima Supergroup was deposited. A subsequent phase of extension and rifting resulted in an increased rate of subsidence, during which the overlying Safiq Group was deposited. The thickness and lateral extent of Haima stratigraphical units vary due to pre-existing topography, syn-sedimentary movement and differential subsidence across the basement highs. Marine deposits are more common in the Ghaba and Fahud salt basins, suggesting an oceanic connection to the north/north-east, whereas the main source of the Haima Supergroup’s siliciclastic deposits on a regional scale was to the south/south-west. Post-early Silurian, pre-Carboniferous tilting to the west has resulted in progressive truncation of formations towards the east.
Mahatta Humaid Group The depositional setting of the lower Mahatta Humaid Group was continental, but marine shales deposited during flooding events occur in the upper Mahatta Humaid and Safiq groups (Figure 2). The flooding events were first identified by Droste (1997) and
Molyneux et al._Haima paper Page 3 12/15/2009
subsequently incorporated by Sharland et al. (2001) in their review of Arabian Plate sequence stratigraphy. Two major transgressive-regressive cycles can be recognised in the Mahatta Humaid Group, namely the Al Bashair-Barik cycle and Mabrouk/Barakat-Ghudun cycle (Figure 2). The marine shales of the Upper Cambrian Al Bashair Member, at the base of the Andam Formation, identify the first marine flooding event in the Haima Supergroup, and define the Late Cambrian Cm30 maximum flooding interval of Sharland et al. (2001). Subsequently, the extensive Barik Sandstone braid-delta prograded over the Al Bashair Member from the south. The deltaic sandstones are absent towards the north, where the Al Bashair Member is overlain by mudstones of the Mabrouk Member. The Mabrouk Member transgresses southwards over the Barik Sandstone. The Mabrouk and overlying Barakat members, of Tremadocian (Early Ordovician) age, are dominated by marine mudstones, with an intercalation of thin, sharp-based sandstones, interpreted as a combination of lowstand and transgressive shoreline sands, defining the base of the Barakat Member. The mudstones of the Mabrouk and Barakat members define the Early Ordovician O10 and O20 maximum flooding intervals of Sharland et al. (2001), respectively. The overlying Ghudun Formation comprises a thick package of micaceous sandstone with intercalated micaceous siltstone and shale, interpreted as braided fluvial and coastal deposits that prograded northwards (Figure 2).
Safiq Group The lower part of the Safiq Group forms an overall backstepping transgressive succession, with two major flooding events indicated by marine mudstone in the Middle Ordovician (Llanvirn) Saih Nihayda Formation and the Upper Ordovician (Caradoc) Hasirah Formation. The dark grey to black, graptolitic mudstones of these formations were deposited in relatively deep marine environments, and are correlated with the O30 and O40 maximum flooding intervals, respectively, of Sharland et al. (2001). The marine mudstones of the Saih Nihayda and Hasirah formations are intercalated between sandstone units. Sandstone and conglomerate at the base of the Saih Nihayda Formation might represent fluvial sediments, deposited in channels eroded into the Ghudun Formation, and fine to medium-grained sandstone at the top of the formation suggests progradation of shallow marine facies. Similarly, a clean, medium to coarse-grained sandstone at the base of the Hasirah Formation is interpreted as a shallow marine deposit, and the upper part of the formation consists of a sharp-based interval of very fine to medium-grained sandstone interbedded with siltstone and shale, considered to indicate a prograding delta complex (Droste, 1997). The Late Ordovician (Hirnantian) glaciation of Gondwana resulted in a fall in sea level that produced distinct, deep erosional features on the Arabian Plate (e.g. McGillivray and Husseini, 1992, fig. 6). The subsequent post-glacial, latest Ordovician to Llandovery (early Silurian) transgression deposited the marine, high gamma, organic-rich shale at the base of the Sahmah Formation; the S10 maximum flooding interval of Sharland et al. (2001) may be higher in the Sahmah Formation, but there is no definite evidence for this marine flooding event in Oman. Following Llandovery marine shale deposition, a Silurian delta prograded across South Oman, and minor (HST?) turbidite sandstones were deposited in the north.
HAIMA BIOSTRATIGRAPHY The marine intercalations in the upper part of the Mahatta Humaid Group and the Safiq Group are the key to developing a biostratigraphical framework for the Haima Supergroup. The biostratigraphy of the Haima Supergroup in the subsurface of Oman is based primarily

Molyneux et al._Haima paper Page 4 12/15/2009
on palynological analysis, the principal palynomorph groups being acritarchs (marine, Proterozoic-Recent; present in the Mahatta Humaid and Safiq groups), chitinozoa (marine, Ordovician-Devonian; present in the Safiq Group) and cryptospores (terrestrial, Middle Ordovician-Devonian; also present in the Safiq Group). The affinities of the marine microfossils are varied and in some cases unknown. Many Lower Palaeozoic acritarchs were probably the cysts of marine microphytoplankton, although the group might be polyphyletic (Martin, 1993; Servais et al., 2003, and references therein). Chitinozoa were also marine organisms, possibly eggs or egg cases, although their affinities are uncertain and still debated (Miller, 1996). In contrast, cryptospores have been shown to be the spores of primitive land plants with probable affinities to bryophytes (Wellman et al., 2003). Historically, through the biozonal schemes developed by Petroleum Development Oman, these three groups of microfossils have been used to define five broad biozones in the Haima Supergroup (Figure 2), each being a conventional interval zone (Droste, 1997, fig. 6). The stratigraphical interval covered by each of the zones means that they can only be used for broad dating and correlation of the Haima succession. Zone 1108, for example, covers the stratigraphical interval from the base of the Upper Cambrian to about the top of the Tremadocian (Lower Ordovician), an interval of about 22 million years (GTS2004: Gradstein et al., 2004), which encompasses the three marine flooding events recognised in the Mahatta Humaid Group (Figure 2). In some cases, definition of the zones is also problematical and gives rise to misconceptions over the ranges of key species. The acritarch Veryhachium dumontii (Plate 1: 16) is a characteristic species of Zone 1108 and is therefore depicted as ranging through the entire interval covered by the zone in published diagrams (e.g. Droste, 1997, fig. 6). In reality, the stratigraphical range of the species, which occurs widely around the margin of Gondwana (eastern Newfoundland, England and Wales, France, Belgium, North Africa; see Vecoli, 1996, for records) and on other palaeocontinents (East European Platform, Baltica; Volkova, 1990), is restricted to the Upper Cambrian.
New Biostratigraphical and Palaeoenvironmental Investigations In the light of the ongoing programmes for gas exploration across Oman, the need to understand the spatial relationships between reservoirs and seals in the subsurface provided the impetus to review and if possible improve the biostratigraphical framework applicable to the Haima Supergroup. Two key aspects of recent biostratigraphical work on the Haima Supergroup have been (i) a palaeoenvironmental analysis of samples to complement biostratigraphical dating and correlation (Figure 3 and discussion below), and (ii) an extensive use of composite ditch cutting samples in addition to sidewall cores and core samples (see Figures 4-6 for sampling intervals of ditch cutting samples). The use of ditch cutting samples poses problems associated with caving that are well known in biostratigraphy, but they also possess certain advantages over other sample types in that they provide a fuller record of changes in assemblages, and therefore palaeoenvironments, through a well section. As a result, they are effective at picking up marine signals through a section as well as identifying possible hiatuses or facies changes where a particular marine event is absent. The occurrence of marine flooding events in the Haima Supergroup is signalled palynologically by major stepped changes in assemblage composition as the first downhole occurrences of marine assemblages are encountered. Hence the tops of candidate maximum flooding intervals (MFIs) are identified on the range charts and correlation panels shown in Figures 4-9. Analysis of palynological assemblages also provides additional data for the reconstruction of Haima palaeoenvironments, particularly proximal–distal (onshore–offshore) trends that have a bearing on understanding the spatial distribution of reservoir-seal pairs. A number of
Molyneux et al._Haima paper Page 5 12/15/2009
studies have indicated that marine Lower Palaeozoic palynological assemblages vary systematically in composition, diversity and abundance, both overall abundance and relative abundance of components, in relation to their position along an onshore–offshore gradient (Jacobson, 1979; Dorning, 1981; Vecoli, 2000) (Figure 3). Among acritarchs, samples from offshore shelf facies contain the most abundant and diverse assemblages, whereas assemblages from nearshore and deep-water basinal facies are generally of lower diversity and are dominated by sphaeromorph acritarchs (e.g. Plate 1: 5). In the context of genetic sequence stratigraphy, the onshore–offshore model implies that the diversity and abundance of marine palynomorphs (acritarchs and chitinozoa) are likely to reach a maximum at or close to a marine flooding surface in offshore shelf settings (Figure 3). Conversely, correlative marine assemblages from more proximal settings are likely to be less diverse, consisting principally of sphaeromorph acritarchs and other widely occurring species such as Veryhachium trispinosum (Plate 2: 4). Furthermore, proximal marine sections of Mid Ordovician age and younger might be expected to contain more diverse and abundant cryptospore microfloras than correlative distal sections (cf. Steemans and Wellman, 2004, p. 364). In a study of the Hanadir Member of the Qasim Formation in Saudi Arabia, which is of Llanvirn age and correlates with MFI O30 and the Saih Nihayda Formation of Oman, Strother et al. (1996, fig. 2) showed a slight up-section increase in cryptospore abundance in the Tayma-4 well, concurrent with an increase in the proportion of ‘leiospheres’ (including sphaeromorph acritarchs) and reductions in the proportions of other marine microfossils (chitinozoans and acritarchs other than sphaeromorphs). The up-section change in the palynological assemblage, implying upward shallowing, coincides with a sedimentological change in Tayma-4, in which the marine, graptolite-bearing shale of the Hanadir Member is overlain by the cross-bedded sandstone of the Kahfah Member, representing a prograding deltaic facies and containing evidence of nearshore marine deposition. In addition to lateral changes in assemblage composition, diversity and abundance, stratigraphical changes can also be predicted as a result of transgression and progradation, following Walther’s Law (Figure 3). This is also evident from the record of changes in cryptospore, acritarch and chitinozoan assemblage composition reported by Strother et al. (1996) from Tayma-4, discussed above. Thus, more varied and abundant marine assemblages might be expected to advance with transgressions during times of marine flooding, but retreat towards basin centres as progradation continues during deposition of any succeeding highstand systems tract. As a result, changes in the diversity, abundance and composition of marine palynomorph assemblages in well sections might coincide with stratigraphical changes in lithofacies as both biofacies and lithofacies track a marine transgression and the subsequent progradation of basin infill across a well location (Figure 3). This does not necessarily mean that there is direct facies control on the composition of assemblages. It is more likely that planktonic palynomorph taxa track their preferred positions along an onshore–offshore gradient, with the composition, diversity and abundance of marine palynomorph assemblages varying in response to the interaction of a number of factors, including changes in water depth, chemistry and physical properties. An analogous response to changes in the marine environment has been proposed for graptoloid graptolite species (Goldman et al., 1999). The palynological data from the Haima Supergroup show both lateral and stratigraphical variations in assemblages that can be related to palaeoenvironmental conditions and hence to genetic sequences. Representative species from Upper Cambrian, Ordovician and Silurian assemblages are illustrated in Plates 1-3. Figured specimens are held in the reference collections of Petroleum Development Oman. The relationships between assemblage composition and genetic sequences, together with key marine taxa associated with each marine flooding event, are summarised in Table 1.

Molyneux et al._Haima paper Page 6 12/15/2009
Stratigraphical patterns of assemblage composition
Stratigraphical patterns of palynomorph occurrence in the Haima Supergroup are exemplified by well data from Petroleum Development Oman exploration wells Burhaan West-1, Kauther-1H1, Khazzan-1H4/H5, Saih Nihayda North-1, Saih Nihayda-24, Saih Rawl-29 and Wadi Qitbit-1; see Figures 4-9 for locations. Wadi Qitbit-1 is situated on the western margin of the South Oman Salt Basin, and the rest are on the western flank of the Ghaba Salt Basin. Tops of MFIs O30, O10, Cm30; Burhaan West-1 The biostratigraphical pattern in the Mahatta Humaid Group and lower Safiq Group is most clear in Burhaan West-1 (Figure 4), which shows three distinct marine palynomorph assemblages associated respectively with the Saih Nihayda Formation, the Mabrouk Member and the Al Bashair Member. The samples from this well are all composite cuttings so range tops are used here to identify the tops of maximum flooding intervals. The highest assemblage in Burhaan West-1 appears in the shale of the Saih Nihayda Formation, which is unconformably overlain by the Upper Carboniferous–lower Permian Al Khlata Formation. The assemblage, which includes the acritarchs Baltisphaerosum christoferii, Clypeolus? sp., Goniosphaeridium conjunctum/connectum, Incertae sedis No. 20 of Petroleum Development Oman, Leiofusa sp., Stelliferidium spp., Striatotheca spp., Uncinisphaera? sp. and Vogtlandia flosmaris, and the chitinozoa Desmochitina spp., is characteristic of the Saih Nihayda Formation, and is referred to herein as the ‘Saih Nihayda assemblage’ although it is also present in samples from the upper part of the Ghudun Formation (see below). Its diversity shows that the mudrock interval between the base of the Permian at about 3200 m and the top of the Ghudun Formation at about 3350 m is marine throughout, although there is some suggestion of shallowing at the top of the section where the microflora from the highest sample consists almost entirely of sphaeromorph acritarchs. The presence of graptolite fragments (cf. Plate 2: 8) and chitinozoa in palynological assemblages from the lower part of the Saih Nihayda Formation shale in Burhaan West-1 (3300–3328 m), together with an increase in acritarch diversity, suggests that the maximum flooding interval lies between these depths. The top of MFI O30 is therefore located at 3300 m in Figure 4. The middle assemblage in Burhaan West-1 is distinguished by the first downhole appearances of a high number of marine acritarch species over an interval of about 60 m or so in the upper part of the Mabrouk Member (4020–4080 m), and is dated as Tremadocian (Early Ordovician). The first downhole occurrences of such a high number of marine species over a relatively short interval constrain the depth at which Tremadocian open marine facies were encountered in the well and provide good evidence for the top of MFI O10. The lowest assemblage in Burhaan West-1, from the Al Bashair Member, contains species that are diagnostic of the Upper Cambrian, including Veryhachium dumontii (Plate 1: 10, 16) and is inferred to indicate the top of MFI Cm30 in the well at 4438 m. The downhole incoming of discrete assemblages in the Mabrouk and Al Bashair members gives a distinctive step-wise appearance to biostratigraphical range tops in Burhaan West-1. Tops of MFIs O30, O10, Cm30; Kauther-1H1 and Khazzan-1H4/H5 Similar patterns are seen in Kauther-1H1 and Khazzan-1H4/H5 (Figures 5, 6). As in Burhaan West-1, the palynological evidence indicates that the Saih Nihayda shale in Kauther-1H1 is entirely marine, with an increase in palynomorph diversity towards the base of the formation suggesting that the top of MFI O30 lies at about 2960 m (Figures 5, 8). Many of the characteristic species of the Mabrouk assemblage appear over a relatively short interval of about 60 m in the upper part of the Mabrouk Member in Kauther-1H1 (3530–3590 m), although there is a tail of first downhole occurrences below that level, which means that there

Molyneux et al._Haima paper Page 7 12/15/2009
is less of a distinction between the Mabrouk and Al Bashair assemblages than in Burhaan West-1. Nevertheless, diagnostic Upper Cambrian species only have their first downhole appearances in the Al Bashair Member in Kauther-1H1 (3850 m and below). Hence, the top of MFI O10 is placed at 3530 m in Kauther-1H1, and that of MFI Cm30 at 3850 m. Similar patterns are seen in the Mabrouk and Al Bashair members of Khazzan-1H4/H5 (Figure 6), with most species of the Mabrouk assemblage appearing over a downhole interval of about 20 m (4460–4480 m; top of MFI O10 placed at 4460 m), and Upper Cambrian marker species being restricted to the Al Bashair Member (4750 m and below; top of MFI Cm30 placed at 4750 m). The top of MFI O10 is placed about 50–60 m below the top of the Mabrouk Member in all three wells (Figures 4-6). Bases of of MFIs O30, O10, Cm30 Defining the base of each marine flooding event on palynological evidence is more problematical, given the likelihood of caving in the ditch cutting samples. Nevertheless, it is possible to draw some conclusions regarding palynological assemblages from intervening strata based on evidence from these and other wells. Samples throughout the Ghudun Formation in Kauther-1H1 contain species of the Saih Nihayda assemblage (Figure 5), but it is likely that specimens from ditch cutting samples below the highest part of the Ghudun Formation are caved. Representatives of the Saih Nihayda assemblage occur down to 70 m below the base of the Saih Nihayda Formation in sidewall cores (to 3052.20 m), and on this evidence, the Saih Nihayda assemblage is postulated to have its lowest in situ stratigraphical occurrence in the upper part of the Ghudun Formation (Association 1 in Figure 5). Lower in the Ghudun Formation, a change in preservation (i.e. a colour change) enables a distinction to be made between the Saih Nihayda and older material. Rare, dark brown sphaeromorph acritarchs in cuttings from the lowest 160 m of the Ghudun Formation in Kauther-1H1 (3290–3450 m, Plate 1: 5, Association 3 in Figure 5) are much darker than specimens of the Saih Nihayda assemblage, but are similar in preservation to specimens from the Mabrouk and Al Bashair members, suggesting that these might be the only in situ forms and that the associated Saih Nihayda specimens have been introduced by caving. The Ghudun Formation in Kauther-1H1 can therefore be divided into three palynologically distinct parts (Figure 5). The highest 70 m of the formation (Association 1) might be genetically related to the Saih Nihayda Formation, possibly as a sandier transgressive facies preceding the marine flood that deposited the Saih Nihayda shale. The lowest 160 m of the Ghudun Formation in Kauther-1H1 (Association 3) is postulated to indicate a proximal marine facies deposited during progradation following the Mabrouk transgression. The intervening 240 m of the formation (Association 2 in Figure 5) yielded only representatives of the Saih Nihayda assemblage from ditch cutting samples, but these could be entirely caved specimens, in which case the middle part of the Ghudun Formation would be palynologically barren (as suggested by occasional sidewall cores from this part of the formation). This in turn suggests a possible non-marine environment for the middle part of the formation. Further evidence for the character of assemblages from strata between the Cm30, O10 and O30 marine flooding events is provided by data from Burhaan West-1 and Khazzan-1H4/H5. In neither well was the Ghudun Formation sampled systematically, but samples from the base of the Ghudun Formation and top of the Mabrouk Member in both wells were either barren or yielded sparse, low diversity assemblages (Figures 4, 6). This suggests proximal marine or non-marine facies for that stratigraphical interval in both wells, consistent with interpretation of the same interval in Kauther-1H1. The same appears to be true for Saih Nihayda-24 (Figure 8), in which samples immediately above the downhole appearance of the Mabrouk (MFI O10) acritarch assemblage were either barren or yielded sphaeromorph acritarchs only, and samples from higher in the Ghudun Formation were barren. Samples from the Barik Member in Khazzan-1H4/H5 (Figure 6) were also barren or yielded sparse, low diversity assemblages. Ditch cutting samples from the same interval in Burhaan

Molyneux et al._Haima paper Page 8 12/15/2009
West-1 yielded specimens of the Mabrouk acritarch assemblage, but core samples from the Barik Member in the nearby Bout-1H2 well (BT-1 – see Figure 11 for locations) were either barren or yielded rare sphaeromorph acritarchs. It is notable that no species have their first downhole appearances in the Barik Member of either Burhaan West-1 or Khazzan-1H4/H5. Similarly, the one sample investigated from the Barik Sandstone in Saih Nihayda-24 was barren, and so too were a series of core samples collected through the Barik Sandstone in Saih Rawl-29 (Figure 8). MFI O40 Similar biostratigraphical patterns are seen at higher stratigraphical levels in the Safiq Group, as shown by data from Saih Nihayda North-1, Saih Rawl-29 and Wadi Qitbit-1 (Figures 7-9). Saih Nihayda North-1 and Saih Rawl-29 yielded marine palynomorph assemblages that indicate a Late Ordovician (Caradoc) age (Plate 3: 1, 4, 6) and suggest the presence of MFI O40. Samples above and below the marine interval in Saih Rawl-29 were either barren or yielded assemblages of lower diversity that comprise sphaeromorph acritarchs and cryptospores. These latter assemblages occur in the upper and lower parts of the Hasirah Formation and the upper part of the Saih Nihayda Formation in Saih Rawl-29, and suggest proximal marine facies for these intervals. There is no evidence for the marine assemblage postulated to denote MFI O40 in Saih Nihayda-24 (Figure 8), all the assemblages from the Hasirah Formation in that well consisting primarily of sphaeromorph acritarchs and/or cryptospores. This might indicate that pre-Permian erosion has removed the maximum flooding interval, or that the interval was missed by the sampling strategy in Saih Nihayda-24, which made exclusive use of sidewall cores. Llandovery (early Silurian; pre-MFI S10) In wells sited along the eastern edge of the Rub’ Al-Khali Basin in south-western Oman, the base of the Sahmah Formation, which comprises a lower ‘Shale Member’ and an upper ‘Sandy Member’, is marked by a conspicuous high gamma interval with a high organic content, identified as the Sahmah Shale source rock (Svendsen, 2004). In Wadi Qitbit-1 (Figure 9), this interval (GR > 200 API, about 3195-3203 m depth) is associated with a diverse marine palynological assemblage. The assemblage was recorded from a 10 m ditch cuttings sample (3190-3200 m), with the base of the next highest sample being 10 m above the higher depth (3160-3180 m). The marine assemblage is therefore from the lower part of the Sahmah Shale Member. Overlying samples, from the upper part of the Sahmah Shale and the Sahmah Sandy Member in Wadi Qitbit-1 (Figure 9), were either barren or yielded low diversity assemblages comprising sphaeromorph acritarchs and cryptospores that indicate marginal marine conditions. Palynological assemblages from the Sandy Member in other wells also indicate a marginal marine setting (Svendsen, 2004). Reconnaissance of samples from the upper part of the underlying Hasirah Formation in Wadi Qitbit-1 suggests that these are also either barren or contain only cryptospores, again suggesting marginal or possibly non-marine conditions. The record from Wadi Qitbit-1 therefore provides evidence for the palynological characteristics of an Llandovery marine flooding event within a mainly marginal marine to non-marine Late Ordovician–Llandovery succession. The marine assemblage from Wadi Qitbit-1 includes the acritarchs Eupoikilofusa rochesterensis and Veryhachium valiente, which Le Hérissé et al. (1995) restricted to the Rhuddanian (lower Llandovery) in Saudi Arabia. If these species are reliable markers for the Rhuddanian on the Arabian Plate, the Rhuddanian age thus indicated for the Sahmah Shale source rock in Wadi Qitbit-1 would be consistent with the ages of black, organic-rich, high gamma shales (‘hot shales’) deposited elsewhere in the latest Ordovician-earliest Silurian of northern Gondwana (North Africa, Arabia) (Lüning et al., 2000; Armstrong et al., 2005). In addition to the Rhuddanian age suggested here for the basal Sahmah Formation in Wadi Qitbit-1, Svendsen (2004) cited unpublished biostratigraphical data, which suggested that
Molyneux et al._Haima paper Page 9 12/15/2009
some occurrences of the high gamma shale in wells to the north and west of Wadi Qitbit-1 (Burkanah-1, Ata-1; see Svendsen, 2004, fig. 1, for well locations) were Late Ordovician (Ashgill). The chitinozoan Plectochitina spongiosa was reported to ‘point to a possible Ashgill age’ for the Sahmah Formation Sandy Member of Burkanah-1, with a ‘firm indication of Ashgill’ age reported for the Sahmah Formation Shale Member in the same well, and the acritarch Eupoikilofusa ctenista was reported to indicate an Ashgill age for the lower part of the Sahmah Formation Sandy Member in Ata-1 (Svendsen, 2004, fig. 8). The exact age within the Ashgill of the Sahmah Formation Shale Member in Burkanah-1 and Ata-1 is not known, and more information on the unpublished assemblages is needed before it can be assessed adequately. However, it is reasonable to assume that the high gamma shales at the base of the member were laid down during the same deglacial transgressive event that resulted in the deposition of similar units across northern Gondwana. This would imply a latest Ashgill age for the Sahmah Formation Shale Member in Burkanah-1 and Ata-1, and the species identified on Svendsen’s correlation panel (2004, fig. 8) would permit this. Plectochitina spongiosa, for example, has been recorded widely from Ashgill successions (Achab, 1977; Molyneux and Paris, 1985; Paris, 1988; Keegan et al., 1990), but has also been recorded from the Rhuddanian in its type area (Soufiane and Achab, 2000) and so its range encompasses the latest Ashgill. Furthermore, Eupoikilofusa ctenista occurs in the latest Ashgill of north-east Libya (Hill and Molyneux, 1988; Molyneux, 1988) at a level that correlates with the Tanuchitina elongata Biozone, the highest Ordovician chitinozoan biozone of northern Gondwana (Paris, 1990, p. 203). Although the evidence is not conclusive, all or part of the T. elongata Biozone might correlate with the latest Ashgill Normalograptus [Glyptograptus] persculptus Graptolite Biozone (Paris, 1990). Hence, Eupoikilofusa ctenista could indicate the latest, post-glacial part of the Ashgill for the succession in Ata-1. Given their position to the north and west of Wadi Qitbit-1, latest Ashgill deposition of high gamma shales in Ata-1 and Burkanah-1 would be consistent with southward post-glacial transgression from the direction of the Rub’ Al-Khali Basin to the north. This mirrors the situation in Jordan, where the base of the Batra Formation, comparable in age and facies to the Sahmah Formation, youngs north-eastwards from latest Ashgill (persculptus Biozone) in the Al Jafr area to Rhuddanian (acuminatus Biozone) at Wadi Sirhan (Armstrong et al., 2005). The Late Ordovician (Ashgill) to early Llandovery (Rhuddanian) marine palynological assemblages from the Sahmah Formation in Wadi Qitbit-1 and other wells in south-west Oman relate to a marine flooding event that predates MFI S10 of Sharland et al. (2001). The latter is of mid Llandovery (Aeronian), Monograptus convolutus Graptolite Biozone age. This raises the question of where, if anywhere, MFI S10 is located in the Sahmah sections of Oman, and how it might be characterised palynologically. Miller and Melvin (2004) demonstrated that the convolutus Biozone in the Qusaiba Member (Qalibah Formation) of Saudi Arabia was associated with a widespread palynological high-diversity spike, which was either immediately below or was directly associated with the occurrence of their acritarch ‘n. sp. aff. Papulogabata’. Based on a combination of palynological and sedimentological evidence, Miller and Melvin (2004) interpreted this spike as indicating the likely position of MFI S10. There is no indication of this diversity spike in Wadi Qitbit-1, in which the postulated Rhuddanian marine intercalation is overlain by a marginal marine facies, with no evidence for further marine intercalations higher in the Llandovery section. In Wadi Qitbit-1, the Sahmah Formation has a downhole thickness of about 520 m, most of which (480 m) comprises the Sahmah Formation Sandy Member. The only productive samples are those shown on Figure 9, from the base of the Sandy Member and the underlying Shale Member. Thirteen ditch cuttings samples from the upper 375 m of the Sandy Member were palynologically barren. Furthermore, there is no evidence for a diversity spike of Aeronian age in the Sahmah Formation in other wells of south-west Oman (Svendsen, 2004). The only possible indication of MFI S10 in the Sahmah Formation of Oman is provided by chitinozoans that resemble Belonechitina arabiensis (Plate 3: 7) in wells situated to the north-east of Wadi Qitbit-1, namely Hasirah-1, Rija-1 and Sahmah-1. Belonechitina arabiensis is one

Molyneux et al._Haima paper Page 10 12/15/2009
of a number of acritarch and chitinozoan species that characterise successive mud-prone cyclothems deposited as the distal parts of a Highstand Systems Tract (HST) above MFI S10 in the Qusaiba Member of Saudi Arabia (Miller and Melvin, 2004). It has a restricted stratigraphical range in the Sphaerochitina solitudina and Angochitina hemeri chitinozoan biozones of Saudi Arabia (Paris and Al Hajri, 1995), now correlated with the late Aeronian and immediately post-dating MFI S10 (Miller and Melvin, 2004). In Hasirah-1 and Sahmah-1, Belonechitina cf. arabiensis has its first downhole occurrence (FDO) in the middle of the Sahmah Formation; in Sahmah-1, its FDO, at 3624 m, is in the Sahmah Formation Sandy Member (cf. Svendsen, 2004, fig. 7). However, none of the other MFI S10 or the succeeding HST palynological markers recognised by Miller and Melvin (2004) in the Qusaiba Member of Saudi Arabia have been recorded in these or other wells in Oman. The palynological evidence for MFI S10 in the Sahmah Formation is therefore inconclusive, and it seems likely that MFI S10 either did not extend into Oman or has been eroded beneath the sub-Permian unconformity. Discussion of biostratigraphical patterns Two general observations can be based on this analysis of the biostratigraphical patterns seen in these wells. First, each of the marine flooding events identified in the Haima Supergroup is associated with a unique assemblage of marine palynomorphs (Figure 10). The only marine flooding events of Sharland et al. (2001) that are poorly characterised palynologically are those associated with the Sahmah Formation (MFI S10), because of the uncertainty over its presence as noted above, and with the Barakat Member (MFI O20), mainly because that event has not been recognised palynologically in the wells studied from the western margin of the Ghaba Salt Basin. Based on their gamma logs, Droste (1997, fig. 12) considered the Barakat flooding surface and the basal Barakat onlap surface to be present in wells along an east–west transect across the Ghaba Salt Basin, including the Saih Nihayda area. Comparison with the gamma logs of wells discussed in this paper would place the Barakat onlap surface at the base of the gamma low at about 3975 m in Saih Nihayda-24 and about 4050 m in Burhaan West-1. If this is the base of the Barakat Member in these wells, then the palynological evidence suggests that the member was here deposited in a proximal marine setting. Samples above those yielding the Mabrouk assemblage in Burhaan West-1 and Saih Nihayda-24, as well as in Kauther-1H1 and Khazzan-1H4/H5, were either barren or yielded sparse, low diversity assemblages, in some cases comprising only sphaeromorph acritarchs (Figures 4-8, Table 1). An alternative interpretation is that the sections above the top of MFI O10 in these wells are a proximal facies of the upper Mabrouk Member. A separate Early Ordovician marine assemblage does occur above the Mabrouk assemblage in wells from the northern parts of the Fahud and Ghaba salt basins, including Sinaw-1 (Figure 8, Table 1), but that assemblage has not been recorded from Burhaan West-1, Saih Nihayda-24, Kauther-1H1 or Khazzan-1H4/H5. The second general observation is that samples from strata separating each of the marine flooding events yield low diversity assemblages indicative of proximal marine conditions or are barren. Evidence for this from the Mahatta Humaid Group is seen in each of the wells analysed above, although the picture is complicated by the possible effects of caving in the Ghudun Formation in Kauther-1H1, and by the lack of systematically acquired data through the same formation in Burhaan West-1 and Khazzan-1H4/H5. At higher stratigraphical levels, intervals above strata yielding varied Upper Ordovician and Llandovery marine assemblages in wells from western Oman and the South Oman Salt Basin have yielded low diversity assemblages comprising mainly sphaeromorph acritarchs and cryptospores, exemplified by the data from Saih Rawl-29 and Wadi Qitbit-1 (Figures 7, 9). The biostratigraphical pattern for the Haima Supergroup is therefore consistent with that predicted by Figure 3, with diverse marine assemblages indicative of open marine conditions fingerprinting successive marine flooding events, and being separated stratigraphically by

Molyneux et al._Haima paper Page 11 12/15/2009
low diversity assemblages indicative of the more proximal, shallow marine to non-marine conditions that developed during progradation and basin infill.
Lateral variations in assemblage composition Evidence for lateral variations in the composition of assemblages associated with each of the Haima marine flooding events comes from the Saih Nihayda Formation and Mabrouk Member on the north-west margin of the Ghaba Salt Basin (Figures 8, 11, 12). MFI O30 A number of changes in the composition of assemblages from the Saih Nihayda Formation occur from north-east to south-west along the margin of the Ghaba Salt Basin (Figures 8, 11). There is a general reduction in acritarch diversity from north-east to south-west, with a marked reduction south-west of the Saih Nihayda area. Wells towards the south-western end of the Ghaba Salt Basin have yielded Saih Nihayda assemblages of low diversity, those from the Saih Nihayda Formation in Saih Rawl-29, for example, comprising sphaeromorph acritarchs, Incertae sedis No. 20 and few other forms (Figures 7, 11). Greater diversity is seen in samples from Saih Nihayda-24 and Saih Nihayda North-1, and this increases further in samples from the Saih Nihayda Formation in Burhaan West-1 and Kauther-1H1 towards the north-east (Figures 4, 5, 7, 11; Plate 2). The trend towards decreasing diversity in the south-west is consistent with a change from offshore to onshore conditions from north-east to south-west along the margin of the Ghaba Salt Basin towards the Central Oman High, an interpretation that is further supported by the restriction of graptolite fragments and chitinozoa (Plate 2: 7, 8) to assemblages from wells towards the north-east (Figure 11). The Saih Nihayda interval in the northern wells, Burhaan West-1 and Kauther-1H1, is interpreted as being fully marine throughout, whereas the palynological evidence from the Saih Nihayda Formation in Saih Rawl-29 suggests marginal marine to non-marine conditions (Figure 8). The occurrence of acritarch taxa that are diagnostic of the Saih Nihayda assemblage, notably Incertae sedis No. 20, in the sparse, low diversity microfloras from the south-west makes it possible to identify the Saih Nihayda assemblage in that part of the Ghaba Salt Basin, and therefore to track the Saih Nihayda marine flood (MFI O30) from distal to proximal settings along the margin of the basin. Evidence from the Fahud Salt Basin and the Mabrouk-Makarem High is more ambiguous. Saih Nihayda assemblages from some wells, for example Makarem-3H1 (MKM-3, Figure 11) and Al Huwaisah-46 (AH-46), are of low diversity and suggest proximal marine conditions. Sidewall core and ditch cutting samples between 4083 m and 4132 m in Al Huwaisah-46 yielded assemblages consisting mainly of sphaeromorph acritarchs and cryptospores, with rare specimens of Incertae sedis No. 20, i.e. low diversity assemblages that recall those from the south-west of the Ghaba Salt Basin. The latter species is also the only Saih Nihayda indicator species to be recorded from Mabrouk-4 (MBR-4), although its occurrence in ditch cutting samples from 4470 m to 4590 m is at a level assigned to the basal Ghudun Formation and upper part of the Andam Formation (Figure 8) and is therefore probably attributable to caving. Nevertheless, the occurrence of Incertae sedis No. 20 without other Saih Nihayda indicator species suggests that only marginal marine Saih Nihayda facies occur at a higher level in Mabrouk-4, comparable with facies from the Barik and Saih Rawl areas of the Ghaba Salt Basin, and consistent with a general trend towards a proximal marine setting in the south-west. Incertae sedis No. 20 also occurs in Jaleel-1H2 (JL-1, Figure 11) in the Fahud Salt Basin and Musallim Deep-1H2 (MLMD-1) and Makarem-1 (MKM-1) on the Mabrouk-Makarem High, but is accompanied in those wells by acritarch genera and species that are associated with the more marine assemblages north-east of the Saih Nihayda area in the Ghaba Basin, notably Baltisphaerosum christoferii (MLMD-1, MKM-1H2), ‘Clypeolus’? sp. (MKM-1H2), Leiofusa,

Molyneux et al._Haima paper Page 12 12/15/2009
Stelliferidium and Striatotheca. Assemblages from cuttings and sidewall cores between 3980 m and 4088 m in Jaleel-1H2, for example, also include Goniosphaeridium conjunctum, Leiofusa sp., Stelliferidium cf. striatulum and Striatotheca principalis/frequens, all of which are characteristic of the Saih Nihayda microflora (cf. Svendsen 2004, figs 7, 8, who suggested an alternative correlation of the interval 3978–4072 m in Jaleel-1, with the Sahmah Formation, based on the log profile). Given the evidence for greater diversity in Jaleel-1H2, Musallim Deep-1H2 and Makarem-1, it is possible that only the more proximal parts of the Saih Nihadya succession above and/or below MFI O30 were sampled in Al Huwaisah-46 and Makarem-3H1. North-east of the Ghaba Basin, in the Saih Hatat region of the Oman Mountains (Figure 1), the acritarch assemblage recorded by Lovelock et al. (1981) from near the base of the Upper Siltstone Member of the Amdeh Formation in Wadi Kahza has the palynological characteristics of the Saih Nihayda, MFI O30 assemblage, with specimens attributable to the genera Arkonia, Micrhystridium, Protoleiosphaeridium (sphaeromorph acritarch), Striatotheca and Veryhachium. An assemblage from a shaly unit in Wadi Daiqa, about 50 km ESE of Wadi Kahza but from an unknown level in the Amdeh Formation, is also comparable with the Saih Nihayda assemblage, and includes specimens attributable to the acritarch genera Actinotodissus, Arkonia, Comasphaeridium, Goniosphaeridium, Leiofusa, Multiplicisphaeridium, Peteinosphaeridium, Stelliferidium and Striatotheca, and the chitinozoan genera Conochitina and Lagenochitina. The diversity of these assemblages is consistent with the shallow marine shelf environment suggested for the Upper Siltstone Member (Lovelock et al., 1981). MFI O10 There is some evidence for similar trends in the Mabrouk Member, although not as pronounced given the fewer well penetrations and the absence of marine indicators other than acritarchs. The most diverse acritarch assemblages occur in the north-east, with lower diversity in Khazzan-1H4/H5 (Figure 12). The reduction in acritarch diversity from north-east to south-west is not as great as that seen in the Saih Nihayda Formation, and cannot be corroborated because of the lack of data from other wells. Although the Mabrouk assemblage is known to occur in wells on the Mabrouk-Makarem High and in the Saih Nihayda area (Makarem-1H3, Makarem-3, Musallim Deep-1H2, Saih Nihayda-24; Figure 12), none of these occurrences have been documented in detail. Nevertheless, there is no evidence for the Mabrouk marine assemblage in the predominantly sandy succession in Mabrouk-4 or in ditch cutting samples below the Ghudun Formation in Saih Rawl-29 (Figure 8), suggesting that the Mabrouk marine flooding event did not extend that far to the south-west (Figure 12). Other maximum flooding intervals The trends exhibited by palynological assemblages from the Saih Nihayda Formation and Mabrouk Member are replicated to varying degrees in assemblages associated with other marine flooding events (Figures 8, 13). The Upper Cambrian Al Bashair assemblage is known from wells along the north-western flank of the Ghaba Salt Basin, although it is not known from wells in the Fahud Salt Basin, possibly because of a lack of penetration or lack of samples. The most southerly known occurrence of Upper Cambrian acritarchs indicative of the assemblage is in Mabrouk-4, where the occurrence of Retisphaeridium dichamerum? in a cuttings sample from 4952-4970 m suggests proximal marine conditions within a predominantly sandstone succession (Figure 8). More diverse Upper Cambrian assemblages, suggesting more open marine conditions, are known from wells towards the north-east, notably Burhaan West-1 and Kauther-1H1, albeit with further evidence for spatial differentiation of Upper Cambrian assemblages, either biostratigraphical or biogeographical. Ooidium? clavigerum (Plate 1: 11, 14), for example, is a common component of assemblages from Kauther-1H1 and the nearby Harmal-1H1 well, located north-east of the Maradi Fault Zone, but has not been recorded in Upper Cambrian assemblages from Burhaan West-1, Bout-1H2 or Khazzan-1H4/H5 (see Figures 11, 12 for locations).
Molyneux et al._Haima paper Page 13 12/15/2009
The Lower Ordovician Barakat assemblage, as noted above, is poorly understood and might be restricted to wells in the northernmost parts of the Ghaba and Fahud Salt basins (Figures 8, 13). There are no known records of palynological assemblages associated with the lowest four marine flooding events (Cm30–O30) south of the Central Oman High (Figure 13). In contrast, marine Upper Ordovician and Llandovery assemblages associated with the Hasirah (O40) and Sahmah (basal transgressive) marine shales are known from the South Oman Salt Basin and western Oman, the former extending much farther to the south-west than the record from Saih Rawl-29 (Figures 7, 8). Unpublished British Geological Survey (BGS) records indicate that Late Ordovician (O40) and Llandovery marine flooding events can be recognised palynologically in Yemen.
DISCUSSION The analysis of Haima palynology and biostratigraphy presented above, and summarised in Figure 8, shows that: 1. Marine flooding events identified in the Haima Supergroup are characterised by distinct
palynological assemblages (Figure 10), which fingerprint each flooding event and enable correlations between well sections to be built into models of sequence stratigraphy.
2. The marine assemblages associated with each of the marine flooding events pass upwards into more restricted assemblages or barren intervals that suggest more proximal marine or non-marine conditions, consistent with progradation, basin infill and shallowing following each flooding event.
3. Lateral changes in diversity and assemblage composition are consistent with onshore–offshore trends documented for Lower Palaeozoic marine palynological assemblages, and enable marine flooding events to be tracked from distal to proximal environments.
A number of consequences follow from this analysis. In the first place, biostratigraphical resolution is improved as the broad biozones of the scheme previously applied to the Haima Supergroup are replaced by a sequence of palynological events that are tied directly to marine flooding events. This is particularly so in the Mahatta Humaid Group, previously correlated with a single biozone but now shown to be capable of finer biostratigraphical resolution. The result is a more precise correlation between well sections, which has a direct impact on developing and understanding play concepts in the Haima Supergroup. In general terms, delineating the spread of marine flooding events helps to define the probable distribution of reservoir-seal pairs (Figure 13). A more specific outcome is exemplified by correlation of the Mahatta Humaid Group between Burhaan West-1 and Kauther-1H1 (Figure 14). Palynological characterisation of MFI O10 and MFI Cm30 enables more precise correlation between the two wells than the previously applied biozonal scheme, and demonstrates conclusively that the Barik Sandstone Member pinches out between them. As the pinchout of the Barik Sandstone forms a major stratigraphical trap for gas in the Haima Supergroup, precise correlation around this interval is an important pre-requisite for understanding the limits of that play. Delineation of the limits of marine flooding events, based on the occurrences of associated palynological assemblages (Figure 13), is consistent with the tectonic history of the Haima Supergroup deduced from other lines of evidence. Oterdoom et al. (1999) postulated a tectonic sag phase during deposition of the Mahatta Humaid Group, followed by a late phase of rifting and increased subsidence during deposition of the Ghudun Formation and Safiq Group. There is some indication that successive marine flooding events in the Mahatta Humaid Group did not penetrate as far to the south-west as the preceding event (Figure 13). Thus, event Cm30 seems to have penetrated the furthest, reaching at least as far as the Mabrouk area, north of the Central Oman High, whereas there is little palynological evidence

Molyneux et al._Haima paper Page 14 12/15/2009
for event O20, apart from possibly in the northernmost parts of the Fahud and Ghaba salt basins. The pattern is consistent with a tectonic sag phase during which sediment supply exceeded the rate of subsidence, so that the pattern of sedimentation is one of overall progradation. In contrast, the increased westward penetration of marine flooding events associated with the later rift phase is consistent with an increased rate of subsidence and relative rise in sea level, although the timing of the Caradoc and Llandovery events might also indicate eustatic as well as, or instead of, tectonic controls (cf. Sharland et al., 2001, table 2.3). The association of individual marine flooding events with unique palynological assemblages can also show where marine sections are missing, either through a facies change to more marginal environments or because of erosion. One such example is provided by the absence of the Saih Nihayda marine flooding event (O30) from Sinaw-1 in the north of the Ghaba Salt Basin (Figures 8, 13). Earlier (Mabrouk, O10, Barakat, O20) and later (Hasirah, O40) marine flooding events have been identified in Sinaw-1, based on palynological evidence, but there is no record of the Saih Nihayda event. Instead, the interval between the O40 and O20 events in Sinaw-1 comprises a sandy succession, with a thick sandstone unit at the base. Late Caradoc/earliest Ashgill chitinozoa have been reported from ditch cutting samples down to about 3540 m in Sinaw-1 (F. Paris, written communication, 2004), immediately above the Andam Formation in the well (Figure 8). This might indicate an unusual development of the Hasirah Formation in Sinaw-1, with a thick basal sandstone unit resting unconformably on the Andam Formation (Figure 8). Alternatively, the sandstone above the Andam Formation might be equivalent to the Ghudun Formation with caved Late Ordovician chitinozoans. Log picks place the top of the Saih Nihayda Formation at 2652 m (1 in Figure 8) and the top of the Ghudun Formation at 2920.7 m (2 in Figure 8), but the palynological evidence does not support the former. The top of MFI O40 is placed lower in the well at about 2750 m, based on the downhole increase in numbers of Caradoc chitinozoa. MFS O40 itself might be located at or close to the gamma high at about 2800 m. If the top of the Ghudun Formation is correctly located at 2920 m, the Saih Nihayda Formation could occur between that depth and the sandier interval at about 2815 m, but there is no palynological evidence to corroborate this. Hence, there are three possible interpretations for the Haima succession above the Andam Formation in Sinaw-1: (i) the entire succession is in the Hasirah Formation, which rests unconformably on the Andam Formation (Figure 8); (ii) the Ghudun Formation overlies the Andam Formation, but is itself overlain unconformably by the Hasirah Formation at about 2920 m; (iii) a Ghudun-Saih Nihayda-Hasirah succession is present, but with no palynological evidence for the Saih Nihayda Formation. Whichever interpretation is correct, it is likely that the Saih Nihayda marine flooding event (O30) either did not extend into the area of Sinaw-1, or the marine beds that it would have deposited were removed by erosion prior to deposition of the Hasirah Formation. Sinaw-1 is located close to the Huqf High, a structural high that formed the eastern margin of Oman’s salt basins, and for which Oterdoom et al. (1999) produced evidence of rift-shoulder uplift in late Early to early Late Ordovician times. Uplift of the Huqf High must inevitably have had some effect on the spread of Haima marine flooding events towards the east (Figure 13). A 39Ar/40Ar age of 461.2 ± 2.4 Ma for a mafic dyke intruded into the Huqf High during rift-shoulder uplift (Oterdoom et al., 1999) dates the intrusion as Middle Ordovician (GTS2004: Gradstein et al., 2004), during or immediately following deposition of the Saih Nihayda Formation (Figure 2). Earlier uplift of the rift shoulder could have limited the spread of the Saih Nihayda marine flooding event to the east, and the rift shoulder might have provided a source for the coarser clastic rocks deposited between the Barakat and Hasirah events in Sinaw-1. This paper has focussed primarily on the marine components of palynological assemblages from the Haima Supergroup on the grounds that marine flooding events affect these most

Molyneux et al._Haima paper Page 15 12/15/2009
directly. The terrestrial components, principally the cryptospores, mainly provide palaeoenvironmental rather than biostratigraphical information, but there is also some evidence for changes in cryptospore biodiversity through the Haima succession. The earliest cryptospore assemblages, from the Saih Nihayda Formation (e.g. in Burhaan West-1 and Kauther-1H1, Figures 4 and 5 respectively), are of low diversity, consisting mainly of naked laevigate dyads and tetrads. More diverse cryptospore assemblages are found at higher stratigraphical levels, in the Hasirah and Sahmah formations (e.g. in Saih Nihayda North-1, Figure 7), and also include dyads and tetrads enclosed in ornamented envelopes (Plate 3: 5). The diversity of the cryptospore microfloras from the Saih Nihayda Formation is apparently lower than the diversity reported by Strother et al. (1996) from the equivalent Hanadir Member (Qasim Formation) in Saudi Arabia. Nevertheless, the trend towards increasing diversity from the Middle Ordovician through the Late Ordovician and Llandovery, with the appearance of forms enclosed in ornamented envelopes in the Caradoc, exactly replicates the evolution of cryptospore biodiversity from the Middle Ordovician to Llandovery reported by Steemans and Wellman (2004, fig. 33.2). The study reported here considered the biostratigraphy of the Haima Supergroup in the context of sequence stratigraphy. In so doing, it has improved the resolution of biostratigraphical correlations and has contributed to an understanding of facies and therefore reservoir-seal distributions. There is some evidence that the same approach can be applied to Lower Palaeozoic successions across the Arabian Plate. Molyneux and Al-Hajri (2000) and Strother et al. (1996) both documented stratigraphical patterns of changes in assemblage composition in Saudi Arabia that replicate those seen in the Haima Supergroup of Oman. In a palynological study of a sandstone-dominated Lower Palaeozoic succession in central Saudi Arabia, Molyneux and Al-Hajri (2000) noted that assemblages were generally of low diversity and indicative of proximal marine conditions, but that infrequent occurrences of more diverse assemblages suggested open marine, shelf sea environments for strata at some levels. They suggested that the latter indicated episodes of coastal onlap, such as those responsible for deposition of the Hanadir and Ra’an members in northern Saudi Arabia, in otherwise marginal marine (or non-marine) successions. In a more detailed study of the Qusaiba Member of the Silurian Qalibah Formation in central Saudi Arabia, which combined palynology and sedimentology in the context of sequence stratigraphy, Miller and Melvin (2004) demonstrated that MFI S10 had a distinctive palynological character, and furthermore that each of several mud-prone cyclothems representing the distal parts of a Highstand Systems Tract (HST) above MFI S10 could be identified by its own palynological marker. These studies, together with the work reported in this paper, show that biostratigraphy, combined with sedimentology in the context of sequence stratigraphy, has a significant contribution to make towards understanding the stratigraphical architecture of economically important successions on the Arabian Plate, and beyond.
ACKNOWLEDGEMENTS We thank the Ministry of Oil and Gas, Oman, and Petroleum Development Oman for permission to publish. We thank Florentin Paris for discussion of the chitinozoans from Sinaw-1 and for his comments on a draft manuscript, Jim Riding for his comments on an earlier draft, and the referees, … and …, for their review comments. SGM publishes with the approval of the Executive Director, British Geological Survey (Natural Environment Research Council), U.K.
REFERENCES Achab, A. 1977. Les chitinozoaires de la zone à Climacograptus prominens elongatus de la
Formation de Vauréal (Ordovicien supérieur), Ile d’Anticosti, Québec. Canadian Journal of Earth Sciences, v. 14, p. 2193-2212.
Molyneux et al._Haima paper Page 16 12/15/2009
Armstrong, H.A., B.R. Turner, I.M. Makhlouf, G.P. Weedon, M. Williams, A. Al Smadi and A. Abu Salah 2005. Palaeogeography, Palaeoclimatology, Palaeoecology, v. 220, p. 273-289.
Dorning, K.J. 1981. Silurian acritarch distribution in the Ludlovian shelf sea of South Wales and the Welsh Borderland. In J.W. Neale and M.D. Brasier (Eds), Microfossils from recent and fossil shelf seas, Ellis Horwood Ltd, Chichester, p. 31-36.
Droste, H.H.J. 1997. Stratigraphy of the Lower Paleozoic Haima Supergroup of Oman. GeoArabia, v. 2, no. 4, p. 419-472.
Fortey, R.A. 1994. Late Cambrian trilobites from the Sultanate of Oman. Neues Jahrbuch für Geologie und Paläontologie, Abhandlungen, v. 194, p. 25-53.
Goldman, D., C.E. Mitchell and M.P. Joy 1999. The stratigraphic distribution of graptolites in the classic upper Middle Ordovician Utica Shale of New York State: an evolutionary succession or a response to relative sea-level change? Paleobiology, v. 25, p. 273-294.
Gradstein, F.M, J.G. Ogg, A.G. Smith and others 2004. A Geological Time Scale 2004. Cambridge University Press, 610p.
Hill, P.J. and S.G. Molyneux 1988. Biostratigraphy, palynofacies and provincialism of Late Ordovician-Early Silurian acritarchs from northeast Libya. In A. El-Arnauti, B. Owens and B. Thusu (Eds), Subsurface Palynostratigraphy of Northeast Libya, Garyounis University Publications, Benghazi, Libya, p. 27-43.
Jacobson, S.J. 1979. Acritarchs as paleoenvironmental indicators in Middle and Upper Ordovician rocks from Kentucky, Ohio and New York. Journal of Paleontology, v. 53, p. 1197-1212.
Keegan, J.B., S.M. Rasul and Y. Shaheen 1990. Palynostratigraphy of the Lower Palaeozoic, Cambrian to Silurian, sediments of the Hashemite Kingdom of Jordan. Review of Palaeobotany and Palynology, v. 66, p. 167-180.
Le Hérissé, A., H. Al-Tayyar and H. van der Eem 1995. Stratigraphic and palaeogeographical significance of Silurian acritarchs from Saudi Arabia. Review of Palaeobotany and Palynology, v. 89, p. 49-74.
Lovelock, P.E.R., T.L. Potter, E.B. Walsworth-Bell and W.M. Wiemer 1981. Ordovician rocks in the Oman Mountains: the Amdeh Formation. Geologie en Mijnbouw, v. 60, p. 487-495.
Lüning, S., J. Craig, D.K. Loydell, P. Štorch and B. Fitches 2000. Lower Silurian ‘hot shales’ in North Africa and Arabia: regional distribution and depositional model. Earth-Science Reviews, v. 49, p. 121-200.
Martin, F. 1993. Acritarchs: a review. Biological Reviews, v. 68, p. 475-538. McGillivray, J.G. and M.I. Husseini 1992. The Paleozoic Petroleum Geology of Central
Arabia. American Association of Petroleum Geologists Bulletin, v. 76, p. 1473-1490. Miller, M.A. 1996. Chitinozoa. In J. Jansonius and D. C. McGregor (Eds), Palynology:
principles and applications: American Association of Stratigraphic Palynologists Foundation, v. 1, p. 307-336.
Miller, M.A. and J. Melvin 2004. Significant new biostratigraphic horizons in the Qusaiba Member of the Silurian Qalibah Formation of central Saudi Arabia, and their sedimentologic expression in a sequence stratigraphic context. GeoArabia, v. 10, no. 1, p. 49-92.
Millson, J.A., C.G.L. Mercadier, S.E. Livera and J.M. Peters 1996. The Lower Palaeozoic of Oman and its context in the evolution of a Gondwanan continental margin. Journal of the Geological Society, London, v. 153, p. 213-230.
Molyneux, S.G. 1988. Late Ordovician acritarchs from northeast Libya. In A. El-Arnauti, B. Owens and B. Thusu (Eds), Subsurface Palynostratigraphy of Northeast Libya, Garyounis University Publications, Benghazi, Libya, p. 45-59.
Molyneux, S.G. and S. Al-Hajri 2000. Palynology of a problematic Lower Palaeozoic lithofacies in central Saudi Arabia. GeoArabia Special Publication no. 1, p. 18-41.
Molyneux, S.G. and F. Paris 1985. Late Ordovician Palynomorphs. Journal of Micropalaeontology, v. 4, p. 11-26.
Oterdoom, W.H., M.A. Worthing and M. Partington 1999. Petrological and tectonostratigraphic evidence for a Mid Ordovician rift pulse on the Arabian peninsula. GeoArabia, v. 4, no. 4, p. 467-500.

Molyneux et al._Haima paper Page 17 12/15/2009
Paris, F. 1988. Late Ordovician and Early Silurian chitinozoans from central and southern Cyrenaica. In A. El-Arnauti, B. Owens and B. Thusu (Eds), Subsurface Palynostratigraphy of Northeast Libya, Garyounis University Publications, Benghazi, Libya, p. 61-71.
Paris, F. 1990. The Ordovician chitinozoan biozones of the Northern Gondwana Domain. Review of Palaeobotany and Palynology, v. 66, p. 181-209.
Paris, F. and S. Al-Hajri 1995. New chitinozoan species from the Llandovery of Saudi Arabia. Revue de Micropaléontologie, v. 38, 311-328.
Servais, T., Jun Li, S. Molyneux and E. Raevskaya 2003. Ordovician organic-walled microphytoplankton (acritarch) distribution: the global scenario. Palaeogeography, Palaeoclimatology, Palaeoecology, v. 195, p. 149-172.
Sharland, P.R., R. Archer, D.M. Casey, R.B. Davies, S.H. Hall, A.P. Heward, A.D. Horbury and M.D. Simmons 2001. Arabian Plate sequence stratigraphy. GeoArabia Special Publication no. 2, 371 p.
Soufiane A. and A. Achab 2000. Chitinozoan zonation of the Late Ordovician and the Early Silurian of the island of Anticosti, Québec, Canada. Review of Palaeobotany and Palynology, v. 109, p. 85-111.
Steemans, P., and C. H. Wellman 2004. Miospores and the emergence of land plants. In B.D. Webby, F. Paris, M.L. Droser and I.G. Percival (Eds), The Great Ordovician Biodiversification Event, Columbia University Press, New York, p. 361-366.
Strother, P.K., S. Al-Hajri and A. Traverse 1996. New evidence for land plants from the lower Middle Ordovician of Saudi Arabia. Geology, v. 24, p. 55-58.
Svendsen, N.B. 2004. The Sahmah Formation of Oman: exploration implications for the Rub’ Al-Khali Basin. GeoArabia, v. 9, no. 3, p. 119-136.
Vecoli, M. 1996. Stratigraphic significance of acritarchs in Cambro-Ordovician boundary strata, Hassi-Rmel area, Algerian Sahara. Bollettino della Società Paleontologica Italiana, v. 35, p. 3-58.
Vecoli, M. 2000. Palaeoenvironmental interpretation of microphytoplankton diversity trends in the Cambrian-Ordovician of the northern Sahara Platform. Palaeogeography, Palaeoclimatology, Palaeoecology, v. 160, 329-346.
Volkova, N. 1990. Middle and Upper Cambrian acritarchs in the East European Platform. Akadameiia Nauk SSSR, Geologicheskii Institut, Trudy, v. 454, 116 p.
Webby, B.D., R.A Cooper, S. M. Bergström and F. Paris 2004. Stratigraphic Framework and Time Slices. In B.D. Webby, F. Paris, M.L. Droser and I.G. Percival (Eds), The Great Ordovician Biodiversification Event, Columbia University Press, New York, p. 41-47.
Wellman, C.H., P.L. Osterloff and U. Mohiuddin 2003. Fragments of the earliest land plants. Nature, v. 425, p. 282-284.
FIGURE CAPTIONS
Figure 1: Location of salt basins containing deposits of the Haima Supergroup in the subsurface of Oman, together with intervening basement highs. Figure 2: Lithostratigraphy, biostratigraphy, chronostratigraphy and maximum flooding intervals of the Haima Supergroup. The GTS2004 time scale is from Gradstein et al. (2004). Correlation of the Ordovician series and stages of GTS2004 with the standard British Ordovician series is modified from Webby et al. (2004). Figure 3: Schematic diagram illustrating lateral and vertical changes in marine palynological assemblage composition as a result of onshore–offshore trends in abundance and diversity. Maximum diversity and abundance occur in offshore shelf settings (A), but decrease onshore (B). The same trends can be expected in a well section that passes through a transgressive marine facies (C) overlain by prograding nearshore facies (D).

Molyneux et al._Haima paper Page 18 12/15/2009
Figure 4: Palynological range chart for Burhaan West-1, 3196-4800 m. Composite ditch cuttings samples of up to 4 m were collected at intervals of 4–24 m in the Saih Nihayda Formations, and 16 m composite ditch cuttings samples were collected at 20 m intervals in the basal Ghudun, Andam and upper Miqrat formations. Figure 5: Palynological range chart for Kauther-1H1, 2935-4270 m. Four metre composite ditch cuttings samples were collected at intervals of 8 m in the Saih Nihayda and topmost Ghudun formations, 16 m composite ditch cuttings samples were collected at 20 m intervals in the rest Ghudun and throughout the Andam formations, and 36 m composite ditch cuttings samples were collected at 40 m intervals in the Miqrat Formation. Figure 6: Palynological range chart for Khazzan-1H4/H5, 4310-4927 m. Ten metre composite ditch cuttings samples were collected at intervals of 20 m in the basal Ghudun Formation and Mabrouk Member, and 16 m composite ditch cuttings samples were collected at 20 m intervals through the rest of the Andam Formation and the Miqrat Formation. Figure 7: Palynological data from the Middle–Upper Ordovician successions in Saih Rawl-29 and Saih Nihayda North-1. Figure 8: Correlation panel for wells from north-east to south-west along the north-western flank of the Ghaba Salt Basin, flattened at the top of the Andam Formation, summarising data and interpretations discussed in the text. Inset map shows well locations. All depths are in metres ahd (along hole depth). Alternative interpretations for the succession above the Andam Formation in Sinaw-1 are discussed in the text. Figure 9: Palynological range chart for Wadi Qitbit-1, 3125-3280 m. Figure 10: Summary palynological range chart for the Haima Supergroup showing the composition of marine assemblages associated with each of the marine flooding events identified by Droste (1997) and Sharland et al. (2001). Figure 11: Biogeographical ranges of marine palynomorphs from the Saih Nihayda Formation (MFI O30), showing a reduction in diversity from north-east to south-west and the restricted occurrence of graptolite fragments. Grey portions of range bars indicate that there is no record of the palynomorph from the relevant well. Other wells not included in the analysis but discussed in the text are: AH-46, Al Huwaisah-46; JL-1, Jaleel-1H2; MBR-4, Mabrouk-4; MKM-1, Makarem-1; MKM-3, Makarem-3H1; MLMD-1, Musallim Deep-1H2. Figure 12: Biogeographical ranges of marine palynomorphs from the Mabrouk Member, Andam Formation (MFI O10), showing a reduction in diversity from north-east to south-west, although not as pronounced as in the Saih Nihayda Formation (Figure 11). Grey portions of range bars indicate that there is no record of the palynomorph from the relevant well. Other wells not included in the analysis but discussed in the text are: MBR-4, Mabrouk-4; MKM-1, Makarem-1H3; MKM-3, Makarem-3; MLMD-1, Musallim Deep-1H2; SN-24, Saih Nihayda-24; SR-29, Saih Rawl-29. Figure 13: Postulated spread of marine flooding events in the Haima Supergroup based on records of associated palynological assemblages. The Andam Formation at Qarn Mahatta Humaid in the Huqf outcrop area consists of three members in an upward deepening, coastal plain to shallow marine (intertidal to subtidal) succession, the middle (Andam unit 2) and base of the upper (Andam unit 3) members comprising a succession of supratidal to shallow subtidal cycles; the marine beds of the middle and upper members are dated as Late Cambrian by onshore biofacies trilobites (Fortey, 1994; Millson et al., 1996).

Molyneux et al._Haima paper Page 19 12/15/2009
Figure 14: Biostratigraphical correlation of marine flooding events in the Mahatta Humaid Group of Burhaan West-1 and Kauther-1H1. Palynological characterisation of MFI O10 and MFI Cm30 enables more precise correlation between the two wells than assignment of palynological assemblages to Zone 1108 (also shown) of the previously applied biozonal scheme, and demonstrates conclusively that the Barik Sandstone Member pinches out between the two wells.
PLATES Plate 1: Cambrian and Lower Ordovician acritarchs from the Al Bashair and Mabrouk
members, Andam Formation. Scale bar in (12) = 10 µm. All other specimens are at the same scale.
(1) Acanthodiacrodium sp. with network of filaments extending between processes (cf. Stellechinatum sicaforme contextum Servais & Molyneux 1997), Burhaan West-1, 4040 m, Mabrouk Member.
(2) Actinotodissus achrasii (Martin) Yin Leiming 1986, Harmal-1H1, 3750 m, probable Mabrouk Member.
(3) Acanthodiacrodium? aff. dilatum Molyneux 1988, Kauther-1H1, 3590 m, Mabrouk Member.
(4) Cymatiogalea velifera (Downie) Martin 1969, Kauther-1H1, 3670 m, Mabrouk Member. (5) sphaeromorph acritarch, Kauther-1H1, 3290 m, Ghudun Formation. (6) Villosacapsula? foraminifera (Pittau) Tongiorgi et al. 1994, Kauther-1H1, 3590 m, Mabrouk
Member. (7) Villosacapsula? foraminifera (Pittau) Tongiorgi et al. 1994, Harmal-1H1, 3750 m, probable
Mabrouk Member. (8) Villosacapsula? foraminifera (Pittau) Tongiorgi et al. 1994, Burhaan West-1, 4040 m,
Mabrouk Member. (9) Vulcanisphaera cirrita Rasul 1976, Al Bashair-1, 4660 m, probable Mabrouk Member. (10) Timofeevia phosphoritica Vanguestaine 1978, Burhaan West-1, 4438 m, Al Bashair
Member. (11) Ooidium? clavigerum Parsons & Anderson 2000, Harmal-1H1, 3970 m, probable Al
Bashair Member. (12) Saharidia fragilis (Downie) Combaz 1967, Kauther-1H1, 3750 m, Mabrouk Member. (13) Retisphaeridium dichamerum Staplin, Jansonius and Pocock 1965, Burhaan West-1, 4518
m, Al Bashair Member. (14) Ooidium? clavigerum Parsons & Anderson 2000, Kauther-1H1, 4070 m, Al Bashair
Member. (15) Retisphaeridium dichamerum Staplin, Jansonius and Pocock 1965, Burhaan West-1, 4518
m, Al Bashair Member. (16) Veryhachium dumontii Vanguestaine 1973, Burhaan West-1, 4578 m, Al Bashair Member. Plate 2: Middle Ordovician acritarchs (1-6), chitinozoa (7) and graptolite fragment (8) from
the Saih Nihayda Formation. Scale bars in (4), (8) = 10 µm. All other specimens are at the same scale as (4).
(1) Stelliferidium sp., Kauther-1H1, 2983.3 m (swc), Saih Nihayda Formation. (2) Striatotheca frequens Burmann 1970, Kauther-1H1, 2962 m, Saih Nihayda Formation. (3) Clypeolus? sp., Kauther-1H1, 3170 m, Ghudun Formation (probably caved). (4) Veryhachium trispinosum (Eisenack) Stockmans & Willière 1962, Kauther-1H1, 2983.3 m
(swc), Saih Nihayda Formation. (5) Incertae sedis No. 20 of Petroleum Development Oman, Kauther-1H1, 2983.3 m (swc),
Saih Nihayda Formation. (6) Incertae sedis No. 20, Bout-1H2, 3231 m, Saih Nihayda Formation. (7) Desmochitina sp., Bout-1H2, 3231 m, Saih Nihayda Formation. (8) Fragment of graptolite periderm, Kauther-1H1, 2983.3 m (swc), Saih Nihayda
Formation.
Molyneux et al._Haima paper Page 20 12/15/2009
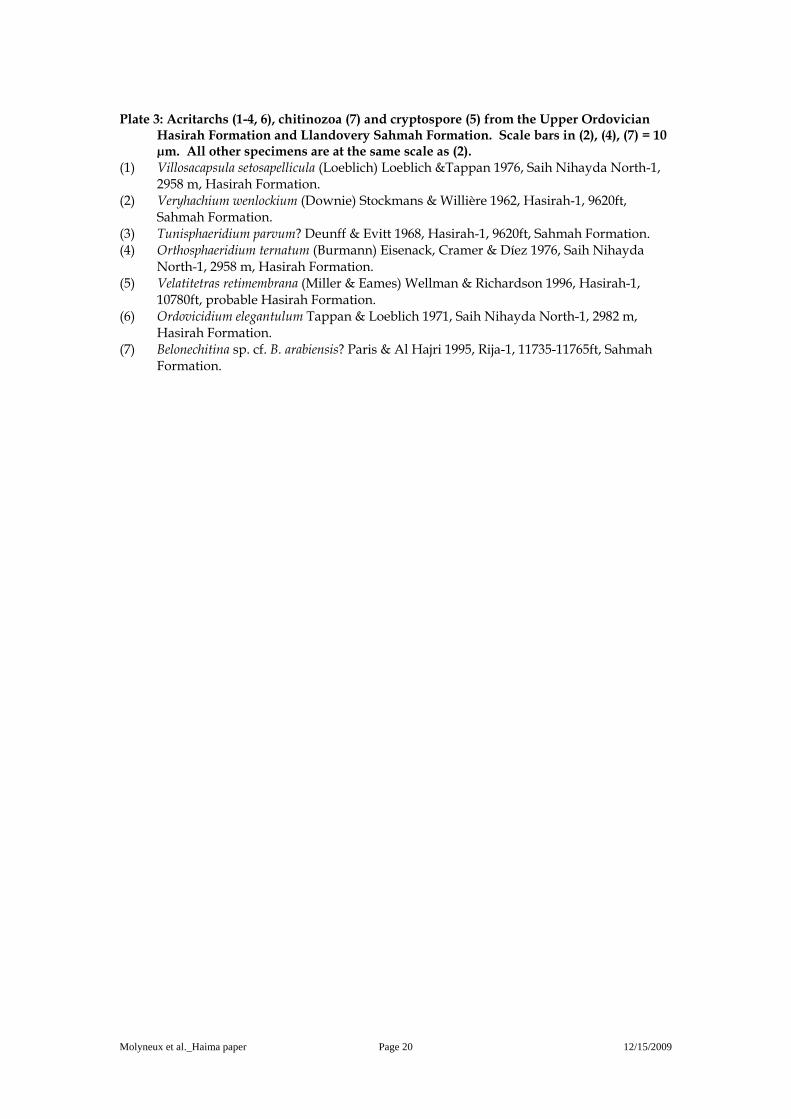
Plate 3: Acritarchs (1-4, 6), chitinozoa (7) and cryptospore (5) from the Upper Ordovician
Hasirah Formation and Llandovery Sahmah Formation. Scale bars in (2), (4), (7) = 10 µm. All other specimens are at the same scale as (2).
(1) Villosacapsula setosapellicula (Loeblich) Loeblich &Tappan 1976, Saih Nihayda North-1, 2958 m, Hasirah Formation.
(2) Veryhachium wenlockium (Downie) Stockmans & Willière 1962, Hasirah-1, 9620ft, Sahmah Formation.
(3) Tunisphaeridium parvum? Deunff & Evitt 1968, Hasirah-1, 9620ft, Sahmah Formation. (4) Orthosphaeridium ternatum (Burmann) Eisenack, Cramer & Díez 1976, Saih Nihayda
North-1, 2958 m, Hasirah Formation. (5) Velatitetras retimembrana (Miller & Eames) Wellman & Richardson 1996, Hasirah-1,
10780ft, probable Hasirah Formation. (6) Ordovicidium elegantulum Tappan & Loeblich 1971, Saih Nihayda North-1, 2982 m,
Hasirah Formation. (7) Belonechitina sp. cf. B. arabiensis? Paris & Al Hajri 1995, Rija-1, 11735-11765ft, Sahmah
Formation.
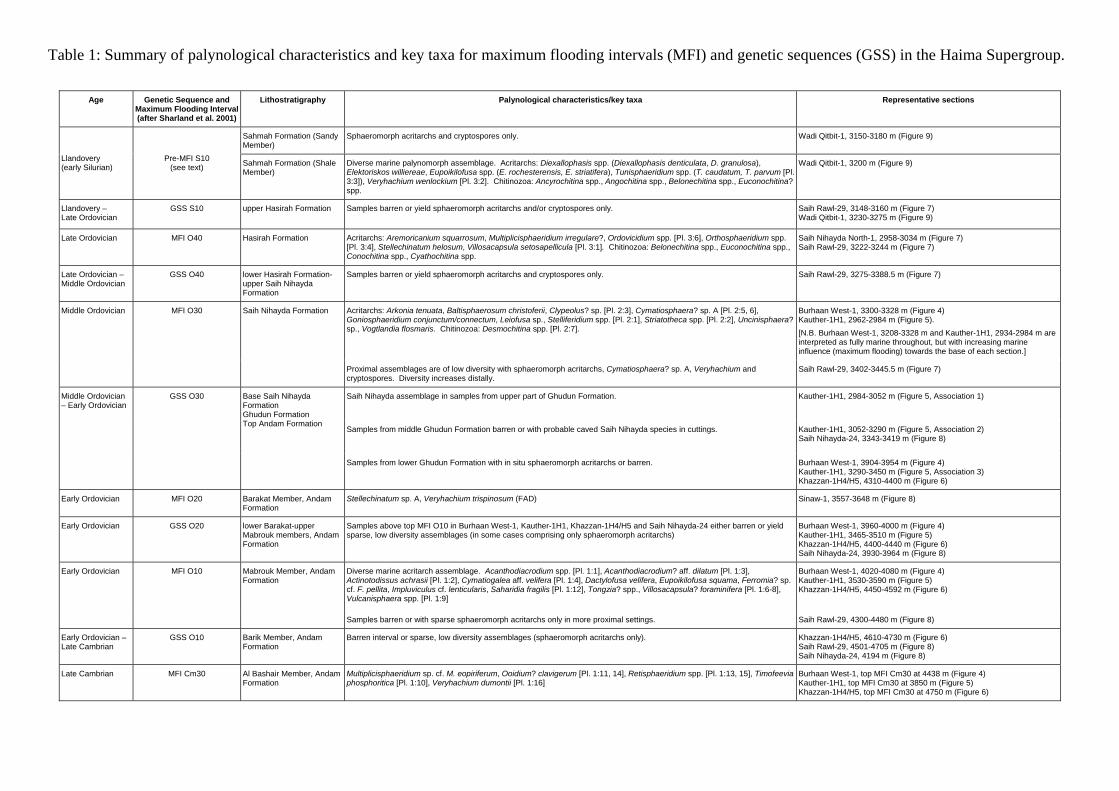
Table 1: Summary of palynological characteristics and key taxa for maximum flooding intervals (MFI) and genetic sequences (GSS) in the Haima Supergroup.
Age Genetic Sequence and Maximum Flooding Interval (after Sharland et al. 2001)
Lithostratigraphy Palynological characteristics/key taxa Representative sections
Sahmah Formation (Sandy Member)
Sphaeromorph acritarchs and cryptospores only. Wadi Qitbit-1, 3150-3180 m (Figure 9)
Llandovery (early Silurian)
Pre-MFI S10 (see text)
Sahmah Formation (Shale Member)
Diverse marine palynomorph assemblage. Acritarchs: Diexallophasis spp. (Diexallophasis denticulata, D. granulosa), Elektoriskos williereae, Eupoikilofusa spp. (E. rochesterensis, E. striatifera), Tunisphaeridium spp. (T. caudatum, T. parvum [Pl. 3:3]), Veryhachium wenlockium [Pl. 3:2]. Chitinozoa: Ancyrochitina spp., Angochitina spp., Belonechitina spp., Euconochitina? spp.
Wadi Qitbit-1, 3200 m (Figure 9)
Llandovery – Late Ordovician
GSS S10 upper Hasirah Formation Samples barren or yield sphaeromorph acritarchs and/or cryptospores only. Saih Rawl-29, 3148-3160 m (Figure 7) Wadi Qitbit-1, 3230-3275 m (Figure 9)
Late Ordovician MFI O40 Hasirah Formation Acritarchs: Aremoricanium squarrosum, Multiplicisphaeridium irregulare?, Ordovicidium spp. [Pl. 3:6], Orthosphaeridium spp. [Pl. 3:4], Stellechinatum helosum, Villosacapsula setosapellicula [Pl. 3:1]. Chitinozoa: Belonechitina spp., Euconochitina spp., Conochitina spp., Cyathochitina spp.
Saih Nihayda North-1, 2958-3034 m (Figure 7) Saih Rawl-29, 3222-3244 m (Figure 7)
Late Ordovician – Middle Ordovician
GSS O40 lower Hasirah Formation-upper Saih Nihayda Formation
Samples barren or yield sphaeromorph acritarchs and cryptospores only. Saih Rawl-29, 3275-3388.5 m (Figure 7)
Acritarchs: Arkonia tenuata, Baltisphaerosum christoferii, Clypeolus? sp. [Pl. 2:3], Cymatiosphaera? sp. A [Pl. 2:5, 6], Goniosphaeridium conjunctum/connectum, Leiofusa sp., Stelliferidium spp. [Pl. 2:1], Striatotheca spp. [Pl. 2:2], Uncinisphaera? sp., Vogtlandia flosmaris. Chitinozoa: Desmochitina spp. [Pl. 2:7].
Burhaan West-1, 3300-3328 m (Figure 4) Kauther-1H1, 2962-2984 m (Figure 5).
[N.B. Burhaan West-1, 3208-3328 m and Kauther-1H1, 2934-2984 m are interpreted as fully marine throughout, but with increasing marine influence (maximum flooding) towards the base of each section.]
Middle Ordovician MFI O30 Saih Nihayda Formation
Proximal assemblages are of low diversity with sphaeromorph acritarchs, Cymatiosphaera? sp. A, Veryhachium and cryptospores. Diversity increases distally.
Saih Rawl-29, 3402-3445.5 m (Figure 7)
Saih Nihayda assemblage in samples from upper part of Ghudun Formation. Kauther-1H1, 2984-3052 m (Figure 5, Association 1)
Samples from middle Ghudun Formation barren or with probable caved Saih Nihayda species in cuttings. Kauther-1H1, 3052-3290 m (Figure 5, Association 2) Saih Nihayda-24, 3343-3419 m (Figure 8)
Middle Ordovician – Early Ordovician
GSS O30 Base Saih Nihayda Formation Ghudun Formation Top Andam Formation
Samples from lower Ghudun Formation with in situ sphaeromorph acritarchs or barren. Burhaan West-1, 3904-3954 m (Figure 4) Kauther-1H1, 3290-3450 m (Figure 5, Association 3) Khazzan-1H4/H5, 4310-4400 m (Figure 6)
Early Ordovician MFI O20 Barakat Member, Andam Formation
Stellechinatum sp. A, Veryhachium trispinosum (FAD) Sinaw-1, 3557-3648 m (Figure 8)
Early Ordovician GSS O20 lower Barakat-upper Mabrouk members, Andam Formation
Samples above top MFI O10 in Burhaan West-1, Kauther-1H1, Khazzan-1H4/H5 and Saih Nihayda-24 either barren or yield sparse, low diversity assemblages (in some cases comprising only sphaeromorph acritarchs)
Burhaan West-1, 3960-4000 m (Figure 4) Kauther-1H1, 3465-3510 m (Figure 5) Khazzan-1H4/H5, 4400-4440 m (Figure 6) Saih Nihayda-24, 3930-3964 m (Figure 8)
Diverse marine acritarch assemblage. Acanthodiacrodium spp. [Pl. 1:1], Acanthodiacrodium? aff. dilatum [Pl. 1:3], Actinotodissus achrasii [Pl. 1:2], Cymatiogalea aff. velifera [Pl. 1:4], Dactylofusa velifera, Eupoikilofusa squama, Ferromia? sp. cf. F. pellita, Impluviculus cf. lenticularis, Saharidia fragilis [Pl. 1:12], Tongzia? spp., Villosacapsula? foraminifera [Pl. 1:6-8], Vulcanisphaera spp. [Pl. 1:9]
Burhaan West-1, 4020-4080 m (Figure 4) Kauther-1H1, 3530-3590 m (Figure 5) Khazzan-1H4/H5, 4450-4592 m (Figure 6)
Early Ordovician MFI O10 Mabrouk Member, Andam Formation
Samples barren or with sparse sphaeromorph acritarchs only in more proximal settings. Saih Rawl-29, 4300-4480 m (Figure 8)
Early Ordovician – Late Cambrian
GSS O10 Barik Member, Andam Formation
Barren interval or sparse, low diversity assemblages (sphaeromorph acritarchs only). Khazzan-1H4/H5, 4610-4730 m (Figure 6) Saih Rawl-29, 4501-4705 m (Figure 8) Saih Nihayda-24, 4194 m (Figure 8)
Late Cambrian MFI Cm30 Al Bashair Member, Andam Formation
Multiplicisphaeridium sp. cf. M. eopiriferum, Ooidium? clavigerum [Pl. 1:11, 14], Retisphaeridium spp. [Pl. 1:13, 15], Timofeevia phosphoritica [Pl. 1:10], Veryhachium dumontii [Pl. 1:16]
Burhaan West-1, top MFI Cm30 at 4438 m (Figure 4) Kauther-1H1, top MFI Cm30 at 3850 m (Figure 5) Khazzan-1H4/H5, top MFI Cm30 at 4750 m (Figure 6)

Molyneux et al. Figure 1.
Saudi Arabia
United ArabEmirates
54°24°
22°
20°
18°
56° 58°
Muscat
Gulf of Oman
Arabian Sea
100 km(approximate)
Central Oman High
FahudSalt Basin
South OmanSalt Basin
O
MAN
MOUNTAINS
Figures 11, 12
Mabrouk-Makarem High MaradiFault Zone
GhabaSalt Basin
N
Saih Hatat

Molyneux et al., Figure 2.
MFI(Sharland
et al., 2001)
N Chronostratigraphy S
Saih NihaydaFm.
Sahmah Fm.
Hasirah Fm.
Al BashairMbr
Ghudun Fm.
Mabrouk Mbr
Barik Sst Mbr
Miqrat Fm.(Mahwis Fm.)
Amin Fm.
Barakat Mbr
Safiq
Gro
up
Mahatta
Hum
aid
Gro
up
Haim
a S
uperg
roup
An
da
m F
m.
Lithostratigraphy(Droste, 1997)
Nimr Group Huqf Supergroup
O30
O40
O10
O20
Cm30
Angudan Unconformity
BritishOrdovician
Series
Intervalbiozones(Droste,1997)
1003
1098
1108
1012
1005
Arenig
Tremadoc
Llanvirn
Caradoc
Ashgill
430
440
450
460
470
480
490
500
510
Lla
nd
ove
ryU
pp
er
Mid
dle
Lo
we
rU
pp
er
Mid
dle
Hirnantian
Stage 6
Stage 5
Darriwilian
Stage 3
Stage 2
Tremad-ocian
Silu
rian
Ord
ovic
ian
Cam
brian
Lower(part)
Ma Series/Stages
GTS2004
S10?
(latest Ordovician-basal Siluriantransgression)
Rhuddanian
Aeronian
Telychian

Molyneux et al., Figure 3.
AB
C
D
non-marine
onshoreshallowmarine
offshoremarineshelf
Facies
Abundance and diversity of marine palynologicalassemblages. The thickness of the line increaseswith increasing abundance and diversity.
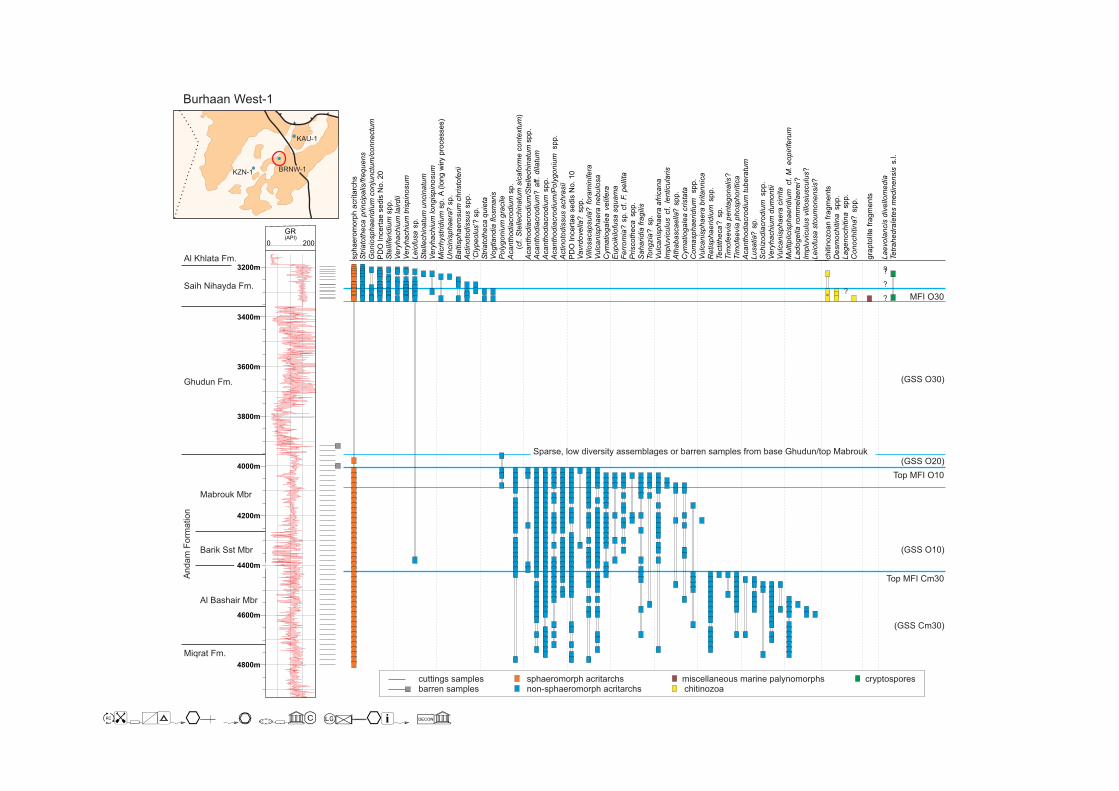
Molyneux et al., Figure 4.
Burhaan West-1
KZN-1
KAU-1
BRNW-1
cuttings samplesbarren samples
sphaeromorph acritarchsnon-sphaeromorph acritarchs chitinozoa
miscellaneous marine palynomorphs cryptospores
MFI O30
Top MFI O10
Top MFI Cm30
(GSS O30)
(GSS O20)
(GSS O10)
(GSS Cm30)
sp
ha
ero
mo
rph
acri
tarc
hs
Str
iato
the
ca
Ste
llife
rid
ium
sp
p.
Ve
ryh
ach
ium
lair
dii
Ve
ryh
ach
ium
tris
pin
osu
mL
eio
fusa
sp
.S
telle
ch
ina
tum
un
cin
atu
mV
ery
ha
ch
ium
lon
gis
pin
osu
mM
icrh
ystr
idiu
msp
.A
(long w
iry p
rocesses)
Un
cin
isp
ha
era
?sp
.B
altis
ph
ae
rosu
mch
risto
feri
iA
ctin
oto
dis
su
ssp
p.
‘’?
sp.
Cly
peolu
s
Str
iato
the
ca
qu
ieta
Vo
gtla
nd
iaflo
sm
ari
sP
oly
go
niu
mg
racile
Acanth
odia
cro
diu
mS
telle
chin
atu
m s
icafo
rme c
onte
xtu
msp.
(cf.
)
PD
O Incert
ae s
edis
No. 20
Go
nio
sp
ha
eri
diu
mco
nju
nctu
m/c
on
ne
ctu
m
?
??
?
?
Acanth
odia
cro
diu
m/S
telle
chin
atu
mspp.
Aca
nth
od
iacro
diu
m?
aff.
dila
tum
Aca
nth
od
iacro
diu
msp
p.
Aca
nth
od
iacro
diu
m/P
oly
go
niu
mspp.
Actin
oto
dis
su
sa
ch
rasii
PD
O Incert
ae s
edis
No. 10
Va
vrd
ove
lla?
sp
p.
Vill
osa
ca
psu
la?
fora
min
ife
raV
ulc
an
isp
ha
era
ne
bu
losa
Cym
atio
ga
lea
ve
life
raE
up
oik
ilofu
sa
sq
ua
ma
Fe
rro
mia
?sp
.cf.
F.p
elli
taP
risco
the
ca
sp
p.
Sa
ha
rid
iafr
ag
ilis
To
ng
zia
?sp
.V
ulc
an
isp
ha
era
afr
ica
na
Imp
luvic
ulu
scf.
len
ticu
lari
sA
tha
ba
sca
ella
?sp
p.
Cym
atio
ga
lea
cri
sta
taC
om
asp
ha
eri
diu
msp
p.
Vu
lca
nis
ph
ae
rab
rita
nn
ica
Re
tisp
ha
eri
diu
msp
p.
Te
ctith
eca
?sp
.T
imo
fee
via
pe
nta
go
na
lis?
Tim
ofe
evia
ph
osp
ho
ritica
Aca
nth
od
iacro
diu
mtu
be
ratu
mL
usa
tia?
sp
.S
ch
izo
dia
cro
diu
msp
p.
Ve
ryh
ach
ium
du
mo
ntii
Vu
lca
nis
ph
ae
racir
rita
Mu
ltip
licis
ph
ae
rid
ium
cf.
M.e
op
irife
rum
La
do
ge
llaro
mm
ela
ere
i?Im
plu
vic
ulu
svill
osiu
scu
lus?
Le
iofu
sa
sto
um
on
en
sis
?
ch
itin
ozo
an
fra
gm
en
tsD
esm
och
itin
asp
p.
La
ge
no
ch
itin
asp
p.
Co
no
ch
itin
a?
sp
p.
gra
pto
lite
fra
gm
en
ts
La
evo
lan
cis
div
ello
me
dia
Te
tra
he
dra
lete
sm
ed
ine
nsis
s.l.
Sparse, low diversity assemblages or barren samples from base Ghudun/top Mabrouk
fre
qu
en
sprincip
alis
/
Al Khlata Fm.
Saih Nihayda Fm.
Ghudun Fm.
Mabrouk Mbr
Barik Sst Mbr
Al Bashair Mbr
Miqrat Fm.
Andam
Form
ation
GR(API)
0 200
3400m
3600m
3800m
4000m
4200m
4600m
4800m
3200m
4400m

Al Khlata Fm.
Saih Nihayda Fm.
Ghudun Fm.
Mabrouk Mbr
Al Bashair Mbr
Miqrat Fm.
Amin Fm.
An
da
m F
orm
atio
n
Kauther-1H1
3000m
3200m
3400m
3600m
3800m
4000m
4200m
GR(API)
0 200
KZN-1BRNW-1
KAU-1
sp
ha
ero
mo
rph
acri
tarc
hs
Ba
ltis
ph
ae
rosu
mch
risto
feri
i
Ste
llife
rid
ium
sp
p.
Str
iato
the
ca
pri
ncip
alis
/fre
qu
en
sV
ery
ha
ch
ium
lair
dii
Actin
oto
dis
su
ssp
p.
Le
iofu
sa
sp
.V
ery
ha
ch
ium
tris
pin
osu
mU
ncin
isp
ha
era
?sp
.S
telle
ch
ina
tum
aff.
ce
lestu
m
‘’?
sp.
Cly
peolu
sV
ery
ha
ch
ium
lon
gis
pin
osu
m?
Ark
on
iate
nu
ata
Mic
rhystr
idiu
ma
rem
ori
ca
nu
m?
Aca
nth
od
iacro
diu
mcf.
rotu
nd
atu
mA
ca
nth
od
iacro
diu
m/P
oly
go
niu
mspp.
Aca
nth
od
iacro
diu
m?
aff.
dila
tum
Pri
sco
the
ca
?sp
p.
Va
vrd
ove
lla?
sp
p.
Vill
osa
ca
psu
la?
fora
min
ife
raA
ca
nth
od
iacro
diu
msp
p.
Actin
oto
dis
su
sa
ch
rasii
Vulc
anis
phaera
nebulo
sa
Cym
atio
ga
lea
cri
sta
taC
ym
atio
ga
lea
ve
life
raF
err
om
ia?
sp
.cf.
F.p
elli
taIm
plu
vic
ulu
scf.
len
ticu
lari
s
PD
O Incert
ae
sedis
No. 10
Ste
llech
ina
tum
sic
afo
rme
co
nte
xtu
mS
telle
ch
ina
tum
sic
afo
rme
sic
afo
rme
Ve
ryh
ach
ium
lair
dii
?V
ulc
an
isp
ha
era
afr
ica
na
Vu
lca
nis
ph
ae
raa
ff.
turb
ata
Ath
ab
asca
ella
?sp
p.
Po
lyg
on
ium
gra
cile
Eu
po
ikilo
fusa
sq
ua
ma
Po
lyg
on
ium
?sp
.(g
ran
ula
te)
Da
cty
lofu
sa
ve
life
raTe
ctith
eca
?sp
.To
ng
zia
?sp
p.
Go
nio
sp
ha
eri
diu
mco
nju
nctu
m/c
on
ne
ctu
mM
icrh
ystr
idiu
msp
.A
(long w
iry
pro
cesses)
PD
O Incert
ae
sedis
No. 20
sAca
nth
od
iacro
diu
ma
ff.u
bu
iS
telli
feri
diu
msim
ple
x?
Sa
ha
rid
iafr
ag
ilis
Cri
sta
llin
ium
cf.
ca
mb
rie
nse
Vu
lca
nis
ph
ae
rab
rita
nn
ica
?O
oid
ium
?cla
vig
eru
mR
etisp
ha
eri
diu
msp
p.
Ve
ryh
ach
ium
du
mo
ntii
Mic
rhystr
idiu
m/P
oly
go
niu
msp
.C
om
asp
ha
eri
diu
msp
.C
on
och
itin
asp
p.
Cya
tho
ch
itin
a?
sp
.chitin
ozoa
Pis
tilla
ch
itin
aca
pita
ta?
Co
no
ch
itin
a?
sp
p.
Rh
ab
do
ch
itin
a?
sp
.g
rap
tolit
efr
ag
me
nts
co
leco
do
nts
La
evo
lan
cis
?sp
p.
Te
tra
he
dra
lete
sm
ed
ine
nsis
s.l.
tetr
ad
sd
ya
ds
Aca
nth
od
iacro
diu
mS
telle
ch
ina
tum
sic
afo
rme
co
nte
xtu
msp
.(c
f.)
MFI O30
Association 1
Top MFI O10
Association 2
colour change
Top MFI Cm30
Association 3
(GSS O30)
(GSS O20)
(GSS O10)
(GSS Cm30)
cuttings samplessidewall core samplesbarren samples
sphaeromorph acritarchsnon-sphaeromorph acritarchschitinozoa
miscellaneous marine palynomorphscryptospores
Molyneux et al., Figure 5.

Molyneux et al, Figure 6.
Khazzan-1H4/H5
GhudunFm.
MabroukMbr
BarikSst Mbr
Al BashairMbr
Miqrat Fm.
Andam
Form
ation
4200m
4400m
4600m
4800m
5000m
GR(API)
0 200
KAU-1
BRNW-1KZN-1
cuttings samples
barren samples
sphaeromorph acritarchs
non-sphaeromorph acritarchs
sp
ha
ero
mo
rph
acri
tarc
hs
Aca
nth
od
iacro
diu
m?
aff.
dila
tum
Cym
atio
ga
lea
ve
life
raP
oly
go
niu
mg
racile
Pri
sco
the
ca
sp
p.
Ste
llech
ina
tum
un
cin
atu
m?
Aca
nth
od
iacro
diu
msp
p.
Actin
oto
dis
su
sa
ch
rasii
Vill
osa
ca
psu
la?
fora
min
ife
raV
ulc
an
isp
ha
era
afr
ica
na
Vu
lca
nis
ph
ae
ran
eb
ulo
sa
To
ng
zia
?sp
p
Ath
ab
asca
ella
?sp
p.
Sch
izo
dia
cro
diu
m?
sp
p.
Cym
atio
ga
lea
cf.
cri
sta
taE
up
oik
ilofu
sa
sq
ua
ma
Re
tisp
ha
eri
diu
msp
p.
Vu
lca
nis
ph
ae
rab
rita
nn
ica?
Co
ma
sp
ha
eri
diu
m?
sp
p.
Mu
ltip
licis
ph
ae
rid
ium
cf.
M.e
op
irife
rum
Tim
ofe
evia
pe
nta
go
na
lis?
Ve
ryh
ach
ium
du
mo
ntii
Top MFI O10
Top MFI Cm30
Sparse, low diversity assemblages or barrensamples from base Ghudun/top Mabrouk
Sparse, low diversity assemblages or barrensamples from Barik Member
(GSS O30)
(GSS O20)
(GSS O10)
(GSS Cm30)
Acanth
odia
cro
diu
mS
telle
chin
atu
m s
icafo
rme c
onte
xtu
msp. (c
f.)
Aca
nth
od
iacro
diu
m/P
oly
go
niu
msp
p.
Acanth
odia
cro
diu
m/S
telle
chin
atu
mspp.

Top MFI O
40
GSS S10
GSS O40
HasirahFormation
GhudunFormation
MFI O30(in proximalsetting)
FDO S
aih N
ihayd
a specie
s
Top MFI O30
Base Permian
Dep
th
3100m
3150m
3200m
3250m
3300m
3350m
3450m
3500m
sp
ha
ero
mo
rph
acri
tarc
hs
Ord
ovic
idiu
m?
sp
p.
Ve
ryh
ach
ium
tris
pin
osu
mB
ara
ke
lla?
aff.
fort
un
ata
Ste
llech
ina
tum
he
losu
mV
ery
ha
ch
ium
sp
p.
Vill
osa
ca
psu
lase
tosa
pe
llicu
laG
on
iosp
ha
eri
diu
m?
sp
p.
Ka
hfia
?sp
.L
eio
fusa
sp
p.
Mu
ltip
licis
ph
ae
rid
ium
irre
gu
lare
Mu
ltip
licis
ph
ae
rid
ium
sp
p.
Ort
ho
sp
ha
eri
diu
msp
p.
Po
lyg
on
ium
sp
p.
PD
O Incert
ae s
edis
No. 20
?
Acritarchs
chitin
ozoa
Pis
tilla
ch
itin
aca
pita
ta?
CT
cry
pto
sp
ore
sD
ya
do
sp
ora
mu
rusa
tte
nu
ata
s.l.
Te
tra
he
dra
lete
sm
ed
ine
nsis
CS
Saih Rawl-29(SR-29)
GR
(API)
0 200
3400m
s.l.
Dep
th
2900m
2950m
3000m
3050m
3200m
3250msp
ha
ero
mo
rph
acri
tarc
hs
Ba
ltis
ph
ae
rid
ium
filo
su
m-f
lag
elli
cu
mg
rp.
Ba
ltis
ph
ae
rid
ium
sp
p.
Ch
ele
uto
ch
roa
?sp
p.
Mic
rhystr
idiu
msp
p.
Mo
ye
ria
ca
bo
ttii
Mu
ltip
licis
ph
ae
rid
ium
irre
gu
lare
Ort
ho
sp
ha
eri
diu
msp
p.
Ort
ho
sp
ha
eri
diu
mte
rna
tum
Ste
llech
ina
tum
he
losu
m-c
ele
stu
mg
rp.
Ve
ryh
ach
ium
okla
ho
me
nse
-lo
ng
isp
ino
su
mg
rp.
Ve
ryh
ach
ium
tris
pin
osu
mV
illo
sa
ca
psu
lase
tosa
pe
llicu
laa
ca
nth
om
orp
ha
cri
tarc
hs
Ba
rake
lla?
aff.
fort
un
ata
Fili
sp
ha
eri
diu
m?
sp
p.
Ord
ovic
idiu
me
leg
an
tulu
mV
ery
ha
ch
ium
lair
dii
Actin
oto
dis
su
scra
ssu
sO
rth
osp
ha
eri
diu
mq
ua
dri
na
tum
Str
iato
the
ca
princip
alis
/fre
quens
Le
iofu
sa
sp
p.
Ste
llife
rid
ium
sp
p.
Ba
ltis
ph
ae
rosu
mch
risto
feri
i‘C
lypeolu
s’?
sp.
?
?
Acritarchs
Co
no
ch
itin
asp
p.
Euconochitin
a? s
pp.
Be
lon
ech
itin
asp
p.
Cya
tho
ch
itin
asp
p.
De
sm
och
itin
asp
p.
Pis
tilla
ch
itin
aca
pita
ta?
Chitinozoa
Dya
do
sp
ora
mu
rusa
tte
nu
ata
s.l.
dya
ds
La
evo
lan
cis
div
ello
me
dia
Pse
ud
od
ya
do
sp
ora
lae
vig
ata
Se
ge
str
esp
ora
lae
vig
ata
Se
ge
str
esp
ora
me
mb
ran
ife
raS
eg
estr
esp
ora
rug
osa
Se
ge
str
esp
ora
sp
p.
tetr
ad
sTe
tra
he
dra
lete
sm
ed
ine
nsis
Te
tra
lete
s?
sp
.V
ela
tite
tra
sre
tim
em
bra
na
La
evo
lan
cis
sp
p.
? ? ?
Cryptospores
sco
leco
do
nts
Saih Nihayda North-1(SNN-1)
GR
(API)
0 200
3100m
PD
O Incert
ae s
edis
No. 20
chitin
zoa
s.l.
SaihNihayda
Formation
sidewall core samples
cuttings samples
barren samples
sphaeromorph acritarchs
non-sphaeromorph acritarchs
chitinozoa (CT)
cryptospores (CS)
miscellaneous marine palynomorphs
SNN-1
SR-29
Molyneux et al., Figure 7
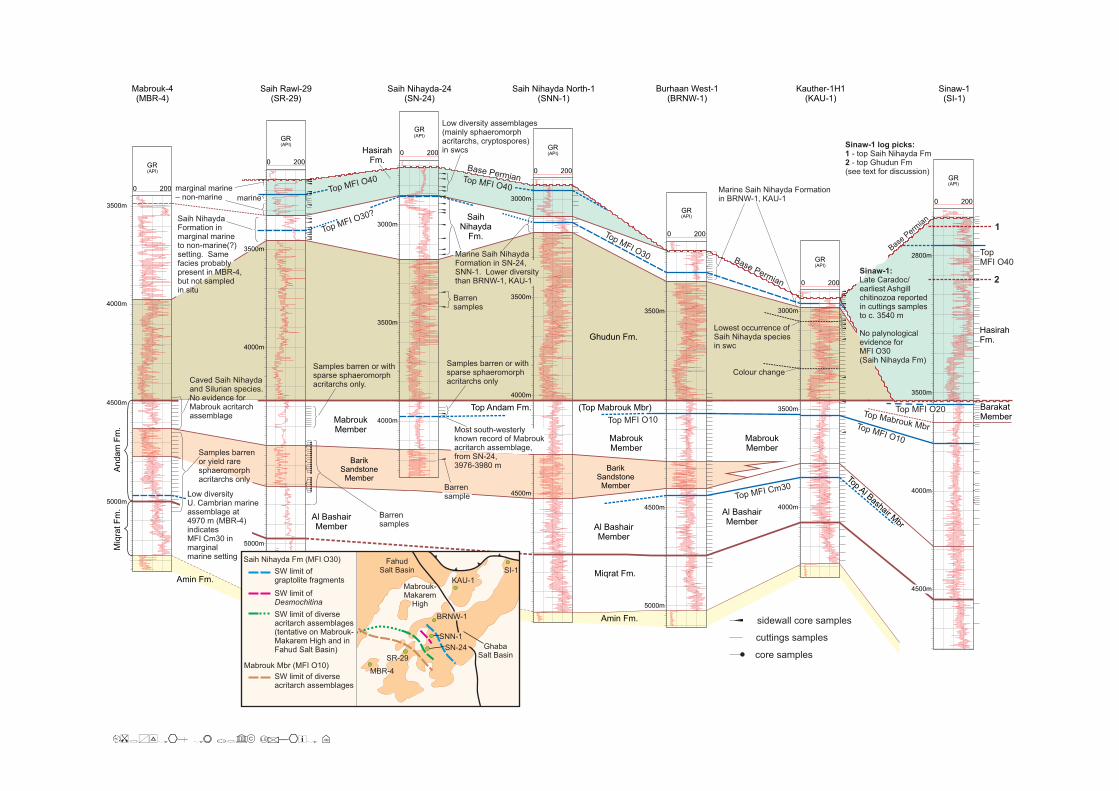
Molyneux et al., Figure 8
3500m
4000m
4500m
5000m
GR(API)
0 200
GR(API)
0 200
GR(API)
0 200
GR(API)
0 200
GR(API)
0 200
GR(API)
0 200
GR(API)
0 200
3000m
3500m
4000m
3000m
3500m
4000m
4500m
3500m
4500m
5000m
3000m
3500m
4000m
Mabrouk-4(MBR-4)
Saih Rawl-29(SR-29)
Saih Nihayda-24(SN-24)
Saih Nihayda North-1(SNN-1)
Burhaan West-1(BRNW-1)
Kauther-1H1(KAU-1)
Sinaw-1(SI-1)
HasirahFm.
HasirahFm.
SaihNihayda
Fm.
Ghudun Fm.
An
da
m F
m.
Miqrat Fm.
Miq
rat
Fm
.
Amin Fm.
BarakatMember
MabroukMember
MabroukMember
BarikSandstone
Member
Top Andam Fm. (Top Mabrouk Mbr)
Al BashairMember
Al BashairMember
TopAl Bashair M
br
Top MFI O40
TopMFI O40
Top MFI O30
Top Mabrouk MbrTop MFI O10
Top MFI Cm30
Base Permian
Base Permian
Base P
ermia
n
Lowest occurrence ofSaih Nihayda speciesin swc
Colour change
marginal marine– non-marine marine
Marine Saih Nihayda Formationin BRNW-1, KAU-1
Sinaw-1 log picks:
1
2
- top Saih Nihayda Fm- top Ghudun Fm
(see text for discussion)
Top MFI O30?
Samples barren or withsparse sphaeromorphacritarchs only.
Samples barren or withsparse sphaeromorphacritarchs only
Barrensamples
Top MFI O10
Barrensamples
Low diversity assemblages(mainly sphaeromorphacritarchs, cryptospores)in swcs
1
2
Sinaw-1:
Late Caradoc/earliest Ashgillchitinozoa reportedin cuttings samplesto c. 3540 m
No palynologicalevidence forMFI O30(Saih Nihayda Fm)
Top MFI O20
Samples barrenor yield raresphaeromorphacritarchs only
sidewall core samples
cuttings samples
core samples
3500m
4000m
5000m
2800m
3500m
4000m
4500m
Marine Saih NihaydaFormation in SN-24,SNN-1. Lower diversitythan BRNW-1, KAU-1
Most south-westerlyknown record of Mabroukacritarch assemblage,from SN-24,3976-3980 m
Barrensample
Saih NihaydaFormation inmarginal marineto non-marine(?)setting. Samefacies probablypresent in MBR-4,but not sampledin situ
Amin Fm.
Top MFI O40
Al BashairMember
BarikSandstone
Member
MabroukMember
Caved Saih Nihaydaand Silurian species.No evidence forMabrouk acritarchassemblage
Low diversityU. Cambrian marineassemblage at4970 m (MBR-4)indicatesMFI Cm30 inmarginalmarine setting
MBR-4
BRNW-1
KAU-1
SW limit ofgraptolite fragments
SW limit ofDesmochitina
SW limit of diverseacritarch assemblages(tentative on Mabrouk-Makarem High and inFahud Salt Basin)
FahudSalt Basin
GhabaSalt Basin
Mabrouk-Makarem
High
SI-1
SW limit of diverseacritarch assemblages
Saih Nihayda Fm (MFI O30)
Mabrouk Mbr (MFI O10)SR-29
SN-24
SNN-1

Molyneux et al., Figure 9
cry
pto
sp
ore
sP
se
ud
od
ya
do
sp
ora
lae
vig
ata
Te
tra
he
dra
lete
sm
ed
ine
nsis
sl..
An
cyro
ch
itin
asp
p.
An
go
ch
itin
asp
p.
ch
itin
ozo
a?
sp
p.
Sp
ha
ero
ch
itin
asp
p.
CS Acritarchs CT
sp
ha
ero
mo
rph
acri
tarc
hs
Syn
sp
ha
eri
diu
ma
ca
nth
om
orp
ha
cri
tarc
hs
Am
mo
nid
ium
?sp
.D
iexa
llop
ha
sis
de
nticu
lata
Die
xa
llop
ha
sis
gra
nu
losa
Eu
po
ikilo
fusa
roch
este
ren
sis
Eu
po
ikilo
fusa
sp
p.
Eu
po
ikilo
fusa
str
iatife
raF
ilisp
ha
eri
diu
m?
sp
p.
Mic
rhystr
idiu
msp
p.
Mo
ye
ria
ca
bo
ttii
Mu
ltip
licis
ph
ae
rid
ium
sp
p.
Tu
nis
ph
ae
rid
ium
ca
ud
atu
mTylo
top
alla
an
iae?
Ve
ryh
ach
ium
sp
p.
Ve
ryh
ach
ium
va
lien
teV
ery
ha
ch
ium
we
nlo
ckiu
m
?sp
p.
Genetic S
equence S
tratigra
phy
(Sharland e
t al. 2
001)
basal Silurianmarinetransgression(pre-MFI S10)
GS
S S
10
54°20°
18°
56°
South OmanSalt Basin
Wadi Qitbit-1
Dep
th
3140m
3160m
3180m
3200m
3220m
3240m
3260m
3280m
Sa
hm
ah
Fo
rma
tio
n (
pa
rt)
Ha
sira
h F
orm
atio
n
GR(API)
0 250
Sam
ple
s
3140-3150
3140-3160
3160-3180
3190-3200
3230
3234
3238
3262
3266
3270
3275
cuttings samples
barren samples
sphaeromorph acritarchs
non-sphaeromorph acritarchs
chitinozoa (CT)
cryptospores (CS)
‘Shale
Mem
ber’
‘Sandy M
em
ber’
(part
)
Euconochitin
a

Molyneux et al., Figure 10.
non-sphaeromorph acritarchs
chitinozoa
Mu
ltip
licis
ph
ae
rid
ium
cf.
M.e
op
irife
rum
Oo
idiu
m?
cla
vig
eru
mR
etisp
ha
eri
diu
md
ich
am
eru
mT
imo
fee
via
ph
osp
ho
ritica
Ve
ryh
ach
ium
du
mo
ntii
Aca
nth
od
iacr.
/Ste
llech
ina
tum
sp
p.
Aca
nth
od
iacro
diu
m?
aff.
dila
tum
Actin
oto
dis
su
sa
ch
rasii
Ath
ab
asca
ella
?sp
p.
Cym
atio
ga
lea
ve
life
raD
acty
lofu
sa
ve
life
raE
up
oik
ilofu
sa
sq
ua
ma
Fe
rro
mia
?sp
.cf.
F.p
elli
taIm
plu
vic
ulu
scf.
len
ticu
lari
s
(Pla
te 1
: 11, 14)
(Pla
te 1
: 13, 15)
(Pla
te 1
: 10)
(Pla
te 1
: 16) (P
late
1: 1)
(Pla
te 1
: 3)
(Pla
te 1
: 2)
(Pla
te 1
: 4)
? ?
Po
lyg
on
ium
gra
cile
Sa
ha
rid
iafr
ag
ilis
To
ng
zia
?sp
p.
Vill
osa
ca
psu
la?
fora
min
ife
raV
ulc
an
isp
ha
era
sp
p.
Ste
llech
ina
tum
?sp
.V
ery
ha
ch
ium
tris
pin
osu
mA
ctin
oto
dis
su
ssp
p.
Ark
on
iate
nu
ata
Ba
ltis
ph
ae
rosu
mch
risto
feri
i‘
’C
lypeolu
s?
sp
.
Go
nio
sp
ha
eri
diu
mco
nju
nctu
m/c
on
ne
ctu
mL
eio
fusa
sp
.S
telle
ch
ina
tum
aff.
ce
lestu
mS
telli
feri
diu
msp
p.
Str
iato
the
ca
sp
p.
Un
cin
isp
ha
era
?sp
.V
ery
ha
ch
ium
lair
dii-
va
lien
teg
rp.
Vo
gtla
nd
iaflo
sm
ari
sA
rem
ori
ca
niu
msq
ua
rro
su
mB
altis
ph
ae
rid
ium
filo
su
m-f
lag
elli
cu
mg
rp.
Ba
rake
lla?
aff.
fort
un
ata
Fra
cto
rico
ron
ula
trir
he
tica
Mo
ye
ria
ca
bo
ttii
Mu
ltip
licis
ph
ae
rid
ium
irre
gu
lare
?O
rdo
vic
idiu
msp
p.
Ort
ho
sp
ha
eri
diu
msp
p.
Ste
llech
ina
tum
he
losu
mV
illo
sa
ca
psu
lase
tosa
pe
llicu
laD
iexa
llop
ha
sis
de
nticu
lata
Die
xa
llop
ha
sis
gra
nu
losa
Eu
po
ikilo
fusa
roch
este
ren
sis
Eu
po
ikilo
fusa
str
iatife
raTu
nis
ph
ae
rid
ium
ca
ud
atu
mTu
nis
ph
ae
rid
ium
pa
rvu
my
Ve
rh
ach
ium
we
nlo
ckiu
mE
up
oik
ilofu
sa
sp
p.
Tu
nis
ph
ae
rid
ium
sp
p.
Be
lon
ech
itin
asp
p.
Co
no
ch
itin
asp
p.
Cya
tho
ch
itin
aca
lix?
Cya
tho
ch
itin
asp
p.
De
sm
och
itin
am
ino
rD
esm
och
itin
asp
p.
La
ge
no
ch
itin
asp
p.
Rh
ab
do
ch
itin
a?
sp
p.
Be
lon
ech
itin
aro
bu
sta
Cya
tho
ch
itin
aca
mp
an
ula
efo
rmis
Eu
co
no
ch
itin
asp
p.
Eu
co
no
ch
itin
ata
nvill
en
sis
An
cyro
ch
itin
asp
p.
An
go
ch
itin
asp
p.
Ple
cto
ch
itin
a/A
ncyro
ch
itin
a?
(Pla
te 1
: 12) (P
late
1: 6-8
)(P
late
1: 9)
(Pla
te 2
: 4)
(Pla
te 2
: 3)
PD
O Incert
ae
sedis
No. 20 (
Pla
te 2
: 5, 6)
(Pla
te 2
: 1)
(Pla
te 2
: 2)
(Pla
te 3
: 6)
(Pla
te 3
: 4)
(Pla
te 3
: 1)
(Pla
te 3
: 3)
(Pla
te 3
: 2)
(Pla
te 2
: 7)
? ? ?
PD
O Incert
ae
sedis
No. 10
Belo
nechitin
aB
. ara
bie
nsis
sp.cf.
(Pla
te 3
: 7)
?
?
MFI(Sharland
et al., 2001)
Nimr Group Huqf SupergroupAngudan Unconformity
S10?
O30
O40
O10
O20
Cm30
Lithostratigraphy(Droste, 1997)
Safiq G
roup
Mahatta H
um
aid
Gro
up
Haim
a S
uperg
roup
Saih NihaydaFm.
Sahmah Fm.
Hasirah Fm.
Al BashairMbr
Ghudun Fm.
Mabrouk Mbr
Barik Sst Mbr
Miqrat Fm.
(Mahwis Fm.)
Amin Fm.
Barakat Mbr
Andam
Fm
.
BritishOrdovician
Series
Arenig
Trem-adoc
Llanvirn
Caradoc
Ashgill
430
440
450
460
470
480
490
500
510
Lla
ndovery
Upper
Mid
dle
Low
er
Upper
Mid
dle
Hirnantian
Stage 6
Stage 5
Darriwilian
Stage 3
Stage 2
Tremad-ocian
Silu
rian
Ord
ovic
ian
Cam
brian
Lower(part)
Intervalbiozones(Droste,1997)
1003
1098
1108
1012
1005
Ma Series/Stages
GTS2004
(latestOrdovician-basal Siluriantransgression)
Rhudd-anian
Aeronian
Telychian

Molyneux et al., Figure 11.
Ka
uth
er-
1H
1 (
KA
U-1
)
Ha
diy
ah
-1 (
HD
Y-1
)
Ab
uT
ha
yla
h-2
(A
BT
-2)
Bu
rha
an
-5H
3
Bu
rha
an
We
st-
1 (
BR
NW
-1)
Bo
ut-
1H
2 (
BT
-1)
Sa
ih N
iha
yd
a N
ort
h-1
H1
(S
NN
-1)
Sa
ih N
iha
yd
a-2
4 (
SN
-24
)
Sa
ih N
iha
yd
a-3
6H
1 (
SN
-36
)
Sa
ih R
aw
l-2
9 (
SR
-29
)
Sa
ih R
aw
l-3
1 (
SR
-31
)
Ba
rik N
ort
h-1
H1
(B
KN
-1)
Ba
rik-7
(B
K-7
)
?
?
graptolite fragments
Desmochitina
Pirea/Dasydorus
Poikilofusa spp.
Peteinospheridium
Actinotodissus spp.
Stellechinatum celestum/uncinatum
Striatotheca quieta
Goniosphaeridium conjunctum/connectum
Micrhystridium aremoricanum?
Micrhystridium sp. A (long wiry processes)
Veryhachium longispinosum?
Vogtlandia flosmaris
Arkonia tenuata
Baltisphaerosum christoferii
‘ ’? sp.Clypeolus
Leiofusa spp.
Polygonium spp.
Stelliferidium spp.
Striatotheca principalis/frequens
Veryhachium lairdii
Uncinisphaera? sp.
Veryhachium trispinosum
PDO incertae sedis 20
sphaeromorph acritarchs
Zooclasts:
Chitinozoa:
Acritarchs:
AH-46
JL-1
MKM-1
MKM-3
MBR-4
BK-7
BKN-1
SR-31
BRNW-1
HDY-1
KAU-1
SNN-1
BT-1
SN-24
SN-36SR-29
MLMD-1
SW limit ofgraptolite fragments
SW limit ofDesmochitina
Wells included in analysisbelow
Other wells discussed in text
SW limit of diverseacritarch assemblages(tentative on Mabrouk-Makarem High and inFahud Salt Basin)
FahudSalt Basin
GhabaSalt Basin
Mabrouk-Makarem
High
MaradiFault Zone
ABT-2

Molyneux et al., Figure 12.
MKM-1
MKM-3
MLMD-1
KZN-1
MBR-4
SN-24
BRNW-1
KAU-1
SI-1
BT-1
Wells included in analysisbelow
Other wells known to containthe Mabrouk assemblage
No record of Mabroukassemblage
SW limit of diverseacritarch assemblages Fahud
Salt Basin
GhabaSalt Basin
MaradiFault Zone
Mabrouk-Makarem
High
SR-29
Sin
aw
-1 (
SI-
1)
Kauth
er-
1H
1(K
AU
-1)
Burh
aan W
est-
1(B
RN
W-1
)
Bout-
1H
2 (
BT
-1)
Khazzan-1
H4/H
5(K
ZN
-1)
cf.
?
Acanthodiacrodium rotundatumcf.
Acanthodiacrodium ubuiaff.
Cristallinium cambriensecf.
Stellechinatum sicaforme contextum
Stellechinatum sicaforme sicaforme
Stelliferidium simplex?
Vulcanisphaera turbataaff.
Caldariola? spp.
Saharidia fragilis
Tectitheca? sp.
Vavrdovella? spp.
Vulcanisphaera cirrita
Cymatiogalea cristata
Dactylofusa velifera
Ferromia F. pellita? sp. cf.
Impluviculus lenticulariscf.
PDO incertae sedis 10
Polygonium? sp. (granulate)
Actinotodissus achrasii
Acanthodiacrodium/Polygonium spp.
Acanthodiacrodium dilatum? aff.
Athabascaella? spp.
Cymatiogalea veliferaaff.
Eupoikilofusa squama
Polygonium gracile
sphaeromorph acritarchs
Vulcanisphaera nebulosa
Acanthodiacrodium Stellechinatum sicaforme contextumsp. cf.
Vulcanisphaera britannica?
Tongzia? spp.
Vulcanisphaera africana
Villosacapsula foraminifera?
Acritarchs:

Molyneux et al., Figure 13.
ArabianSea
HuqfH
igh
N
100 km(approximate)
Fahud
Salt Basin
Ghaba
Salt Basin
Central Oman High
Mabrouk-Makarem High
South Oman
Salt Basin
54°
22°
20°
18°
56° 58°
MaradiFault Zone
Sahmah Formation(basal marine transgression)
O40, Hasirah Formation
O30, Saih Nihayda Formation
O20, Barakat Member (Andam Fm.)
O10, Mabrouk Member (Andam Fm.)
Barik Sandstone Member (Andam Fm.)
Cm30, Al Bashair Member (Andam Fm.)
Wells
QMH
?
?
QMH: Qarn Muhatta Humaid, shallowmarine Upper Cambrian shelly fauna,with trilobites (Fortey, 1994).

Molyneux et al., Figure 14.
Mabrouk Mbr
Al Bashair Mbr
Miqrat Fm.
Amin Fm.
Kauther-1H1
Burhaan West-1
Ghudun Fm.
(1108Biozone)
Top MFI O10
Top MFI Cm30
BarikSst Mbr
3800m
4000m
4200m
4600m
4800m
5000m
GR(API)
0 200
4400m
3400m
3600m
3800m
4000m
4200m
GR(API)
0 200


1
4
2
5
7
3
6
8
Molyneux et al. Plate 2.

1
4
2
5
7
3
6
Molyneux et al. Plate 3.