biotechnology horiba medical, france optimizing … · advanced hematology analyzers. the...
TRANSCRIPT
24 | COMSOL NEWS | 2014
CYTOMETRY | BIOTECHNOLOGY HORIBA Medical, France
Laboratory tests, such as hematology analysis, influence up to 70 percent of critical decisions including hospital admittance, discharge, and treatment. The accuracy of these
tests, therefore, is of the utmost importance to the bottom line — curing a patient’s ailment or saving a life. At HORIBA Medical, a worldwide supplier of medical diagnostic
equipment, simulation software plays an important role in the research and development process, helping to ensure that these tests are as accurate and encompassing as possible.
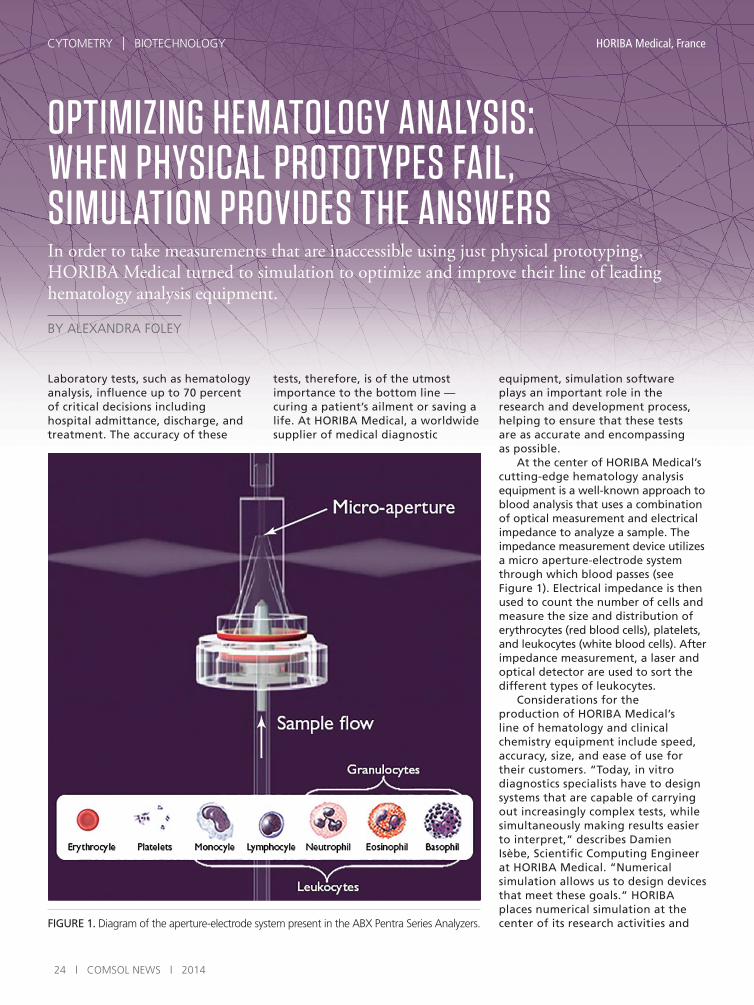
At the center of HORIBA Medical’s cutting-edge hematology analysis equipment is a well-known approach to blood analysis that uses a combination of optical measurement and electrical impedance to analyze a sample. The impedance measurement device utilizes a micro aperture-electrode system through which blood passes (see Figure 1). Electrical impedance is then used to count the number of cells and measure the size and distribution of erythrocytes (red blood cells), platelets, and leukocytes (white blood cells). After impedance measurement, a laser and optical detector are used to sort the different types of leukocytes.
Considerations for the production of HORIBA Medical’s line of hematology and clinical chemistry equipment include speed, accuracy, size, and ease of use for their customers. “Today, in vitro diagnostics specialists have to design systems that are capable of carrying out increasingly complex tests, while simultaneously making results easier to interpret,” describes Damien Isèbe, Scientific Computing Engineer at HORIBA Medical. “Numerical simulation allows us to design devices that meet these goals.” HORIBA places numerical simulation at the center of its research activities and
In order to take measurements that are inaccessible using just physical prototyping, HORIBA Medical turned to simulation to optimize and improve their line of leading hematology analysis equipment.
BY ALEXANDRA FOLEY
OPTIMIZING HEMATOLOGY ANALYSIS: WHEN PHYSICAL PROTOTYPES FAIL, SIMULATION PROVIDES THE ANSWERS
FIGURE 1. Diagram of the aperture-electrode system present in the ABX Pentra Series Analyzers.

COMSOL NEWS | 2014 | 25
CYTOMETRY | BIOTECHNOLOGY
10 percent of its revenues are invested directly in research and development activities.
SIMULATION OF THE MICRO APERTURE-ELECTRODE SYSTEMIsèbe uses COMSOL Multiphysics® to improve the electrical impedance system in the Pentra Series (see Figure 2), one of HORIBA Medical’s most advanced hematology analyzers. The fully-automatic process begins with the placement of a blood sample in an analysis chamber, where it travels through a hydraulic channel and is then diluted with reagents. After dilution, the sample is sent into a counting and measurement chamber that consists of a micro-aperture flanked by a pair of electrodes (see Figure 3).
The electrodes generate a strong electric field inside the counting chamber, and as the particles within the blood sample pass through
the micro-aperture, the electrical impedance of the medium induces a change in voltage between the two electrodes. This voltage difference is then used to count the number of particles and determine the particle’s size, with a greater voltage difference
corresponding to a larger molecule (see Figure 3).
“Inside the counting chamber there are a lot of complex physical processes: high fluid velocity, pressure drop through the aperture, heat transfer, intense electric field, and also a risk of pollution due to mechanical
design issues,” describes Isèbe. “We use COMSOL to develop a better understanding of how these physics interact within the device.” One of the key advantages that Isèbe found with COMSOL Multiphysics was the ability to import CAD models directly
into the software environment. “Importing the CAD model of the measurement chamber allowed us to extract the computational domain,” he explains. “In this case, if we want to compute fluid flow in the system, the simulation software automatically creates the fluid domain directly from the CAD model.” Once the aperture-electrode system geometry (see Figure 4) was imported into COMSOL, analysis and optimizations could then be performed using the actual geometry of the device being manufactured.
COMPLICATIONS AFFECTING ACCURATE MEASUREMENTThe main goal of Isèbe’s work was to optimize the impedance measurement system by analyzing and controlling for factors that can negatively influence the accuracy of the device. This includes the particle trajectory through the aperture as well as its orientation, both factors that affect the measured difference in voltage.
“ Due to advancements in computational analysis and supercomputing capabilities, numerical simulation has become the third pillar of science, next to theory and experimentation.”
FIGURE 2. The ABX Pentra 60C+ (left) and Pentra 80 XLR (right), two hematology analyzers of the Pentra Series, use an aperture-electrode system for counting and sizing blood particles by impedance measurement.
FIGURE 3. Principle of impedance measurement.

26 | COMSOL NEWS | 2014
CYTOMETRY | BIOTECHNOLOGY
For example, when a particle passes close to the edges of the aperture where the electric field exhibits high gradients (see trajectory T2 in Figure 5), the particle is exposed to higher electric fields than one that passes through the center of the aperture (see trajectory T1 in Figure 5). Such a phenomenon is known as edge effect. Due to this effect, the resulting electrical pulse is distorted and computation of the particle’s size results in overestimation.
This is further complicated by the particle’s orientation through the aperture. The electric field distribution changes depending on a particle that passes horizontally or vertically through the aperture, again
resulting in an overestimation of the particle’s size (see Figure 6).
A REAL IMPROVEMENT FOR DIAGNOSTIC EFFICIENCYIsèbe used simulation techniques to develop a way to account for varying particle trajectories and
orientations. “Since this is a very small system, it’s very difficult to take any measurements experimentally,” describes Isèbe. “Simulation allows us to improve processes that are inaccessible with just physical prototypes.”
Historically, counting and sizing of biological particles in an aperture-electrode system have been completed with the assumption that a sample is evenly distributed within the micro-aperture. The mean particle size was then determined statistically to compensate for errors due to particle trajectory and orientation. This compensation ignores the electrical pulses generated by the particles that pass close to the edge, but in practice it is difficult to differentiate the altered pulses from the normal ones due to the high speed of counting.
In order to improve the accuracy of the device, Isèbe developed numerical models to prove that hydrodynamic focusing could be used to reduce analysis error (see Figures 7 and 8). “Hydrodynamic focusing uses sheath flow to control the sample rate inside the aperture and to direct
the sample flow along the central axis of the aperture,” says Isèbe. “The simulations of this system use a multiphysics approach that models the electrical pulses resulting from the impedance variation combined with particle fluid flow analysis.”
FIGURE 5. Electric field contour plot inside the electrode-aperture. Two possible particle trajectories, T1 and T2, are shown.
FIGURE 6. Effect of particle orientation on the electric field distribution within the electrode-aperture system and the resulting difference in voltage.
FIGURE 4. CAD model of the micro aperture-electrode system, which was imported into COMSOL Multiphysics using the CAD Import Module.
“ Simulation allows us to improve processes that are inaccessible with just physical prototypes.”

COMSOL NEWS | 2014 | 27
CYTOMETRY | BIOTECHNOLOGY
Isèbe ran simulations to analyze how hydrodynamic focusing improves impedance measurement, and to determine the optimal configuration of the device. “Using these models, we can precisely compute the velocity field within the device and analyze the acceleration phase at the entrance of the micro-aperture. We can then use this information to determine which designs produce the most accurate results.” The simulation results demonstrated that hydrodynamic focusing greatly improves the accuracy of particle measurement (see Figure 8, top).
Next, these analyses were compared to the experimental results. “When we compared the simulation and experimental results for the two cases, we estimated that the hydrofocused device is about twice as accurate as the non-hydrofocused one,” explains Isèbe referring to Figure 8, bottom.
SIMULATION JUSTIFIES TECHNOLOGICAL INNOVATIONThe design and optimization of this system of electrical impedance measurement for hematology analysis was truly a multiphysics application, involving the coupling of mechanical, fluid, chemical, and electrical analyses. The resulting devices, the ABX Pentra Series, are among the most accurate
fully-automatic analyzers on the market today. “Using simulation, I was able to justify the implementation of this technique for hematology analysis into the diagnostic equipment at HORIBA,” says Isèbe. Currently, Isèbe is working on improvements to the particle fluid flow analysis, and plans for future research include 3D processing and the deformability of particles under hydrodynamic
stresses. “Due to advancements in computational analysis and supercomputing capabilities, numerical simulation has become the third pillar of science, next to theory and experimentation,” says Isèbe. “Simulation is now a critical tool for research and development at HORIBA Medical, and it’s a key resource used for decision-making in technological innovation.” n
FIGURE 7. Hydrodynamic focusing simulation, showing how sheath flow is used to direct the sample along the central axis of the electrode aperture (sample flow in red and sheath flow in blue).
FIGURE 8. Top: Simulation results of the static particle size distribution without hydrofocusing (left) and with hydrofocusing (right). Bottom: Experimental validation without hydrofocusing (left) and with hydrofocusing (right).