bison management report of survey-inventory activities, 1
TRANSCRIPT
Bison Management Report
of survey-inventory activities 1 July 2003–30 June 2005
Patricia Harper, Editor
Alaska Department of Fish and Game Division of Wildlife Conservation
Photo by Stephen DuBois, ADF&G
Funded through Federal Aid in Wildlife Restoration
Grants W-33-2 and W-33-3, Project 9.0 December 2006

STATE OF ALASKA
Sarah Palin, Governor
DEPARTMENT OF FISH AND GAME Denby Lloyd, Commissioner
DIVISION OF WILDLIFE CONSERVATION
Matthew H. Robus, Director
For a hard copy of this report please direct requests to our publications specialist:
Publications Specialist ADF&G, Wildlife Conservation
P.O. Box 25526 Juneau, AK 99802-5526
(907) 465-4176
Please note that population and harvest data in this report are estimates and may be refined at a later date.
The Alaska Department of Fish and Game (ADF&G) administers all programs and activities free from discrimination based on race, color, national origin, age, sex, religion, marital status, pregnancy, parenthood, or disability. The department administers all programs and activities in compliance with Title VI of the Civil Rights Act of 1964, Section 504 of the Rehabilitation Act of 1973, Title II of the Americans with Disabilities Act of 1990, the Age Discrimination Act of 1975, and Title IX of the Education Amendments of 1972. If you believe you have been discriminated against in any program, activity, or facility please write:
♦ ADF&G ADA Coordinator, PO Box 115526, Juneau, AK 99811-5526. The department’s ADA Coordinator can be reached via phone at the following numbers: (VOICE) 907-465-6077, (Statewide Telecommunication Device for the Deaf) 1-800-478-3648, (Juneau TDD) 907-465-3646, or (FAX) 907-465-6078.
♦ US Fish and Wildlife Service, 4040 N Fairfax Drive, Suite 300 Webb, Arlington, VA 22203, or; ♦ Office of Equal Opportunity, US Department of the Interior, Washington DC 20240
For information on alternative formats and questions on this publication, please contact the following: ♦ Publications Specialist, ADF&G/Division of Wildlife Conservation, PO Box 115526, Juneau, AK
99811-5526, or call 907-465-4176.
Cover Photo: A bison from the Delta herd. Photo by Stephen DuBois, ADF&G

Bison Management Report
of survey-inventory activities 1 July 2003–30 June 2005
Patricia Harper, Editor
Alaska Department of Fish and Game Division of Wildlife Conservation
Funded through Federal Aid in Wildlife Restoration
Grants W-33-2 and W-33-3, Project 9.0 December 2006
Any information taken from this report should be cited with credit given to authors and the Alaska Department of Fish and Game. Authors are identified at the end of each unit section.
If this report is used in its entirety, please reference as: Alaska Department of Fish and Game. 2006. Bison management report of survey-inventory activities 1 July 2003–30 June 2005. P Harper, editor. Juneau, Alaska.

BISON MANAGEMENT REPORT
From: 1 July 2003 To: 30 June 2005
TABLE OF CONTENTS
Unit Page Game Management Units Map ........................................................................................... i
Unit 11 Copper River herd ............................................................................................... 1
Unit 11 Chitina River herd ............................................................................................... 9
Unit 19 Farewell herd .....................................................................................................17
Unit 20D Delta herd........................................................................................................ 30

$Z
#S
#S#S
#S
#S
$Z
$Z
#S
#S
#S
#S
#S
#S
#S
#S
#S
$Z
#S
#S#S
#S
#S
26
25
24
23
22
18
2120
19
17
13 12
1116 14
15 9
6 5 1
4
2
3
8
10
10
22
18
Nome
Juneau/Douglas 7Anchorage
A r c t i c O c e a n
Gulf of Alaska
U.S
. - CA
NA
DA
BO
UN
DA
RY
B r i s t o l B a y
N o r t o nS o u n d
K o t z e b u eS o u n d
Fairbanks
Kodiak
Cordova
Sitka
Petersburg
Ketchikan
FortYukon
Galena
McGrath
Bethel
Kotzebue
KingSalmon
Glennallen
Homer
Palmer
Soldotna
Dillingham
Barrow
DeltaJunction
Tok
100 0 100 200 300 Miles
Regions:I - SoutheastII - SouthcentralIII - InteriorV - Northwest
Game Management Unit Boundaries
Office Locations:Area Office#S
Regional Office$Z
Game Management Units
Alaska Department of Fish and GameDivision of Wildlife Conservation (September 2002)
i


WILDLIFE Alaska Department of Fish and GameDivision of Wildlife Conservation
MANAGEMENT REPORT 907-465-4190 PO BOX 115526 JUNEAU, AK 99811-5526
1
BISON MANAGEMENT REPORT
From: 1 July 2003 To: 30 June 2005
LOCATION
GAME MANAGEMENT UNIT: 11 (12,784 mi2)
HERD: Copper River herd
GEOGRAPHIC DESCRIPTION: Dadina River to the Kotsina River
BACKGROUND
The Copper River bison herd originated from animals relocated to Delta Junction, Alaska, from the National Bison Range in Moise, Montana, in 1928. In 1950, 5 bulls and 12 cows were moved from the Delta herd to the Nabesna Road in northern Game Management Unit (GMU) 11. These bison moved away from the release site, and by 1961 they had moved into the Dadina and Chetaslina Rivers, where they remained. Throughout the years, herd estimates have varied between a low of 51 bison in 1967 and the current high of 125. The most important factors controlling herd size are snow depth and hunter harvest.
The department held the first hunt, by registration permit, for Copper River bison in 1964. Between 1964 and 1988, hunters harvested 217 bison from this herd. The hunt was closed in 1989 by emergency order because of a decline in herd size due to extremely deep snowpack. Hunting remained closed until 1999, when herd size and productivity increased enough to resume annual harvests. Harvests since 1999 have been under a drawing permit hunt.
MANAGEMENT DIRECTION
MANAGEMENT OBJECTIVES
Maintain the herd at a minimum of 60 overwintering adults by controlling the number of bison taken by hunters.
METHODS
Aerial surveys were conducted to determine composition of the herd following the spring calving period. Between 1984 and 1992, radio collars were used to help locate the herd during spring surveys. Currently, there are no radio collars in this herd. Surveys are conducted in early June, when bison are most aggregated in open areas along the Copper or Dadina Rivers.

2
RESULTS AND DISCUSSION
POPULATION STATUS AND TREND
Population Size Following a period of growth in the 1950s, the Copper River bison herd was relatively stable during the late 1960s and 1970s. Numbers declined appreciably in the late 1980s and remained low until the mid 1990s. The herd started increasing after dropping to an estimated 64 animals in 1995. The 2004 and 2005 counts of 125 total bison are the highest in 30 years.
Population Composition Aerial surveys showed 107 adults and 18 calves in 2005 (Table 1). Calf production and survival have been high the last 5 years, averaging 21 calves a year (range = 18–26), compared to the average of 10 calves per year from 1988 to 1992 (range = 3–14), when the herd declined. The highest number of calves ever observed in this herd was 26 in 2004. Calf numbers declined 30% to 18 calves in 2005 (Table 1). The 2005 aerial count of 107 adult bison in this herd is the highest ever observed and has been increasing for 10 years. The number of adults in the herd reached 70 in 1997, exceeding the overwintering minimum population objective of 60 adults for the first time since 1992. Adult numbers have been well above the minimum objective every year since 1997.
Distribution and Movements The Copper River bison herd inhabits a home range bounded by the Dadina River on the north, the Copper River on the west, the Kotsina River to the south, and the Wrangell Mountains to the east. Bison or bison sign seldom are observed north of the Dadina River or south of the Kotsina River. The herd’s seasonal distribution includes intensive use of the Copper River floodplain and bluffs along the Copper River during winter and spring. During summer, the bison move to higher elevations along the Dadina and Chetaslina Rivers to feed on vegetation as it greens up later in the season. During the late 1970s and the 1980s, there were only occasional reports of bison along the western bank of the Copper River in Unit 13. We surmised that human disturbance in the Kenny Lake area and hunting pressure prevented range extension to the west. During the 1990s, however, bison were reported grazing in hay and crop fields in the Kenny Lake area. Bison in the Kenny Lake area have been almost entirely harvested under recent hunts. If a large number of bison were to cross the Copper River and feed extensively on the Kenny Lake farms, a serious conflict with farmers would arise. Given the increasing herd population, it may be necessary to extend the hunt boundary south of the Edgerton Highway should bison start using this area more regularly.
MORTALITY
Harvest Season and Bag Limit. The season for residents and nonresidents in Units 11 and 13D is 1 September–31 March. The hunt area includes that portion of GMU 11 east of the Copper River, south of the Nadina River and Sanford Glacier, west of a line from Mount Sanford to Mount Wrangell to Long Glacier, and west of the Kotsina River and that portion of GMU 13D north of the Edgerton Highway. The bag limit is 1 bison every 5 regulatory years.

3
Board of Game Actions and Emergency Orders. During its spring 1999 meeting, the Board of Game opened the Copper River bison hunt for the first time in 10 years. The hunt was changed from a registration to a drawing permit hunt, and the hunt area was enlarged to include a portion of GMU 13D.
Hunter Harvest. Hunters took 7 bison (4 bulls, 3 cows) during the 2003 season and 8 bison (6 bulls, 2 cows) during the 2004 season (Table 2).
Permit Hunts. The Copper River bison hunt is administered through drawing permits (DI 454). Between 1999 and 2001, 12 permits were issued annually. The number of permits issued annually increased to 20 in 2002, then to 24 in 2004. The interest in this hunt has increased steadily over time; 1283 people applied for the 24 permits issued in 2004. Permittees were required to indicate prior to 1 September if they would hunt. If not, an alternate was chosen. Permittees reported to the Glennallen office to pick up their permits and received detailed maps of the hunt area, including land ownership patterns. This gave us the opportunity to identify private property and emphasize the need to respect private property rights. Successful hunters reported to the Glennallen office within one day of leaving the field.
Hunter Residency and Success. One local resident reported taking a bison in 2000 and 2001, and one nonresident was successful in 2002. All successful hunters during this 2-year report period were nonlocal Alaska residents (Table 3). Historically, the hunt was popular with local residents, and during the 1988 registration hunt, 40% of the hunters were local residents. Changing from a registration to a drawing hunt reduced the level of local resident and nonresident participation.
Harvest Chronology. During 2004, hunters took 4 bison in September, 2 in October, 1 in February and 1 in March (Table 4). During the last 6 seasons, September has been the most important harvest period, accounting for 19 (45%) of reported kills, with March accounting for the second most with 10 kills (24%). The season provided approximately 210 days of hunting opportunity.
Transport Methods. Historically, riverboats have been the most popular method of transportation. This changed in 1999, when highway vehicles were more important (Table 5). In recent years boats and snowmachines have alternated as the most important method of transportation for successful hunters, followed by aircraft (Table 5). Most recently, hunters have used jet boats, air boats, and rafts in this hunt.
Other Mortality. We monitored winter severity and the potential for winter starvation by recording snow depths at the Dadina Lake snow station. This station is near the bluffs along the Copper River where the herd winters. The last winter classified as severe was recorded in 1994, the year before the population bottomed out. Snowfall in 1996 was deep enough for the winter to be classified as moderate, but every winter since has been mild. Snow depth appears to be a critical factor in overwinter bison survival. In years with deep snow, bison mortality increases and calf production and survival declines. Mild winters undoubtedly have been a factor in the herd increase observed during the last few years.
Field observations of the Copper River herd suggest accidental death may be an important source of natural mortality to bison. Sources of accidental mortality include falling off steep bluffs that

4
border the Copper River and drowning in the river. During winter, bison use the bluffs extensively for feeding. These slopes have predominantly clay soils, which hold moisture and freeze. The frozen clay creates a steep slide with little, if any, secure footing for the bison. Drowning mortality is difficult to document because dead bison are swept downriver.
Wolves, black bears, and brown bears are relatively abundant on the Copper River bison range. These predators are certainly capable of killing bison, but we have not researched predation rates on Copper River bison.
HABITAT
Assessment Habitat conditions have not been studied on the Copper River bison range. Most of the range is black spruce forest. Bison frequent swamps, sedge openings, grassy bluffs, and river bars of the Copper, Dadina, and Chetaslina Rivers. Field observations of these preferred feeding locations, such as the Copper River bluffs, show evidence of heavy use and reduced forage production.
CONCLUSIONS AND RECOMMENDATIONS
The Copper River bison herd started increasing in 1996, reached a 30-year high in 2004, and topped that high in 2005. Calf production and survival the last 5 years has been high, with 18 or more calves observed each year. The number of adult bison has exceeded the minimum management objective of 60 overwintering bison for the last 9 years.
The Copper River bison hunt was opened in 1999 after being closed for 10 years, and was changed from registration to a drawing permit hunt. When the hunt was administered by registration permit, hunt conditions were poor due to a very small accessible hunt area and overcrowding during the short season. With heavy hunting pressure, the harvest quota was often reached in 1–3 days, and the possibility was great that the harvest quota would be exceeded before the season could be closed by emergency order. The Board of Game addressed overcrowding and overharvesting by changing the hunt to a drawing hunt when the season was opened in 1999. As a result, hunters receiving a permit were assured a long season.
Access to the Copper River herd is limited to public lands along the Copper River and private farms along the Edgerton Highway. A large portion of the herd’s range includes private property not open to bison hunters. As a result, hunters with the best chances of success watch bison movements, then hunt when bison are on open land. Farmers in the Kenny Lake area have responded favorably to this hunt, because it reduces crop loss from bison.
Limiting factors on the size of the herd include snow depth, hunter harvests, habitat, accidental deaths, and possibly predation. In years with good calf production and survival, hunter harvests have been sustainable and were used to control the herd growth when necessary. In years with deep snow, survival and production declined and hunter harvests were stopped. Accidental deaths from falls and drowning while crossing thin ice have been observed frequently enough to be considered an important cause of mortality. Wolves and bears are relatively abundant on the home range of the Copper River herd, but their impacts have not been researched.

5
I recommend holding a bison hunt as long as calf production and survival is high enough to maintain 60 overwintering bison. Current harvests are well below the level needed to control herd size during periods with mild winters and high production and survival. The number of permits issued could be further increased; however, overcrowding is a concern, given the limited amount of land open to hunting. Permit numbers have been kept low to avoid trespass problems on private lands closed to bison hunting. Because harvests have been limited well below the level needed to limit herd growth, the herd has expanded, and the potential for a large die-off exists. Though habitat does not seem to be limiting at this time, given good recent calf numbers, it is highly likely that during the next winter with prolonged deep snow conditions a die-off will occur. No changes in season length or bag limit are recommended at this time, and unless private land closures are lifted, the number of permits issued next year should be kept at 24.
PREPARED BY: SUBMITTED BY:
Robert W. Tobey Gino Del Frate Wildlife Biologist Management Coordinator
Please cite any information taken from this section, and reference as:
Tobey, R.W. 2006. Unit 11 Copper River herd bison management report. Pages 1–8 in P. Harper, editor. Bison management report of survey and inventory activities 1 July 2003–30 June 2005. Alaska Department of Fish and Game. Project 9.0. Juneau, Alaska.

6
Table 1 Copper River bison spring aerial composition counts and estimated population size, 1999–2005 Estimated Regulatory Bison Population Year Adultsa Calves (%) Observed Sizeb 1999–2000 68 19 (22) 87 87 2000–2001 73 14 (16) 87 87 2001–2002 89 19 (18) 108 108 2002–2003 86 22 (20) 108 108 2003–2004 88 22 (20) 110 110 2004–2005 99 26 (21) 125 125 2005–2006 107 18 (14) 125 125 a Fixed-wing aircraft survey – no composition other than adults and calves. b Estimate reflects aerial count data.
Table 2 Copper River bison harvest data by permit hunt (DI454), 1999–2005 Percent Percent Percent Regulatory Permits Did not Unsuccessful Successful Total Year Issued Applications Hunt Hunters Hunters Bulls (%) Cows (%) Unknown Harvest 1999–2000 12 678 17 30 70 6 (86) 1 (14) 0 7 2000–2001 12 617 25 45 55 5 (100) 0 (0) 0 5 2001–2002 12 680 33 50 50 4 (100) 0 (0) 0 4 2002–2003 20 778 15 35 65 8 (73) 3 (27) 0 11 2003–2004 20 1073 30 50 50 4 (57) 3 (43) 0 7 2004–2005 24 1283 25 47 53 6 (75) 2 (25) 0 8

7
Table 3 Copper River bison hunter residency and success, 1999–2005 Successful Unsuccessful Regulatory Locala Nonlocal Total Year Resident Resident Nonresident Total (%) Resident Nonresident Total (%) hunters 1999–2000 0 7 0 7 (70) 3 0 3 (30) 10 2000–2001 1 4 0 5 (55) 4 0 4 (45) 9 2001–2002 1 3 0 4 (50) 4 0 4 (50) 8 2002–2003 0 10 1 11 (65) 6 0 6 (35) 17 2003–2004 0 7 0 7 (50) 7 0 7 (50) 14 2004–2005 0 8 0 8 (53) 7 0 7 (47) 15 aLocal means resident of Unit 11 or 13.
Table 4 Copper River bison harvest chronology, 1999–2005 Regulatory Harvest Period Year Sept Oct Nov Dec Jan Feb Mar n 1999–2000 2 3 0 0 0 0 2 7 2000–2001 2 2 0 0 0 1 0 5 2001–2002 2 0 0 0 0 0 2 4 2002–2003 6 1 0 0 1 0 3 11 2003–2004 3 1 0 0 0 1 2 7 2004–2005 4 2 0 0 0 1 1 8
8
Table 5 Copper River bison harvest percent by transport method, 1999–2005a Percent of harvest Regulatory 3- or Snow- Highway year Airplane Horse Boat 4-wheeler machine ORV Vehicle Unknown n 1999–2000 14% 0 14% 14% 14% 0 43% 0 7 2000–2001 0 0 40% 20% 20% 0 20% 0 5 2001–2002 25% 0 25% 0 50% 0 0 0 4 2002–2003 9% 0 55% 0 27% 0 9% 0 11 2003–2004 0 0 14% 14% 57% 0 14% 0 7 2004–2005 14% 0 43% 0 43% 0 0 0 8 a Due to rounding, total percentages may not equal 100%

WILDLIFE Alaska Department of Fish and GameDivision of Wildlife Conservation
MANAGEMENT REPORT 907-465-4190 PO BOX 115526 JUNEAU, AK 99811-5526
9
BISON MANAGEMENT REPORT From: 1 July 2003 To: 30 June 2005
LOCATION
GAME MANAGEMENT UNIT: 11 (12,784 mi2) HERD: Chitina River herd
GEOGRAPHIC DESCRIPTION: The Chitina River from the confluence of the Tana River and Chitina Glacier
BACKGROUND The Chitina bison herd originated from animals relocated to Delta Junction, Alaska, from the National Bison Range in Moise, Montana, in 1928. In 1962, 29 cows and 6 bulls were moved from Delta Junction to May Creek. The herd increased to as many as 56 bison in 1985, then declined to a low of 30 in 1994. Over the past 10 years the herd size has fluctuated, because deep snow some years increased overwinter mortality.
The first Chitina bison hunt was held by drawing permit in September of 1976. Permit hunts were held for 13 years. Hunters took 58 bison, an average yearly harvest of 4 animals. The hunt was closed in 1989 because of a decline in herd size. Hunting resumed in 1999 with drawing permits for bulls only and continued for 5 years until closed by emergency order in 2004.
MANAGEMENT DIRECTION MANAGEMENT OBJECTIVES Maintain the herd at a minimum of 50 overwintering adults by increasing or decreasing human harvests when bison numbers exceed or fail to reach the objective.
METHODS Aerial surveys to determine composition of the herd were conducted in spring after the calving period. Survey techniques included flying transects throughout all bison habitat within the Chitina Valley to obtain a direct count. Field necropsies were completed during April 2004 on 3 bison found dead.
RESULTS AND DISCUSSION POPULATION STATUS AND TREND Population Size The Chitina bison herd was relatively stable for about 12 years between 1976 and 1987; the average herd size was 48. Starting in 1988, herd estimates declined and, except for a slight increase in 1996 and 1997, averaged between 30 and 35 bison until 1999. The Chitina herd increased for the next 4 years, peaking at 50 animals in 2003. A large die-off occurred in 2004
10
due to a deep snow year. Three field necropsies in April indicated starvation as the cause of death. While only 25 bison were counted in 2004, we counted 35 in 2005 (Table 1).
Population Composition In 2005, we observed 31 adults and 4 calves during an aerial survey of the Chitina herd (Table 1). Calf production and survival declined by as much as 50% during this 2-year reporting period; 9 calves were observed in 2003. Historically, calf production and survival are low after a severe winter, as observed during 1988–89 and again in 1989–90 in both the Chitina and Copper River herds. Timing of the surveys probably was not a factor in variable calf counts, because surveys were usually conducted in June or early July every year.
Distribution and Movements The Chitina bison herd ranges throughout the riparian and upland habitat below 2000 feet elevation along a 40-mile portion of the upper Chitina Valley. Although movements vary considerably, traditionally the herd could usually be located between the Tana River and Barnard Glacier. During the 1990s, biologists observed especially heavy use of the riparian zone between Bryson Bar and Bear Island on the north side of the river. Changes in the flow of the Chitina River during the last 15 years caused considerable erosion of bars and banks on the north side of the river. During the last 3 or 4 years, bison use on the south side of the river has increased as bison seek new feeding areas to replace those lost to erosion.
MORTALITY Harvest Season and Bag Limit. When the season is open, the bison hunt for residents and nonresidents in Unit 11 is 6 September–30 November. The bag limit is 1 bull every 5 regulatory years by drawing permit. The hunt area is that portion of the Chitina River east of the Chakina River and south and east of the Nizina River in Unit 11.
Board of Game Actions and Emergency Orders. In 1999 the Board of Game opened the Chitina bison hunt after a 10-year closure. The 2004–05 and 2005–06 seasons were closed by emergency order (EO) after the severe winter of 2003–04 resulted in increased overwinter mortality and low subsequent calf production and/or survival.
Hunter Harvest. Hunters killed 2 bulls during the 2002 season and 1 bull in the 2003 season (Table 2). No bison were taken in 2004 or 2005 because of the season closure.
Permit Hunts. Chitina bison are hunted under a drawing permit hunt (DI 450); up to 2 permits are authorized annually. In 2002 and 2003, 241 and 302 hunters respectively applied for the available permits. The hunt was not open for applications in 2004 or 2005.
Hunter Residency and Success. The hunter success rate was 75% for this reporting period (Table 3). All permittees were nonlocal Alaska residents (Table 4). The number of days hunted in order to take a bison was highly variable, with successful hunts lasting between 1–6 days.
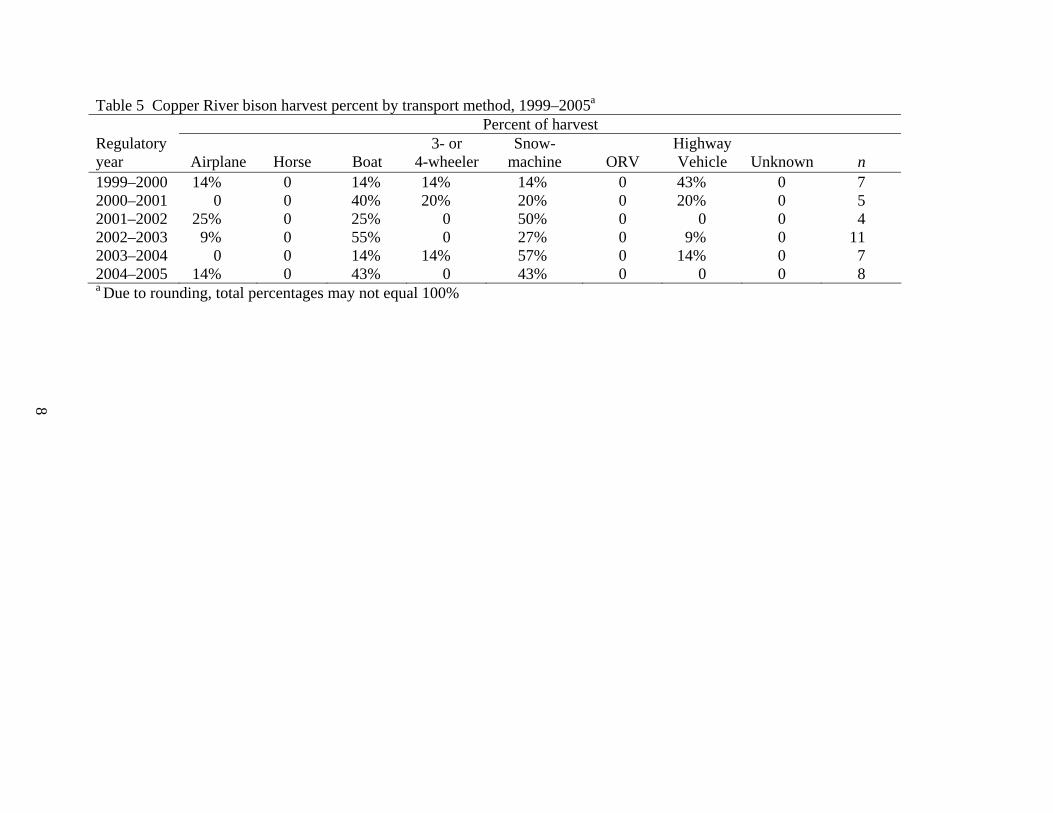
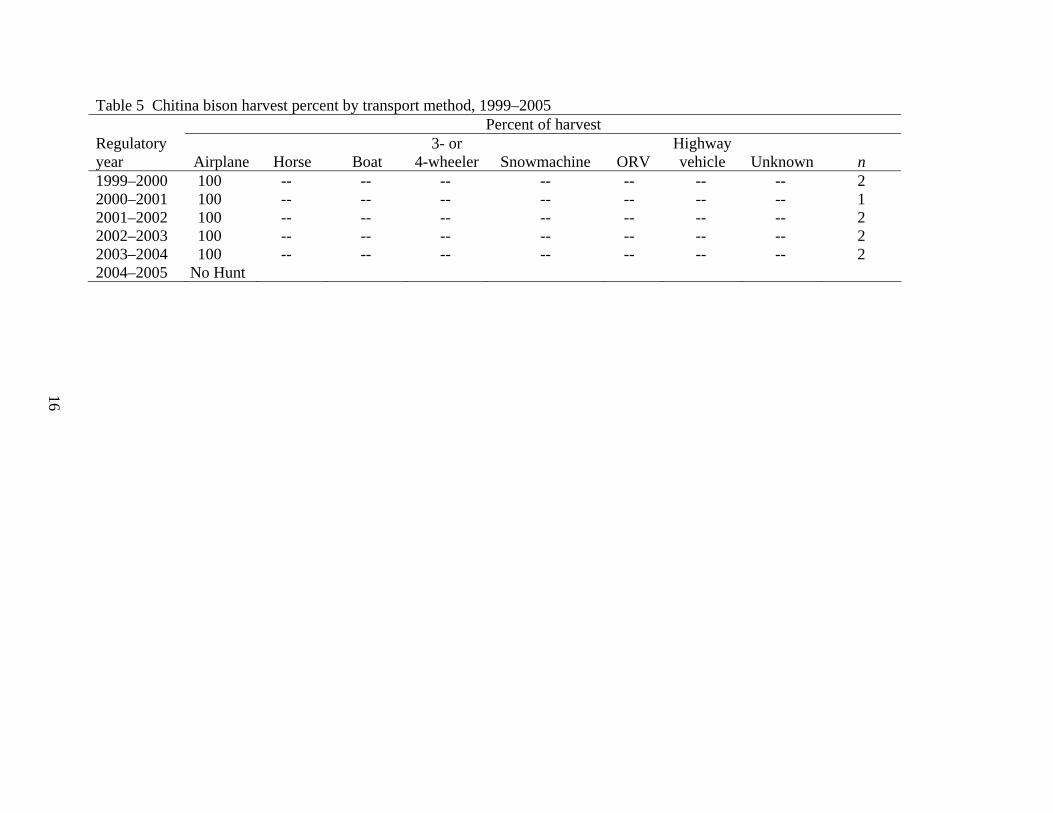
Transportation Methods. All successful hunters reported the use of aircraft (Table 5). Historically, aircraft have been the only practical means of accessing this remote hunt area.

11
Predation. Trappers and local residents have reported wolf predation on bison. Brown bears also have been observed feeding on bison carcasses, but it is not known if they killed the bison or were scavenging. Research on wolf or brown bear predation on Chitina River bison has not been conducted because of the high costs of such a study and the remote nature of this herd.
Other Mortality. Deep snow over a prolonged period during the winter is an important cause of mortality and reduced productivity in the Chitina bison herd. Deep snows were considered important factors in the herd decline in the late 1980s and poor recruitment during the 1990s. Deep snow was also recorded for the Upper Chitina Valley in 1997–98, which resulted in a similar decline in both population size and productivity. In the spring of 1998, 6 adult bison were found dead; the deaths were attributed to starvation because all the examined bison were emaciated and had low bone marrow fat, and there was no sign of predation. The Chitina bison herd was subjected to another severe winter in 2003–04, and field necropsies on 3 dead bison again resulted in a diagnosis of starvation.
Poaching was documented on the Chitina bison herd during the 1980s. Because of the remoteness of this herd, apprehending poachers is difficult. The extent or impact or poaching on this herd is unknown.
HABITAT ASSESSMENT In 1984 the National Park Service studied the range in the upper Chitina Valley (Miquele 1985). This study indicated grazing by ungulates on the Chitina bison range had not caused recent plant deterioration. The range was recovering from earlier overuse, when horses were abundant on grazing leases. Miquele (1985) also found that a bison herd of 50 animals had not damaged the habitat, and the management objective of 30 overwintering bison could be increased; however, he concluded the range could not support a very large bison herd.
Appreciable vegetation loss occurred on the Chitina bison range during the early 1990s. This is a result of rechannelization of the Chitina River toward the north bank. The first area affected was the floodplain northeast of Bear Island. This was a heavily used riparian area before 1991, when flooding first occurred and more than 50% of the vegetation washed away. Since 1991, flooding has occurred east of Bear Island, near Bryson Bar, and has extended upriver toward Hubert’s Landing. Recent bison mortality during 2 winters with deep snow suggests this loss of critical river bar habitat may have reduced the carrying capacity until vegetation can be reestablished on the newly exposed bars.
CONCLUSIONS AND RECOMMENDATIONS The Chitina bison herd increased between 1999 and 2003, peaking at 50 bison. The 2003 count of 50 animals was the highest count in 18 years, since 56 bison were seen in 1985. The winter of 2003–04 saw a prolonged and deep snowpack in the upper Chitina River valley. Observed mortality in the Chitina bison herd increased, and field necropsies determined the cause of death to be starvation. The 2005 count of 35 bison suggests the herd is starting to recover.
Population estimates in the Chitina herd are based on a single yearly survey of all known bison habitat. Because bison can be missed during a survey, some fluctuations in count data between years probably reflect survey technique rather than actual changes in bison numbers. Solitary bulls are especially difficult to find on aerial surveys.

12
Hunting was stopped in 1989, after the herd declined significantly, and was not resumed until 1999, when herd size and productivity had increased. Between 1999 and 2003, hunters took 7 bulls. This low take has had minimal impacts on population size and productivity. Hunting was again closed by EO in 2004 and 2005 after a severe winter to allow the herd to increase. Legal harvests will resume when overwinter survival and calf production increase. A low harvest of adult bulls should not keep the herd from increasing, as long as recruitment is healthy.
Severe winters with prolonged, deep snows and lack of sufficient wind to clear river bars of snow are considered the most important limiting factors on the Chitina bison herd. Flooding of critical river bars and loss of vegetation cover has reduced traditional foraging areas and forced bison onto more marginal habitats. This loss of available foraging areas exacerbates the effect of deep snow conditions on foraging behavior of the Chitina bison herd. Some of the negative effects of bank and bar erosion may be temporary, because new bars were created and plant colonization should eventually provide additional foraging areas.
Wolves and bears are abundant and could also influence herd size, but a lack of research precludes documenting predation rates.
The channel changes in the Chitina River that destroyed bison habitat on the northern bank, thus lowering the carrying capacity of the range, present a management dilemma. It may be that the Chitina herd is and will remain more range-limited than observed during the 1980s study. The management objective of 50 overwintering bison was based on a range study conducted during the mid 1980s along river banks that no longer exist.
Incidental mortality during deep snow winters presents another management problem. The effect of deep snow on survival is probably density independent, because increased mortality and a decline in productivity have been observed at various stocking levels. Examination of winter-killed bison indicates very old bison are especially susceptible. Calves of the year also probably have high mortality rates, but they are not found because they die earlier in the winter and are more easily scavenged. The magnitude of a die-off in a deep snow year will depend on the calf production and number of aged bison in the population.
Future management should focus on meeting the herd objective and reducing the effect of severe winters by lowering the number of susceptible old bison present in the herd. To accomplish this, a limited harvest of adult bulls was instituted in 1999. Management efforts will focus on harvesting a limited number of adults each year, depending on herd size, thus reducing the number of animals in the “aged” class that are susceptible to winter mortality. Because winter mortality appears to be somewhat density independent, limited bull harvests should be allowed if the herd exceeds 30 bison but is below the objective of 50 animals. Cow harvests should be instituted when the herd approaches 50 overwintering animals and when calf recruitment exceeds 8. We cannot be sure that hunters will take the oldest bison, though by providing a long season for a very limited number of hunters, we are encouraging them to take large adult bulls. While this limited harvest will not prevent winter mortality, it will provide some human use of the Chitina bison herd even when numbers fall below the 50-bison objective. To date, all harvested bison have been old, trophy bulls; thus current harvest strategies are meeting management objectives. Conducting a very small drawing permit hunt for bison is justified because of the popularity of all hunts on wild bison.
13
I recommend issuing 2 bull permits in 2006 if overwintering survival remains high in 2005–2006 and there are 6 or more calves in the spring 2006 count.
LITERATURE CITED MIQUELE, DALE. 1985. Food habits and range conditions of bison and sympatric ungulates on the
Upper Chitina River, Wrangell-St. Elias National Park and Preserve. U.S. Department of Interior. National Park Service. Alaska. Region Research/Resources Management Report AR-8. Anchorage. 112pp.
PREPARED BY: SUBMITTED BY: Robert W. Tobey Gino Del Frate Wildlife Biologist Management Coordinator
Please cite any information taken from this section, and reference as:
Tobey, R.W. 2006. Unit 11 Chitina River herd bison management report. Pages 9–16 in P. Harper, editor. Bison management report of survey and inventory activities 1 July 2003–30 June 2005. Alaska Department of Fish and Game. Project 9.0. Juneau, Alaska.

14
Table 1 Chitina bison spring aerial composition counts and estimated population size, 1999–2005 Estimated Regulatory Bison population year Adultsa Calves (%) observed Sizeb 1999–2000 27 6 (18) 33 33 2000–2001 31 6 (16) 37 37 2001–2002 32 6 (16) 38 38 2002–2003 32 7 (18) 39 39 2003–2004 41 9 (18) 50 50 2004–2005 23 2 (08) 25 25 2005–2006 31 4 (11) 35 35 a Fixed-wing aircraft survey – no composition other than adults and calves. b Estimate reflects aerial count data.
Table 2 Chitina bison harvest and accidental death, 1999–2005 Hunter Harvest Reported Estimated Regulatory
year M (%) F (%) Unk. Total Unreported Illegal TotalAccidental
death Total 1999–2000 2 (100) 0 0 0 2 0 0 0 0 2 2000–2001 1 (100) 0 0 0 1 0 0 0 0 1 2001–2002 1 (100) 0 0 0 1 0 0 0 0 1 2002–2003 2 (100) 0 0 0 2 0 0 0 0 2 2003–2004 1 (100) 0 0 0 1 0 0 0 0 1 2004–2005 No Hunt

15
Table 3 Chitina bison harvest data by permit hunt (DI450), 1999–2005 Percent Percent Percent Regulatory Permits did not unsuccessful successful year issued Applications hunt hunters hunters Bulls (%) Cows Harvest 1999–2000 2 373 0 0 100 2 (100) 0 2 2000–2001 2 294 50 0 100 1 (100) 0 1 2001–2002 2 307 0 50 50 1 (100) 0 1 2002–2003 2 241 0 0 100 2 (100) 0 2 2003–2004 2 302 0 50 50 1 (100) 0 1 2004–2005 No hunt
Table 4 Chitina bison hunter residency and success, 1999–2005 Successful Unsuccessful Regulatory Locala Nonlocal Non- Locala Nonlocal Non- year resident resident resident Total (%) resident resident resident Total (%) Hunters1999–2000 0 2 0 2 (100) 0 0 0 0 (0) 2 2000–2001 1 0 0 1 (100) 0 0 0 0 (0) 1 2001–2002 0 1 0 1 (50) 0 1 0 1 (50) 2 2002–2003 0 2 0 2 (100) 0 0 0 0 (0) 2 2003–2004 0 1 0 1 (50) 0 1 0 1 (50) 2 2004–2005 No hunt a Local means Unit 11 or 13 resident.
16
Table 5 Chitina bison harvest percent by transport method, 1999–2005 Percent of harvest Regulatory 3- or Highway year Airplane Horse Boat 4-wheeler Snowmachine ORV vehicle Unknown n 1999–2000 100 -- -- -- -- -- -- -- 2 2000–2001 100 -- -- -- -- -- -- -- 1 2001–2002 100 -- -- -- -- -- -- -- 2 2002–2003 100 -- -- -- -- -- -- -- 2 2003–2004 100 -- -- -- -- -- -- -- 2 2004–2005 No Hunt
Alaska Department of Fish and GameDivision of Wildlife Conservation
WILDLIFE MANAGEMENT REPORT (907) 465-4190 PO Box 115526
Juneau, AK 99811-5526
17
BISON MANAGEMENT REPORT
From: 1 July 2003 To: 30 June 2005a
LOCATION GAME MANAGEMENT UNIT: 19 (36,486 mi2)
HERD: Farewell herd
GEOGRAPHIC DESCRIPTION: All of the drainages into the Kuskokwim River upstream from Lower Kalskag. Bison inhabit only the Farewell area of Units 19C and 19D.
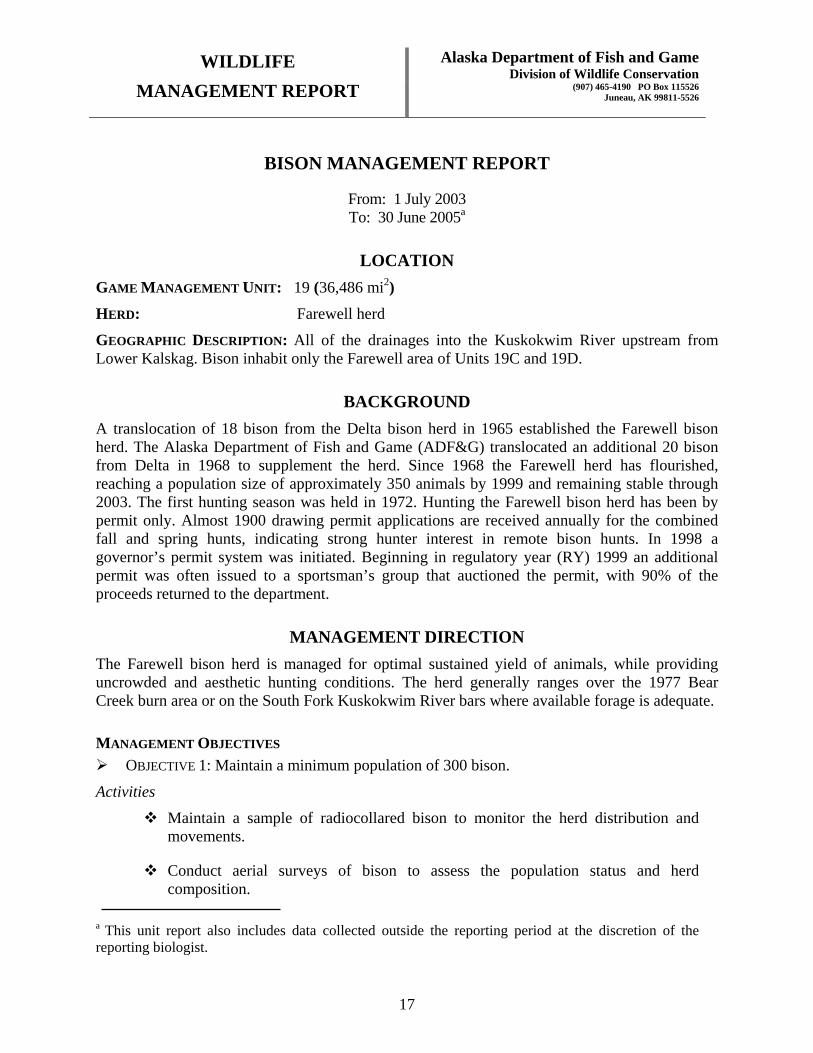
BACKGROUND A translocation of 18 bison from the Delta bison herd in 1965 established the Farewell bison herd. The Alaska Department of Fish and Game (ADF&G) translocated an additional 20 bison from Delta in 1968 to supplement the herd. Since 1968 the Farewell herd has flourished, reaching a population size of approximately 350 animals by 1999 and remaining stable through 2003. The first hunting season was held in 1972. Hunting the Farewell bison herd has been by permit only. Almost 1900 drawing permit applications are received annually for the combined fall and spring hunts, indicating strong hunter interest in remote bison hunts. In 1998 a governor’s permit system was initiated. Beginning in regulatory year (RY) 1999 an additional permit was often issued to a sportsman’s group that auctioned the permit, with 90% of the proceeds returned to the department.
MANAGEMENT DIRECTION The Farewell bison herd is managed for optimal sustained yield of animals, while providing uncrowded and aesthetic hunting conditions. The herd generally ranges over the 1977 Bear Creek burn area or on the South Fork Kuskokwim River bars where available forage is adequate.
MANAGEMENT OBJECTIVES OBJECTIVE 1: Maintain a minimum population of 300 bison.
Activities
Maintain a sample of radiocollared bison to monitor the herd distribution and movements.
Conduct aerial surveys of bison to assess the population status and herd composition.
a This unit report also includes data collected outside the reporting period at the discretion of the reporting biologist.

18
Promote a diverse successional stage habitat mosaic within the range of the bison herd to benefit bison and other species by cooperating with other land and resource management agencies.
OBJECTIVE 2: Maintain a harvest of up to 40 bison.
Activity
Issue 40 drawing permits, 20 for the fall season and 20 for the spring season.
METHODS We conducted aerial surveys annually to estimate herd size and composition. Surveys were flown using fixed-wing aircraft and we used both visual search and radiotelemetry to locate groups of bison. We estimated herd size by locating radiocollared bison and counting bison associated with them. In addition, we searched known bison habitat in the Farewell burn and along the South Fork Kuskokwim and counted bison found in those areas. During surveys we classified bison as adults and calves.
To assist in locating groups of bison, we radiocollared 8 adult cows in fall 2003 using helicopter-supported darting techniques. Bison were immobilized with darts from a Cap-Chur™ rifle or short-range pistol. Darts were loaded with 5 mg carfentanil citrate (Wildnil®, Wildlife Pharmaceuticals, Fort Collins, Colorado, USA) and 60 mg xylazine hydrochloride (Anased®, Lloyd Laboratories, Shenandoah, Iowa, USA). By the end of the report period, 11 bison had functioning radio collars.
During May or June, survey flights were conducted within the traditional range of the herd to monitor the extent of winter mortality. We flew known wintering areas, using fixed-wing aircraft, to search for evidence of kill sites and to check for mortality among radiocollared bison.
In August 2005 we attempted to locate 14 bison thought to have functioning radio collars and survey the Farewell herd using a fixed-wing aircraft and visual search and radiotelemetry to locate groups of bison.
During 6–7 April 2006 the area biologist was the observer in a bison survey conducted with a PA-18 fixed-wing aircraft and an experienced survey pilot. They systematically searched 660 mi2 along transects 1–2 miles apart depending on terrain, vegetation, snow, and sightability conditions. Of the 8 bison radiocollared in 2003, 7 remained active and were monitored. The survey area was bounded on the south by 62°26'N latitude, on the north by 62°50'N latitude, on the west by 154°10'W longitude, and on the east by 153°20'W longitude. Some areas within this boundary were omitted to save money and because of lower likelihood of finding bison. In addition, the biologist and pilot searched south along the South Fork Kuskokwim River to 61°54.500'N latitude. Throughout this survey, they monitored for radiocollared bison. Survey conditions were nearly ideal with generally mild turbulence, 3–6 inches of fresh, undisturbed snow, and good to bright light. Fresh tracks were readily apparent, and the biologist was confident that all large groups of bison were detected, with greatest confidence in the flats (Roger Seavoy, memo dated 11 Apr 2006, ADF&G McGrath office files).

19
The U.S. Bureau of Land Management is considering a plan for prescribed burning on its managed lands in the Farewell area. Staff from ADF&G and the Department of Natural Resources (DNR)/Division of Forestry are cooperating where possible.
Hunt reports collected from permittees included harvest date, location, chronology, transportation, and effort. Harvest data were summarized by regulatory year (RY). A regulatory year begins 1 July and ends 30 June (e.g., RY04 = 1 July 2004 through 30 June 2005).
RESULTS AND DISCUSSION
POPULATION STATUS AND TREND Estimated annual herd growth between 1968 (when aerial surveys were initiated) and 1988 was about 10%. During 1988–2003, hunting and predation mortality slowed herd growth (Table 1). In RY91, RY92, and RY95 the number of drawing hunt permits was reduced from 80 to 50, then to 40 in an attempt to cause a slow increase in the bison herd (Table 2).
Population Size
The most bison counted during a survey was 276 animals in 1996. The most bison observed on a single day survey was 265 on 30 May 2000. During the previous report period, the largest single day count was 145 on 7 May 2003 (Table 1). We did not conduct a full census of the Farewell bison herd during 1988–2005, but recruitment and mortality data indicate the population increased to about 350 bison by 1999 (Table 1). Repeated attempts to completely enumerate herd size during 2000–2005 were not successful because of unpredictable movements and the small number of bison with radio collars. In August 2005, when we attempted to locate 14 radiocollared bison, we located 7 bison with active radio collars and 1 mortality. At that time 163 bison were seen and an additional nonfunctioning radio was located (Table 1). A census on 6–7 April 2006 indicated that the population may have decreased to 94–107 bison. Six radiocollared bison were located within 660 mi2 of bison range that was systematically surveyed in Unit 19. Fewer bison were found than were observed during a less intensive survey the previous August, leading the area biologist to conclude that the Farewell bison population within the management area had declined (Roger Seavoy, memo dated 11 April 2006, ADF&G McGrath office files).
Population Composition
Five fall surveys during RY92–RY02 indicated that calves made up 14–27% of bison located, averaging 22% (Table 1). During 2003, 10% of bison located during the spring survey were calves, but no calves were located that fall. In a 2006 precalving survey, we located 11 (12%) short yearlings, indicating some survival of the 2005 cohort.
Distribution and Movements
In winter the Farewell bison herd is typically scattered in small groups (10–40 animals) on the Bear Creek burn and surrounding habitats, taking advantage of windswept grass and sedge forage in these areas. These groups move onto the South Fork Kuskokwim River floodplain in summer, generally moving in a southerly direction toward the headwaters of that drainage. In recent years bison were seen as far upriver as Sled Pass (Hartman River/Stony River headwaters) and into Ptarmigan Valley (South Fork Kuskokwim/Happy River headwaters). Bison also were
20
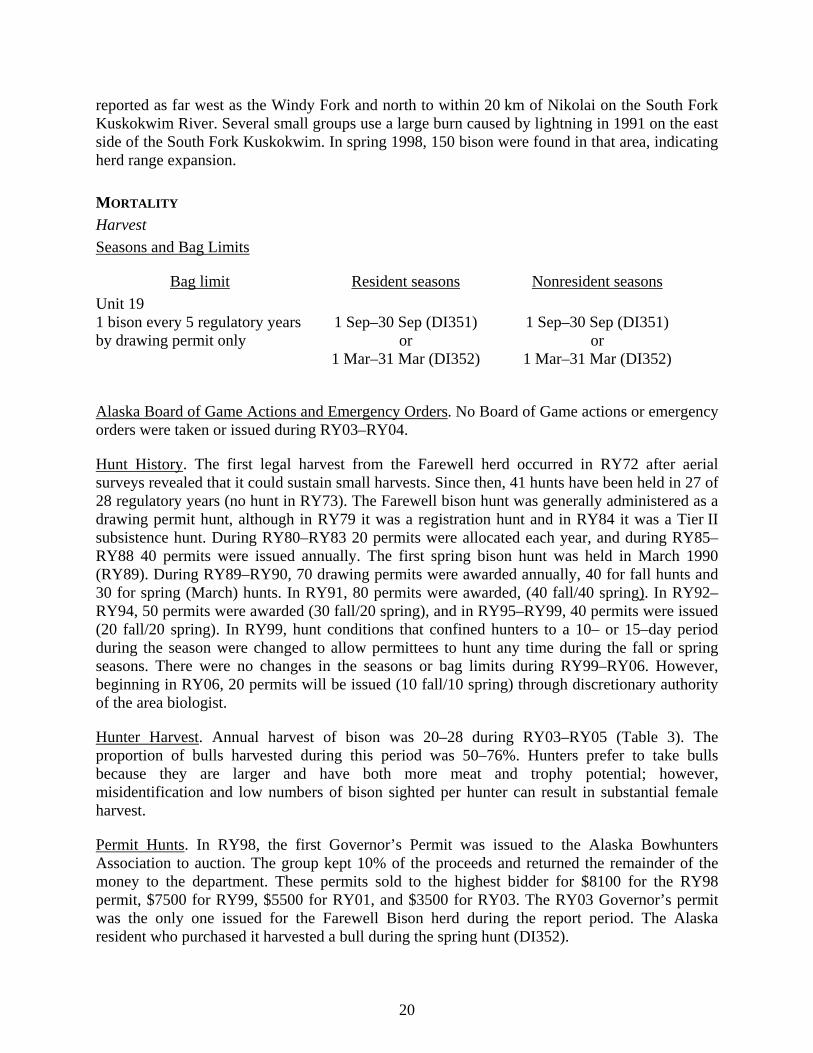
reported as far west as the Windy Fork and north to within 20 km of Nikolai on the South Fork Kuskokwim River. Several small groups use a large burn caused by lightning in 1991 on the east side of the South Fork Kuskokwim. In spring 1998, 150 bison were found in that area, indicating herd range expansion.
MORTALITY Harvest Seasons and Bag Limits
Bag limit Resident seasons Nonresident seasons Unit 19 1 bison every 5 regulatory years by drawing permit only
1 Sep–30 Sep (DI351)
or 1 Mar–31 Mar (DI352)
1 Sep–30 Sep (DI351)
or 1 Mar–31 Mar (DI352)
Alaska Board of Game Actions and Emergency Orders. No Board of Game actions or emergency orders were taken or issued during RY03–RY04.
Hunt History. The first legal harvest from the Farewell herd occurred in RY72 after aerial surveys revealed that it could sustain small harvests. Since then, 41 hunts have been held in 27 of 28 regulatory years (no hunt in RY73). The Farewell bison hunt was generally administered as a drawing permit hunt, although in RY79 it was a registration hunt and in RY84 it was a Tier II subsistence hunt. During RY80–RY83 20 permits were allocated each year, and during RY85–RY88 40 permits were issued annually. The first spring bison hunt was held in March 1990 (RY89). During RY89–RY90, 70 drawing permits were awarded annually, 40 for fall hunts and 30 for spring (March) hunts. In RY91, 80 permits were awarded, (40 fall/40 spring). In RY92–RY94, 50 permits were awarded (30 fall/20 spring), and in RY95–RY99, 40 permits were issued (20 fall/20 spring). In RY99, hunt conditions that confined hunters to a 10– or 15–day period during the season were changed to allow permittees to hunt any time during the fall or spring seasons. There were no changes in the seasons or bag limits during RY99–RY06. However, beginning in RY06, 20 permits will be issued (10 fall/10 spring) through discretionary authority of the area biologist.
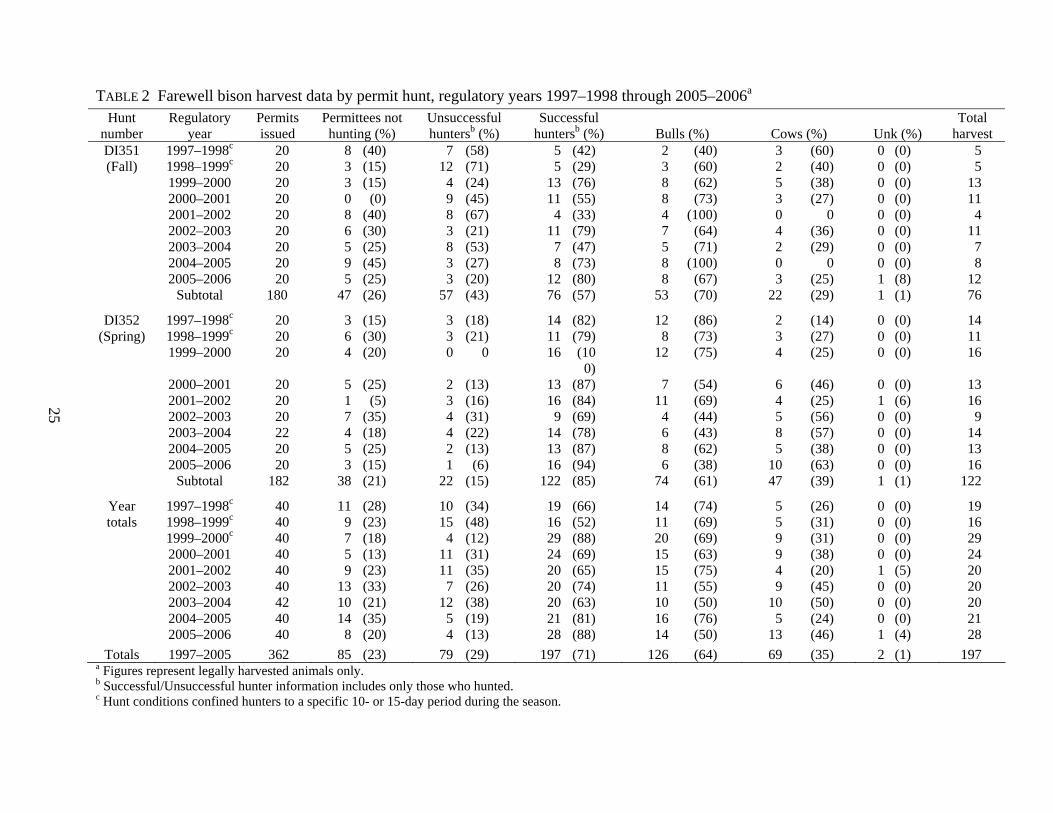
Hunter Harvest. Annual harvest of bison was 20–28 during RY03–RY05 (Table 3). The proportion of bulls harvested during this period was 50–76%. Hunters prefer to take bulls because they are larger and have both more meat and trophy potential; however, misidentification and low numbers of bison sighted per hunter can result in substantial female harvest.
Permit Hunts. In RY98, the first Governor’s Permit was issued to the Alaska Bowhunters Association to auction. The group kept 10% of the proceeds and returned the remainder of the money to the department. These permits sold to the highest bidder for $8100 for the RY98 permit, $7500 for RY99, $5500 for RY01, and $3500 for RY03. The RY03 Governor’s permit was the only one issued for the Farewell Bison herd during the report period. The Alaska resident who purchased it harvested a bull during the spring hunt (DI352).

21
Harvest Chronology. Harvest chronology prior to RY99 was determined by the deliberate distribution of permittees through the season, rather than by hunter choice or success (Table 4). Beginning in RY99 permittees were allowed to choose when to hunt during their respective season. Distribution of hunters during the fall season based on hunter check-ins indicates fairly even temporal dispersion. Spring hunter check-ins were skewed toward the beginning of the season when the snow conditions were usually better. Overall hunter distribution was adequate based on a lack of negative comments from hunters regarding uncrowded and aesthetically pleasing hunting conditions. During RY03–RY05, a majority of the spring harvest was cows (53%). Both the number and percent of cows in the spring harvest increased from 2 cows (14% of spring harvest) in RY97 to 10 cows (63% of spring harvest) in RY05. During RY03–RY04, 13 cows were harvested during spring (87% of total cow harvest), whereas 2 cows were harvested during the fall hunt.
Hunter Residency and Success. Historically, and during RY03–RY04, the vast majority of applicants and permittees for the Farewell bison hunts were Alaska residents (Table 5). Nonresidents obtained 5 permits during RY03–RY04, while local residents (permittees who resided in Unit 19) obtained 1 permit, and nonlocal Alaska residents obtained 75 of the 81 permits issued.
The average success rate for the September hunt (DI351) during RY03–RY05 was 66%, (Table 2), higher than RY00–RY02 (57%) and RY97–RY99 (50%). Hunter success rates in the March hunt DI352 (mean RY03–RY05 = 84%) were higher than the September hunt, and the mean success in the March hunt during RY00–RY02 (81%), but somewhat lower than during RY97–RY99 (87%). The higher hunter success rates during March were likely due to better access opportunities (snowmachines and ski-equipped airplanes), an absence of moose hunters, and the availability of guide and outfitter services. Success rates were calculated for permittees who actually hunted. Overall, 20–35% of all permittees did not hunt during RY03–RY05. Since RY97 13–35% of permittees did not hunt. During RY03–RY05 a mean of 23 hunters were successful (77% of those who hunted; Table 2). The mean number of permittees who did not hunt increased slightly from 9 during RY97–RY99 and RY00–RY02 to 10 during RY03–RY05.
Transport Methods. During RY03–RY05, most hunters used airplanes or snowmachines to access the hunt area (Table 6). During the September hunt (DI351), initial access to the Farewell area was typically by aircraft. Some September hunters have used all-terrain vehicles as a secondary access method, although in RY04 one successful hunter used horses. During the March hunt (DI352), the primary access method was also by airplane. However, access by snowmachines was also popular among permittees during some years. Generally, hunters who used aircraft to reach the hunting area in March used skis or snowshoes to stalk and retrieve bison.
Natural Mortality
Wolf and grizzly bear predation was first documented in the Farewell herd in the early 1990s, more than 20 years following bison introduction. Since 1995, we have found consistent evidence of wolf and bear predation. During RY01–RY02, we had one report that a moose hunter took a grizzly bear found on a buried cow bison carcass. Other instances of bison that were stalked and killed by wolves were noted during wolf and bison surveys in RY05 and RY06. Additionally, a

22
guide who specializes in Farewell bison hunts reported multiple wolf kills during March 2006. During the 2006 bison census, evidence of 3 packs hunting bison was found.
The McGrath Fish and Wildlife Protection officer found a dead cow bison in spring 2003 along the South Fork Kuskokwim. No bullets or bullet wounds were observed, but he observed that the cow had just given birth and we suspect the cow died as a complication of the birthing process. We were not able to necropsy the animal.
HABITAT Little is known about the range conditions for the Farewell bison herd. The herd spends winters on and adjacent to the Bear Creek burn and a burn east of the South Fork Kuskokwim where forage appears adequate. Summer range is generally limited to a smaller area of the Bear Creek burn and various river floodplains within the Alaska Range. Although no estimate of carrying capacity is available, a cursory examination of selected areas in summer 1995 by University of Alaska graduate student Maria Berger and an additional aerial evaluation by Robert Stephenson (ADF&G) in spring 1998 indicated adequate forage availability, with unused range to the north, east, and west.
In cooperation with DNR, a spring burn was planned on a portion of the 1977 Bear Creek burn where grass and sedge growth is declining and is being replaced by black spruce to provide increased forage for bison and stimulate browse production for moose. The prescription was met in spring 2000; however, the burn was not accomplished because burning conditions for black spruce were not favorable. From this we learned that remote prescribed fires are very expensive to complete, which led to our decision to wait, at least in the short-term, for a naturally ignited wildfire. At this time the Bureau of Land Management is working on a prescribed fire plan on adjacent federally managed lands. ADF&G and DNR Division of Forestry will cooperate to the extent possible to help with that prescribed fire plan and implementation.
CONCLUSIONS AND RECOMMENDATIONS We met our objective to maintain harvest of <40 bison, however we believe the herd declined during RY03–RY04. We likely did not meet the objective to maintain a minimum of 300 bison in the Farewell area during RY03–RY04. A census was conducted during spring 2006; ninety-four animals were observed and 6 of 7 radiocollared bison were located. This extensive survey under excellent conditions and evidence that wolf predation occurs lend confidence to the area biologist’s assessment that the Farewell bison herd declined. This evaluation makes it prudent to decrease the number of drawing permits available to hunters, based on the known minimum number of 94 bison.
During RY03–RY04, we monitored up to 14 radiocollared bison, but were unable to complete periodic aerial bison surveys due to lack of funding and aircraft availability. By the beginning of RY05, only 7 radio collars were functional. During the report period we promoted habitat diversification by working with DNR and other landowners to allow wildfires to burn. We administered permit hunts for the Farewell bison herd. The permit hunt continued to attract many prospective hunters to this unique hunting experience.

23
We recommend more frequent herd monitoring during the next report period. We will evaluate the effects of reduced hunting effort that will begin in FY06, when 20 drawing permits will be issued per year (10 for DI351 and 10 for DI352). Additional restrictions may be proposed if the herd does not begin to increase and surveys indicate the number of bison remains below the population objective. Relative to these changes and recommendations, the activity for objective 2 will be changed slightly for the next report period to: Issue up to 40 drawing permits, 20 for the fall season and 20 for the spring season.
PREPARED BY: SUBMITTED BY:
Doreen I. Parker McNeill Doreen I. Parker McNeill Assistant Management Coordinator Assistant Management Coordinator
REVIEWED BY:
Roger Seavoy Wildlife Biologist III
Craig L. Gardner Wildlife Biologist III
Laura A. McCarthy Publications Technician II
Please cite any information taken from this section, and reference as:
Parker McNeill, D. I. 2006. Unit 19 bison management report. Pages 17–29 in P. Harper, editor. Bison management report of survey and inventory activities 1 July 2003–30 June 2005. Alaska Department of Fish and Game. Project 9.0. Juneau, Alaska, USA.

24
TABLE 1 Farewell bison aerial composition surveys and estimated population size, 1992–2006
Survey date
Adults
Calves (%) Bison
observed Estimated
population size 5/18/92 123 18 (12.8) 141 5/20/92 134 36 (21.2) 170 5/22/92 141 34 (19.4) 175 6/02/92 158 32 (16.8) 190 6/30/92 117 31 (21.0) 148 7/21/92 163 33 (16.8) 196 280 8/03/92 90 16 (15.1) 106 11/11/92 110 18 (14.1) 128 11/19/92 157 26 (14.2) 183 6/22/93 171 51 (23.0) 222 7/21/93 82 22 (21.2) 104 300 10/26/93 70 26 (27.1) 96 5/07/94 175 5/16/94 172 44 (20.4) 216 5/26/94 155 42 (21.3) 197 7/27/94 76 24 (24.0) 100 300 4/30/95 89 21 (19.1) 110 7/05/95 210 50 (19.2) 260 300 7/18/95 153 30 (16.4) 183 7/18/96 229 47 (17.0) 276 320 7/01/97 181 31 (14.6) 212 7/28/97 140 24 (14.6) 164 320 8/25/99 42 13 (23.6) 55 350 5/30/00 234 31 (11.6) 265 350 6/18/01 157 31 (16.5) 188 350 1/30/02 34 1 n/a 35 350 9/3/02 32 6 (16.0) 38 350 5/7/03 130 15 (10.0) 145 350
11/16/03 109 n/a n/a 109 350 8/05 163
4/6–7/06 82 12a (1)b (11.7)c 94 94–107 a Eleven short-yearlings and one newborn calf. b Percent calves. c Percent short-yearlings.
25
TABLE 2 Farewell bison harvest data by permit hunt, regulatory years 1997–1998 through 2005–2006a
Hunt number
Regulatory year
Permits issued
Permittees not hunting (%)
Unsuccessful huntersb (%)
Successful huntersb (%) Bulls (%) Cows (%) Unk (%)
Total harvest
DI351 1997–1998c 20 8 (40) 7 (58) 5 (42) 2 (40) 3 (60) 0 (0) 5 (Fall) 1998–1999c 20 3 (15) 12 (71) 5 (29) 3 (60) 2 (40) 0 (0) 5
1999–2000 20 3 (15) 4 (24) 13 (76) 8 (62) 5 (38) 0 (0) 13 2000–2001 20 0 (0) 9 (45) 11 (55) 8 (73) 3 (27) 0 (0) 11 2001–2002 20 8 (40) 8 (67) 4 (33) 4 (100) 0 0 0 (0) 4 2002–2003 20 6 (30) 3 (21) 11 (79) 7 (64) 4 (36) 0 (0) 11 2003–2004 20 5 (25) 8 (53) 7 (47) 5 (71) 2 (29) 0 (0) 7 2004–2005 20 9 (45) 3 (27) 8 (73) 8 (100) 0 0 0 (0) 8 2005–2006 20 5 (25) 3 (20) 12 (80) 8 (67) 3 (25) 1 (8) 12 Subtotal 180 47 (26) 57 (43) 76 (57) 53 (70) 22 (29) 1 (1) 76
DI352 1997–1998c 20 3 (15) 3 (18) 14 (82) 12 (86) 2 (14) 0 (0) 14 (Spring) 1998–1999c 20 6 (30) 3 (21) 11 (79) 8 (73) 3 (27) 0 (0) 11
1999–2000 20 4 (20) 0 0 16 (100)
12 (75) 4 (25) 0 (0) 16
2000–2001 20 5 (25) 2 (13) 13 (87) 7 (54) 6 (46) 0 (0) 13 2001–2002 20 1 (5) 3 (16) 16 (84) 11 (69) 4 (25) 1 (6) 16 2002–2003 20 7 (35) 4 (31) 9 (69) 4 (44) 5 (56) 0 (0) 9 2003–2004 22 4 (18) 4 (22) 14 (78) 6 (43) 8 (57) 0 (0) 14 2004–2005 20 5 (25) 2 (13) 13 (87) 8 (62) 5 (38) 0 (0) 13 2005–2006 20 3 (15) 1 (6) 16 (94) 6 (38) 10 (63) 0 (0) 16 Subtotal 182 38 (21) 22 (15) 122 (85) 74 (61) 47 (39) 1 (1) 122
Year 1997–1998c 40 11 (28) 10 (34) 19 (66) 14 (74) 5 (26) 0 (0) 19 totals 1998–1999c 40 9 (23) 15 (48) 16 (52) 11 (69) 5 (31) 0 (0) 16
1999–2000c 40 7 (18) 4 (12) 29 (88) 20 (69) 9 (31) 0 (0) 29 2000–2001 40 5 (13) 11 (31) 24 (69) 15 (63) 9 (38) 0 (0) 24 2001–2002 40 9 (23) 11 (35) 20 (65) 15 (75) 4 (20) 1 (5) 20 2002–2003 40 13 (33) 7 (26) 20 (74) 11 (55) 9 (45) 0 (0) 20 2003–2004 42 10 (21) 12 (38) 20 (63) 10 (50) 10 (50) 0 (0) 20 2004–2005 40 14 (35) 5 (19) 21 (81) 16 (76) 5 (24) 0 (0) 21 2005–2006 40 8 (20) 4 (13) 28 (88) 14 (50) 13 (46) 1 (4) 28
Totals 1997–2005 362 85 (23) 79 (29) 197 (71) 126 (64) 69 (35) 2 (1) 197 a Figures represent legally harvested animals only. b Successful/Unsuccessful hunter information includes only those who hunted. c Hunt conditions confined hunters to a specific 10- or 15-day period during the season.

26
TABLE 3 Farewell bison harvest, regulatory years 1992–1993 through 2005–2006 Regulatory Reported Estimated
year M (%) F (%) Unk Total Unreported Illegal Total Total 1992–1993 10 (71) 4 (29) 0 14 0 0 0 14 1993–1994 9 (53) 8 (47) 3 20 0 1 1 21 1994–1995 12 (52) 11 (48) 0 23 0 0 0 23 1995–1996 14 (67) 7 (33) 0 21 0 0 0 21 1996–1997 19 (73) 7 (27) 0 26 0 1 1 27 1997–1998 14 (74) 5 (26) 0 19 0 0 0 19 1998–1999 11 (69) 5 (31) 0 16 0 1 1 17 1999–2000 20 (69) 9 (31) 0 29 0 0 0 29 2000–2001 15 (62) 9 (38) 0 24 0 0 0 24 2001–2002 15 (71) 4 (20) 1 20 0 0 0 20 2002–2003 11 (55) 9 (45) 0 20 0 0 0 20 2003–2004 10 (50) 10 (50) 0 20 0 0 0 20 2004–2005 16 (76) 5 (24) 0 21 0 0 0 21 2005–2006 14 (50) 13 (46) 1 28 0 0 0 28
Totals 190 (64) 106 (36) 5 301 0 3 3 304

27
TABLE 4 Farewell bison harvest chronology by month/day, regulatory years 1992–1993 through 2005–2006 Harvest chronology by month/day
Regulatory 9/1–10 9/11–20 9/21–30 3/1–10 3/11–20 3/21–31 Unknown year n (%)a n (%)a n (%)a n (%)a n (%)a n (%)a n (%)b
1999–2000 4 (31) 5 (38) 4 (31) 10 (63) 5 (31) 1 (6) 0 (0) 2000–2001 5 (45) 3 (27) 3 (27) 7 (54) 2 (15) 4 (31) 0 (0) 2001–2002 1 (25) 1 (25) 2 (50) 9 (53) 6 (35) 2 (12) 0 (0) 2002–2003 7 (64) 1 (9) 3 (27) 7 (78) 0 (0) 2 (22) 0 (0) 2003–2004 0 (0) 5 (71) 2 (29) 9 (64) 2 (14) 3 (21) 0 (0) 2004–2005 1 (13) 3 (38) 4 (50) 8 (62) 3 (23) 2 (15) 0 (0) 2005–2006 4 (33) 4 (33) 4 (33) 8 (50) 6 (38) 2 (13) 0 (0)
a Percentage is calculated for each season. Percentages may not total 100% due to rounding. b Percentage is calculated for both seasons combined.

28
TABLE 5 Farewell bison hunter residency and success, regulatory years 1992–1993 through 2005–2006 (hunters and nonhunters combined) Successful Unsuccessful
Regulatory year
Locala resident
Nonlocal resident Nonresident Unk Total (%)
Locala resident
Nonlocal resident Nonresident Unk Total (%)
Total permits
1992–1993 1 13 0 0 14 (28) 1 35 0 0 36 (72) 50 1993–1994 1 17 2 0 20 (40) 2 28 0 0 30 (60) 50 1994–1995 3 20 0 0 23 (46) 0 27 0 0 27 (54) 50 1995–1996 1 19 1 0 21 (52) 0 19 0 0 19 (48) 40 1996–1997 2 23 1 0 26 (65) 0 13 1 0 14 (35) 40 1997–1998 0 17 2 0 19 (48) 0 18 3 0 21 (52) 40 1998–1999 0 16 0 0 16 (40) 1 22 1 0 24 (60) 40 1999–2000 3 25 1 0 29 (72) 0 11 0 0 11 (28) 40 2000–2001 1 23 0 0 24 (60) 0 16 0 0 16 (40) 40 2001–2002 0 19 1 0 20 (50) 0 20 0 0 20 (50) 40 2002–2003 2 11 3 0 16 (40) 0 24 0 0 24 (60) 40 2003–2004 0 19 1 0 20 (49) 1 19 1 0 21 (51) 41 2004–2005 0 20 1 0 21 (53) 0 17 2 0 19 (48) 40 2005–2006 3 21 4 0 28 (70) 0 12 0 0 12 (30) 40
Totals 17 263 17 0 297 (50) 5 281 8 0 294 (50) 591 a Local residents are hunters who live in Unit 19.

29
TABLE 6 Farewell bison harvest by primary transport method, regulatory years 1992–1993 through 2005–2006
Harvest percent by transport method Regulatory
year
Airplane (%) 3- or 4-wheeler
(%) Snowmachine
(%) Unknown or
other (%) n
1992–1993 10 (71) 0 (0) 4 (29) 0 (0) 14 1993–1994 14 (70) 0 (0) 4 (20) 2 (10) 20 1994–1995 17 (74) 0 (0) 4 (17) 2 (9) 23 1995–1996 11 (52) 0 (0) 8 (38) 2 (10) 21 1996–1997 15 (58) 0 (0) 8 (31) 3 (11) 26 1997–1998 11 (58) 0 (0) 8 (42) 0 (0) 19 1998–1999 7 (39) 0 (0) 10 (56) 1 (6) 18 1999–2000 12 (40) 1 (3) 16 (53) 1 (3) 30 2000–2001 13 (54) 0 (0) 11 (46) 0 (0) 24 2001–2002 4 (100) 0 (0) 0 (0) 0 (0) 4 2002–2003 11 (69) 0 (0) 5 (31) 0 (0) 16 2003–2004 12 (60) 0 (0) 7 (35) 1 (5) 20 2004–2005 16 (76) 0 (0) 4 (19) 1 (5) 21 2005–2006 28 (100) 0 (0) 0 (0) 0 (0) 28
Totals 181 (64) 1 (0) 89 (31) 13 (5) 284
Alaska Department of Fish and GameDivision of Wildlife Conservation
WILDLIFE MANAGEMENT REPORT (907) 465-4190 PO Box 115526
Juneau, AK 99811-5526
30
BISON MANAGEMENT REPORT
From: 1 July 2003 To: 30 June 2005a
LOCATION GAME MANAGEMENT UNIT: 20D (5637 mi2)
HERD: Delta herd
GEOGRAPHIC DESCRIPTION: Central Tanana Valley near Delta Junction
BACKGROUND The ancestors of modern bison first colonized North America after migrating from Asia to Alaska over the Bering Land Bridge (Reynolds et al. 1982). Subsequently, 2 subspecies developed: wood bison (Bison bison athabascae) in Alaska and parts of Canada, and plains bison (B. b. bison) in Canada and the contiguous United States. Bison were once the most abundant large mammal in Alaska, but became extirpated about 200–300 years ago probably due to a combination of changing habitat and overhunting (Skinner and Kaisen 1947; Stephenson et al. 2001; D. Guthrie, University of Alaska Fairbanks, personal communication). Bison, most likely wood bison, lived along the Delta River near Delta Junction before their extirpation in Alaska (D. Guthrie, personal communication).
In 1928, 23 plains bison were translocated from the National Bison Range in Montana to the Delta River. At the time biologists were unaware of the existence of wood bison in Canada. By 1947 the herd increased to 400 animals. Hunting began in 1950 and is now one of the most popular permit drawing hunts in the state. Hunting is used to manage the size of the herd. Delta bison have been translocated to other parts of Alaska, and 3 other herds have been established (i.e., Farewell, Chitina River, and Copper River herds).
As agriculture developed on their established range, the Delta bison herd (DBH) began to include hay and cereal grains in their fall and winter diets. In 1976 the State of Alaska made agricultural development a priority within the established range of the DBH, and large-scale agricultural land disposals began in 1978. Eventually bison began to negatively impact agricultural harvests by feeding on crops in the fall before harvest.
In 1979 the Alaska Legislature established the 90,000-acre Delta Junction Bison Range (DJBR) south of the Alaska Highway and adjacent to the Delta Agricultural Project (DAP). The purpose
a This unit report also includes data collected outside the reporting period at the discretion of the reporting biologist.

31
of the DJBR was to perpetuate free-ranging bison by providing adequate winter range and altering seasonal movements of bison to reduce damage to agriculture. In 1984 the legislature appropriated $1.54 million for DJBR development and increased the Delta bison permit hunt application fee from $5 to $10, with the intent that $5 from each application be used for DJBR management. Since 1984 the appropriated funds have been used to hire personnel, purchase equipment for forage management, and develop 2800 acres of bison forage on the DJBR in 2 field complexes, the Panoramic and Gerstle Fields.
Bison damage to farms in the DAP was significantly reduced in 1985 with the first substantial forage production on the DJBR. The DJBR forage development and management continued through this reporting period, reducing conflicts between bison and agriculture.
MANAGEMENT DIRECTION
MANAGEMENT GOALS AND OBJECTIVES The 2000–2005 Delta Bison Management Plan has the following goals and objectives:
Herd Health Management Goal: Ensure that the DBH remains healthy and free of any diseases that might threaten the herd or other wildlife species.
Objective 1: Monitor the DBH to determine if any diseases are present that might threaten the health of the herd or other wildlife species.
Objective 2: Prevent the transmission of diseases between livestock and the DBH.
Objective 3: If diseases are transmitted from livestock to the DBH, prevent the spread of diseases from bison to other wildlife species or to other livestock.
Herd Size and Composition Goal: Manage the DBH to accomplish a reasonable balance between providing the greatest opportunity to hunt and view bison while keeping negative impacts to private property to a minimum.
Objective 1: Manage the DBH to maintain a herd size of approximately 360 bison at the precalving count.
Objective 2: Manage the DBH to maintain a sex ratio of no less than 50 bulls (≥ 1 year old):100 cows.
Bison Conflict Management Goal: Minimize conflicts between bison and the public, including, but not limited to, agriculture interests in the Delta Junction area.
Objective 1: Administer the Delta bison hunt to minimize landowner–hunter conflicts in order to help maintain bison and hunter access to private agricultural land to the greatest extent possible.

32
Objective 2: Enhance bison summer range west of the Richardson Highway to increase its attractiveness to the DBH to attempt to delay the herd’s migration towards the DJBR and private agricultural lands.
Objective 3: Manage the DJBR to encourage the DBH to remain south of the Alaska Highway, and out of private agricultural land as late in the fall as possible, and to attract more bison to the DJBR in the winter and provide greater accessibility to the herd for bison hunters.
Objective 4: The department will provide assistance to the public regarding bison conflicts.
Bison Viewing Management Goal: Provide opportunities for nonconsumptive enjoyment of the DBH, such as bison viewing, interpretation, and education.
Objective 1: Investigate methods and funding sources other than bison permit fees to improve bison viewing opportunities for the public.
METHODS
DJBR MANAGEMENT The perennial grasses, nugget bluegrass (Poa pratensis) and arctared fescue (Festuca rubra), were fertilized on the DJBR each year with N60-P20-K0-S10 at the rate of 200 lb/acre. Fertilizer was applied with an 8-ton capacity broadcast spreader pulled by a John Deere 4250 tractor.
Oats were planted each year on acreage being treated to control bluejoint reedgrass (Calamagrostis canadensis). Prior to planting, fields were fertilized with about 200 lb/acre of N60-P20-K0-S10 by broadcasting fertilizer onto the fallow soil with a broadcast spreader. Approximately 100 lb/acre of oat seed were spread using the broadcast spreader and the field was disked with a field disk to incorporate the fertilizer and seed into the soil.
We analyzed forage quality by collecting forage subsamples and pooling them into 1 composite sample by forage type and location. Samples were sent to the University of Alaska Plant and Soils Lab, Palmer, Alaska for analysis. Samples were analyzed moisture-free and as-fed for relative feed value (RFV), dry matter, crude protein, phosphorus, potassium, calcium, acid-detergent fiber, in vitro dry matter disappearance, total digestible nutrients, metabolizable energy, and net energy-lactation. Generally, RFV was reported to compare forage quality.
We provided trace element mineral blocks in the Panoramic and Gerstle Fields and water in stock water tanks supplied by a well in the Panoramic Fields. We monitored rain gauges in both the Panoramic and Gerstle Fields.
Bison Forage Selection on the DJBR
Bison forage selection was monitored during this report period because of controversies concerning conflicts between moose hunting and bison forage management. The Bison Range Youth Hunt Management Area (BRYHMA) was established in 2002 to regulate moose hunting that was impacting bison forage management on the fields of the DJBR. One resultant criticism

33
of DJBR forage management was that oats planted for bison forage were not used sufficiently by bison to justify their planting. The claim was that bison were frequently using browse species such as shrubs and forbs as forage. Therefore, oats should not be planted as bison forage thus removing them as an attractant to moose in the DJBR fields and negating the need for the BRYHMA. To better understand bison use of DJBR forage crops, bison habitat selection was recorded on the DJBR from July to October 2003.
The BRYHMA totals 6380 acres, about 2800 acres of which are cleared, and consists of the Panoramic and Gerstle Fields in the DJBR. The Panoramic Fields encompass about 3950 acres with about 1700 acres cleared. The Gerstle Fields encompass about 2430 acres with about 1100 acres cleared.
Bison habitat selection in the DJBR fields was recorded using the following 3 types of observations:
1. Radiocollared bison were located during aerial censuses. Habitat selected by the aggregation containing the radiocollared bison was recorded and the number of bison in the aggregation was counted or estimated. This data is an unbiased record of habitat selection because bison were found regardless of their location, habitat selection, or the difficulty of observing them.
2. Aggregations without a radiocollared bison observed during aerial censuses were counted or estimated and their habitat selection recorded. Although the fields were searched thoroughly each census, these data may be slightly biased toward more open habitats because small aggregations without a radiocollared bison may have been overlooked in habitat types where bison were difficult to see (i.e., forest types).
3. Bison observed from the ground during DJBR field operations were counted or estimated and their habitat selection recorded. This data is the most biased of the 3 types collected because most ground observations are of bison in the most visible locations.
Habitat selected by bison was recorded as the following:
1. Oats.
2. Bluegrass.
3. Browse: shrubs including willow and aspen regrowth, and forbs such as fireweed.
4. Other: bare dirt without vegetation, fallow areas with vegetation but without browse, deciduous and coniferous forest.
Moose Forage Selection on the DJBR
Another public concern of DJBR forage management and the BRYHMA was that planting oats for bison forage attracts moose from the surrounding area into the BRYHMA during the hunting season, making them unavailable to hunters outside of the BRYHMA. To better understand
34
moose use of the BRYHMA during the moose hunting season, moose surveys were flown in the BRYHMA prior to and during the 2003 moose hunting season.
Substantial acreage in both fields also includes willow and aspen regrowth ranging in height from 1–3 feet to tall trees. Two major wildfires have burned on the DJBR and created excellent moose habitat. The 1987 Granite Creek fire burned west of the 1408 Road near the Panoramic Fields. The 1994 Hajdukovich Creek fire burned between Charlie Boyd Road and the Gerstle River Road, including much of the Gerstle Fields.
Surveys were flown in early morning and late evening once a week prior to and during the BRYHMA and general moose hunting seasons. Morning surveys were started within ±30 minutes of sunrise and evening surveys were begun approximately 30–45 minutes before sunset. With one exception (4 September), surveys were not flown during BRYHMA assigned hunting periods so that surveys did not interfere with hunters.
Linear transects were flown over the BRYHMA fields in a Piper PA-18. The forested inclusions within each field were not surveyed. Surveys were flown at approximately 300–500 feet above ground level at about 70 mph.
A low pass was made over all moose seen, to classify them as bulls, cows or calves for all surveys except the Panoramic Fields on 4 September. Antler spread of bulls was estimated and the number of brow tines was counted if possible. Moose were classified as adults if they were ≥1 year old.
The habitat moose were observed in was recorded as oats, nugget bluegrass, low shrub (shrubs estimated to be ≤4 ft in height), tall shrub (shrubs estimated to be >4 ft in height), deciduous (deciduous trees estimated to be ≥10 ft in height), or spruce (spruce trees). Activity of the moose was recorded as lying or standing.
One comparative survey was flown inside as well as outside the BRYHMA prior to moose season opening. This survey compared the BRYHMA to an area immediately south and west of the Gerstle Fields in the Hajdukovich Creek burn.
HERD MANAGEMENT Population Status and Trend We used aerial censuses to estimate herd size. A Piper Super Cub (PA-18) fixed-wing aircraft was used to conduct visual searches and to locate aggregations that contained radiocollared bison during March–September. Aggregations were counted visually if possible. Aggregations difficult to count visually were photographed with a digital single lens reflex camera, and counted from the photographs. We conducted replicate censuses and considered the prehunt population size to be the maximum number of bison counted during a single census.
Previously, a precalving population estimate was obtained by subtracting hunting mortality, estimates of wounding loss, and other known and estimated sources of mortality from the prehunt population estimated for the previous fall. However, because of concerns about reduction in herd size in recent years, aerial surveys were flown beginning in late March near the

35
end of the hunting season, and through early May before the peak of calving, and the precalving population was the maximum number of bison counted excluding neonates.
Population Composition Sex and age composition surveys were conducted from the ground by locating groups containing radiocollared bison. We usually conducted multiple surveys and the survey that resulted in the largest sample size was used to calculate composition data. We determined the sex and age of bison by observing them with 8–10×40 binoculars or a 15–60 power spotting scope. Bulls were differentiated from cows by body size, head size and shape, pelage, circumference of horn bases, horn shape, and presence of a penis sheath. Bulls were further classified into 4 different horn categories to estimate age structure for the bull segment of the population based on horn morphology. Yearlings were bulls with straight horns without any upward curvature. “Small bulls” were bulls with horn tips that were starting to curve upward (vertically relative to the horn base) but were not pointing straight up. “Medium bulls” were bulls with horn tips turned 90° vertical, relative to the horn bases. “Large bulls” had horns with tips curved inward toward the center of the skull. To aid in the classification of age relative to horn shape, photographs were taken when possible of all bison killed by hunters. Horn morphology relative to age will be evaluated by comparing horn shape to age based on tooth eruption and wear. We summarized composition data by regulatory year (RY), which begins 1 July and ends 30 June (e.g., RY04 = 1 July 2004–30 June 2005).
Distribution and Movements We monitored bison movements by locating radiocollared bison and from reports by people who observed and reported bison moving through the area. We located radiocollared bison from the ground by using a single antenna and listening for peak signal strength to determine general location. We also obtained more precise locations using aircraft.
We usually captured bison from a Robinson R-22 helicopter to attach radio collars by immobilizing them with darts from a Cap-Chur™ rifle or short-range pistol. Occasionally bison were darted from a truck by approaching them closely. Darts were loaded with 5 mg carfentanil citrate (Wildnil®, Wildlife Pharmaceuticals, Fort Collins, Colorado, USA) and 60 mg xylazine hydrochloride (Anased®, Lloyd Laboratories, Shenandoah, Iowa, USA). Once immobilized, bison were fitted with radio collars, and then given an intramuscular injection of naltrexone hydrochloride (Trexonil®, Wildlife Pharmaceuticals) at a dose of 100 mg naltrexone citrate/mg carfentanil citrate to reverse the immobilization.
Disease Management Bison hunters were asked to collect approximately 30 ml of blood from their kills. These samples were centrifuged and serum was removed by aspiration. Sera were frozen until tested for diseases that included epizootic hemorrhagic disease, bluetongue, infectious bovine rhinotracheitis, bovine viral diarrhea, respiratory syncytial virus, parainfluenza 3, Brucella suis IV, Leptospira interrogans, Toxoplasma gondii, and Q fever. Samples of uncoagulated whole blood were also collected for future genetic work. Hunters also collected fecal samples to test for Johne’s disease.

36
Harvest Management Bison hunters were assigned a beginning hunt date starting 1 October, and a new group of hunters was started every 5 days. Once hunters were eligible to start hunting, they had until the end of the season on 31 March to hunt. Bison hunters attended a mandatory prehunt orientation. The purpose of the orientation was to teach hunters to differentiate between bulls and cows, to discuss land status in the hunt area, and to give hunters supplies and instructions for collecting biological samples.
Bison hunters were required to check out within 24 hours after their hunt. They completed a questionnaire including date and location of kill, number of days afield, number of shots required, weight of bullet, and caliber of firearm. If hunters checked out after normal office hours, they put the questionnaire, biological samples, and the distal end of the lower jaw in a drop box at the Delta Junction ADF&G office. If hunters checked out during working hours, we examined the carcass to record tooth eruption and to extract an I1 tooth from bison that had all permanent teeth. We sent teeth to Matson Laboratories (P.O. Box 308, Milltown, Montana, USA) for aging. Horns were measured according to the Boone and Crockett Club scoring system and photographed. Harvest was monitored using permit harvest reports and questionnaires. Harvest data were summarized by regulatory year.
RESULTS AND DISCUSSION
POPULATION STATUS AND TREND Population Size RY03. Estimated prehunt population size was 407 bison (Table 1) which was substantially lower than expected. The estimated precalving population of 327 in spring 2004 was below the population objective (Table 1).
The highest 2003 bison census of 407 bison is 54 bison lower than the predicted population of 461. There are 4 possible explanations for the low census results: 1) my population model was inaccurate, 2) the bison were present but not counted, 3) an unidentified mortality source killed bison, or 4) a cumulative combination of the above factors. I discuss each of these possibilities below.
Modeling Mistake — The population model is a simple Microsoft®Excel® spreadsheet that has been fairly reliable. With the exception of 1999, the last 10 modeling exercises have predicted population estimates that were as likely to be high as low, with survey estimates being high or low 50% of the time, respectively. High estimates averaged 3.4% high (range 2–6%), or 8–27 bison. Low estimates averaged 3.2% low (range 0.4–7%), or 2–29 bison.
Although the RY03 census of 407 was 54 bison fewer than the modeled estimate of 461, at its extremes the model has varied by about 28 bison in the last 10 years, and has an equal chance of being high or low. Therefore, the current discrepancy is 26 bison lower than the predicted error of ±28 bison.

37
Bison Not Counted — During bison censuses, the DBH can usually be found aggregated together either along the Delta River in June–early July, or on the DJBR/DAP in August or September. Although conceivable, it would be unusual for a segment of the population to remain uncounted.
The DBH had 13 active radio collars in summer 2003, for a ratio of approximately 1 collar/30 bison. This is about the maximum number of radiocollared bison maintained in the herd and past censuses have been achieved with substantially fewer collars. When I place radio collars on bison I do not make a concerted effort to place collars on different segments of the population because I have made the assumption that radiocollared bison distribute themselves randomly through the herd within several months of collaring.
It is possible that a group of bison dispersed outside of the normal Delta bison herd range; however, there is no evidence this occurred. Bison use of the Buffalo Dome burn during RY03 was interesting and resulted in range expansion but likely did not lead to dispersal.
Mortality — Illegal harvest of Delta bison probably occurs but at an unknown rate. However, if significant poaching had occurred, I assume it would occur on adults, which would skew the calf percentage higher. The current percent calves in the herd (22%) are within the normal range, which tends to discredit poaching as a mortality source.
It is doubtful that a large number of bison would have died from other causes (disease, road kills, military activity, etc.) without some evidence being reported. There is no anecdotal evidence that disease reduced productivity or caused mortality. Results of recent serological tests that do not identify a mortality source are discussed below. I can develop numerous mortality scenarios, but there is no basis to assume any have merit.
RY04. Estimated prehunt population size was 421 bison (Table 1), a modest increase from RY03, however substantially lower than in the recent past (RY01–RY02). The precalving population of 332 in spring 2005 was below the population objective (Table 1), despite a reduction in the number of hunting permits in RY04 designed to meet this objective.
RY05. Estimated prehunt population size was 402 bison (Table 1) which was the lowest herd size recorded in the last 17 years and substantially below the anticipated herd size based on the number of hunting permits issued. The precalving population of 353 in spring 2006 was only 7 bison below the objective and an increase from the previous 2 years (Table 1).
Population Composition RY03. I calculated sex and age composition from a sample of 266 bison counted on 3 September 2003 (Table 2). Calf survival was 45 calves:100 cows, and calves composed 22% of the sampled population, slightly lower than recent years but within the range observed. Adult and yearling cows composed 49% of the sampled population.
The bull:cow ratio was 60:100, which met the objective, and bulls ≥1 year old composed 16% of the sampled population. The yearling bull:cow ratio of 26:100 was higher than the ratio in RY02. We observed 77 bulls during composition surveys, with 44% being yearlings, 29% small bulls, 17% medium bulls, and 10% large bulls (Table 3).

38
RY04. I calculated sex and age composition from a sample of 251 bison counted on 30 September 2004 (Table 2). Other composition surveys were conducted on 22, 27, and 28 September 2004. Calf survival was 42 calves:100 cows, and calves composed 21% of the sampled population, which is slightly lower than recent years. Adult and yearling cows composed 51% of the sampled population.
The bull:cow ratio was 61:100, which met the objective, and bulls ≥1 year old composed 23% of the sampled population. The yearling bull:cow ratio of 10:100 was lower than last year’s ratio. We observed 75 bulls during composition surveys with 69 being classified based on horn size and shape, consisting of 19% yearlings, 22% small bulls, 49% medium bulls, and 10% large bulls (Table 3).
RY05. I calculated sex and age composition from a sample of 321 bison counted during 21–23 September 2005. Calf survival was 47 calves:100 cows, and calves composed 22% of the sampled population. Adult and yearling cows composed 46% of the sampled population.
The bull:cow ratio was 71:100, which met the objective, and bulls ≥1 year old composed 23% of the sampled population, with a yearling bull:cow ratio of 20:100. We observed 105 bulls during composition surveys and classified 103 based on horn size and shape. The sample consisted of 29% yearlings, 16% small bulls, 46% medium bulls, and 10% large bulls (Table 3).
Distribution and Movements RY03. The DBH began moving to the DJBR in late July. On 16 July, 50 bison were seen in the Panoramic Fields. During a 30 July aerial survey, the DBH was distributed from the Delta River to the Panoramic Fields. Most bison were still on military land; however, 2 aggregations with 11 bison were in the Panoramic Fields and one aggregation was located on Jarvis Creek south of Butch Lake at lat. 63°48.66, long. 145°39.99, en route to the Panoramic Fields. On 3 August, the number of bison in the Panoramic Fields had increased to 32, with 133 bison observed there on 18 August, and approximately 243 observed in the Panoramic Fields on 19 August.
Bison were first observed in the DAP on 18 August when we received a report of 8 bison there. During a 25 August survey, approximately 220 bison were observed in the DAP and 48 in the Panoramic Fields. On 4 September the entire DBH was located in the DAP.
RY04. The first RY04 bison survey was flown on 8 July 2004 and the DBH was distributed along the Delta River and uplands with the southern most aggregation on the Delta River opposite Bear Creek and the northern most aggregation near Big Lake, with the majority of animals congregated on military land in the Texas–Washington Range areas.
The first observed herd movement eastward toward the DJBR was on 18 July when a group of approximately 35 bison were seen in the Panoramic Fields. The first bison reported on private agricultural land was 3 August when 50 bison were observed north of the Alaska Highway. A 10 August survey revealed that most of the DBH was in the DJBR Panoramic Fields or on private agricultural land, however, one aggregation of 23 bison was still on the Delta River near Buffalo Dome. On 9 September the Delta River aggregation was near the Panoramic Fields.

39
A portion of the DBH continued to use the DJBR through September and on 1 October 92 bison were in the Panoramic Fields and 25 were located on the DJBR west of the Panoramic Fields. Continual use of the DJBR fields by bison during the hunting season coincided with reduced moose hunting activity in the fields resulting from restrictions of the Bison Range Youth Hunting Management Area.
RY04 surveys resumed on 29 March 2005 with an aerial survey. We found most bison in the DJBR and private agricultural lands, however, 70 bison were located on military land in the Texas–Washington Range areas, with an additional aggregation of 30 bison on military land near 33-mile loop road moving west toward the Delta River. During a 15 April 2005 survey, 198 bison were located on military land with most animals in the Bondsteel, Texas, and Washington ranges, and a group of 9 near Buffalo Dome. Two newborn calves were seen on Bondsteel and Washington ranges.
During an aerial survey on 2 May, all bison were observed on the Delta River and uplands, ranging on the north from near Big Lake to opposite Ruby Creek on the south. On a 2 June survey, bison had extended their range south along the Delta River to Black Rapids. By 27 June, the herd had concentrated on military land, with most of the herd on the Texas–Washington Range areas, near Big Lake food plots, and in the Buffalo Dome area.
Radiocollaring — To enhance our abilities to track the herd’s distribution and movements and monitor population size and composition, 8 female bison were immobilized on 29 June 2004 and fitted with radio collars. Induction time was adequate at 5–6 min for 7 bison, but 16 min for one bison hit in the tail. After an intramuscular injection of naltrexone, recovery time was 2–6 min. There were no postcapture mortalities.
FY05. The first FY05 aerial surveys were flown on 6 and 15 July 2005 when the DBH was located along the Delta River with most bison on military land. Twenty bison were observed on the DJBR on 21 July. On 22 July, 2 aggregations of 125 bison were observed in the Gerstle Fields of the DJBR, and 1 aggregation of 12 bison was observed in the Panoramic Fields (R. Swanson, personal communication). On 24 July, 25 bison were still on the Delta River as far south as Black Rapids Glacier.
The first observed movement north of the Alaska Highway occurred 18 August when tracks were seen where bison crossed the highway. By 25 August, when the next survey was flown, most bison were on private and state agricultural lands north of the Alaska Highway. On 29 August and on 4 and 19 September the entire herd was located north of the Alaska Highway on and near private agricultural land. On a 26 September survey, 85 bison were observed in the Panoramic Fields of the DJBR, with the remainder of the herd north of the Alaska Highway.
Two spring surveys were flown on 22 and 27 March 2006. During the 22 March survey, most bison were located in the DJBR Panoramic Fields and on private agricultural land, however, 2 aggregations of 70 bison were locate on Delta River military land near Big Lake, and 1 aggregation of 18 bison was located on military land near 33-mile loop road moving west toward the Delta River. On 27 March, 5 aggregations of 130 bison were located on military land between the Richardson Highway and Granite Creek, moving west toward the Delta River.
40
MORTALITY Harvest Season and Bag Limit. The resident and nonresident bison hunting season was 20 July–31 March during the RY03–RY05 hunting seasons, however, hunting did not routinely begin until 1 October each year so farmers in the DAP could finish harvesting their crops before the hunt started.
Hunters participated in the hunt by drawing permit. Hunt DI403 was for bulls only and hunt DI404 was for cows only. The department and the governor’s office also issue special permits some years, which are designated as DI405. Recipients of these permits were required to follow all regulations and permit conditions that applied to the drawing permits. The following conditions applied to all permits:
Permittees were required to attend an orientation course before hunting. Hunter orientations were scheduled every 5 days coinciding with the hunt period starting dates.
Permittees were assigned specified periods to begin hunting that were determined by the order permits were drawn.
Permittees were required to use a rifle capable of shooting a 200-grain bullet with 2000 ft/lb of retained energy at 100 yards. Bows had to comply with 5 AAC 92.075(4) to be a legal means of harvest. Crossbows were prohibited. Certain muzzleloading firearms qualified.
Alaska Board of Game Actions and Emergency Orders. At the March 2004 meeting of the Alaska Board of Game, the board considered a proposal (proposal 110) from the Delta Bison Working Group and the Delta Advisory Committee to change the moose hunting bag limit for the Bison Range Youth Hunt Management Area to 1 bull with spike-fork or 50-inch antlers or antlers with 4 or more brow tines on at least one side, and to restrict motorized access for hunting in the management area from 1 July–30 September. The board adopted the proposal.
Human-Induced Mortality. RY03 — Human-induced mortality was estimated to be 86 bison (Table 4). Hunters killed 77 bison (43 bulls and 34 cows), and estimated wounding loss was 9 (7% of the number of permits issued). Hunters with bull-only permits (DI403) killed 40 bulls and 1 cow and hunters with cow-only permits (DI404) killed 33 cows and 3 bulls (Table 5). Four hunters killed bison of the wrong sex for a 5% illegal harvest rate. One special use permit (DI405) was issued to Alaska Fish and Wildlife Safeguard and the hunter killed a cow (Table 5).
Successful hunters with bull permits (DI403) hunted a mean of 4.7 days and unsuccessful hunters hunted a mean of 11.1 days. Successful hunters with cow permits (DI404) hunted a mean of 8.1 days and unsuccessful hunters hunted a mean of 10.5 days (Table 6).
RY04 — Human-induced mortality was estimated to be 53 bison (Table 4). Hunters killed 46 bison (33 bulls and 13 cows), and estimated wounding loss was 5 (7% of the number of permits issued). Hunters with bull-only permits (DI403) killed 32 bulls and hunters with cow-only

41
permits (DI404) killed 13 cows and 1 bull (Table 5). One hunter killed a bison of the wrong sex resulting in a 2% illegal harvest rate.
Successful hunters with bull permits (DI403) hunted a mean of 7.2 days and unsuccessful hunters hunted a mean of 13.2 days. Successful hunters with cow permits (DI404) hunted a mean of 5.6 days and unsuccessful hunters hunted a mean of 6.9 days (Table 6).
RY05 — Human-induced mortality was estimated to be 52 bison (Table 4). Hunters killed 45 bison (25 bulls and 18 cows), and estimated wounding loss was 5 (7% of the number of permits issued). Hunters with bull-only permits (DI403) killed 22 bulls and hunters with cow-only permits (DI404) killed 18 cows and 3 bulls (Table 5). Three hunters killed bison of the wrong sex resulting in a 7% illegal harvest rate.
Successful hunters with bull permits (DI403) hunted a mean of 6.9 days and unsuccessful hunters hunted a mean of 21.7 days. Successful hunters with cow permits (DI404) hunted a mean of 11.2 days and unsuccessful hunters hunted a mean of 13.6 days (Table 6).
Permit Hunts.
RY03 — The department received 16,286 applications for 130 permits (Table 7), with 70 permits for the bull-only hunt (DI403), 60 for the cow-only hunt (DI404) and 1 special use permit (DI405) to Alaska Fish and Wildlife Safeguard (Table 5).
RY04 — The department received 14,519 applications (Table 7) for 75 permits with 50 for the bull-only hunt (DI403) and 25 for the cow-only hunt (DI404; Table 5). This was a reduction from the number of permits printed in the spring drawing permit supplement newspaper, which listed 90 permits with 45 each for DI403 and DI404.
RY05 — The department received 13,952 applications for 65 permits with 35 for the bull-only hunt (DI403) and 30 for the cow-only hunt (DI404; Table 5).
Hunter Residency and Success. RY03 — Most Delta bison hunters continued to be nonlocal Alaska residents (99%). Permit holders that reported hunting in both DI403 and DI404 had a 63% success rate (Table 8). One nonresident hunted successfully in RY03.
RY04 — Most Delta bison hunters continued to be nonlocal Alaska residents (98%). Permit holders that reported hunting in both DI403 and DI404 had a 69% overall success rate (Table 8).
RY05 — Most Delta bison hunters continued to be nonlocal Alaska residents (96%). Permit holders that reported hunting in both DI403 and DI404 had a 74% overall success rate (Table 8). Success during this reporting period remained <90% as it has since RY97.
Harvest Chronology. RY03 — Harvest chronology was similar to chronology in previous years, with most harvest (61%) in October and November and with harvest rate slowing during December–February and increasing during March (Table 9).

42
RY04 — Harvest chronology was similar to chronology in previous years, with most harvest (67%) in October and November and with harvest rate slowing during December–January and increasing during February–March (Table 9).
RY05 — Harvest chronology was similar to chronology in previous years, with most harvest (68%) in October and November and with harvest rate slowing during December–February and increasing during March (Table 9).
Transport Methods. Highway vehicles and snowmachines continue to be the most common transport methods (Table 10). RY03 — Successful bison hunters used highway vehicles most commonly (75%), while 22% of successful hunters used snowmachines.
RY04 — Successful bison hunters used highway vehicles most commonly (72%), while 18% of successful hunters used snowmachines.
RY05 — Successful bison hunters used highway vehicles most commonly (74%), while 11% of successful hunters used 3- or 4-wheelers, and 6% used snowmachines.
Harvest Locations. RY03 — Most bison (71%) continued to be killed on private agricultural lands in the DAP (Table 11). Twenty-one percent of bison were killed on the DJBR with 8% killed in other areas.
RY04 — Most bison (76%) were killed on private agricultural lands in the DAP (Table 11). Eleven percent of bison were killed on the DJBR with 13% killed in other areas.
RY05 — Most bison (63%) were killed on private agricultural lands in the DAP (Table 11). Twenty-six percent of bison were killed on the DJBR and 12% were killed in other areas.
Other Mortality Natural mortality was not quantified for the DBH. Humans caused most nonhunting mortality through road kills, trapper snares, and other factors.
Disease Management Disease transmission from domestic livestock in the Delta Junction area was the greatest potential source of nonhunting mortality. Cattle in the area have had infectious bovine rhinotracheitis, bovine viral diarrhea, bovine respiratory syncytial virus, infectious bovine kerato conjunctivitis, parainfluenza 3 (PI3), Johne’s disease (positive in Alaska but not verified from Delta Junction), and Neospora caninum (D. Quarberg and C. Crusberg, personal communication).
The following serological tests and results were obtained in November 2003 for samples collected from the DBH during 2000–2003: bovine viral diarrhea = 140 analyzed with 4 positive (2.9%); infectious bovine rhinotracheitis = 72 analyzed with 0 positive (0%); bovine parainfluenza-3 = 72 analyzed with 72 positive (100%); malignant catarrhal fever = 147

43
analyzed with 18 positive for ovine form (12.2%); brucellosis = 193 tested with 0 positive (%); Johne’s disease = 193 tested with 0 positive (0%); and neospora = 210 submitted for testing with no results available. Also, fecal samples from 12 bison were submitted for culture of Johne’s disease and were negative for Johne’s disease and also negative for Mycobacterium avium paratuberculosis. It is noteworthy that 7 bison from the Farewell Herd were negative for bovine parinfluenza-3 and malignant catarrhal fever, whereas some Delta bison tested positive for these agents, indicating that exposure to domestic livestock continues to be a concern for the DBH. However, no dramatic changes in historic prevalence for infectious diseases were detected. We intend to collect lungs from hunter-killed bison in the future to look for clinical signs for parainfluenza-3 and malignant catarrhal fever.
HABITAT 2003 DJBR Habitat Management Approximately 820 acres of nugget bluegrass and 50 acres of arctared fescue were fertilized at a cost of $23,177. Grasses were fertilized in the Panoramic Fields during 13–28 May and in the Gerstle Fields during 28 May–5 June.
Approximately 300 acres of Derby oats were planted in the Panoramic Fields and 120 acres in the Gerstle Fields. The following oat seeding dates, acreages, and RFVs were achieved:
Date Location/Acres RFV 15 May Panoramic Fields, 80 acres 103 15 Jun Panoramic Fields, 80 acres 130 17 Jun Panoramic Fields, 35 acres 162 25 Jun Panoramic Fields, 80 acres 123–149 (2 different
planting locations) 1 Jul Gerstle Fields, 100 acres 168 9 Jul Gerstle Fields, 20 acres 157
Bluejoint reedgrass was mowed on 23 and 28 July to test mowing as a long-term control technique for this noxious grass. When mowed, the grass was approximately 8–28 inches tall with a RFV of 96.
Sixteen acres in the Panoramic Fields near the water tanks were planted with nugget bluegrass on 21–22 July to reestablish bluegrass in this area. Test plantings of alternate forage species were planted in the Panoramic Fields. Five acres were seeded with carton brome and 4 acres with alsike clover.
Approximately 255 acres were disked on the Panoramic and Gerstle Fields to kill unwanted grasses and trees. An additional 330 acres were mowed with a brush mower to control noxious vegetation. Old berm piles were removed from 80 acres in the Panoramic Fields to eliminate a source of bluejoint seeds.
Rainfall collected on the DJBR totaled 6.85 inches on the Panoramic Fields and 3.20 inches on the Gerstle Fields.

44
Aerial Observations of Habitat Selected by Aggregations with Radiocollared Bison. Bison censuses were flown on the DJBR on 18, 19, 25, 27, and 28 August, 10 September, and 1 October 2003. Eighteen aggregations were located that contained a radiocollared bison. Mean aggregation size was 57 bison and a cumulative sample of 1031 bison were observed. Most bison (66%) were observed in oats, 21% were observed in other habitats, 11% in bluegrass, and 2% in browse habitats (Fig. 1).
Aerial Observations of Habitat by Aggregations without Radiocollared Bison. Twelve aggregations were observed without radiocollared bison. Mean aggregation size was 17 bison and a total of 200 bison were observed. Most bison (51%) were observed in bluegrass, 34% were observed in oats, 15% in other habitat types, and 0% were seen in browse habitats.
Ground Observations of Habitat Selection by Bison. Thirty-four aggregations were observed from the ground from 16 July–1 October 2003. Eight aggregations were observed in July, 18 in August, 6 in September, and 1 in October. Mean aggregation size was 58 bison, with a cumulative sample of 1969 bison observed. Most bison (67%) were observed in oats, 26% were in bluegrass, 7% were in other habitats, and 0% were in browse.
Cumulative Observations of Habitat Selection by Bison on the DJBR. Pooling all observations resulted in 64% of bison observed in oats, 23% in bluegrass, 12% in other habitats, and 1% in browse types.
Bison observed on the DJBR from 16 July–1 October 2003 showed strong habitat selection for oats, and 64% of all observations occurred there even though oats were planted on only about 420 acres (15% of the fields). Planting oats is an important part of the DJBR bison management program. The 2000–2005 Delta Bison Management Plan was developed with public input from the Delta Bison Working Group and approved by the Alaska Board of Game to meet the DJBR legislative mandate. The plan states that the department will “Manage the DJBR to encourage the Delta bison herd to remain south of the Alaska Highway, and out of private agricultural land as late in the fall as possible.” An important part of the DJBR management program is planting oats to prevent soil erosion on exposed soil and to provide high quality forage to attract bison to the DJBR.
Criticism of the oat plantings was based on anecdotal observations by a few members of the public of bison browsing on aspen, willows, and forb species such as fireweed. Therefore, critics of the DJBR forage management program claimed that oats were not preferred bison forage and that DJBR management practices to control and eliminate browse species should be discontinued.
Delta bison do forage upon shrub and forb species. Berger (1996) studied Delta bison forage in late summer (26 June–18 August) along their Delta River summer range and stated “although a substantial portion of bison diets was browse, they are predominantly grazers.” I have also observed Delta bison foraging on shrub and forb species on the DJBR. Shrub and forb browse species are abundant on the DJBR in the 1987 Granite Creek burn and the 1994 Hajdukovich Creek burn; however, Delta bison continue to prefer grazing to browsing.

45
DJBR forage management requires high quality forage to attract and hold bison on the DJBR during late summer and fall to keep them out of private agricultural land on the north side of the Alaska Highway. Based on forage quality analysis, oats grown on the DJBR are some of the highest quality forage available to Delta bison in the fall. Bluegrass grown on the DJBR is also high quality but lower than oats and similar to brome grass hay crops on private land. Bison showed strong preference for oats, the highest quality forage available during observations of bison habitat selection.
Therefore, we will continue to use oats as an important part of the DJBR bison forage management program to prevent soil erosion and provide high quality forage. Although Delta bison consume browse species, only 1% of all bison observed on the DJBR from July–September 2003 were found in this habitat type. Bison showed a strong preference for oats on the DJBR.
Aerial Observations of Moose Habitat Selection on the DJBR. Surveys were flown on the following dates: 19 August morning and evening, 27 August morning, 28 August evening, 4 September morning, 10 September morning and evening, and 16 September morning and evening. Only 1 survey was flown on 4 September because poor flying weather prevented an evening flight. The comparative survey was flown during the evening of 28 August before the hunting season so it would not interfere with hunters.
The 4 September survey was the only one flown during a BRYHMA hunt period. Because one hunter may still have been hunting in the Panoramic Fields at the time, I maintained a survey altitude of 500 feet AGL (instead of 300–500 feet AGL) to avoid disturbing moose. Therefore, composition data was only collected from cows with calves during that survey. No hunters were hunting in the Gerstle Fields and composition data was collected there.
Mean survey time was 34 minutes (range 28–45) in the Panoramic Fields and 24 minutes (range 19–31) in the Gerstle Fields. The Hajdukovich Creek burn comparative survey was 30 minutes in duration.
Number of Moose Seen. Figure 2 illustrates the number of moose seen in both the Panoramic and Gerstle Fields during BRYHMA surveys. The number of moose seen in August prior to the hunting season ranged from 29 to 39 for a density of 7–9 moose/mi2 in the fields. Bull composition averaged 8 bulls:100 cows (range 0–15). A total of only 7 bulls were seen in the fields during August (Fig. 3), of which only 1 would have been legal based on general hunting season antler restrictions.
The comparative survey on 28 August resulted in more moose seen outside the BRYHMA than inside. We surveyed the Hajdukovich Creek burn for 30 minutes from 1950–2020 hours and saw 49 moose including 14 bulls. The BRYHMA survey resulted in 29 moose with no bulls seen. The Panoramic Fields survey took 28 minutes from 2042–2110 hours with 21 moose and no bulls. The Gerstle Fields survey was 26 minutes from 2114–2140 hours with 8 moose and no bulls.
The number of moose seen in the fields increased during September surveys. The highest number seen was during the 16 September morning survey with 143 moose observed in the 2

46
fields for a density of approximately 33 moose/mi2. During September, the bull:cow ratio averaged 7:100 (range 0–13), with 23 total bulls seen (Fig. 3). Seven bulls seen in September had forked antlers and would have been legal to hunt under antler restrictions; however, I think several of these bulls were seen repeatedly and thus counted several times. No other legal bulls were seen in the BRYHMA.
Habitat Selection by Moose in the BRYHMA. Moose use of the DJBR fields and the oats planted in the fields increased from mid August (29%; range 21–40%) through mid September (51%; range 36–64%; Fig 4). However, based on habitats selected by observed moose, they are not attracted to the fields solely because of oats. Moose selected non-oat habitats more frequently than oats in August. During September surveys, moose selected oats on average only about one-half of the time. The DJBR fields have many acres in woody regrowth. Moose were frequently observed in low shrub and tall shrub habitats. Therefore, it is apparent that the portions of the fields that were cleared but regrown to low and tall shrubs provide excellent moose habitat. Moose would probably be found in this area whether oats were planted or not. The increased use of the DBJR oats in September appeared to correspond with willow and aspen dropping their leaves. As leafy browse became less available, moose increased their use of oats.
Based on the 28 August comparative survey, use of the BRYHMA by moose prior to the hunting season, and possibly early in the hunting season, may have been lower than outside of the fields in the surrounding burns. The number of moose in the fields increased during September. However, most were cows. Bulls were not attracted to the fields in numbers disproportionately higher than their composition in the winter population. During a 2001 winter population estimate of southwest Unit 20D, the bull:cow ratio was estimated to be 15:100 (90% CI = 9–20). The lower limit of this estimate is similar to ratios observed during BRYHMA surveys. However, if bull moose were attracted to the fields disproportionate to their numbers in the population, I would expect the bull:cow ratio in the BRYHMA survey to be higher than observed. As moose pre-rut and rutting activity increased in September, the bull moose attracted to the BRYHMA were probably attracted to the large numbers of cow moose as much as to the oats.
The moose habitat selection survey in the BRYHMA indicates that DJBR forage management does not appear to attract bull moose away from areas generally open to hunting. Therefore, criticism that moose hunters in the area of the DJBR fields have fewer bull moose to hunt because of DJBR bison forage management and BRYHMA regulations is not justified.
RY03 — Approximately 820 acres of nugget bluegrass and 50 acres of arctared fescue were fertilized at a cost of $26,874. Grasses were fertilized in the Panoramic Fields during 27 May–2 June 2004 and in the Gerstle Fields during 3–7 June.
Approximately 300 acres of Derby oats were planted in the Panoramic Fields and Gerstle Fields. The following oat seeding dates, acreages, and RFVs were achieved:
Date Location/Acres RFV 19 May Panoramic Fields, 80 acres 108 14 Jun Panoramic Fields, 80 acres 91 17 Jun Panoramic Fields, 35 acres 108 22 Jun Panoramic Fields, 50 acres 126
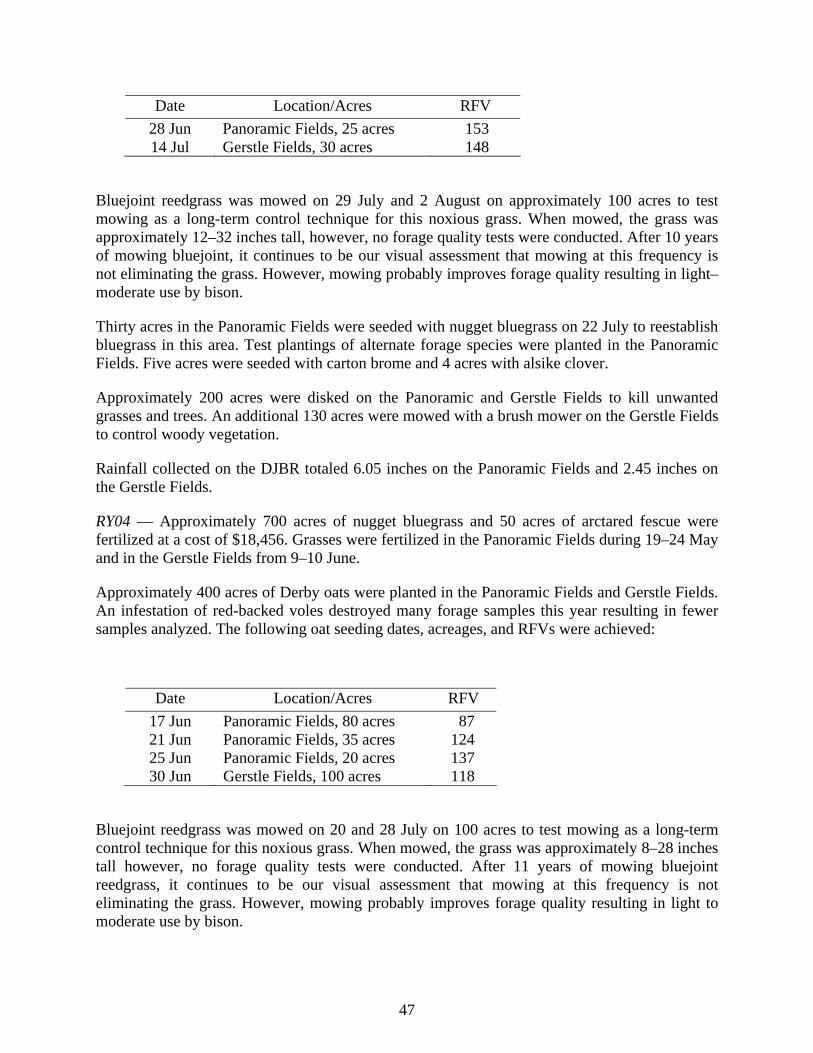
47
Date Location/Acres RFV 28 Jun Panoramic Fields, 25 acres 153 14 Jul Gerstle Fields, 30 acres 148
Bluejoint reedgrass was mowed on 29 July and 2 August on approximately 100 acres to test mowing as a long-term control technique for this noxious grass. When mowed, the grass was approximately 12–32 inches tall, however, no forage quality tests were conducted. After 10 years of mowing bluejoint, it continues to be our visual assessment that mowing at this frequency is not eliminating the grass. However, mowing probably improves forage quality resulting in light–moderate use by bison.
Thirty acres in the Panoramic Fields were seeded with nugget bluegrass on 22 July to reestablish bluegrass in this area. Test plantings of alternate forage species were planted in the Panoramic Fields. Five acres were seeded with carton brome and 4 acres with alsike clover.
Approximately 200 acres were disked on the Panoramic and Gerstle Fields to kill unwanted grasses and trees. An additional 130 acres were mowed with a brush mower on the Gerstle Fields to control woody vegetation.
Rainfall collected on the DJBR totaled 6.05 inches on the Panoramic Fields and 2.45 inches on the Gerstle Fields.
RY04 — Approximately 700 acres of nugget bluegrass and 50 acres of arctared fescue were fertilized at a cost of $18,456. Grasses were fertilized in the Panoramic Fields during 19–24 May and in the Gerstle Fields from 9–10 June.
Approximately 400 acres of Derby oats were planted in the Panoramic Fields and Gerstle Fields. An infestation of red-backed voles destroyed many forage samples this year resulting in fewer samples analyzed. The following oat seeding dates, acreages, and RFVs were achieved:
Date Location/Acres RFV 17 Jun Panoramic Fields, 80 acres 87 21 Jun Panoramic Fields, 35 acres 124 25 Jun Panoramic Fields, 20 acres 137 30 Jun Gerstle Fields, 100 acres 118
Bluejoint reedgrass was mowed on 20 and 28 July on 100 acres to test mowing as a long-term control technique for this noxious grass. When mowed, the grass was approximately 8–28 inches tall however, no forage quality tests were conducted. After 11 years of mowing bluejoint reedgrass, it continues to be our visual assessment that mowing at this frequency is not eliminating the grass. However, mowing probably improves forage quality resulting in light to moderate use by bison.

48
Approximately 50 acres was disked and left fallow on the Panoramic Fields to control bluejoint reedgrass. Woody vegetation was mowed on approximately 630 acres on the Panoramic and Gerstle Fields to kill unwanted grasses and trees.
Rainfall collected on the DJBR totaled 10.85 inches on the Panoramic Fields and 4.35 inches on the Gerstle Fields.
DELTA BISON WORKING GROUP ACTIVITIES The Delta Bison Working Group (DBWG) met and participated in an ADF&G ad hoc committee on management of moose hunting on the Delta Junction Bison Range.
The Bison Range Youth Hunt Management Area (BRYHMA) was created in the DJBR fields based on recommendations in part from the DBWG. Due to local concerns about the BRYHMA, the department created an ad hoc committee to review moose hunting on DJBR fields and the BRYHMA. Text from the final report of the ad hoc committee is reprinted below:
Background
The 90,000-acre Delta Junction Bison Range was established by the legislature in 1979 to perpetuate free-ranging bison and to provide habitat to attract bison away from and reduce crop damage on private agricultural lands. ADF&G manages the range and must stay within the legal mandates of the legislation.
Levels of activity in the fields of the Delta Junction Bison Range have increased over the past 10 years, prompting concerns about the effects of disturbance on bison movements onto and off of the range. In 2002 the Board of Game restricted moose hunting in the fields by a drawing permit limited to youth (age 10–17) for any bull moose, and capped the harvest at 24. The Bison Range Youth Hunt was established to:
1. Reduce damage to bison forage crops.
2. Reduce disturbance to bison in the fields during moose hunting season.
3. Reduce safety hazards to ADF&G staff conducting necessary Bison Range fieldwork during moose hunting season.
A secondary benefit of the hunt was to introduce a limited number of youth to moose hunting in an area with a high chance of success. However, most hunters who had used the fields in the past were excluded. Concerns voiced about the youth hunt prompted ADF&G to review the situation and form the ad hoc committee.
Results of 2002 and 2003 Delta Bison Range Youth Hunts — In 2002, 24 permits were issued for any bull moose, and hunters killed 17 bulls. The youth hunt effectively limited the number of vehicles and hunters in the fields, reduced damage to bison forage crops, reduced disturbance to bison in the fields, and provided a safer working environment for ADF&G staff who accomplished substantially more work in the fields. Also, bison used the range more. In 2003, 24 permits were issued and 7 bulls were killed. Aerial surveys indicated significant use of vehicles in the fields, some relating to moose hunting, but more relating to

49
other activities. Damage to crops was again reduced from 2001 (pre-youth hunt) levels, a safer work environment resulted, and more fieldwork was accomplished, but vehicular activity and disturbance to bison appeared to increase over 2002. Bison used the fields until a few days before moose hunting season and immediately after the moose hunting season, but only slightly during the season.
Meeting Schedule — The committee met once in April, twice in May, and once in October 2003, and was presented with information about forage management, hunting effort, an attorney general’s opinion of whether the fields are “baited,” Bison Range Youth Hunt history, and results of the youth hunt for the last 2 years. Members discussed issues relating to moose hunting on the fields and formulated management alternatives to address the concerns expressed by the public. They also circulated a Public Input Questionnaire to residents in the Delta Junction area and received 78 responses. Meeting notes from the 4 meetings are available from Cathie Harms, ADF&G Fairbanks (907-459-7231).
ADF&G appreciates the time and effort the ad hoc committee members have spent on this issue and is committed to working with the Delta Advisory Committee, the Delta Bison Working group, the Department of Natural Resources (DNR), and the Board of Game to further resolve public concerns and manage the Delta Junction Bison Range within the legal mandates of legislation that established the range.
Recommendations for Hunting on the Delta Bison Range Fields Endorsed by the Ad Hoc Committee on 8 October 2003:
1. Moose hunting should continue in the fields of the Delta Junction Bison Range under the following conditions:
Moose hunting should be regulated by a drawing permit. Harvest should not exceed 20 spike/fork or 50" bulls per year. Drawing permits should allow a 4-day block of time for each hunter during the first 3 weekends in September, and no more than 3 hunters should be allowed in each field per weekend (6 hunters per weekend total).
The ad hoc committee did not reach agreement on whether permits should be issued to youth only (defined in the current youth hunt as 10–17 yr old) or to any hunter. Five of the 7 committee members supported limiting participation to youth, while 2 members supported allowing any hunter to apply. Feedback from the questionnaire circulated in the community was split about evenly between limiting the hunt to youth and allowing any hunter to apply. The ad hoc committee decided to forward this information to the Delta Advisory Committee for consideration.
If a hunt is limited to youth, 1 successful hunt per lifetime should be allowed.
2. Motorized transportation should not be allowed within the fields for hunting any species of wildlife between 1 July and 30 September. (This is a change from current regulations, which allow a motorized vehicle to be used to retrieve a moose carcass during the youth hunt.)

50
3. Motorized transportation should not be allowed within the fields for nonhunting related uses between 1 July and 30 September. ADF&G and the Delta Bison Working Group should work with DNR to restrict all DJBR field access to nonmotorized transportation. Hunting for other species and nonhunting related uses are likely causing as much or more disturbance than moose hunting.
4. If disturbance levels remain high once motorized access to the fields is restricted, ADF&G, the Delta Bison Working Group, and DNR should work to reduce or eliminate human activities in the fields through whatever methods are necessary, but hunting should be the last activity to be eliminated.
5. Poaching in the Delta Junction area is perceived to be significant and on the increase. Additional enforcement is needed and should be obtained.
6. This final report with recommendations and a summary of public input received from the community is to be sent to members of the Delta Advisory Committee and the Delta Bison Working Group.
AD HOC COMMITTEE MEMBERS PRESENT: Dick Bishop Mike Schultz Don Quarberg Mike Bender Glen Wright Dean Cummings Lee "Skip" Olsen Tim Webb (alt) Jack Morris (alt)
CONCLUSIONS AND RECOMMENDATIONS After several years of herd size being below the population objective (including during this report period), despite the reduction in permits to meet the objective, we met our precalving objective in spring 2006. Herd productivity and calf survival continued within the normal range with calf:cow ratios ranging from 42–47:100 and 21–22% calves in the herd during this reporting period. The bull:cow ratio objective was met with ratios ranging from 60–71 bulls:100 cows.
Herd movements showed a problematic trend with some bison appearing to spend the summer in the DJBR/DAP area rather than migrating to the Delta River. Some of these cows calved in the DAP and DJBR. It may be advisable to consider harvesting those bison that remain in the DAP late in the spring or move there early in the fall. However, extending the bison hunting season into these times will have an impact on farming operations. Before implementing a bison season opening prior to 1 October, private landowners should reach a consensus that this action is worthwhile. That consensus has not been reached.
Testing bison sera and feces for infectious diseases in RY03 met herd health objectives, however, funds were not available for testing in RY04. Although several diseases were detected, no management actions were required. The serologic health of the DBH continued to be jeopardized by close contact with domestic livestock in the Delta Junction area and by the potential for domestic bison to escape captivity and join the wild herd. Interagency efforts should continue to encourage regulatory changes that provide greater oversight of domestic bison to assure they do not escape captivity and are disease-free. At this time there are no infectious diseases thought to be limiting herd productivity.
51
The objective to investigate methods and funding sources other than bison permit fees to improve bison viewing opportunities for the public was not met.
The 4 bison conflict management objectives were met. The DJBR met the legislative intent to reduce conflicts between bison and agriculture and continued to benefit farmers by delaying and/or reducing bison movements into the DAP; however we continue to strive to improve. Implementation of the Bison Range Youth Hunt Management Area may have contributed to bison spending more time on the DJBR in the fall. The bison hunt was administered in a manner that minimized conflicts with private landowners. No progress was made toward enhancing summer range to delay the herd’s migration toward the DJBR. It was not necessary for the department to provide assistance to the public experiencing bison conflicts because there were no requests.
The greatest challenges to DJBR management continued to be 1) controlling the native grass, bluejoint reedgrass (Calamagrostis canadensis), and woody regrowth with nonherbicidal techniques; 2) developing more cost-effective forage management techniques; and 3) holding bison on the DJBR as late in the fall as possible. Controlling bluejoint reedgrass and woody regrowth is a particular challenge in the Gerstle Fields with current funding and staffing levels. We will continue work to improve these aspects of DJBR management.
Hunter success remained low relative to earlier years, ranging from 59 to 71% for permit recipients who reported. If hunter success remains at these levels once the herd increases above the population objective it will require issuing more permits to achieve harvest objectives. During this report period the number of permits were reduced to reduce harvest because herd size was below the objective.
No regulatory changes are recommended at this time to adjust DBH management.
LITERATURE CITED
BERGER, M. 1996. Summer habitat relationships and foraging ecology of the Delta Bison Herd. Thesis, University of Alaska Fairbanks.
REYNOLDS, H. W., R. D. GLAHOLT, AND A. W. L. HAWLEY. 1982. Bison. Pages 972–1007 in J. A. Chapman and G. A. Feldhammer, editors. Wild Mammals of North America: Biology, Management, and Economics. The Johns Hopkins University Press, Baltimore, Maryland, USA.
SKINNER, M., AND O. KAISEN. 1947. Fossil bison of Alaska and preliminary revision of the genus. Bulletin of the American Museum of Natural History 89:127–156.
STEPHENSON, R. O, S. C. GERLACH, R. D. GUTHRIE, C. R. HARINGTON, R. O. MILLS, AND G. HARE. 2001. Wood Bison in Late Holocene Alaska and Adjacent Canada: Paleontological, Archaeological and Historical Records. Pages 124–158 in S. C. Gerlach and M. S. Murray, editors. Wildlife and People in Northern North America. Essays in Honor of R. Dale Guthrie. British Archaeological Reports, International Series 944.

52
PREPARED BY: SUBMITTED BY:
Stephen D. DuBois Doreen I. Parker McNeill Wildlife Biologist III Assistant Management Coordinator
REVIEWED BY:
Craig L. Gardner Wildlife Biologist III
Laura A. McCarthy Publications Technician II
Please cite any information taken from this section, and reference as:
DuBois, S. D. 2006. Unit 20D bison management report. Pages 30–68 in P. Harper, editor. Bison management report of survey and inventory activities 1 July 2003–30 June 2005. Alaska Department of Fish and Game. Project 9.0. Juneau, Alaska, USA.
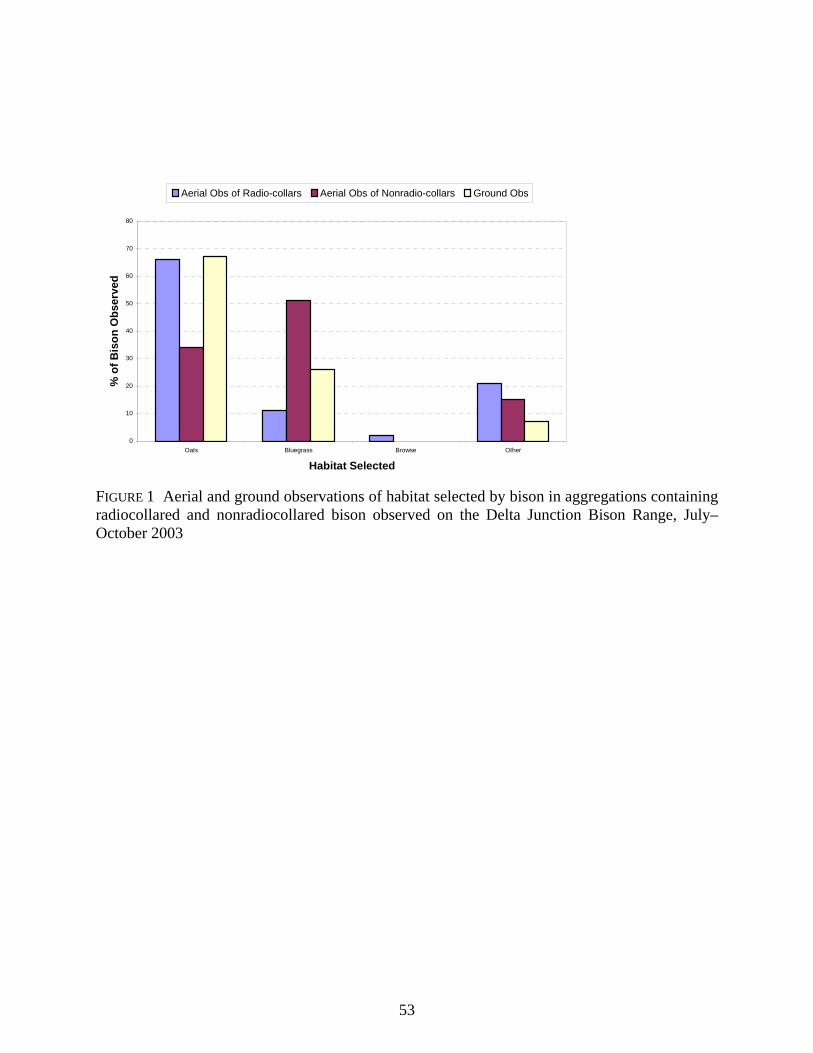
53
FIGURE 1 Aerial and ground observations of habitat selected by bison in aggregations containing radiocollared and nonradiocollared bison observed on the Delta Junction Bison Range, July–October 2003
0
10
20
30
40
50
60
70
80
Oats Bluegrass Browse Other
Habitat Selected
% o
f Bis
on O
bser
ved
Aerial Obs of Radio-collars Aerial Obs of Nonradio-collars Ground Obs

54
FIGURE 2 Total moose seen in the Bison Range Youth Hunt Management Area during August–September 2003 aerial surveys
0
20
40
60
80
100
120
140
160
Aug 19am
Aug 19pm
Aug 27am
Aug 28pm
Sep 4 pm Sep 10 am
Sep 10pm
Sep 16am
Sep 16pm

55
FIGURE 3 Adult moose seen in the Bison Range Youth Hunt Management Area during August–September 2003 aerial surveys
020406080
100120
Aug 19am
Aug 19pm
Aug 27am
Aug 28pm
Sep 4pm
Sep 10 am
Sep 10pm
Sep 16am
Sep 16pm
Bulls Cows/wo ca Cows/ca Cows/twin ca Unk

56
FIGURE 4 Adult moose observed in oat and non-oat habitats within the Bison Range Youth Hunt Management Area during August–September 2003 aerial surveys
0%
20%
40%
60%
80%
100%
Aug 19am
Aug 19pm
Aug 27am
Aug 28pm
Sep 4 pm Sep 10 am
Sep 10pm
Sep 16am
Sep 16pm
NonOats Oats

57
TABLE 1 Delta bison precalving and postcalving population estimates, 1983–2006
Year Spring precalving population
estimate Fall prehunt population
estimate 1983 355a 360 1984 300a 356 1985 285a 378 1986 300a 361 1987 275a 396 1988 337a 426 1989 366a 432 1990 373a 440 1991 378a 484b 1992 384a 482 1993 392a 465 1994 340a 446c 1995 397a 485 1996 375a 496 1997 381a,d 474 1998 349a 414–471 1999 335–393a 434 2000 359a 453 2001 361a 471 2002 373a 476 2003 365a 407 2004 327e 421 2005 332e 402 2006 353a no estimate
a Calculated by subtracting known mortality from previous prehunt population estimate. b Includes 17 domestic bison that escaped and were incorporated into the herd. c Includes 15 domestic bison that escaped and were incorporated into the herd in May 1994. d Includes 6 domestic bison that escaped and were incorporated into the herd in Apr 1997. e Calculated based on maximum number of nonneonatal bison seen during late-Mar through early-May surveys.

58
TABLE 2 Delta bison fall ground composition count data and estimated population size, regulatory years 1992–1993 through 2005–2006
Total Estimated Regulatory Bulls:100 Yrlg bulls: Calves:100 Adults Percent Percent sample prehunt
year Cows 100 Cows Cows % Bulls % Cowsa yrlg bulls calves size population size 1992–1993 87 14 46 31 43 6 20 381 482 1993–1994 67 21 62 20 44 9 27 308 465 1994–1995 70 21 53 24 45 7 24 172 446b 1995–1996 87 22 52 27 42 9 22 231 485 1996–1997 65 13 54 24 46 6 25 279 496c 1997–1998 53 3 47 25 50 2 24 200 474 1998–1999 48 9 53 19 50 5 27 354 414–471 1999–2000 54 8 43 22 51 4 22 270 434 2000–2001 63 18 58 14 48 9 28 272 453 2001–2002 68 11 57 23 45 5 25 278 471 2002–2003 87 19 59 27 41 8 24 229 476 2003–2004 60 26 45 16 49 13 22 266 407 2004–2005 61 10 42 23 51 5 21 251 421 2005–2006 71 20 47 23 46 9 22 321 402
a Includes yearlings and adult cows. b Includes 15 domestic bison that escaped and were incorporated into the herd. c Includes 6 domestic bison that escaped and were incorporated into the herd.

59
TABLE 3 Percenta Delta bull bison with different horn categories based on horn morphology, 1997–2005 Horn Category
Date Yearling Small Medium Large Total Sep 1997 6 45 37 12 49 Sep 1999 19 44 27 10 59 Sep 2000 36 12 25 28 61 Sep 2001 18 26 39 18 78 Sep 2002 23 23 34 20 79 Sep 2003 44 29 17 10 77 Sep 2004 19 22 49 10 69 Sep 2005 29 16 46 10 103
a Percentages may not total 100% due to rounding.

60
TABLE 4 Delta bison harvest and accidental death, regulatory years 1986–1987 through 2005–2006 Hunter harvest Regulatory Reported Estimated Other
year M (%) F (%) Unk (%) Total Unreporteda Illegal Total mortality Total 1986–1987 15 (24) 47 (75) 0 (0) 62 5 0 5 0 67 1987–1988 35 (76) 11 (24) 0 (0) 46 4 0 4 0 50 1988–1989 21 (47) 24 (53) 0 (0) 45 4 0 4 0 49 1989–1990 22 (37) 38 (63) 0 (0) 60 5 0 5 0 65 1990–1991 59 (67)b 27 (31) 0 (0) 86 6 0 6 2 94 1991–1992 50 (54) 43 (46) 0 (0) 93 7 0 7 0 100 1992–1993 62 (65) 33 (34) 1 (1) 96 7 0 7 3 106 1993–1994 51 (47) 58 (53) 0 (0) 109 8 0 8 0 117 1994–1995 20 (53) 18 (47) 0 (0) 38 3 0 3 4 45 1995–1996 60 (57)b 46 (43) 0 (0) 106 8 0 8 0 114 1996–1997 56 (54) 47 (46) 0 (0) 103 8 0 8 6 117 1997–1998 57 (48) 61 (52) 0 (0) 118 9 0 9 8 135 1998–1999 27 (38)b 44 (61)c 1 (1) 72 7 0 7 4 83 1999–2000 30 (45)b 37 (55) 0 (0) 67 7 0 7 3 77 2000–2001 36 (50) 35 (49) 1 (1) 72 7 0 7 0 79 2001–2002 51 (52) 47 (48) 0 (0) 98 9 0 9 0 107 2002–2003 54 (51) 51 (49) 0 (0) 105 9 0 9 0 114 2003–2004 43 (56) 34 (44) 0 (0) 77 9 0 9 0 86 2004–2005 33 (72) 13 (28) 0 (0) 46 5 0 5 2 53 2005–2006 25 (60) 17 (40) 0 (0) 45 5 0 5 2 52 a Estimated wounding loss equal to 7% of the permits issued. b One bull was harvested via the Alaska Wildlife Safeguard raffle. c One cow was harvested via a Governor’s permit.

61
TABLE 5 Reported Delta bison harvest data by permit hunt, regulatory years 1994–1995 through 2005–2006
Hunt/Area
Regulatory year
Permits issued
Percent did not
hunt
Percent
unsuccessful permittees
Percent
successful permittees
Bulls (%)
Cows (%)
Unk (%)
Total harvest
403 1994–1995 20 5 0 95 19 (100) 0 (0) 0 (0) 19 1995–1996 70 6 10 85 58 (97) 2 (3) 0 (0) 60 1996–1997 70 4 9 86 53 (88) 7 (12) 0 (0) 60 1997–1998 60 3 8 88 51 (96) 2 (4) 0 (0) 53 1998–1999 45 2 29 69 26 (84) 4 (13) 1 (3) 31 1999–2000 50 2 34 64 29 (91) 3 (9) 0 (0) 32 2000–2001 50 10 16 74 35 (95) 2 (5) 0 (0) 37 2001–2002 70 1 30 70 47 (96) 2 (4) 0 (0) 49 2002–2003 70 3 23 74 51 (98) 1 (2) 0 (0) 52 2003–2004 70 7 34 59 40 (98) 1 (2) 0 (0) 41 2004–2005 50 10 26 64 32 (100) 0 (0) 0 (0) 32 2005–2006 35 9 22 69 24 (100) 0 (0) 0 (0) 24
404 1994–1995 20 0 5 95 1 (5) 18 (95) 0 (0) 19 1995–1996 50 2 6 92 2 (4) 44 (96) 0 (0) 46 1996–1997 50 0 12 86 3 (7) 40 (93) 0 (0) 43 1997–1998 70 3 4 93 6 (9) 59 (91) 0 (0) 65 1998–1999 55 5 24 71 0 (0) 39 (100) 0 (0) 39 1999–2000 50 6 26 68 0 (0) 34 (100) 0 (0) 34 2000–2001 50 8 20 70 1 (3) 33 (94) 1 (3) 35 2001–2002 60 2 17 82 4 (8) 45 (92) 0 (0) 49 2002–2003 65 3 15 82 3 (6) 50 (94) 0 (0) 53 2003–2004 60 3 37 60 3 (8) 33 (92) 0 (0) 36 2004–2005 25 12 32 56 1 (7) 13 (93) 0 (0) 14 2005–2006 30 0 30 70 3 (14) 18 (86) 0 (0) 21
405 1998–1999 2a,b 0 0 100 1 (50) 1 (50) 0 (0) 2 1999–2000 1a 0 0 100 1 (100) 0 (0) 0 (0) 1 2000–2001 2a,b 0 0 100 2 (100) 0 (0) 0 (0) 2 2001–2002 1a 0 0 100 1 (100) 0 (0) 0 (0) 1

62
Hunt/Area
Regulatory year
Permits issued
Percent did not
hunt
Percent
unsuccessful permittees
Percent
successful permittees
Bulls (%)
Cows (%)
Unk (%)
Total harvest
2002–2003 0 0 0 0 0 (0) 0 (0) 0 (0) 0 2003–2004 1a 0 0 100 0 (0) 1 (100) 0 (0) 1 2004–2005 0 0 0 0 0 (0) 0 (0) 0 (0) 0 2005–2006 0 0 0 0 0 (0) 0 (0) 0 (0) 0
Totals for 1994–1995 40 3 3 95 20 (53) 18 (47) 0 (0) 38 all permit 1995–1996 120 4 8 88 60 (57) 46 (43) 0 (0) 106 hunts 1996–1997 120 3 10 86 56 (54) 47 (46) 0 (0) 103 1997–1998 130 3 6 91 57 (48) 61 (52) 0 (0) 118 1998–1999 102 4 26 71 27 (38) 44 (61) 1 (1) 72 1999–2000 101 4 30 66 30 (45) 37 (55) 0 (0) 67 2000–2001 102 7 18 73 38 (51) 35 (47) 1 (1) 74 2001–2002 131 2 23 75 51 (52) 47 (48) 0 (0) 98 2002–2003 135 4 19 78 54 (51) 51 (49) 0 (0) 105 2003–2004 130 5 36 59 43 (56) 34 (44) 0 (0) 77 2004–2005 75 11 28 61 33 (72) 13 (28) 0 (0) 46 2005–2006 65 5 26 69 27 (60) 18 (40) 0 (0) 45 a One permit was issued for an Alaska Fish and Wildlife Safeguard raffle. b One permit was issued for a Governor’s permit.
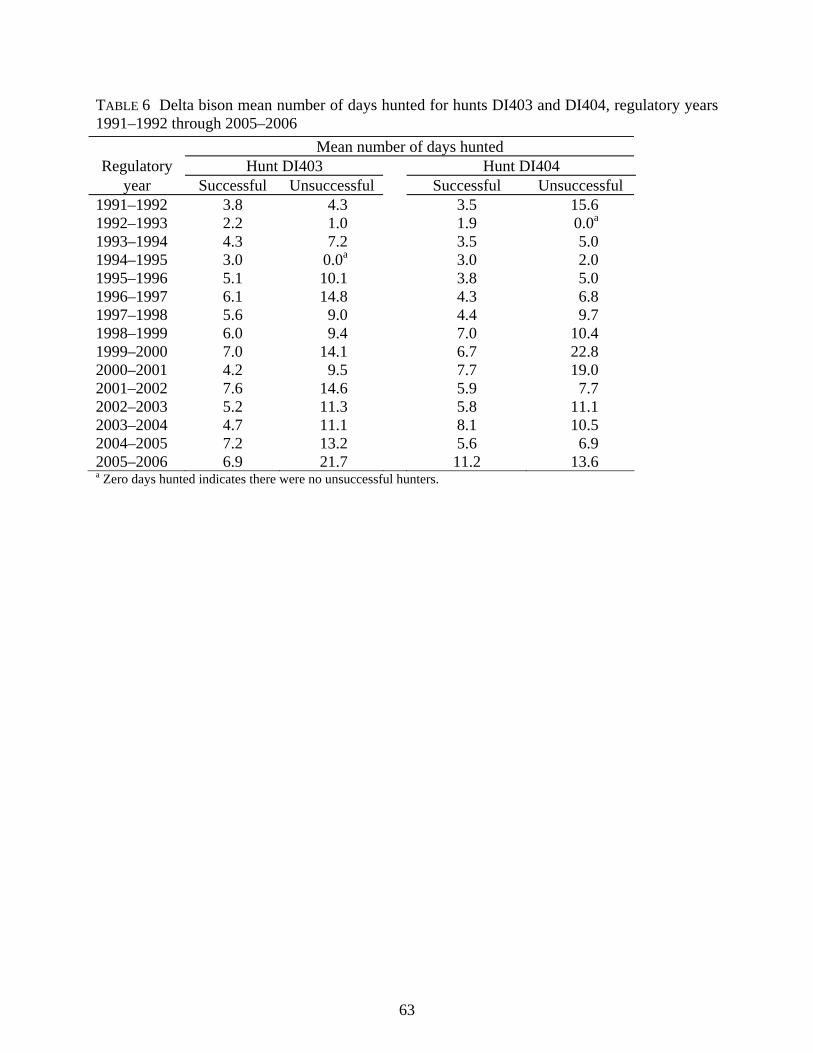
63
TABLE 6 Delta bison mean number of days hunted for hunts DI403 and DI404, regulatory years 1991–1992 through 2005–2006 Mean number of days hunted Regulatory Hunt DI403 Hunt DI404
year Successful Unsuccessful Successful Unsuccessful 1991–1992 3.8 4.3 3.5 15.6 1992–1993 2.2 1.0 1.9 0.0a 1993–1994 4.3 7.2 3.5 5.0 1994–1995 3.0 0.0a 3.0 2.0 1995–1996 5.1 10.1 3.8 5.0 1996–1997 6.1 14.8 4.3 6.8 1997–1998 5.6 9.0 4.4 9.7 1998–1999 6.0 9.4 7.0 10.4 1999–2000 7.0 14.1 6.7 22.8 2000–2001 4.2 9.5 7.7 19.0 2001–2002 7.6 14.6 5.9 7.7 2002–2003 5.2 11.3 5.8 11.1 2003–2004 4.7 11.1 8.1 10.5 2004–2005 7.2 13.2 5.6 6.9 2005–2006 6.9 21.7 11.2 13.6 a Zero days hunted indicates there were no unsuccessful hunters.

64
TABLE 7 Delta bison hunts DI403 and DI404 applications received and permits issued, 1977–2005
Year Applications received Permits issued 1977 2,121 20 1978 3,555 15 1979 3,970 25 1980 4,561 35 1981 5,237 55 1982 8,105 75 1983 7,889 75 1984 11,276 55 1985 666a 55 1986 6,585 65 1987 6,434 50 1988 9,705 50 1989 10,151 65 1990 11,822 90 1991 11,057 100 1992 12,387 100 1993 13,654 120 1994 13,977 40 1995 15,257 120 1996 17,895 120 1997 15,479 130 1998 16,188 100 1999 15,443 100 2000 16,178 100 2001 15,470 130 2002 15,817 135 2003 16,286 130 2004 14,519 75 2005 13,952 65
a 8,931 applications were received before Tier II regulations were implemented and applications were returned.

65
TABLE 8 Delta bison hunter reported residency and success for drawing permit hunts DI403 and DI404, regulatory years 1986–1987 through 2005–2006 Successful Unsuccessful Regulatory
year Locala
resident Nonlocal resident
Nonres
Unk
Total (%)
Locala resident
Nonlocal resident
Nonres
Unk
Total (%)
Total hunters
1986–1987 4 57 0 1 62 (100) 0 0 0 0 0 (0) 62 1987–1988 1 44 0 1 46 (100) 0 0 0 0 0 (0) 46 1988–1989 2 40 1 2 45 (94) 0 3 0 0 3 (6) 48 1989–1990 3 57 0 0 60 (98) 0 1 0 0 1 (2) 61 1990–1991 4 31 0 0 35 (97) 0 3 0 0 3 (3) 38 1991–1992 3 86 2 0 91 (91) 2 7 0 0 9 (9) 100 1992–1993 6 87 1 2 96 (99) 0 1 0 0 1 (1) 97 1993–1994 5 103 1 0 109 (92) 0 9 0 0 9 (8) 118 1994–1995 0 38 0 0 38 (97) 0 1 0 0 1 (3) 39 1995–1996 3 103 0 0 106 (91) 0 10 0 0 10 (9) 116 1996–1997 2 97 1 3 103 (90) 0 11 0 1 12 (10) 115 1997–1998 5 101 12 0 118 (94) 0 6 2 0 8 (6) 126 1998–1999 0 72 0 0 72 (74) 0 25 1 0 26 (27) 98 1999–2000 0 67 0 0 67 (69) 2 27 1 0 30 (31) 97 2000–2001 5 67 0 0 72 (80) 0 18 0 0 18 (20) 90 2001–2002 4 93 1 0 98 (76) 1 30 0 0 31 (24) 129 2002–2003 3 102 0 0 105 (80) 0 24 2 0 26 (20) 131 2003–2004 0 76 1 0 77 (63) 0 46 0 0 46 (37) 123 2004–2005 1 46 0 0 47 (69) 0 21 0 0 21 (31) 68 2005–2006 2 42 0 0 40 (74) 0 14 0 0 14 (26) 56 a Local residents reside in Unit 20D.

66
TABLE 9 Delta bison percent harvestd by month, regulatory years 1994–1995 through 2005–2006 Regulatory Percent harvest by month
year Oct Nov Dec Jan Feb Mar Apr n 1994–1995a 61 11 8 0 5 16 0 38 1995–1996a 42 25 8 5 8 14 0 106
1996–1997a,b 23 34 3 6 11 13 11 103 1997–1998 46 26 6 0 8 14 0 118 1998–1999 45 16 4 1 13 21 0 71 1999–2000c 39 19 2 5 14 14 9 65 2000–2001 55 23 3 1 10 8 0 74 2001–2002 37 24 8 3 10 16 0 98 2002–2003 44 22 5 2 9 19 0 105 2003–2004 31 30 8 4 8 20 0 77 2004–2005 52 15 2 7 13 11 0 46 2005–2006 46 22 5 10 5 12 0 41
a The hunting season opened on 7 Oct versus 1 Oct. b The hunting season was extended by emergency order to include 1–30 Apr 1997. c The hunting season was extended by emergency order to include 1–15 Apr 2000. d Percentages may not total 100% due to rounding.

67
TABLE 10 Delta bison harvest percenta by transport method for Hunts DI403and DI404, regulatory years 1991–1992 through 2005–2006 Harvest percent by transport method Regulatory
year
Airplane Horse/
Dog team
Boat 3- or
4-wheeler
Snowmachine Other ORV
Highway vehicle
Unknown
n
1991–1992 1 0 0 1 14 3 67 14 93 1992–1993 0 0 0 4 49 1 41 5 96 1993–1994 0 2 0 5 24 4 66 0 109 1994–1995 0 0 0 0 39 3 56 0 39 1995–1996 0 0 0 3 16 2 78 0 116 1996–1997 0 0 0 2 13 4 78 3 100 1997–1998 0 0 1 3 33 3 59 2 118 1998–1999 0 0 0 1 19 1 74 4 72 1999–2000 0 0 0 9 33 0 58 0 67 2000–2001 0 0 0 4 11 6 79 0 72 2001–2002 0 0 0 1 13 4 79 2 131 2002–2003 0 0 0 4 0 2 90 4 135 2003–2004 0 0 0 0 22 3 75 0 77 2004–2005 0 0 0 6 18 3 72 0 65 2005–2006 0 0 0 11 6 7 74 2 54 a Percentages may not total 100% due to rounding.

68
TABLE 11 Delta bison harvest percent by kill location during permit hunts DI403 and DI404, regulatory years 1989–1990 through 2005–2006 Regulatory Location of kill
year Delta Agriculture Project Delta Junction Bison Range Other Unknown 1989–1990 95 5 0 0 1990–1991 91 9 0 0 1991–1992 77 23 0 0 1992–1993 78 17 5 0 1993–1994 75 24 1 0 1994–1995 86 14 0 0 1995–1996 68 26 6 0 1996–1997 56 32 12 0 1997–1998 70 21 4 4 1998–1999a 0 1999–2000 51 29 19 2 2000–2001 77 13 10 0 2001–2002 65 25 10 0 2002–2003 78 21 1 0 2003–2004 71 21 8 0 2004–2005 76 11 13 0 2005–2006 63 26 12 0 a Data not available. b Percentages may not total 100% due to rounding.


The Federal Aid in Wildlife Restoration Program consists of funds from a 10% to 11% manufacturer’s excise tax collected from the sales of handguns, sporting rifles, shotguns, ammunition and archery equipment. The Federal Aid program allots funds back to states through a formula based on each state’s geographic area and number of paid hunting license holders. Alaska receives a maximum 5% of revenues collected each year. The Alaska Department of Fish and Game uses federal aid funds to help restore, conserve and manage wild birds and mammals to benefit the public. These funds are also used to educate hunters to develop the skills, knowledge and attitudes for responsible hunting.
Photo by Stephen DuBois, ADF&G